technical group final phase ii report by the cslf task ... · 10/24/2013 · technical group ....
TRANSCRIPT

October 2013
TECHNICAL GROUP
Final Phase II Report by the CSLF Task Force on CO2 Utilization Options
Background At the September 2011 CSLF Ministerial Meeting in Beijing, a Task Force was formed to investigate CO2 Utilization Options. The Task Force mandate was to identify/study the most economically promising CO2 utilization options that have the potential to yield a meaningful, net reduction of CO2 emissions, or facilitate the development and/or deployment of other CCS technologies. A Phase I Report was completed in October 2012. This document is a Phase II Final Report from the Task Force and concludes the Task Force’s activities.

Report Prepared for the CSLF Technical Group
By the CSLF Task Force on Utilization Options of CO2
Task Force Members
Mark Ackiewicz (United States, Chair) Clinton Foster (Australia) Didier Bonijoly (France)
Paul Ramsak (Netherlands) Ahmed Al-Eidan (Saudi Arabia)
Tony Surridge (South Africa) Philip Sharman (United Kingdom)

ACKNOWLEDGEMENTS This report was prepared by participants in the Carbon Capture Utilization and Storage Task Force: Mark Ackiewicz (United States, Chair), Clinton Foster (Australia), Didier Bonijoly (France), Paul Ramsak (Netherlands), Ahmed Al-Eidan (Saudi Arabia), Tony Surridge (South Africa), and Philip Sharman (United Kingdom). Each individual and their respective country has provided the necessary resources to enable the development of this work. The task force members would like to thank the following for their contributions to the report: John Huston and Pradeep Indrakanti of Leonardo Technologies, Inc. (United States), Rob Arts and Filip Neele, TNO, Gerdi Breembroek, NL Agency (The Netherlands); Sibbele Hietkamp, SANEDI (South Africa), Fahad Almuhaish, Saudi Aramco, Jack Lynn, Saudi Aramco (Saudi Arabia), Prof. Peter Styring, CO2Chem and University of Sheffield, and Prof. Colin Hills and Paris Araizi, University of Greenwich (United Kingdom).
ii

EXECUTIVE SUMMARY This document follows the Phase 1 Summary Report, CO2 Utilization Options and provides a more thorough discussion of the most attractive CO2 utilization options based upon economic promise and CO2 reduction potential. This report looks at the current and future economic viability, potential for co-production, and Research, Development and Demonstration (RD&D) needs of these options. The CO2 Utilization Task Force members selected the following options for further investigation: enhanced gas recovery (CO2-EGR), shale gas recovery, shale oil recovery, urea production, algal routes to fuels, utilization in greenhouses, aggregate and secondary construction material production, and CO2-assisted geothermal systems. This work did not include Enhanced Oil Recovery, which is addressed by a separate CSLF Task Force. As identified in the Phase I report, market potential for many of the utilization options is limited (i.e., small, and/or ‘niche’), with some exceptions (e.g., enhanced oil recovery - not a subject of this report - or the conversion of CO2 to fuels or chemicals). However, when taken cumulatively, the sum of these options can provide a number of technological mechanisms to utilize CO2 in a manner that has potential to provide economic benefits for fossil fuel fired power plants or industrial processes. As such, they may well be a means of supporting the early deployment of carbon capture and storage (CCS) in certain circumstances and accelerating deployment. One of the key observations from this report is that the potential uses of CO2 are broad. CO2 has the potential to be used in the extraction of other energy resources, as a working fluid, and as a chemical feedstock. These applications have different levels market potential, and technological maturity. Some applications, such as urea production, already have an existing global market, while other, less-mature options, such as fuels from algae have the potential for significant markets and require additional RD&D to address technical challenges and to validate the utilization of CO2 as an option, by reducing the cost and improvements in efficiency. There are a wide range of CO2 utilization options available, which can serve as additional mechanisms for deployment and commercialization of CCS by providing an economic return for the capture and utilization of CO2. The results offer several recommendations that can assist with the continued development and deployment of non-EOR CO2 utilization options in this context.
1. For technologies which are commercially and technologically mature, such as urea production and utilization in greenhouses, efforts should be on demonstration projects. For urea production, the focus should be on the use of non-traditional feedstocks (such as coal) or ‘polygeneration’ concepts (e.g., those based on integrated gasification combined cycle (IGCC) concepts) which can help facilitate CCS deployment by diversifying the product mix and providing a mechanism for return on investment. For utilization in greenhouses, new and integrated concepts that can couple surplus and demand for CO2 as well as energy, thus optimizing the whole energy and economic system would be valuable.
iii

2. Efforts that are focused on hydrocarbon recovery, such as CO2 for enhanced gas recovery
(via methane displacement), or CO2 utilization as a fracturing fluid, should focus on field tests to validate existing technologies and capabilities, and to understand the dynamics of CO2 interactions in the reservoir. R&D efforts on CO2 as a fracturing fluid should focus on the development of viscosity enhancers that can improve efficiency and optimize the process. Issues such as wellbore construction, monitoring and simulations should leverage those tools and technologies that currently exist in industry or are under development through existing CCS R&D efforts.
3. For algal routes to fuels and aggregate/secondary construction materials production, the
primary focus should be on R&D activities that address the key techno-economic challenges previously identified for these particular utilization options. Independent tests to verify the performance of these products compared to technical requirements and standards should be conducted. Support of small, pilot-scale tests of first generation technologies and designs could help provide initial data on engineering and process challenges of these options.
4. For CO2-assisted geothermal systems, more R&D and studies are necessary to address
the subsurface impacts of utilizing CO2 in this application. Additionally, small pilot-scale tests could provide some initial data on actual operational impacts and key engineering challenges that need to be addressed.
5. Finally, more detailed technical, economic, and environmental analyses should be
conducted to better quantify the potential impacts and economic potential of these technologies and to clarify how R&D could potentially expand the market for these utilization options (e.g., in enhanced gas recovery) and improve the economic and environmental performance of the system. A holistic approach, incorporating several distinct perspectives, is important.
iv

TABLE OF CONTENTS Page
Contents 1. INTRODUCTION ................................................................................................................... 1
1.1 CSLF PURPOSE ................................................................................................................. 1
1.2 TASK FORCE MANDATE, SCOPE, AND OBJECTIVES OF THE REPORT ............... 1
1.3 HISTORY OF CO2 UTILIZATION, INCLUDING PAST AND CURRENT CCUS PROJECTS ..................................................................................................................................... 2
1.4 METRICS OVERVIEW ...................................................................................................... 4
2. HYDROCARBON RESOURCE RECOVERY ...................................................................... 7
2.1 CO2 ENHANCED GAS RECOVERY ............................................................................ 7
2.1.1 Introduction .................................................................................................................. 7
2.1.2 Metrics .......................................................................................................................... 8
2.1.3 Current State of Technology ....................................................................................... 10
2.1.4 Economics of the technology ..................................................................................... 10
2.1.5 Active International Projects, planned projects .......................................................... 11
2.1.6 Regulatory requirements for operations ..................................................................... 13
2.1.7 Technology advancement needs/gaps, RD&D needs ................................................. 13
2.1.8 Co-production due to breakthrough ............................................................................ 13
2.2 Hydrocarbon Recovery by CO2 fracturing: Shale gas recovery .................................... 14
2.2.1 Introduction ................................................................................................................ 14
2.2.2 Metrics ........................................................................................................................ 14
2.2.2.1 Replacement of water based fluids with carbon dioxide during the fracturing process ................................................................................................................................. 14
2.2.2.2 Use of depleted shale formations for CO2 storage .................................................. 15
2.2.3 Current State of Technology ....................................................................................... 15
2.2.4 Economics of the technology ..................................................................................... 17
2.2.5 Active International Projects, planned projects .......................................................... 17
2.2.6 Regulatory requirements for operations ..................................................................... 17
2.2.7 Technology advancement needs/gaps, RD&D needs ................................................. 18
2.2.8 Potential for co-production ......................................................................................... 18
2.3 Hydrocarbon Recovery by CO2 fracturing: Shale Oil Recovery ................................... 19
v

2.3.1 Introduction ................................................................................................................ 19
2.3.2 Metrics ........................................................................................................................ 20
2.3.3 Current State of Technology ....................................................................................... 20
2.3.4 Economics of the technology ..................................................................................... 20
2.3.5 Active International Projects, planned projects .......................................................... 21
2.3.6 Regulatory requirements for operations ..................................................................... 21
2.3.7 Technology advancement needs/gaps, RD&D needs ................................................. 21
2.3.8 Potential for co-production ......................................................................................... 22
3. REUSE (NON-CONSUMPTIVE) APPLICATIONS ........................................................... 23
3.1 UREA ............................................................................................................................. 23
3.1.1 Introduction ................................................................................................................ 23
3.1.2 Metrics ........................................................................................................................ 23
3.1.3 Current State of Technology ....................................................................................... 24
3.1.4 Economics of the technology ..................................................................................... 24
3.1.5 Active International Projects, planned projects .......................................................... 25
3.1.6 Regulatory requirements for operations ..................................................................... 26
3.1.7 Technology advancement needs/gaps, RD&D needs ................................................. 26
3.1.8 Potential for co-production ......................................................................................... 27
3.2 ALGAL FUELS ............................................................................................................. 28
3.2.1 Introduction ................................................................................................................ 28
3.2.2 Metrics ........................................................................................................................ 29
3.2.3 Current State of Technology ....................................................................................... 31
3.2.4 Economics of the technology ..................................................................................... 32
3.2.5 Active International Projects, planned projects .......................................................... 32
3.2.6 Regulatory requirements for operations ..................................................................... 33
3.2.7 Technology advancement needs/gaps, RD&D needs ................................................. 33
3.2.8 Potential for co-production ......................................................................................... 33
3.3 CO2 UTILIZATION IN GREENHOUSES.................................................................... 35
3.3.1 Introduction ................................................................................................................ 35
3.3.2 Metrics ........................................................................................................................ 36
3.3.3 Current State of Technology ....................................................................................... 39
3.3.4 Economics of the technology ..................................................................................... 39
3.3.5 Active International Projects, planned projects .......................................................... 40
3.3.6 Regulatory requirements for operations ..................................................................... 40
vi

3.3.7 Technology advancement needs/gaps, RD&D needs ................................................. 40
3.3.8 Potential for co-production ......................................................................................... 40
4. CONSUMPTIVE APPLICATIONS ..................................................................................... 41
4.1 AGGREGATE, SECONDARY CONSTRUCTION MATERIAL (SCM) ................... 41
4.1.1 Introduction ................................................................................................................ 41
4.1.2 Metrics ........................................................................................................................ 41
4.1.3 Current State of Technology ....................................................................................... 43
4.1.4 Economics of the technology ..................................................................................... 45
4.1.5 Active International Projects, planned projects .......................................................... 45
4.1.6 Regulatory requirements for operations ..................................................................... 46
4.1.7 Technology advancement needs/gaps, RD&D needs ................................................. 46
4.1.8 Potential for co-production ......................................................................................... 47
4.2 CO2-ASSISTED GEOTHERMAL ................................................................................ 48
4.2.1 Introduction ................................................................................................................ 48
4.2.2 Metrics ........................................................................................................................ 51
4.2.3 Current State of Technology ....................................................................................... 51
4.2.4 Economics of the technology ..................................................................................... 53
4.2.5 Active International Projects, planned projects .......................................................... 53
4.2.6 Regulatory requirements for operations ..................................................................... 54
4.2.7 Technology advancement needs/gaps, RD&D needs ................................................. 55
4.2.8 Potential for co-production ......................................................................................... 56
5. SUMMARY AND CONCLUSIONS .................................................................................... 56
5.1 MAIN TECHNICAL CHALLENGES .......................................................................... 56
5.2 RECOMMENDATIONS ............................................................................................... 59
vii
LIST OF FIGURES
Figure 1 The K12-B offshore platform in the North Sea where CO2 is injected into a sandstone formation containing natural gas. Source: www.k12-b.nl. .......................................................... 12 Figure 2: Variations in total water storage from normal, as measured by NASA's Gravity Recovery and Climate Experiment (GRACE) satellites, from January 2003 through December 2009. Reds represent drier conditions, while blues represent wetter ............................................ 19 Figure 3 Tomatoes grown with CO2 from the industrial sources (Shell, Abengoa) and geothermal heat. ............................................................................................................................................... 35 Figure 4. Supply areas of OCAP................................................................................................... 37 Figure 5. World resource map of convective hydrothermal reservoirs Source: IEA, 2011. Note: Convective hydrothermal reservoirs are shown as light grey areas including heat flow and tectonic plate boundaries) ............................................................................................................. 48 Figure 6. Illustration of the different types of geothermal energy systems. ................................. 50
LIST OF TABLES
Table 1 - Metric Summary .............................................................................................................. 6 Table 2: EGR projects worldwide ................................................................................................ 12 Table 3: World Urea Supply/Demand Forecast and Projected CO2 Consumption ...................... 23 Table 4: Estimated area protected horticulture (greenhouses/large tunnels) of vegetables (in 10000 m2) as of 2006 .................................................................................................................... 38 Table 5: Metrics for aggregate production .................................................................................... 42 Table 6: Alkaline industrial residues with potential for carbonation ............................................ 43 Table 7: Assessment of technology availability from published patents/patent families ............. 43
viii

1. INTRODUCTION
1.1 CSLF PURPOSE
The Carbon Sequestration Leadership Forum (CSLF) is a Ministerial-level international climate change initiative that is focused on the development of improved cost-effective technologies for the separation and capture of carbon dioxide (CO2) for its transport and long-term safe storage. The mission of the CSLF is to facilitate the development and deployment of such technologies via collaborative efforts that address key technical, economic, and environmental obstacles. The CSLF will also promote awareness and champion legal, regulatory, financial, and institutional environments conducive to such technologies.
The CSLF comprises a Policy Group and a Technical Group. The Policy Group governs the overall framework and policies of the CSLF, and focuses mainly on policy, legal, regulatory, financial, economic and capacity building issues. The Technical Group reports to the Policy Group and focuses on technical issues related to CCUS and CCUS projects in member countries. The Technical Group has the mandate to identify key technical, economic, environmental and other issues related to the achievement of improved technological capacity, and establish and regularly assess and inventory of the potential areas in need of research. At the CSLF Ministerial meeting held in Beijing, P.R. China in September 2011, the CSLF Charter was amended to, among other things, include CO2 utilization technologies as an important aspect of a CO2 emission reduction strategy, in addition to carbon capture and storage technologies that have been the main focus of CSLF efforts since its inception in 2003.
1.2 TASK FORCE MANDATE, SCOPE, AND OBJECTIVES OF THE REPORT
At the same meeting in Beijing in 2011, the CO2 Utilization Options Task Force was created. The CSLF Technical Group Five-Year Action Plan (2011-2016) included Action Plan #12: CO2 Utilization Options. At the Joint Policy/Technical Meeting, the Five-Year Action Plan was approved, and the formation of a task force to implement Action Plan 12 was proposed. This formalized the CO2 Utilization Options Task Force. The purpose of the CO2 Utilization Options Task Force is to identify/study the most economically promising CO2 utilization options that have the potential to yield a meaningful, net reduction of CO2 emissions, or facilitate the development and/or deployment of other CCS technologies. The United States offered to chair or co-chair the new group. After the Beijing meeting, the United States drafted a planning document that contained a draft charter, which was
1
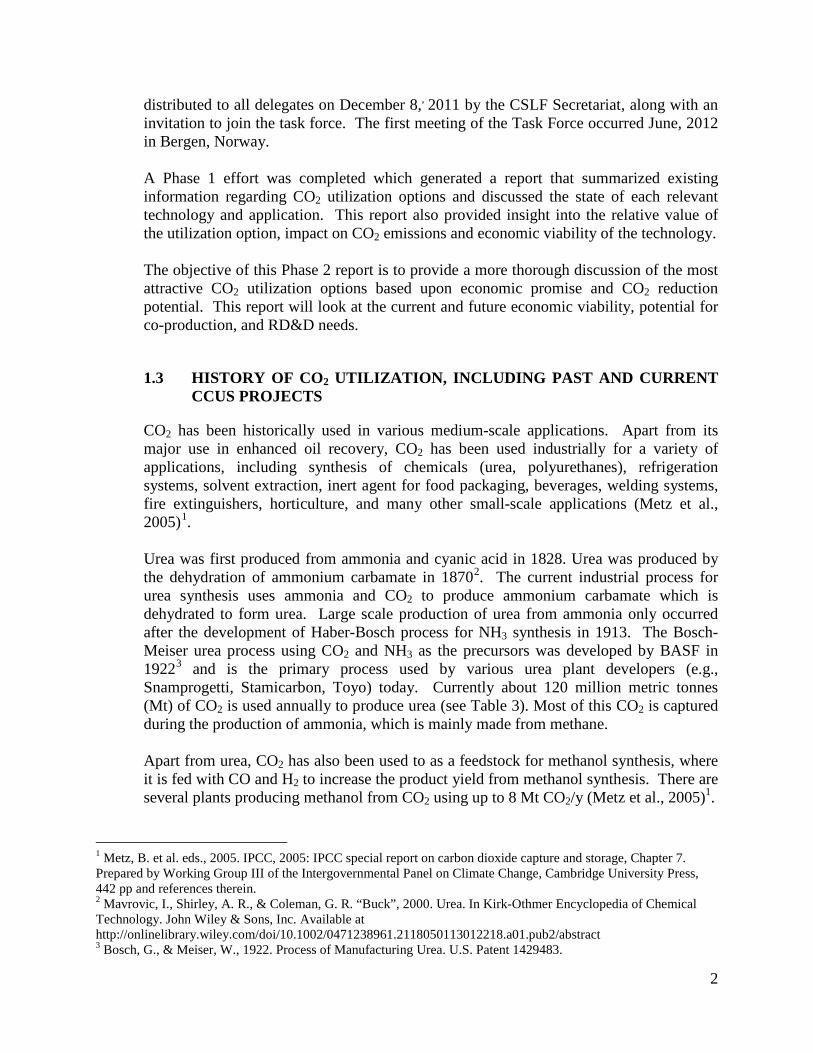
distributed to all delegates on December 8,, 2011 by the CSLF Secretariat, along with an invitation to join the task force. The first meeting of the Task Force occurred June, 2012 in Bergen, Norway. A Phase 1 effort was completed which generated a report that summarized existing information regarding CO2 utilization options and discussed the state of each relevant technology and application. This report also provided insight into the relative value of the utilization option, impact on CO2 emissions and economic viability of the technology. The objective of this Phase 2 report is to provide a more thorough discussion of the most attractive CO2 utilization options based upon economic promise and CO2 reduction potential. This report will look at the current and future economic viability, potential for co-production, and RD&D needs.
1.3 HISTORY OF CO2 UTILIZATION, INCLUDING PAST AND CURRENT CCUS PROJECTS
CO2 has been historically used in various medium-scale applications. Apart from its major use in enhanced oil recovery, CO2 has been used industrially for a variety of applications, including synthesis of chemicals (urea, polyurethanes), refrigeration systems, solvent extraction, inert agent for food packaging, beverages, welding systems, fire extinguishers, horticulture, and many other small-scale applications (Metz et al., 2005)1. Urea was first produced from ammonia and cyanic acid in 1828. Urea was produced by the dehydration of ammonium carbamate in 18702. The current industrial process for urea synthesis uses ammonia and CO2 to produce ammonium carbamate which is dehydrated to form urea. Large scale production of urea from ammonia only occurred after the development of Haber-Bosch process for NH3 synthesis in 1913. The Bosch-Meiser urea process using CO2 and NH3 as the precursors was developed by BASF in 19223 and is the primary process used by various urea plant developers (e.g., Snamprogetti, Stamicarbon, Toyo) today. Currently about 120 million metric tonnes (Mt) of CO2 is used annually to produce urea (see Table 3). Most of this CO2 is captured during the production of ammonia, which is mainly made from methane. Apart from urea, CO2 has also been used to as a feedstock for methanol synthesis, where it is fed with CO and H2 to increase the product yield from methanol synthesis. There are several plants producing methanol from CO2 using up to 8 Mt CO2/y (Metz et al., 2005)1.
1 Metz, B. et al. eds., 2005. IPCC, 2005: IPCC special report on carbon dioxide capture and storage, Chapter 7. Prepared by Working Group III of the Intergovernmental Panel on Climate Change, Cambridge University Press, 442 pp and references therein. 2 Mavrovic, I., Shirley, A. R., & Coleman, G. R. “Buck”, 2000. Urea. In Kirk-Othmer Encyclopedia of Chemical Technology. John Wiley & Sons, Inc. Available at http://onlinelibrary.wiley.com/doi/10.1002/0471238961.2118050113012218.a01.pub2/abstract 3 Bosch, G., & Meiser, W., 1922. Process of Manufacturing Urea. U.S. Patent 1429483.
2

Liquid CO2 is also used as an auxiliary blowing agent (ABA) in the production of flexible, low density, soft polyurethane foams used in furniture, bedding, flooring , and transportation. Polyurethanes are polymers formed by the reaction of isocyanates and polyols. CO2 is used instead of chlorofluorocarbons and hazardous chemicals such as methylene chloride. The advantages of CO2 over methylene chloride as an ABA are that it is less expensive, completely eliminates hazardous air pollutant emissions, and only requires 33 percent as much CO2 as methylene chloride to produce the same amount of ABA-blown foam4. Proprietary technologies for the use of CO2 in polyurethane foam production were developed in the 1990s by Cannon, Hennecke, and Beamech5. These involve pre-mixing the CO2 with the polyol followed by mixing with other components under high pressure, and a controlled pressure let down during the lay down phase. Approximately 10 Mt CO2/y is consumed in the production of polyurethanes6. However, most of the CO2 is eventually re-emitted because ABAs vaporize and expand the foam, and are not consumed in the polyurethane-forming reactions. CO2 can be used as a solvent in various physical states, as a liquid, supercritical fluid, and a gas-expanded liquid. Supercritical CO2 has been used as a green solvent in several applications. The decaffeination of unroasted (green) coffee beans with CO2 was first reported in 19717. Supercritical CO2 is particularly attractive as a solvent and a reaction medium because it has relatively low critical pressure (73.8 bar) and critical temperature (31.1 °C), is non-toxic, non-flammable, relatively inert, and has a lower operating cost. The limitations of supercritical CO2 are lower solubility and higher capital costs compared to liquid organic solvents. Supercritical CO2 can also be used to induce crystallization, and produce fine powders using the rapid expansion of supercritical solution (RESS)8. Liquid CO2 is used commercially in the dry cleaning industry, where it can be used instead of perchloroethylene (PERC), a ground water contaminant and a potential human health hazard. The use of liquid CO2 requires the use of specialized surfactants which can dissolve all types of compounds on soiled fabrics. A combination of solid and gaseous CO2 has been used as an environmentally friendly solution for precision cleaning to remove sub-micron particles and organic thin films from electronics surfaces. These processes were developed in the 1990s9. Gas-expanded liquids (GXLs) with CO2 and an organic solvent were developed to overcome the high pressure limitations of supercritical CO2 and co-solvents. A GXL is a mixture of pure gas and an organic solvent at pressure and temperature conditions below the critical point for the mixture. GXLs are more liquid-like compared to supercritical fluids, and operate at much
4 U.S. Environmental Protection Agency, 1996. Flexible polyurethane foam emission reduction technologies cost analysis, EPA-453/R-95-011. Available at: http://nepis.epa.gov/Exe/ZyPURL.cgi?Dockey=2000HGDO.txt 5 Singh, S.N., 2001. Blowing Agents for Polyurethane Foams, Report 142, Rapra Review Reports, v.12, number 10, 2001. ISSN: 0889-3144. 6 Metz, B. et al. eds., 2005. IPCC, 2005. IPCC special report on carbon dioxide capture and storage, Chapter 7. Prepared by Working Group III of the Intergovernmental Panel on Climate Change, Cambridge University Press, 442pp. 7 Zosel, Kurt, 1977. U.S. Patent 4247570, Process for the decaffeination of coffee. 8 Mistry, Reena, 2008. Characterization and applications of CO2-expanded solvents, Ph.D. Thesis, University of Leicester. 9 Kosic, Thomas, Palser, Jeff, L., 1998. Carbon dioxide meets the challenge of precision cleaning, Solid State Technology, Available at: . http://www.electroiq.com/articles/sst/print/volume-41/issue-5/features/deposition/carbon-dioxide-meets-the-challenge-of-precision-cleaning.html
3

lower pressures. CO2-GXLs offer alternative solvents to carry out industrial hydroformylations and epoxidations with easy product separation and high product selectivity10. The conversion of CO2 to mineral carbonates has been investigated over the past decade (see for example, reference 11). For the most part, techno-economic studies noted that the conversion of minerals such as serpentine and olivine to magnesium and calcium carbonates and bicarbonates is technically feasible, but the costs of conversion are high12. Current research and development is focussed on using industrial caustic wastes such as bauxite waste (red mud) as a reactant to convert CO2. Alcoa currently operates a red mud carbonation demonstration facility at their Kwinana Alumina refinery in Australia based on the carbonation of CO2
13. The conversion of CO2 to fuels using sunlight and microalgae has also been investigated extensively as a part of U.S. DOE's Aquatic Species Program from 1978 to 199614. High costs for algal fuel production were projected at that time. Current research and demonstrations projects are aimed at developing more productive, resistant algal strains, and developing novel algal processing technologies.
1.4 METRICS OVERVIEW
Comparison of the various applications for CO2 recovery, and their relative costs and benefits helps to identify challenges and opportunities for the increased use of CO2. An objective of this task was to develop a list of metrics to evaluate various beneficial use concepts. Performing a comparative or quantitative ranking of these options is a challenge. CO2-use technologies in this document are at varying levels of readiness and not all of the processes can be ranked against all the criteria. That stated, the primary criteria for the relative comparison of various CO2 applications include:
• Total amount of CO2 permanently sequestered
• Unit value (benefit) or cost of application
• Energy consumed by the application, or net-energy saved by implementing this technology ( net-CO2 savings from the technology)
10 Subramaniam, B., Akien, G. R.,2012. Sustainable catalytic reaction engineering with gas-expanded liquids. Current Opinion in Chemical Engineering, v.1, no.3, p:336–341. doi:10.1016/j.coche.2012.02.005 11 O'Connor et al., 2001. Carbon dioxide sequestration by direct mineral carbonation: process mineralogy of feed and products, SME Annual Meeting and Exhibit, Denver, CO, Feb 26-Mar 1, 2001. Available at: http://www.osti.gov/bridge/product.biblio.jsp?osti_id=897114 . 12 O'Connor et al., 2004. Energy and economic considerations for ex-situ and aqueous mineral carbonation, Presented at the 29th International Technical Conference on Coal Utilization & Fuel Systems, April 18-22, 2004, Clearwater, Florida. Available at: http://www.osti.gov/bridge/servlets/purl/895352-R22ohy/ . 13 Global CCS Institute, 2010. "Bauxite residue carbonation", in Accelerating the uptake of CCS: Industrial use of captured carbon dioxide. Available at: http://www.globalccsinstitute.com/publications/accelerating-uptake-ccs-industrial-use-captured-carbon-dioxide/online/28586 . 14 Sheehan, J., Dunahay, T., Benemann, J. and Roessler, P.,1998. A Look Back at the U.S. Department of Energy’s Aquatic Species Program – Biodiesel From Algae, Golden, CO, National Renewable Energy Institute, NREL/TP-580-24190, 328 pp.
4
• Market potential of primary CO2 use and any by-products
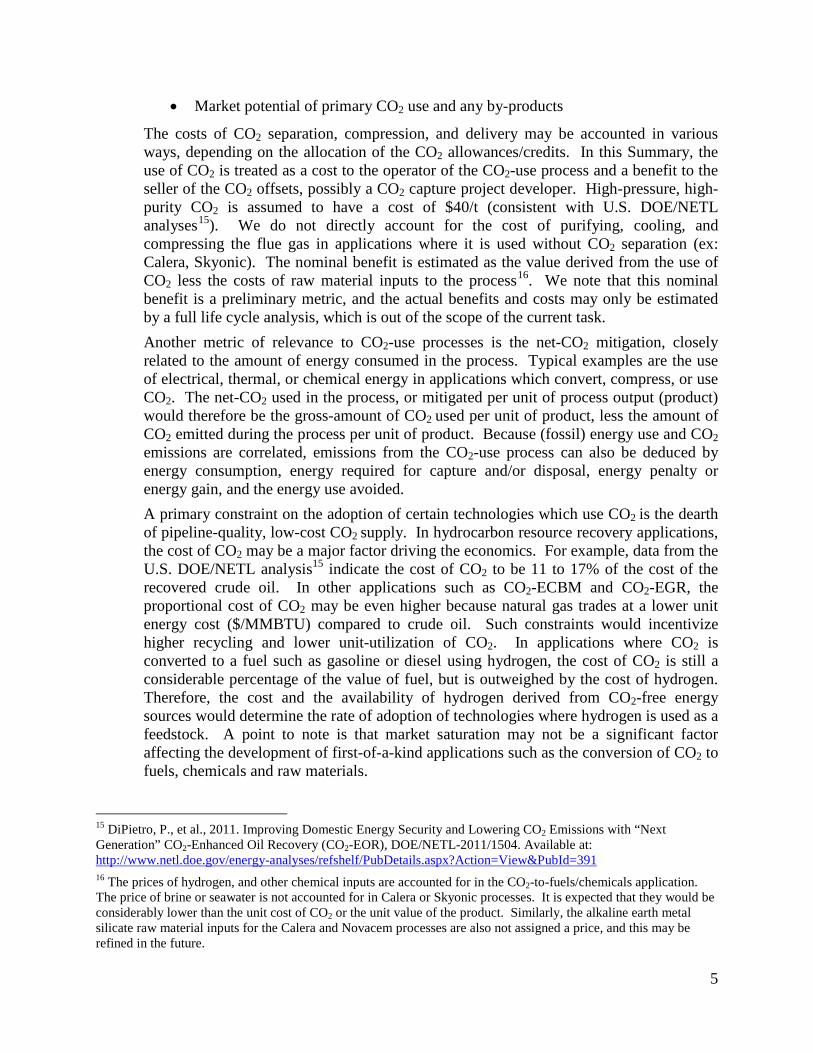
The costs of CO2 separation, compression, and delivery may be accounted in various ways, depending on the allocation of the CO2 allowances/credits. In this Summary, the use of CO2 is treated as a cost to the operator of the CO2-use process and a benefit to the seller of the CO2 offsets, possibly a CO2 capture project developer. High-pressure, high-purity CO2 is assumed to have a cost of $40/t (consistent with U.S. DOE/NETL analyses15). We do not directly account for the cost of purifying, cooling, and compressing the flue gas in applications where it is used without CO2 separation (ex: Calera, Skyonic). The nominal benefit is estimated as the value derived from the use of CO2 less the costs of raw material inputs to the process16. We note that this nominal benefit is a preliminary metric, and the actual benefits and costs may only be estimated by a full life cycle analysis, which is out of the scope of the current task. Another metric of relevance to CO2-use processes is the net-CO2 mitigation, closely related to the amount of energy consumed in the process. Typical examples are the use of electrical, thermal, or chemical energy in applications which convert, compress, or use CO2. The net-CO2 used in the process, or mitigated per unit of process output (product) would therefore be the gross-amount of CO2 used per unit of product, less the amount of CO2 emitted during the process per unit of product. Because (fossil) energy use and CO2 emissions are correlated, emissions from the CO2-use process can also be deduced by energy consumption, energy required for capture and/or disposal, energy penalty or energy gain, and the energy use avoided. A primary constraint on the adoption of certain technologies which use CO2 is the dearth of pipeline-quality, low-cost CO2 supply. In hydrocarbon resource recovery applications, the cost of CO2 may be a major factor driving the economics. For example, data from the U.S. DOE/NETL analysis15 indicate the cost of CO2 to be 11 to 17% of the cost of the recovered crude oil. In other applications such as CO2-ECBM and CO2-EGR, the proportional cost of CO2 may be even higher because natural gas trades at a lower unit energy cost ($/MMBTU) compared to crude oil. Such constraints would incentivize higher recycling and lower unit-utilization of CO2. In applications where CO2 is converted to a fuel such as gasoline or diesel using hydrogen, the cost of CO2 is still a considerable percentage of the value of fuel, but is outweighed by the cost of hydrogen. Therefore, the cost and the availability of hydrogen derived from CO2-free energy sources would determine the rate of adoption of technologies where hydrogen is used as a feedstock. A point to note is that market saturation may not be a significant factor affecting the development of first-of-a-kind applications such as the conversion of CO2 to fuels, chemicals and raw materials.
15 DiPietro, P., et al., 2011. Improving Domestic Energy Security and Lowering CO2 Emissions with “Next Generation” CO2-Enhanced Oil Recovery (CO2-EOR), DOE/NETL-2011/1504. Available at: http://www.netl.doe.gov/energy-analyses/refshelf/PubDetails.aspx?Action=View&PubId=391 16 The prices of hydrogen, and other chemical inputs are accounted for in the CO2-to-fuels/chemicals application. The price of brine or seawater is not accounted for in Calera or Skyonic processes. It is expected that they would be considerably lower than the unit cost of CO2 or the unit value of the product. Similarly, the alkaline earth metal silicate raw material inputs for the Calera and Novacem processes are also not assigned a price, and this may be refined in the future.
5

Table 1 lists the metrics used to consider differences between the applications. Table 1 - Metric Summary
CO2 M
itiga
tion Amount of CO2 reduced (total : direct + indirect)
Amount of Captured CO2 utilized (direct reduction)
Amount of CO2 consumed
Is capture an intrinsic part of the process?
Bene
fits Cost of CO2 reduction/ tonne (total system basis)
Cost of CO2 capture and processing
Value of by-products
Ener
gy
Cons
umpt
ion
Energy penalty/ gain for total system (LCA)
Energy required for capture and disposal
Energy penalty/ gain for byproduct process
Energy use avoided (without chemical transformation of CO2)
Mar
ket
Pote
ntia
l
Market size (potential tonnage removed from atmosphere)
CO2 subjected to capture and storage
CO2 sold to commercial markets for consumption or resource recovery
Market size of by-products
(Nominal Benefit (Negative cost)) x Market size
6

2. HYDROCARBON RESOURCE RECOVERY
2.1 CO2 ENHANCED GAS RECOVERY
2.1.1 Introduction
The aim of CO2-enhanced gas recovery (CO2-EGR) is to mobilize large quantities of natural gas which cannot be recovered by conventional means of production. As a positive side effect, significant volumes of CO2 can be stored. Under current legislation and carbon trading systems, emission credits can probably be claimed for the stored CO2, provided additional measures, such as monitoring and verification, are taken. However, there is no experience yet with such a case and the economics are yet difficult to assess. Gas reservoirs suitable for CO2-EGR include both conventional gas reservoirs (siliciclastic and carbonate reservoirs) and shale-gas reservoirs, albeit that the mechanism for the natural gas recovery is different in both cases. Reservoirs containing high amounts of acid gases (CO2, H2S) may be particularly suitable candidates for injecting CO2, because of the often already existing gas separation infrastructure. Enhanced gas recovery (EGR) is not part of standard operations for gas fields, which, in general, have high recovery factors. In addition to concerns about degrading the quality of the produced gas, this has kept EGR from becoming widespread. The natural recovery factor in oil fields, by contrast, is generally low (typically only 10% during primary production), creating a much clearer potential for production enhancement methods. CO2-EOR is a common technology, with the Texas oil fields and some early fields in Eastern Europe as prime examples. Nevertheless, recent developments do show a market potential for EGR. One commercial project for EGR is currently in preparation in the Netherlands and a second one is being developed in the Middle East. Both projects do not use CO2, but N2. However these projects do demonstrate the potential for EGR in general. In this chapter more details about these two N2-EGR projects are given, and differences with CO2-EGR are highlighted. For CO2-EGR, the only known project, where an actual field test is being carried out, is the K12-B field offshore the Netherlands. Initial findings from this small CO2-EGR pilot project, operational since 2005, are also highlighted. This chapter does not consider shale gas, as this is treated in a separate chapter. Furthermore no special attention is given to tight reservoirs, where often hydraulic fracturing (fraccing) is required, again since fraccing is dealt with in a separate chapter. All fields considered here are supposed to have sufficient permeability to inject and produce gasses without additional measures like fraccing, even though some of these reservoirs do have quite low permeability.
7

2.1.2 Metrics
Feasibility of EGR Injection of a working gas into a gas reservoir pressurizes the existing natural gas, thereby enhancing methane production17. EGR is economical in cases where a significant portion of the original gas in place is yet to be recovered, and where the gas reservoir has considerable vertical extent, allowing the working gas to be injected below the natural gas17. The economics of EGR will be strongly dependent on the size of the reservoir (1% of additionally recovered gas of a large volume will still represent a significant value). Issues that play a role in determining whether a specific field is amenable to EGR include the following:
- Properties of the gas field: The geological properties of the field, such as size and geometry, determine the feasibility of EGR. The permeability of the reservoir and the required number locating injection well(s) are important parameters that drive the economics of the potential project.
- Field characteristics: EGR will have a lower priority for gas fields that have a strong water drive. Such fields are located in active aquifers, which provide pressure support. By contrast, for depletion driven fields, which do not have such pressure support, EGR is a potential end-of-field-life measure.
- Re-use of wells: The economics of an EGR project can benefit from re-using existing installations or wells. Converting existing production or appraisal wells to injectors of the working gas may reduce costs, if their location is favourable for EGR. This may of course still require a work-over of the well, for example changing the tubing to CO2 resistant material.
- Availability of a working gas (N2 or CO2): The location of the field relative to the locations where CO2 or N2 is produced is a relevant parameter. The economics of the project depend on the volumes required.
- Composition of the original gas: At some time during the EGR project, the working gas will reach the production well(s) and is produced along with natural gas. Depending on the specifications of the transport pipeline, a gas separation step is required. There may be an advantage for gas fields with an initially low concentration of the working gas, which may allow a higher percentage of working gas to be co-produced. On the other hand, gas separation units may already be in place to remove excess CO2 or N2 from the produced gas. In any case, breakthrough of CO2 to natural gas producing wells would lead to an increase of the CO2 content of the produced gas, increasing separation costs and eventually making reinjection economically unfeasible18.
- Need for monitoring: The use of CO2 as a working gas opens the opportunity to bring the project under the ETS [EU Emission trade system], if sufficient measures are taken to measure and monitor the injected volume. However, this
17 Benson, S. et al., 2004. GEO-SEQ Best Practices Manual, Geologic Carbon Dioxide Sequestration: From Site Selection to Implementation, 9/30/2004: Lawrence Berkeley National Laboratory. Available at: http://escholarship.org/uc/item/27k6d70j 18 CSLF, 2010. 2010 Carbon Sequestration Leadership Forum Technology Roadmap. Available at: http://www.cslforum.org/publications/documents/CSLF_Techology_Roadmap.pdf [Accessed November 10, 2010].
8

requires additional efforts, which may not be required in the case of N2 (depending on national regulations).
- Re-use of injection facilities: The production site needs to be adapted to process the working gas, such as injector wells. In the case of CO2-EGR, these installations can be re-used after the EGR project, for storing CO2, which will improve the economics of the EGR project. In the case of N2-EGR, such post-EGR use of the installations for CO2 storage requires adaptations of the system and is only possible, if additional MMV measures are taken.
- Location of the field: The feasibility of EGR will strongly depend on the location of the field. The economics will be generally more favourable for onshore fields because of the transport of the working gas.
Considering the above issues, it is clear that the feasibility of EGR is highly field-specific. Given the current lack of large-scale EGR projects (with the exception of the projects mentioned below), and the lack of published feasibility studies, it appears that operators have just started to consider EGR as a viable option. The existence of the two planned N2-EGR projects suggests that for certain fields EGR may be commercially attractive. For CO2-EGR, the (non-)availability of CO2 will play a key role. It is likely that when CO2 is captured and available on a large scale and the ETS price is at a sufficiently high level, operators will take CO2-EGR into account when considering the options for the final phase in the production of their gas fields. The Habshan N2-EGR project in Abu Dhabi proves that the economics can allow for a dedicated air separation unit and a 50-km pipeline. N2-EGR compared to CO2-EGR N2 as a working gas for EGR has definite advantages over CO2:
• N2 is inert, meaning it is not reactive with other substances or with the reservoir rock.
• N2 is non-corrosive, not posing heavy constraints on the injection and production system.
• N2 can be easily captured from air at any location. • N2 is already often added to natural gas, to adjust the caloric value of the gas for
households. • In contrast with CO2, N2 does not exhibit phase transitions in the pressure and
temperature envelope of operations, resulting in lower complexity of the processing equipment and lower cost of compression.
However, the potential combination of CO2-EGR combined with storage of CO2 can potentially outweigh these advantages and make the option economically attractive. In the current market with low-CO2 ETS prices this potential is difficult to assess. CO2-EGR: potential for CO2 storage in depleted gas fields While the role of CO2-EOR in the development of CCS has been the subject of a large number of studies, the potential of CO2-EGR has not been investigated in depth. The potential for CO2 storage in conventional gas reservoirs and regional organic-rich shales
9
in the U.S. has been estimated by IEA GHG, NETL and Kentucky Geological Survey (KGS). Recent IEA GHG studies indicate a global capacity of 160 to 390 giga tonnes (Gt) CO2
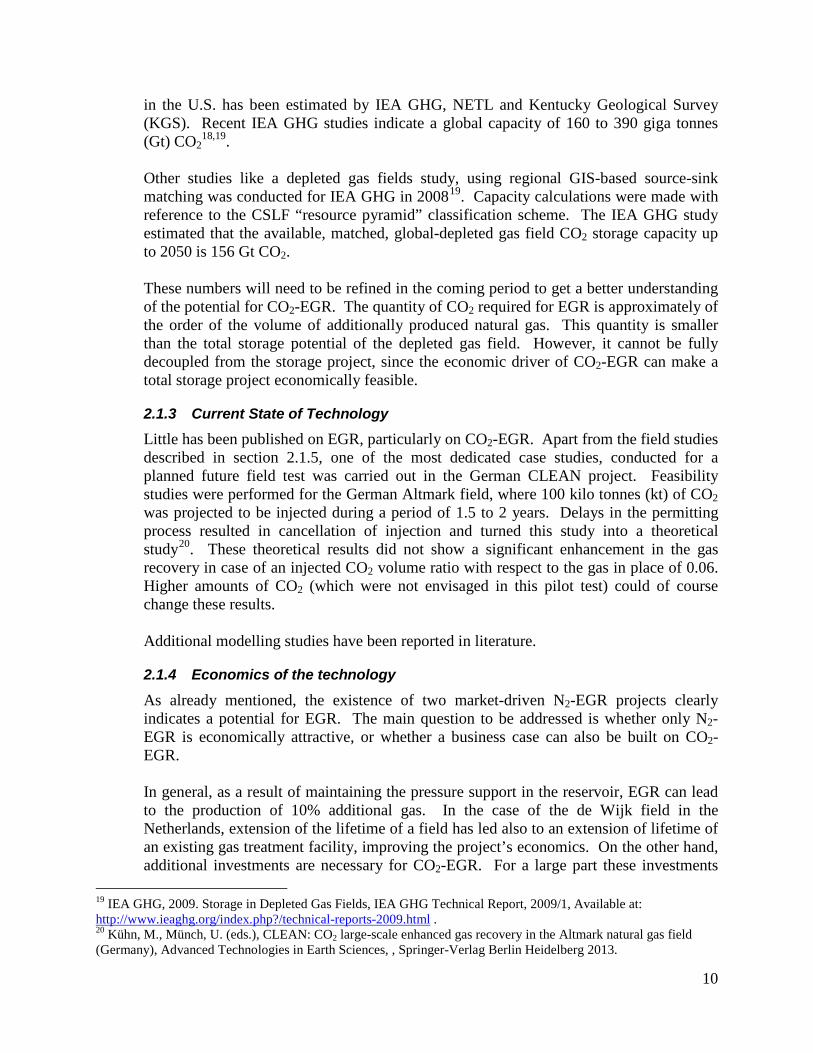
18,19. Other studies like a depleted gas fields study, using regional GIS-based source-sink matching was conducted for IEA GHG in 200819. Capacity calculations were made with reference to the CSLF “resource pyramid” classification scheme. The IEA GHG study estimated that the available, matched, global-depleted gas field CO2 storage capacity up to 2050 is 156 Gt CO2. These numbers will need to be refined in the coming period to get a better understanding of the potential for CO2-EGR. The quantity of CO2 required for EGR is approximately of the order of the volume of additionally produced natural gas. This quantity is smaller than the total storage potential of the depleted gas field. However, it cannot be fully decoupled from the storage project, since the economic driver of CO2-EGR can make a total storage project economically feasible.
2.1.3 Current State of Technology
Little has been published on EGR, particularly on CO2-EGR. Apart from the field studies described in section 2.1.5, one of the most dedicated case studies, conducted for a planned future field test was carried out in the German CLEAN project. Feasibility studies were performed for the German Altmark field, where 100 kilo tonnes (kt) of CO2 was projected to be injected during a period of 1.5 to 2 years. Delays in the permitting process resulted in cancellation of injection and turned this study into a theoretical study20. These theoretical results did not show a significant enhancement in the gas recovery in case of an injected CO2 volume ratio with respect to the gas in place of 0.06. Higher amounts of CO2 (which were not envisaged in this pilot test) could of course change these results. Additional modelling studies have been reported in literature.
2.1.4 Economics of the technology
As already mentioned, the existence of two market-driven N2-EGR projects clearly indicates a potential for EGR. The main question to be addressed is whether only N2-EGR is economically attractive, or whether a business case can also be built on CO2-EGR. In general, as a result of maintaining the pressure support in the reservoir, EGR can lead to the production of 10% additional gas. In the case of the de Wijk field in the Netherlands, extension of the lifetime of a field has led also to an extension of lifetime of an existing gas treatment facility, improving the project’s economics. On the other hand, additional investments are necessary for CO2-EGR. For a large part these investments
19 IEA GHG, 2009. Storage in Depleted Gas Fields, IEA GHG Technical Report, 2009/1, Available at: http://www.ieaghg.org/index.php?/technical-reports-2009.html . 20 Kühn, M., Münch, U. (eds.), CLEAN: CO2 large-scale enhanced gas recovery in the Altmark natural gas field (Germany), Advanced Technologies in Earth Sciences, , Springer-Verlag Berlin Heidelberg 2013.
10

are similar for N2 and CO2, on the assumption that CO2 will be more readily available in the near future. An important difference is the inert and non-corrosive character of N2 compared to CO2. However, many gas fields already contain CO2, for which measures have been taken. Nevertheless, additional costs cannot be excluded. The main difference between CO2-EGR and N2-EGR is that after the EGR process the facilities can be used directly for CO2 storage, which can improve the business case through CO2 credits and/or subsidies. At this moment, no clear numbers can be provided yet due to the lack of experience with this technology. This needs to be further explored.
2.1.5 Active International Projects, planned projects
EGR is currently envisaged / performed at three locations, two of which use N2 as the working gas, one uses CO2. K12-B - pilot project At K12-B (Figure 1), an offshore site in the Dutch part of the North Sea, CO2 is being injected at low rates (about 80 kt CO2 injected over 8 years) in an almost depleted gasfield. The lifetime of this site has been extended by the injection of CO2. The CO2-EGR has been evaluated since 2005 by comparing actual tail-end gas production with forecasted gas production in case of no CO2 injection. Because of the relatively small amount of CO2 injected, no firm conclusions can be drawn on the EGR potential. Vandeweijer et al. note that the volume ratio between injected CO2 and remaining gas in place is currently only in the order of 0.0521. Modelling studies do show a potential however, and with injection still ongoing, hopefully more definite conclusions can be drawn in the near future. Breakthrough at K12-B of the injected CO2 at the producing wells has been studied extensively making use of tracers. Results as described in Vandeweijer et al.21 show results in line with expectations with a tendency towards “fast breakthrough” of the tracers. The latter is most likely caused by the type of tracers used, and currently research towards new tracers, better mimicking the CO2 behaviour in the reservoir, is ongoing (as described in the paragraph technology advances). De Wijk – project Most of the gas fields in The Netherlands will be decommissioned before 2025, with many fields entering the last few years of production in the next 5 years. This has led NAM, the operator of a large number of gas fields, to consider end-of-field-life options. N2-based EGR has been selected to prolong the production lifetime of one of the onshore gas fields, de Wijk, by ten to fifteen years. An additional 2 bcm (billion cubic meters) is expected to be produced; this is an increase in the recovery factor by about 10%. Installations (air separation unit, pipelines) and wells are currently being prepared and injection is planned to start in 201322.
21 Vandeweijer V.P., Van der Meer L.G.H., Hofstee, C., D’Hoore, D., and Mulders, F., 2009. CO2 Storage and Enhanced Gas Recovery at K12-B, 71st EAGE Conference & Exhibition, Amsterdam. 22 See http://www.nam.nl/nl/projects/natural-gas-de-wolden.html (in Dutch).
11

Figure 1 The K12-B offshore platform in the North Sea where CO2 is injected into a sandstone formation containing natural gas. Source: www.k12-b.nl.
Table 2: EGR projects worldwide
Project Features Purpose Injection Rate K12-B:
Offshore gas field, North Sea,
Netherlands (on going)
CO2 separated from natural gas (13% CO2) from a nearly-depleted gas reservoir and injected into the same reservoir at a depth of nearly
4,000 m
Storage, EGR ~ 40 TPD
De Wijk: Onshore gas field, The Netherlands
(planned)
N2 from air separation plants is injected down-dip in gas bearing layer, at depths between 500 and
1,500 m
EGR
Air separation units capacity:
500,000 – 700,000 m3/day
(12,000 – 30,000 m3/h)
Habshan field Onshore oil and gas
field, Abu Dhabi (planned)
N2 from air separation units; 50 km pipeline to Habshan fields
EGR, EOR
Air separation units capacity:
670,000 m3/h
Habshan – large-scale EGR and EOR Currently, a project is planned in Abu Dhabi in the Habshan field, where N2 from an air separation plant is transported over 50 km and injected for EGR. The volume of N2 produced at the separation plants is 670,000 m3/h; this volume is used for both EGR and EOR. For CO2, the volume would be equivalent to almost 12 million tonnes (Mt)/y. N2 injection is planned to start in 2014.
12

2.1.6 Regulatory requirements for operations
The EU storage directive is the foundation for all regulatory requirements concerning a CO2 storage site within the EU. When appropriate measures, such as monitoring and verification of safe and secure storage are taken, CO2-EGR can fall under the Storage Directive. In terms of the ETS system, the CO2 flow rates in the injected and produced gas streams would need to be monitored and reported accurately. Currently, there is no experience with such a project in the EU. There is no specific legislation in place for N2-EGR in the de Wijk field. The permit application is treated under the existing mining regulations, considering the inertness and safety of the injected N2. In the case of CO2-EGR in the K12-B field, it must be noted that the EU storage directive does not apply because it involves re-injecting CO2 being produced by the same reservoir. It falls under existing mining regulations.
2.1.7 Technology advancement needs/gaps, RD&D needs
CO2-EGR is still an area that has been less explored and requires several pilot projects such as K12-B, to better understand the mechanisms and the effectiveness. Some of the issues that require additional study are:
• The economic potential for CO2-EGR needs to be further evaluated. There is currently insufficient experience in this technology to properly assess its economic potential.
• Retarding the flow of the injected CO2, with respect to the flow of the natural gas has a direct impact on the potential breakthrough of the CO2 at the gas production wells. Novel technologies which monitor the retardation of CO2 flow in the subsurface relative to natural gas (e.g. tracers) should be developed.
• Another issue is the thermal impact of liquid, relatively cold CO2, when injected in warm, low-pressure reservoirs. The possible phase changes combined with thermal stresses on the well and reservoir creates large uncertainties on safety and security of storage.
• More research is required to optimize the use of CO2 in tight reservoirs, including for shale gas applications (discussed in a separate chapter).
• Techniques to monitor CO2 migration and well integrity during– and after-injection should be developed.
• Finally, monitoring techniques for the (near-well) injection processes, including thermal fraccing, should be developed and tested.
2.1.8 Co-production due to breakthrough It is obvious, that the working gas (N2 or CO2) at a certain moment will be co-produced with the methane gas. The main issue will be to delay this breakthrough as much as possible, while still maximising the EGR potential. In case the produced working gas
13

reaches too high concentrations, it will have to be separated from the gas and either re-injected (CO2) or vented (N2).
2.2 Hydrocarbon Recovery by CO2 fracturing: Shale gas recovery
2.2.1 Introduction
Shale gas requires enhanced well stimulation processes in order to achieve a commercially-viable yield of gas. In the United States shale gas is successfully exploited using fracturing technology whereby the main components used are water and a range of chemicals in small concentrations. In principle some or all the water can be replaced by carbon dioxide in its liquid or supercritical phase. Conversely, the carbon dioxide can replace methane in the shale formation thereby enhancing the release of methane and sequestering carbon dioxide in the shale formation (Enhanced Gas Recovery) in a similar way as carbon dioxide is used for EOR (Enhanced Oil Recovery).
In this section of the report the potential for using carbon dioxide for shale gas recovery and storage has been assessed according to the current state of the technology, the economics, regulatory issues, gaps identification etc.
2.2.2 Metrics
In the context of shale gas reservoirs, CO2 can be used to replace water-based fluids during gas well drilling and completion, can enhance gas recovery (EGR), and can also be stored in gas reservoirs. CO2-EGR was discussed in section 2.1 and therefore only the remaining two technologies were discussed in this section. The three technologies (CO2-fraccing, EGR, storage) are not commercial and therefore all estimates in this section are based on research outcomes and assumptions. These technologies can either be used by themselves or in combination with one or two of the other technologies.
2.2.2.1 Replacement of water based fluids with carbon dioxide during the fracturing process
Currently water is used for the fracturing of shale formations in order to commercially extract methane gas. The drilling and hydraulic fracturing of a horizontal shale gas well requires approximately 3.5 million gallons (~13,250 m3) of water23. It is assumed that the same volume of liquid or supercritical carbon dioxide (7,950 t CO2
24 for an average
well) is needed to achieve the required fracturing. Water for these applications is sourced from surface water bodies, ground water, and re-used produced water. Most of the producing shale gas basins in the U.S. are located in areas with moderate- to high-levels of annual precipitation. However, other competing regional water demands (e.g., agriculture), and seasonal variations in precipitation may favor the use of CO2 instead of water for hydraulic fracturing. Similarly, the use of fraccing fluids containing CO2 may improve public perception of fraccing elsewhere globally.
23 www.naturalgas.org 24 3.5 million gallon (13.25 million litres) carbon dioxide at a density of about 0.6 kg/litre amounts to 7950 tonnes of carbon dioxide for the average well.
14

Although up to 8000 t of CO2 can be used for fracturing, it is anticipated that a large percentage of the carbon dioxide will be recycled. There is insufficient information available at this stage to make an estimate of this percentage.
2.2.2.2 Use of depleted shale formations for CO2 storage
Depleted shale formations could also be used to store CO2. CO2 storage in saline reservoirs is only considered at depths exceeding 800 meters in order to ensure that the hydrostatic pressure is sufficient to keep carbon dioxide in a dense phase (supercritical phase). However in shale formations where there is carbon containing material, it is expected that the carbon dioxide will be adsorbed onto this material and the minimum depth requirement of 800 meters does not apply. Nuttall et all25 calculated that at a constant pressure of 400 psia (2.76 MPa), the CO2 adsorption capacity of Devonian black shales of Kentucky varied from 14 to 136 scf/ton of shale with a median value of 40 scf/ton (1.18 Nm3/tonne of shale26). In this reservoir setting, injection zones (shale) deeper than 1000 ft (300 m) and having a thickness exceeding 100 ft (30 m) were considered suitable for CO2 storage27. It must be noted that these calculations were done for a specific reservoir (Devonian black shale formation in Kentucky) and therefore are used only as an example.
2.2.3 Current State of Technology
Laboratory studies have been conducted to gain understanding on the adsorption of CO2 on organic rich shale formations28. The results show that CO2 adsorbs preferentially to such shale formations compared with methane and therefore its storage in shale formations is likely to be possible and may prove to be a mechanism for EGR. However these processes have not been demonstrated in situ. More advanced studies and simulations27 have been conducted using actual reservoir data such as advanced well log data, rotary sidewall cores, shale rock properties analyses, adsorption isotherms and production data to construct geophysical reservoir models that included the effects of parameters including porosity and permeability. The models were used to investigate CO2 injection in the shale gas reservoir and to help design a pilot injection project. Due to the extremely low permeability of the shale formation (in the order of nanodarcys [nD]) actual injection of carbon dioxide in this type of formation remains a challenge27. The three technologies relevant to the use of carbon dioxide as mentioned in the previous section can be applied individually but can also be used as combination of two or all three
25 Nuttall, B.C., Drahovzal, J.A., Eble, C.F., and Bustin, R.M., 2006. Analysis of the Devonian Black Shale in Kentucky for potential carbon dioxide sequestration and enhanced natural gas production, Final Report: Kentucky Geological Survey. Available at: http://www.uky.edu/KGS/emsweb/devsh/final_report.pdf. 26 1 scf = 0.026853 normal cubic meter (Nm3) and 1 US short ton = 907 kg 27 Nuttall, B.C., Kentucky Geological Survey, 2010. MRCSP Phase II- Reassessment of CO2 Sequestration Capacity and Enhanced Gas Recovery Potential of Middle and Upper Devonian Black Shales in the Appalachian Basin. Available at: http://www.netl.doe.gov/technologies/carbon_seq/infrastructure/rcsp/mrcsp/topical_4_black_shale.pdf 28 Busch, A., Alles, S., Gensterblum, Y., Prinz, D., Dewhurst, D.N., Raven, M.D., Stanjek, H., and Krooss, B.M., 2008. Carbon dioxide storage potential of shales: International Journal of Greenhouse Gas Control, v. 2, no. 3, p. 297-308.
15

options. Decisions on what combination to choose will be based on technical and financial criteria. A few aspects of each technology are listed below: • The use of carbon dioxide as a fracking liquid.
The concept of fracturing with 100% CO2 as the fracturing fluid and proppant carrying fluid was first introduced in the early 80’s29,30,31,32,33. The method was pioneered by a Canadian service company called Fracmaster who performed fracture stimulations on thousands of wells in Canada via CO2 sand fracturing (100% CO2 and proppant) with great success. The fracturing mechanics with CO2 and proppant would not be any different than the conventional water based hydraulic fluid. However, there are a few differences both in the hardware and fluid design; the primary one is the use of high pressure closed-system blending vessel to mix the proppant in the CO2 fluid. As far as fluid design goes, the proppant concentration and size must be lower than the conventional water based fracturing due to the low carrying capacity of CO2. The low-carrying capacity of “energized” fluids (e.g, CO2) is offset by gains in productivityby eliminating water blockage, enhanced proppant clean-up, and shortened flow back times. There is also evidence of higher ultimate recovery of hydrocarbon from CO2 fracced wells34,35.
The use of carbon dioxide for enhanced gas recovery:
During the exploitation of the well it is expected that “breakthrough” of CO2 will occur at some time and a mixture of methane (CH4) and CO2, with a gradually increasing percentage of CO2, will be produced. It is expected that a gas separation unit, similar to the unit that used for removing acid gases from natural gas (e.g. Sleipner off shore of Norway) would be required. The recycled carbon dioxide would be reused. During the enhanced gas recovery process, a considerable amount of carbon dioxide would be sequestered in the shale formation.
The use of depleted shale formations for the storage of CO2:
Once the shale formation has been depleted of gas the formation may be used for the storage of CO2. The capacity for storage is site-specific and detailed geophysical site models are required to estimate the storage potential. To claim carbon credits for the
29 Greenhorn, R., and Li, E., 1985, Investigation of high-phase volume liquid-CO2 fracturing fluids, Paper no. 85-36-34, presented at the 36th Annual Technical meeting of the Petroleum society of CIM, June 2. 30 Lancaster, G., Barrientos, C., Li, E., and Greenhorn, R., 1987. High-phase- volume liquid-CO2 fracturing fluids, Paper no. 87-38-71, presented at the 38th Annual Technical meeting of the Petroleum society of CIM, Calgary, June-7-10, 1987. 31 Lillies, A.T, and Steven R. King, 1982. Sand fracturing with liquid-carbon dioxide, SPE 11341, presented at the 1982 Production Technology Symposium, Hobbs, New Mexico, November 8-9, 1982. 32 Holtmayer, M.D., Harris, P.C. and Hunt, C.V., 1985. Fracturing method for stimulation of wells utilizing carbon dioxide based fluids, U.S. Patent 4,519,455. 33 Luk, S., Apshkrum, M., 1996. Economic optimization of liquid-CO2 fracturing. SPE 35601, Proceedings of the 1996 Gas Technology Symposium, Calgary, Canada. 34 Yost, A.B., Mazza, R.L., Gehr, J.B., 1993. CO2/sand fracturing in Devonian shales. SPE-26925, 1993 Eastern Regional Conference& Exhibition, Pittsburgh, PA, U.S.A., 2-4 November. 35 Ribeiro L. H., Sharma, M.M., 2013. Fluid selection for energized fracture treatments, SPE 163867, Hydraulic Fracturing Technology Conference, The Woodlands, Texas, USA, 4-6 February.
16

storage of carbon dioxide the appropriate protocols, which include accurate monitoring of the injected CO2, monitoring the horizontal and vertical migration of the stored CO2, monitoring for possible leakage, verification by an independent party, need to be followed 36
.
2.2.4 Economics of the technology
Currently gas prices, particularly in the USA, are extremely low (around $3/thousand ft3 [Mcf])37, and the price for carbon dioxide under CDM and CERs is also very low38. Furthermore the cost for drilling rigs and other equipment used for gas exploitation from shale formations is high due to the large demand. Together these factors make current economics for carbon dioxide supported shale gas recovery unattractive. In the longer term developments may become more favourable particularly if the use of CO2 can prolong the production of gas from a specific well thereby increasing the productive life of a specific gas well via pressure support. This would mean that fewer boreholes are required to produce a specific amount of gas thereby reducing cost for drilling. More research is required to understand the dynamics and cost implications of such scenarios.
2.2.5 Active International Projects, planned projects
Currently CO2 is not used commercially for EGR, fracturing or storage in depleted shale gas formations and the technologies are researched in laboratories. Pilot projects have not been planned until now.
2.2.6 Regulatory requirements for operations
The use of carbon dioxide for supported shale gas recovery and storage requires regulation covering:
• CO2 handling, transport and injection: These processes are also required for the use of CO2 for EOR and it is likely that the same legislation does apply.
• CO2 sequestration in the appropriate shale formations: There are significant similarities between the sequestration of CO2 in shale formations and the storage of CO2 in e.g. deep saline formations or exhausted gas and oil fields and it is likely that the same legislations would largely apply. There are some technical differences e.g. the depth of the geological formations and therefore some legislation may be different.
36 2006 IPCC GHG Inventory Guidelines – Provides guidelines for accounting for CCS. These are not yet approved but developed countries are obliged to use them. 37 EIA US Energy Information Administration 38 Clark, P., 2012, October 2. UN-led carbon market close to collapse, Financial Times.
17

• Shale gas extraction enhanced by CO2: Extraction of shale gas enhanced by carbon dioxide is very similar to current shale gas extraction and it is likely that the same legislation will apply.
Overall it appears that existing legislation in some countries will largely address the use of CO2 as support for shale gas recovery. However it is recommended that a review of this legislation is carried out in order to ensure that all aspects are covered. In other countries where currently no natural gas exploitation and carbon storage is pursued, new legislation will be required.
2.2.7 Technology advancement needs/gaps, RD&D needs
From section 2.2.3 although carbon has a strong affinity for organic rich shale formations and that it can replace methane in such formations, actual injection of CO2 in such formations is challenging due to the low permeability of the shale formations. Therefore permeability enhancement is a requirement for the commercialisation of enhanced gas recovery from shale formations. Such permeability enhancement has already been demonstrated on a large scale by the commercial extraction of gas from shale formations and research into a combination of known fracturing technologies with the injection of CO2 (e.g., Ishida et al.39). Compared to water injection, CO2-fracturing occurred in a larger area, and the pattern was more three dimensional. Furthermore the breakdown pressure for supercritical- and liquid-CO2 was expected to be considerably lower than for water. The low viscosity of liquid- and supercritical-carbon dioxide (compared with water) are thought to cause these differences. Further development of downhole monitoring techniques such as controlled source electromagnetic surveys, cable-less sensors for downhole corrosion measurement and temperature measurements will improve the understanding of carbon dioxide injection in shale formations.
2.2.8 Potential for co-production
If the laboratory results obtained by Ishida et al39 can be confirmed by other laboratories and at a larger scale, then the commercially viability of using carbon dioxide for enhanced gas recovery could become attractive. As carbon dioxide is already widely used for enhanced oil recovery, it is likely that this technology also may become attractive for co-production of oil and gas.
39 Ishida, T., Aoyagi, K., Niwa, T., Chen, Y., Murata, S., Chen, Q., & Nakayama, Y., 2012. Acoustic emission monitoring of hydraulic fracturing laboratory experiment with supercritical and liquid CO2. Geophysical Research Letters, v.39, no.16. doi:10.1029/2012GL052788.
18
2.3 Hydrocarbon Recovery by CO2 fracturing: Shale Oil Recovery
2.3.1 Introduction
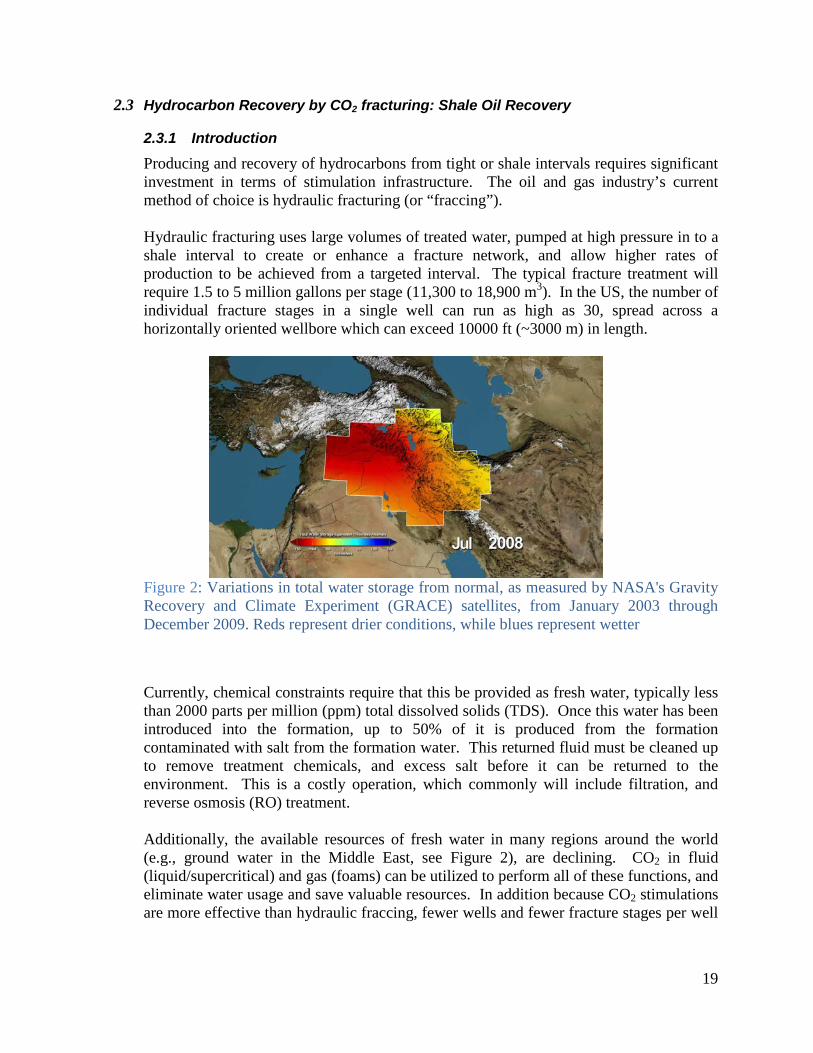
Producing and recovery of hydrocarbons from tight or shale intervals requires significant investment in terms of stimulation infrastructure. The oil and gas industry’s current method of choice is hydraulic fracturing (or “fraccing”). Hydraulic fracturing uses large volumes of treated water, pumped at high pressure in to a shale interval to create or enhance a fracture network, and allow higher rates of production to be achieved from a targeted interval. The typical fracture treatment will require 1.5 to 5 million gallons per stage (11,300 to 18,900 m3). In the US, the number of individual fracture stages in a single well can run as high as 30, spread across a horizontally oriented wellbore which can exceed 10000 ft (~3000 m) in length.
Figure 2: Variations in total water storage from normal, as measured by NASA's Gravity Recovery and Climate Experiment (GRACE) satellites, from January 2003 through December 2009. Reds represent drier conditions, while blues represent wetter
Currently, chemical constraints require that this be provided as fresh water, typically less than 2000 parts per million (ppm) total dissolved solids (TDS). Once this water has been introduced into the formation, up to 50% of it is produced from the formation contaminated with salt from the formation water. This returned fluid must be cleaned up to remove treatment chemicals, and excess salt before it can be returned to the environment. This is a costly operation, which commonly will include filtration, and reverse osmosis (RO) treatment. Additionally, the available resources of fresh water in many regions around the world (e.g., ground water in the Middle East, see Figure 2), are declining. CO2 in fluid (liquid/supercritical) and gas (foams) can be utilized to perform all of these functions, and eliminate water usage and save valuable resources. In addition because CO2 stimulations are more effective than hydraulic fraccing, fewer wells and fewer fracture stages per well
19

are needed to meet a specific production goal. In addition, wells can be suitably configured to be flowed back to allow re-capture of the CO2.
2.3.2 Metrics
As mentioned in section 2.3.4, approximately 480 to 2200 short tons of CO2 could be used per well. The exact overall quantity of CO2 used would depend on its availability and overcoming logistics, mechanical completion, and chemical challenges.
2.3.3 Current State of Technology
Typically CO2 fracturing programs are applied to reservoirs between 3000 to 10000 ft (~1000 to 3000 m) deep, at temperatures less than 250 °F (121 °C). They are also commonly targeted at depleted reservoirs where treatment pressures and fracture gradients are lower. These parameters are consistent with a large proportion (~90%) of current shale oil/gas plays in the world. The concept of fracturing with 100% CO2 as the fracturing fluid and proppant carrying fluid was first introduced in the early 80’s29,30,31,32,33,34. The method was pioneered by a Canadian service company called Fracmaster who performed fracture stimulations on thousands of wells in Canada via CO2 sand fracturing (100% CO2 and proppant) with great success. The fracturing mechanics with CO2 and proppant would not be any different than the conventional water based hydraulic fluid. However, there are few differences that exist both in the hardware and fluid design; the primary one is the use of high pressure closed-system blending vessel to mix the proppant in the CO2 fluid. As far as fluid design goes, the proppant concentration and size must be lower than the conventional water based fracturing due to the low-carrying capacity of CO2. Fracturing with liquid CO2 and proppant was found to provide stimulation benefits including decreased fluid cleanup time. However, leakoff appears to be a problem due to the low viscosity of CO2 fluid. Therefore the fracturing pump rate must be high enough to compensate for fluid loss. Despite the higher treatment costs compared to the conventional water based fracturing treatments; the immediate benefit found in well productivity offsets this cost difference. These treatments also appear to be effective in cleaning up hydrocarbon residue damage due to the solvent characteristics of miscible CO2 systems. Work by Lillies and King31, and Yost et al34,40 showed significant improvements in total hydrocarbon production, and producing life.
2.3.4 Economics of the technology
Economics will revolve around development of a suitable infrastructure for wide application. A typical well application would require 120-220 tons of liquid CO2/per
40 Yost, A.B., R.L. Mazza, and R.E. Remington II, 1994. Analysis of production response to CO2/sand fracturing: A case study. SPE 29191, presented at the 1994 Eastern Regional Conference & Exhibition, Charleston, WV, U.S.A., 8-10 November.
20
stage, with wells having 4-10 stages. A typical refrigerated tanker would carry 55 tons of CO2 to the site. The CO2 can be sourced from existing capture target sources (hydrocarbon gas streams, power plants, etc.), and since the returning gas flow can be routed back to a gas processing plant, all of the injected gas can be effectively re-captured. It is expected that the better environmental benefits of using CO2 instead of water would drive the increased adoption of CO2 fracturing.
2.3.5 Active International Projects, planned projects
Several US based and European companies currently have the capability of applying this technology, but there is still insufficient incentive to eliminate the use of water. The use of CO2 is seeing increased application, not for fracturing, but in the under-balanced drilling side. Lack of appropriate fracturing equipment (pressurized mixers), and difficult logistical transport issues for liquid CO2 make water a cheaper alternative. The lack of controls on use of water, will continue to play against the economics of going to water-less technologies, even though there are clear indications of dwindling water supplies for human consumption, especially in drier portions of the Middle East, Africa, and the U.S.A.
2.3.6 Regulatory requirements for operations
Cryogenics are a challenge in the oil field as supercritical CO2 is transported as a dense liquid, at -22 °F (-30 °C), and 300 psig. For bulk liquid shipments, carbon dioxide as a refrigerated liquid is designated as Class 2.2 (non-flammable gas). CO2 is non-toxic, but by diluting the oxygen concentration in air below the level necessary to support life; it can act as an asphyxiant. It is a refrigerated, supercool liquid, with very high volatility. A ton of liquid CO2 converts to 17,198 SCF of gas. The material flashes to a heavy gas (density 1.5 times that of air), so there is a danger of suffocation if the gas is trapped in low-lying environments, under quiescent conditions.
2.3.7 Technology advancement needs/gaps, RD&D needs
The challenges for use of foamed-CO2/liquid-CO2 fracturing fluids fall into several categories. These include logistics, chemical issues, and completion design challenges. 1. Logistics: Generally, logistics become a major cost factor in all well activities.
Fluids have to be trucked to remote environments, and liquid CO2 or liquid LPG or will be no different. There is a shortage of CO2 capture facilities available around the world, and the only source of large quantities of LPG will likely be from refinery facilities. CO2 will need to be brought to site in refrigerated tankers – 0.4 °F (-18 °C). The same is true for service provider support –until there is a significant commitment from pump providers, to bring sealed, pressurized equipment to site, there will be little possibility of moving this technology forward.
2. Chemical Challenges: There a few issues related to CO2 chemistry which needs to be addressed by the chemical industry. A critical one is the lack of a suitable liquid-CO2 thickening agent. Enick and coworkers reviewed on the development of
21

thickening agents with CO241. The issues related to the lack of viscosity agents are:
1) increased pump rates needed to fracture formations, and 2) reduced capacity to carry appropriate loads of proppant (marginally about 6 pounds per gallon [ppg]) into the fracture. This becomes less of an issue for unconventional targets where lower viscosity (such as slick-water systems), and lower-proppant density are the norm. As water percentage increases, the value for the fluid design as a “limited water” or “waterless” stimulation declines. The low density of the supercritical CO2 requires higher pressured containment and pumping systems will be needed for deeper, higher pressure stimulation. High pressure usually implies deeper wells, and therefore, higher temperatures. Significant research needs to be conducted in developing high-temperature viscosifiers, and density enhancers to handle deep hot wells.
3. Completion/Mechanical Challenges: Completions will need to be specially designed to handle the more rigorous conditions that they will be subjected to. Any elastomers and seals in pumping/completion systems need to be of CO2-rated materials. Hydrogenated nitrile butadiene rubber (HNBR) and some perfluroelastomers (FFKM) are suitable. Dry CO2 is non-corrosive. Pure-phase liquid-CO2 that is completely dehydrated before injection will not cause internal corrosion of the tubing. However, corrosion can be a factor when using foams, because water is present. The primary factors that affect corrosion rates are the partial pressure of CO2, operating pressure and temperature, flow rate of CO2, water content and contaminants such as hydrogen sulphide and oxygen. Pure CO2 exerts a very large partial pressure which causes reduced pH and increased carbonic acid formation. If formation water returns with the CO2, after stimulation, or if CO2 foams are used, then a degree of corrosion resistance will be needed. A final design consideration is the low temperatures of CO2 liquids, as delivered to the well head (ca. -22 °F [-30 °C]). Low temperatures can result in shrinkage of tubes (especially if un-cemented) past safety limits. However, Mueller et.al42 used cold-CO2 injection as an enhanced fracture technique to induce thermal fractures into the well.
2.3.8 Potential for co-production
The potential for co-production in the use of CO2 fracturing for shale oil recovery is similar to that of CO2 fraccing for EGR.
41 Enick, R.M., Olsen, D.K., 2012. Mobility and conformance control for carbon dioxide-enhanced oil recovery (CO2-EOR) via thickeners, foams, and gels – A detailed literature review of 40 years of research. DOE/NETL-2012/1540. Available at: http://www.netl.doe.gov/technologies/oil-gas/publications/EPreports/CO2-mobility-control-report-2011.pdf 42 Mueller, M., Amra, M., Haefner, F.K., and Mofazzal Hossain, M.D., 2012. Stimulation of tight gas reservoir using coupled hydraulic and CO2 Coldfrac Technology. SPE 160365, presented at the SPE Asia Pacific Oil and Gas Conference and Exhibition held in Perth, Australia, 22-24 October 2012
22

3. REUSE (NON-CONSUMPTIVE) APPLICATIONS
3.1 UREA
3.1.1 Introduction
Fertilizers boost the productivity of the soil, leading to higher crop yields. Urea (H2N-(C=O)-NH2), ammonia (NH3), urea ammonium nitrate (UAN), monoammonium phosphate (MAP), diammonium phosphate (DAP), and NPK (nitrogen, phosphate, potash fertilizer) are the key nitrogen fertilizers used to supply nitrogen which can be readily used by plants (typically as ammonium NH4
+, or nitrate NO3-). Among these, urea is a
major fertilizer, and is traded globally. A major fraction (~88%) of global urea consumption is used as fertilizer (see Table 3), and its demand is driven by population growth, rising incomes, and more crop-intensive diets. Urea is also used to make plastics, adhesives, and explosives. Urea-based selective catalytic reduction (SCR) is also used to control nitrogen oxide (NOx) emissions from power plants and diesel vehicles43.
3.1.2 Metrics
The global supply of urea in 2012 was 165.9 million metric tonnes (Mt)44. Urea markets are currently tight, with production (supply) nearly equaling the demand for urea, estimated to be 162.3 Mt in 2012 (Table 3). Table 3: World Urea Supply/Demand Forecast and Projected CO2 Consumption
World Urea Supply/Demand Balance
2012 2013 2014 2015 2016
Supply (Mt) Capacity 192.4 202.8 207.4 224.3 226.1
Total Supply45 165.9 173.7 180.3 189.7 195
Demand (Mt) Fertilizer Demand 143.3 146.2 149.4 152.7 154.4
Non-fertilizer Demand 19 19.7 20.7 21.1 21.7 Total Demand 162.3 165.9 170 173.8 176.1
CO2 Demand (based on urea
demand) CO2 (Mt/y) 120.1 122.8 125.8 128.6 130.3
The International Fertilizer Industry Association (IFA) estimates the world supply and demand for urea would be 195 Mt and 176 Mt respectively in 2016. World supply and
43 Solutions of urea in purified water used to control NOx from vehicles using SCR are referred to as diesel exhaust fluid (DEF) in the U.S., and as AdBlue in Europe. 44 Heffer, P., Prud'homme, M., 2012. Fertilizer Outlook 2012-2016, presented at the 80th IFA Annual Conference, Doha (Qatar), 21-23 May 2012. Available at: http://www20.gencat.cat/docs/DAR/DE_Departament/DE02_Estadistiques_observatoris/24_Estudis_i_documents/01_Novetats_documentals/Fitxers_estatics/2012_NDW_fitxers/NDW_120720_2012_doha_ifa_summary.pdf 45 IFA refers to supply as the maximum achievable production (capacity x highest achievable operating rate)
23

demand are estimated to grow at 4.4% and 2.4% per annum respectively compared to 2011. In the previous decade, urea supply grew at 3.8% per annum between 2001 and 2010. Most of the CO2 used to produce urea is separated from flue gas from natural gas or hydrocarbon reforming or coal gasification required to produce hydrogen for ammonia synthesis. Approximately 0.57 t NH3 and 0.74 t CO2 are directly consumed per t of urea. Indirect CO2 emissions and reductions from urea production include the emissions from ammonia synthesis from natural gas or coal, and the additional amount of CO2 fixed as biomass due to fertilizer use. Life-cycle studies by the Canadian Fertilizer Institute indicate that the average CO2 emission for urea production from natural gas to be 1.39 t CO2/t urea, which covers natural gas input and urea output46.
3.1.3 Current State of Technology
The synthesis of urea from ammonia and carbon dioxide (CO2) is a mature process compared to other non-consumptive uses of CO2. Ammonia and CO2 are reacted in proportions between 2.9 to 3.5 to form ammonium carbamate at high pressure (140-150 bar) and temperature (180-185 °C), converting 60-65% of the feed CO2. Ammonium carbamate is further dehydrated to form carbamide (urea).
• 2 NH3 + CO2 → NH4COONH2 → H2N-(C=O)-NH2 + H2O
Different technologies of urea manufacture differ in the process used to separate urea from the reactants, and how ammonia and CO2 are recycled back to the reactor. Refinements in urea production technology are focused on improving the conversion of CO2, optimizing heat recovery and reducing utility consumption. Note that ammonia itself is produced by the Haber process from hydrogen (produced by steam reforming of natural gas, or by water gas shift reactions of syngas derived from coal/petcoke gasification) and nitrogen (from cryogenic air separation). . Most modern fertilizer plants use natural gas or other gases like propane or ethylene to produce the hydrogen needed for ammonia. The production of hydrogen from methane produces CO2, more than what is needed to produce urea. Chinese fertilizer plants primarily use hydrogen from gasifying anthracite coal to produce ammonia and urea. The most efficient plants consume approximately 0.6 kg of natural gas to make one kilogram of nitrogen as ammonia, and 0.75 kg to make urea47.
3.1.4 Economics of the technology
The economics of urea production are cyclical, and are affected primarily by the price of feedstock (natural gas, fuel oil or coal) and agricultural demand for grain. Historically, producers in the Middle East and North Africa region have benefited from low-cost gas
46 http://oee.nrcan.gc.ca/industrial/technical-info/benchmarking/ammonia/15230 47Yara Fertilizer Industry Handbook, February 2012. Available at: http://www.yara.com/doc/37694_2012%20Fertilizer%20Industry%20Handbook%20wFP.pdf
24

and stable gas contracts48. Typical urea cash production costs49 (4th quarter, 2011) varied from ~100 $/t (Middle East and North Africa) to $380/t (Europe)48. The recent increase in shale gas production has improved the economics of urea production in North America, and typical production costs were $210/t (4th quarter, 2011)48. An example of the cash costs for a hypothetical US plant located in Louisiana (~1300 T/d) was provided by Blue Johnson & Associates47. Natural gas price of $8/MMBTU and gas consumption of 36 MMBTU/t NH3 led to ammonia cash cost of $314/t. Using ammonia utilization of 0.58 t NH3/t urea, process natural gas usage (5.8 MMBTU gas/t urea) cost, and other production costs of $22/t urea, the total free-on-board (fob) cash urea production cost was estimated to be $245/t. The costs of constructing a greenfield urea plant are substantial, ~1.2 billion $ for 1 Mt/y urea plant48. The Black Sea and the Arab Gulf regions are major global urea export hubs for urea. There are considerable regional differences in the production, consumption, and export of urea in each of the world's key markets (USA, west/central Europe, China, India, and Brazil). Benchmark urea spot prices vary with time and region. For example, average urea price in August 2012 ranged from $385/t (Black Sea), $484/t (New Orleans) to $620/t (Pacific Northwest)50. The nominal-net benefit using urea product cost of $430/t and NH3 cost of $470/t, and CO2 price of $40/t is $183/t CO2
51. The direct CO2 consumption at the urea supply levels
projected for 2016 would be 143 Mt/y.
3.1.5 Active International Projects, planned projects
Approximately 460 urea plants are currently operating around the world52. By 2016, the IFA estimates that approximately 50 Mt of urea capacity would be added by almost 60 new plants and 4 Mt would be additionally produced by expansion and revamp of existing plants53. Government export tariffs, policies and the availability of natural gas may affect urea production in China and India. A majority of the increase in global urea capacity would be in exporting countries such as Algeria, China, Indonesia, Qatar, Saudi Arabia and Venezuela. Capacity changes are also expected in some of the consuming countries, such as, Brazil and Vietnam.
48 Valentini, A., 2012. The outlook for the world urea market. Presented at Diesel Emissions Conference & AdBlue Forum Asia 2012, 27-29 March 2012, Beijing, China. Available at: http://www.integer-research.com/2012/environment-emissions/news/world-urea-market-outlook-supply-demand/ 49 Production cash costs exclude depreciation, overhead and debt service. 50 http://agrium.com/includes/August_2012_Roadshow.pdf 51 44 t CO2 requires 34 t NH3 and produces 60 t urea and 18 t water. Ammonia and urea U.S. CFR prices: 470 $/t and 430 $/t from ICIS. CO2 price: 40 $/t. 1 t CO2 = 34/44 t NH3 = 60/44 t urea. Raw material costs: 40 + 34/44x470 = 403 $/t CO2. Urea cost: 430x60/44 = 586 $/t CO2. Nominal-net benefit = 586-403 = 183 $/t CO2 (negative cost). 52 http://www.ureaknowhow.com/urea_j/en/library/578-2011-10-wang-brouwer-ureaknowhowcom-worldwide-urea-plants-overview.html 53 Food and Agriculture Organization of the United Nations (FAO), 2012. Current world fertilizer trends and outlook to 2016. Available at: ftp://ftp.fao.org/ag/agp/docs/cwfto16.pdf
25

Several new North American urea projects are being announced to harness current low-natural gas prices54. The lead times for constructing a greenfield urea plant vary from 3 years48 to 6 years47. New urea projects announced now may not result in added capacity by 2016. The Perdaman Collie project in Australia aimed to convert sub-bituminous coal to urea (~2 Mt/y) using coal gasification. It has been delayed over coal supply issues. Furthermore, two proposed coal-gasification-based poly-generation projects in the USA, SCS Energy’s 390 MW Hydrogen Energy California Project (HECA), and Summit Power Group’s 400 MW Texas Clean Energy Project (TCEP) plan to produce electricity, urea, and CO2 for enhanced oil recovery (EOR)55. The TCEP plant would produce 0.7 Mt/y urea56 and the HECA project would generate ~1 Mt/y of urea, urea ammonium nitrate (UAN), and ammonia57.
3.1.6 Regulatory requirements for operations
The regulatory requirements for urea facilities obviously vary by region and the type of plant complex producing urea. Air and water quality permitting requirements for standalone greenfield natural gas-based urea production may be significantly distinct from those for coal-based urea production, or poly-generation-based urea production.
3.1.7 Technology advancement needs/gaps, RD&D needs
Improvements in urea production technology are focused on reducing utility consumption, and improving plant reliability. Large, single-train plants of up to 3500 T/d are being designed. Generally speaking, the amount of CO2 emitted from natural gas reforming is larger than the CO2 used to produce urea made by ammonia (produced by hydrogen from the reforming process). This CO2 intensity is exacerbated in the case of coal-gasification based urea plants without agreements for using CO2 for EOR or geologic storage. Coal-based urea plants may offer simpler pre-combustion CO2 capture. CO2 for natural gas-based urea plants is captured from the methane reformer flue gas or reformed sygas using chemical or hybrid (physical-chemical) solvents, involving higher parasitic loads and capital requirements than the higher-pressure-capture of CO2 from coal gasifiers. However the cost of coal-based urea is typically at the higher end of current global urea
54 See for example: http://www.icis.com/Borealis/Article.asp?p=1&q=BFB3C6D1D8BDE2B6CCAD8DB96EB0D9CAAFDCC1D48DAEE7B281AED7B8E0B4D5D6B0EC&id=B28398A69B82AC, http://www.icis.com/Articles/2012/12/21/9627034/us-mosaic-may-build-700m-ammonia-plant-in-louisiana.html 55 Hellerman, T., 2012. Poly-gen CCS plant developers hope to skirt cost issues facing other IGCC projects. GHG Monitor, Available at: http://ghgnews.com/index.cfm/poly-gen-ccs-plant-developers-hope-to-skirt-cost-issues-facing-other-igcc-projects/?mobileFormat=true 56 http://www.texascleanenergyproject.com/category/press-releases/ 57 http://hydrogenenergycalifornia.com/wp-content/uploads/file_attachments/030820121050070/Fertilizer.pdf
26

prices due to the increase in the price of anthracite coal47. Improvements in reducing the capital cost of coal gasifiers, gas conditioning, and energy and capital cost needed for pre-combustion CO2 capture could be beneficial to lower the cost of coal-based urea production.
3.1.8 Potential for co-production
Two poly-generation projects based on coal/petcoke gasification HECA, and TCEP plan to integrate urea production with power generation. The addition of urea production (including ammonia production) to the IGCC plant would increase the overall capital cost, compared to both IGCC and a natural gas-based urea plant. For example, the TCEP project is expected to cost $2.5 billion for a 195 MWnet power plant producing 0.7 Mt urea/y and 2.5 Mt CO2/y for EOR, which is significantly higher than the capital cost for a greenfield gas-based urea plant (~$1 billion for 1 Mt urea/y48). It is noteworthy that both of the poly-generation IGCC projects in the U.S.A. provide high-pressure stream of CO2 for EOR in addition to the urea and power, indicating that finding a different use or storage site for the CO2 stream needs to be a part of poly-generation IGCC plants producing urea in a carbon-constrained world. In summary, the challenges for poly-generation-based urea production from coal are the higher overall capital costs, and the need to store or offset CO2 emissions. The advantages of coal-based poly-generation for urea production is the additional flexibility to produce chemicals at off-peak load times, lower carbon intensity of the urea product, and the higher revenues from the sale of urea. For example, urea sales are estimated to make up approximately 54% of the revenues for the TCEP58. Further, cost of delivering urea over a large distance inland from a seaport would increase the overall delivered cost of urea, and a well-located poly-generation IGCC plant may result in lower urea supplied costs59.
58 http://www.iogcc.state.ok.us/Websites/iogcc/images/2012Vancouver/TX_clean_energy_project.pdf 59 For example, urea price in August 2012 for delivery to New Orleans was $484/t and $620/t for delivery to the Pacific Northwest. See 50.
27

3.2 ALGAL FUELS
3.2.1 Introduction
CO2 is a direct product of fossil fuel combustion and needs energy input to be converted to a fuel. A number of potential process routes for such conversion are being considered, including: the production of synthetic liquid fuels such as methanol, formic acid and synthetic hydrocarbons via reforming/hydrogenation/electro-chemical reduction reactions using off-peak renewable energy or hydrogen (i.e. effectively storing excess energy in a more useable form); the production of ‘intermediates’ such as synthesis gas (‘syngas’) which can be separated or used directly in the synthesis of hydrocarbon fuels (e.g. via metal catalysed Fischer-Tropsch synthesis); artificial photosynthesis (‘bio-mimetic’) systems/processes that produce high-energy molecules such as carbohydrates under very mild conditions (e.g. photo-catalytic or electro-catalytic processes); and the production of biomass such as algae via photosynthesis. Microalgae are microscopic, single-celled organisms growing in fresh/salt water that use sunlight as their energy source and CO2 and inorganic nutrients (mainly nitrogen compounds and phosphates) for their growth: the CO2 needed for growth can be derived from concentrated sources such as power/process plant flue gas. There is considerable interest in the use of CO2 to grow microalgae, as the resulting biomass is a versatile raw material that can potentially be used for electricity generation and as a source for a range of fuel and non-fuel products, including bio-oils and proteins, high-value chemicals and ingredients, fertilizers, feed and food. A key attribute of microalgae is higher growth rate and productivity than for most terrestrial plants due to the more efficient use of light and nutrients. Cultivation takes place in open-ponds or semi-closed photobioreactors that can be located on marginal, non-arable land. Many species of microalgae thrive in brackish/salt water or effluents, and in these applications do not compete with conventional agriculture. However, in such applications some form of salt management (e.g. brine removal) is needed due to evaporation. There is a significant energy penalty associated with the requirement for continuous mixing of the algal cultivation system and dewatering. For several years, there has been an interest in the concept of using microalgae to produce biofuels60. Substantial investments in RD&D have taken place in this sector by governments and private investors – most notably in the USA (e.g. Chevron-NREL, DARPA-UOP) and the. These investments are justified by the high potential that algae offer for production of vegetable oils compared to alternative oil crops such as corn, soybean, canola, jatropha, coconut and oil palm61. To date, however, no successful large-scale production of algal biofuels has been achieved.
60 Sheehan, J., Dunahay, T., Benemann, J., and Roessler, P., 1998. A look back at the U.S. Department of Energy’s Aquatic Species Program – Biodiesel from algae, p.296. U.S. department of Energy’s Office of Fuels Development. 61 Chisti, Y., 2007. Biodiesel from microalgae. Biotechnology Advances, v. 25, p.294-306.
28

Although CO2 utilization through algae has advantages and potential, there are several major challenges to be addressed. Even at higher productivities, microalgal systems have a substantial land requirement, which may not be available in the direct vicinity of power plants and other large point-source CO2 emitters. Furthermore, the costs of producing algal fuel are still high. Significant R&D and technological development and cost reduction related to algae cultivation and harvesting are required to enable large-scale production systems.
3.2.2 Metrics
The global market for microalgae is currently approximately 10kt biomass (dry basis)/y, supplying various high-value food supplements, food ingredients, aquaculture feeds and cosmetics feedstock, with an estimated value of US$5 to 6.5 billion/y62. Potential products from microalgae include bio-oil (up to 40%), proteins (30-50%), polysaccharides for the production of chemicals, bio-active products, food and feed ingredients (including omega-fatty acids), fertilizers and fuels. The feasibility of these applications depends on achievable production costs as well as the actual entry of algal products in the market. Current prices of algae on industrial markets range from US$5,000 to 11,000/t and €3,750-7,500/t for algae produced in China63. The production cost of microalgae from photobioreactors has been reported at ca. €10,000/t, with a projected reduction to €3,800-6,000/t due to scale factors62. Another study has estimated microalgae production costs for three different systems at commercial scale (open ponds, horizontal tubular photobioreactors and flat-panel photobioreactors), including dewatering, as €4,950/t, €4,150/t and €5,960/t, respectively64. A price of €680/t could be reached through optimisation of the most important cost drivers64. At this cost level, algae may become a viable feedstock for biofuel and bulk chemicals. Evidently, lowering of the production costs and increasing the value and revenues of co-products are central elements in any optimisation effort. There are a number of algal products with a high market value (e.g. omega-fatty acids), but their market volume is incompatible with the market for biofuels and CO2 fixation. More market-compatible products could include fertilizers, inputs for the chemical industry and alternative paper fibre sources65. The current energy balance of algae production is less favourable than of terrestrial crops due to the high energy requirements for mixing of the culture and for harvesting and drying of the resulting biomass. One study calculated a primary energy input of
62Muylaert, K., and Sanders, J., 2010. Inventarisatie Aquatische Biomassa: Vergelijking tussen algen en landbauwgewassen. K.U. Leuven Campus Kortrijk, 17pp. Studie uitgevoerd in opdracht van Agentschap NL. 63Bowles, D., (ed.), 2007. Micro- and macro-algae: Utility for industrial applications – Outputs from the EPOBIO project. September 2007. CPL Press Science Publishers. 64 Norsker, N-H., Barbosa, M.J., Vermue, M.H., and Wijffels, R.H., 2010, Microalgal production – A close look at the economics, Biotechnology Advances, v.29, p.24-27. 65 Lersel, S. van, and Flammini, A., 2010. Algae-based biofuels: applications and co-products. Review Paper. FAO Aquatic Biofuels Working Group, 117 pages. FAO Environmental and Natural Resources Services Series, No. 44 – FAO, Rome 2010.
29

producing fractionated and dried algal biomass (with an inherent energy value of 21.8GJ/t dry weight) of 9GJ/t biomass (equivalent to 5GJ/t CO2 fixed) for raceway ponds versus ca. 63GJ/t biomass (35GJ/t CO2 fixed) for a flat panel reactor62. This is more than 10-fold higher than for agricultural crops. The energy balance for raceways is positive but still the energy input is 3-4-fold higher than for most agricultural crops. A critical issue is the biomass yield that can be obtained by cultivation of microalgae, since this largely determines the costs of the biomass. In recent years, productivities exceeding 200t/ha/yr have been claimed. The upper limit of productivity is determined by the maximum efficiency of photosynthesis, which is the same for algae and green plants66. For Northern European countries, this would imply a theoretical maximum biomass productivity of 208t (dry weight)/ha/yr. In practice, however, the maximum efficiency is never achieved, so such optimistic projections will have to be nuanced. The main reason for lower efficiencies and therefore lower than maximum yields, are losses caused mainly by biological limitations. The consensus view is that large-scale algal biomass productivities of up to 80t/ha/yr (i.e. in the range of high yields attained with crops such as sugar cane in the tropics) can be realised62,66, with the same figure estimated for a flat-panel photobioreactor62,64,66. The CO2 fixation capacity of an algal system is proportional to the occupied area and the biomass productivity per hectare. For a typical carbon content of 50wt% in the algal biomass, the fixation capacity is ca. 0.5t carbon (from 1.8t CO2 taken up by the algae) for potential conversion to valuable products67. The fixation of a third of the CO2 emitted by a 600MWe coal-fired power plant (i.e. 4kt CO2/day for 365 days/yr, or 1.46 GT CO2/yr), would require an algae cultivation surface of about 10kha (ca. 100km2), assuming a productivity of 80t biomass (dry)/ha/yr. The amount of algal biomass produced would be of the order of 800kt. Algal CO2 fixation, particularly in warmer and sunnier regions, is seen as having near-term potential in combination with waste water treatment and fertilizer recycle/production68. In the mid-term (15-20 years), it is expected that processes might be developed by integrating biofuels production with higher value/large market co-products such as biopolymers and animal feed. In the longer term, single purpose algae biofuels production may become feasible. Given the diversity of different algal systems and the number of products, more in-depth analyses should be performed to quantify the CO2 balance for the different systems.
66 Tredici, M. R., 2010. Photobiology of microalgae mass cultures: understanding the tools for the nexr green revolution, Future Science, v.1, p.143-162 http://www.future-science.com/doi/abs/10.4155/bfs.09.10. 67 Styring, P., and Jansen, D.de Conninck, H., Reith, H and Armstrong, K., 2011. Carbon capture and utilisation in the green economy. Centre for Low Carbon Futures 2011 and CO2Chem Publishing 2012. Report 501, July 2011. ISBN: 978-0-9572588-1-5. Available at: http://co2chem.co.uk/wp-content/uploads/2012/06/CCU%20in%20the%20green%20economy%20report.pdf . 68Harmelen, T. van, and Oonk, H., 2006. Microalgae biofixation processes: applications and potential contributions to greenhouse gas mitigation options. TNO Built Environment Geosciences.
30

3.2.3 Current State of Technology
The steps involved in algal fuel production may be broadly grouped as: cultivation, algae harvesting and/or extraction, and processing to produce fuels. Cultivation of microalgae takes place in either open-pond systems or in (semi-) closed photobioreactors to which water, nutrients and CO2 are supplied. High-rate Algal Ponds (‘HRAP’ or ‘raceway ponds’), with paddle-wheels for mixing the culture, are the most common method currently used for commercial algae production67. These can be built at relatively low costs (ca. US$10/m2) and are easily scaled-up. However, such large-scale open systems do not lend themselves to process control, thereby limiting algae productivity. Furthermore, the relative ease of contamination limits the number of species that can be successfully cultivated in open systems and care is needed in the CO2 supply/dosing systems to minimise the CO2 emitted to atmosphere. Photobioreactors provide a more controlled environment, permitting the cultivation of a broader range of algal species and higher productivities than ponds69. However, at the current stage of development, photobioreactors have a ca. 10-fold higher investment cost (>US$100/m2) compared to open systems and scale-up is hampered by engineering issues relating to gas/liquid mass transfer, prevention of wall-growth and energy efficient mixing/cooling of the culture67. Some recent developments are addressing these issues and are discussed here:
• HR BioPetroleum70 has developed a hybrid system comprising photobioreactors and a large open pond area: Results at pilot scale show that selective cultivation is possible at a high yield and reduced costs. Algal oil production cost in a full-scale system was estimated to be US$84/bbl71.
• Vertical, flat-panel reactors made from thin polyethylene film have been designed
to substantially reduce investment costs. It is likely that many systems will be developed based on such design principles, with expected improvements in material lifetime (and thus costs) and energy requirement for cooling and mixing72,66.
Research has shown that flue gas from coal- and gas-fired power plants are suitable CO2 sources for algal growth73,74. Also, the removal of NOx and its use as a nutrient (after
69 Pulz, O., 2001. Photobioreactors: production systems for phototrophic microorganisms, Applied Microbiology and Biotechnology, v.57, p.287-293. 70 HR BioPetroleum. Available from: http://www.hrbp.com/index.html. 71Huntley, M.E., and Redalje, D.G., 2006. "CO2 mitigation and renewable oil production from photosynthetic microbes: A new appraisal", in Mitigation and Adaptation Strategies for Global Change, Springer. http://www.drfriendly.tv/PDFs/Huntley%2BRedalje200611.pdf. 72 Wijffels, R.H., Barbosa, M.J., 2010. An Outlook on Microalgal Biofuels. Science, v.329, no.5993, p.796-799. 73 Benemann, J., 1997. CO2 mitigation with microalgae systems, Energy Conversion and Management, v.38, p.475-479. 74 Benemann, J.R., 2003. Biofixation of CO2 and greenhouse gas abatement using microalgae: technology roadmap. U.S. Department of Energy, National Energy Technology Laboratory, and the International Energy Agency Greenhouse Gas Abatement Programme.
31
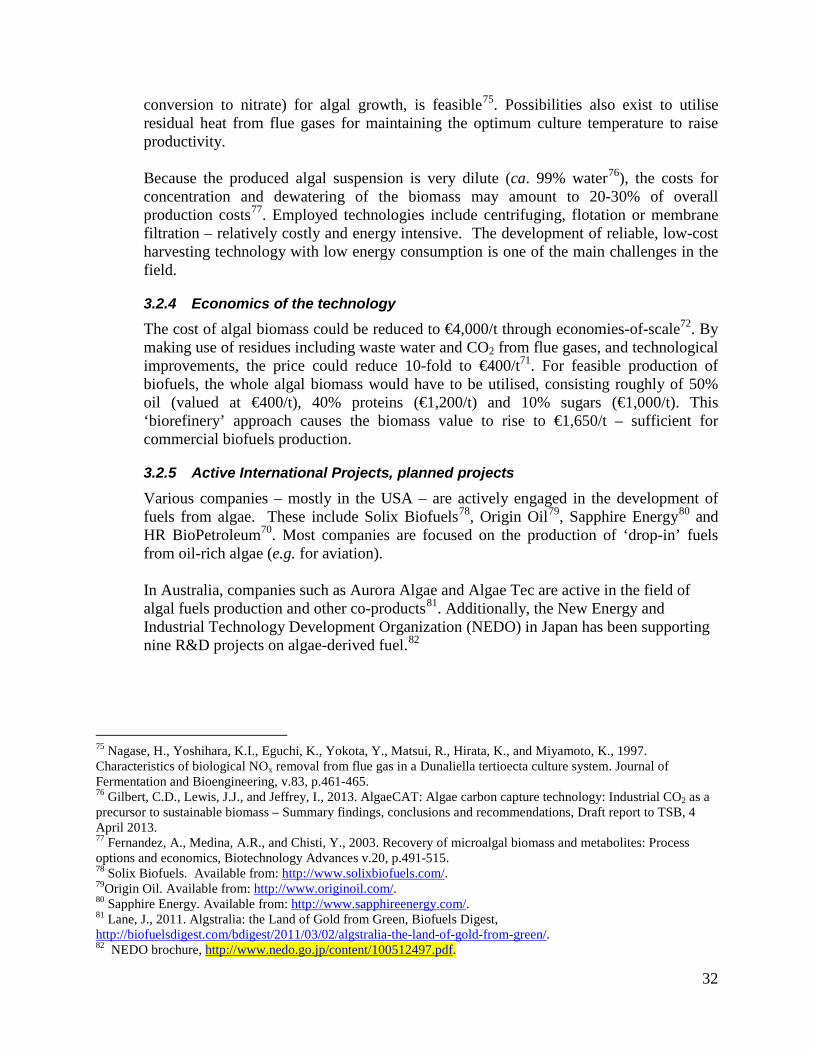
conversion to nitrate) for algal growth, is feasible75. Possibilities also exist to utilise residual heat from flue gases for maintaining the optimum culture temperature to raise productivity. Because the produced algal suspension is very dilute (ca. 99% water76), the costs for concentration and dewatering of the biomass may amount to 20-30% of overall production costs77. Employed technologies include centrifuging, flotation or membrane filtration – relatively costly and energy intensive. The development of reliable, low-cost harvesting technology with low energy consumption is one of the main challenges in the field.
3.2.4 Economics of the technology
The cost of algal biomass could be reduced to €4,000/t through economies-of-scale72. By making use of residues including waste water and CO2 from flue gases, and technological improvements, the price could reduce 10-fold to €400/t71. For feasible production of biofuels, the whole algal biomass would have to be utilised, consisting roughly of 50% oil (valued at €400/t), 40% proteins (€1,200/t) and 10% sugars (€1,000/t). This ‘biorefinery’ approach causes the biomass value to rise to €1,650/t – sufficient for commercial biofuels production.
3.2.5 Active International Projects, planned projects
Various companies – mostly in the USA – are actively engaged in the development of fuels from algae. These include Solix Biofuels78, Origin Oil79, Sapphire Energy80 and HR BioPetroleum70. Most companies are focused on the production of ‘drop-in’ fuels from oil-rich algae (e.g. for aviation). In Australia, companies such as Aurora Algae and Algae Tec are active in the field of algal fuels production and other co-products81. Additionally, the New Energy and Industrial Technology Development Organization (NEDO) in Japan has been supporting nine R&D projects on algae-derived fuel.82
75 Nagase, H., Yoshihara, K.I., Eguchi, K., Yokota, Y., Matsui, R., Hirata, K., and Miyamoto, K., 1997. Characteristics of biological NOx removal from flue gas in a Dunaliella tertioecta culture system. Journal of Fermentation and Bioengineering, v.83, p.461-465. 76 Gilbert, C.D., Lewis, J.J., and Jeffrey, I., 2013. AlgaeCAT: Algae carbon capture technology: Industrial CO2 as a precursor to sustainable biomass – Summary findings, conclusions and recommendations, Draft report to TSB, 4 April 2013. 77 Fernandez, A., Medina, A.R., and Chisti, Y., 2003. Recovery of microalgal biomass and metabolites: Process options and economics, Biotechnology Advances v.20, p.491-515. 78 Solix Biofuels. Available from: http://www.solixbiofuels.com/. 79Origin Oil. Available from: http://www.originoil.com/. 80 Sapphire Energy. Available from: http://www.sapphireenergy.com/. 81 Lane, J., 2011. Algstralia: the Land of Gold from Green, Biofuels Digest, http://biofuelsdigest.com/bdigest/2011/03/02/algstralia-the-land-of-gold-from-green/. 82 NEDO brochure, http://www.nedo.go.jp/content/100512497.pdf.
32

3.2.6 Regulatory requirements for operations
The operation of an algae farm would require the inputs of nutrients, CO2, and fresh or brackish waters. The local regulations governing the use of these resources, and any emissions to water and air would be applicable to algal fuel production.
3.2.7 Technology advancement needs/gaps, RD&D needs
Algae have a number of attributes that enable sustainable production concepts, including high biomass productivity, the possibility of utilising marginal, non-arable land, salt water, waste streams as nutrient supply and flue gases as CO2 sources to produce fuels and a range of non-fuel products. Furthermore, algae can attain much higher oil and protein yields than traditional crops. The main challenges that need to be addressed in order for algae to make a meaningful contribution to CO2 biofixation are to achieve large-scale algal production at competitive costs. Currently, technologies are not available for commercial implementation at large scale and significant R&D and investments are required for the technology to become economically viable. Also, there is a need to develop techno-economic analysis and life cycle assessment for microalgal fuel production in the context of CO2 emission reductions from power generation and refinery sources. In addition to fuels production, microalgae are particularly suitable for use as animal feed, which may have higher value than fuels in certain regions where the animal feed is imported. Microalgae production uses waste CO2 emitted from refineries, power plants or similar sources, and many species can use seawater. However, factors relevant to cultivation of specific strains of microalgae in large ponds at high productivity need to be assessed. Harvested algal biomass can be used for the biofuel production or as animal feed. Further near-term applications include combining CO2 biofixation with waste water treatment and fertilizer production. Critical objectives for fuel, animal feed and/or chemical production using microalgae, include: reducing production costs and energy requirements while maximising lipid productivity, and increasing the biomass value by making use of all algal biomass components through a biorefinery. . It is necessary to identify potential short-term (< five years) R&D issues for utilizing algal biomass through the combination of several end uses, such as fuels, chemicals, waste water treatment, animal feed to advance this technology to a demonstration project, leading to large-scale commercial CO2 fixation by microalgae within the decade.
3.2.8 Potential for co-production
A current trend in the industry is the co-production of biofuels and suitable co-products (e.g. proteins, ‘green’ chemicals, biopolymers) to improve economics83.Additional studies are needed
83 Thurmond, W., 2011. Top 11 algae investment and market trends for 2011. Excerpt from Algae 2020 study Vol. 2, updated February 2011. http://www.emerging-markets.com/ and http://www.emerging-markets.com/algae/Top_11%20Algae_Investment_Trends_%20from_%20Algae_%202020_%20Study.pdf.
33

to examine potential efficiencies and economics of co-production. Integrated assessments of technological and market factors are needed to identify promising opportunities and influence the direction of research.
34

3.3 CO2 UTILIZATION IN GREENHOUSES
3.3.1 Introduction
Plants absorb CO2 and H2O in greenhouses to form organic matter (leaves, stems, fruits, vegetables, flowers). Higher CO2 concentrations stimulate plant growth to a certain extent. For example, the rate of plant growth (photosynthesis) increases by approximately 50 percent for most crops when the CO2 concentration in a greenhouse is increased from the natural level of 340 ppm to 1000 ppm for any light intensity84. CO2 can be added to stimulate plant growth in a greenhouse by preventing the CO2 concentrations from gradually becoming lower in the confined environment of a greenhouse. Although this is not a geographically-limited option, pertinent examples would be drawn from the Netherlands because it is a common practice.
The majority of horticulturists in the Netherlands produce the CO2 they need on-site by burning natural gas in their on-site combined heat and power plants. However, currently about 5% of the sector’s CO2 use for greenhouses comes from industrial waste-CO2, stemming from some of the largest point sources of pure CO2 in the Netherlands: the Shell refinery and Abengoa bioethanol in the Rotterdam area, and the Yara fertilizer plant in the South-Western part of the country. A minority of users buy CO2 from companies selling industrial gases.
Figure 3 Tomatoes grown with CO2 from the industrial sources (Shell, Abengoa) and geothermal heat.
Source: www.vleestomaat.nl.
The utilization of CO2 in greenhouses opens perspectives to more efficient food production, which is a global challenge in itself. In the years to come, the demand for food will double85. In the future, the productivity of Dutch horticulture is estimated to
84 http://www.omafra.gov.on.ca/english/crops/facts/00-077.htm 85 http://www.topcompanies.nl/en/all-magazines/1-1-horticulture-en/growing-chances-across-the-border/
35

result in 20 times more crop per hectare than conventional growing systems. The world may need more greenhouses and more CO2 utilization in greenhouses in the future.
Furthermore, the utilization of industrial waste CO2 enables an efficient and fully sustainable horticulture in temperate zones, where heating of greenhouses is required. In such greenhouses, heating may be done by industrial waste heat, heat pumps or geothermal energy, and CO2 is from industrial waste sources (Figure 3).
3.3.2 Metrics
Today, Dutch greenhouses use about 0.4 Mt per year of industrial waste CO2 that would otherwise be vented. This is about 7% compared to the total CO2 emissions for the growth in greenhouses in 2011, which stood at 5.6 Mt, and about 0.2 % of the total Dutch emissions. The utilization of CO2 leads to decreased burning of natural gas for CO2 generation. There are currently two networks that bring the pure industrial waste CO2 to the horticulturists:
- The OCAP network (starting in the Botlek area): The backbone of this network is a 85 km long pipeline from Rotterdam to Amsterdam. To this existing pipeline, distribution networks are coupled, which bring the CO2 to the various greenhouse areas (see Figure 4)86,
- The WarmCO2 network (south-western part of the Netherlands): Here, a new area for greenhouses is being developed within 5 km from the Yara fertilizer plant. The Yara plant supplies both waste heat and CO2 to the greenhouses, which are therefore fully independent of fossil fuels87.
In both cases, the CO2 is compressed and transported in the gaseous phase. In the year 2013, OCAP is planning to install a central buffer for liquid CO2 to deal with inbalance between supply and demand in summer. Interestingly, this CO2 will be bought on the market for liquid CO2. There are two additional networks that bring CO2 to growers, but organized differently:
- “Roca3”: The Roca3 gas-fired CHP plant, in use since 1996, supplies heat and flue gases (not pure CO2) to 140 horticulturists north-east of Rotterdam88.
- Plukmadese polder: The AMER power plant supplies heat to horticulturists (~130 ha greenhouses) in the Plukmadese polder. CO2 is bought centrally from a supplier of industrial gases, but delivered per individual grower.
86 www.ocap.nl 87 www.warmco.nl 88 http://eon-benelux.com/eonwww2/publishing.nsf/Content/Centrale+RoCa
36
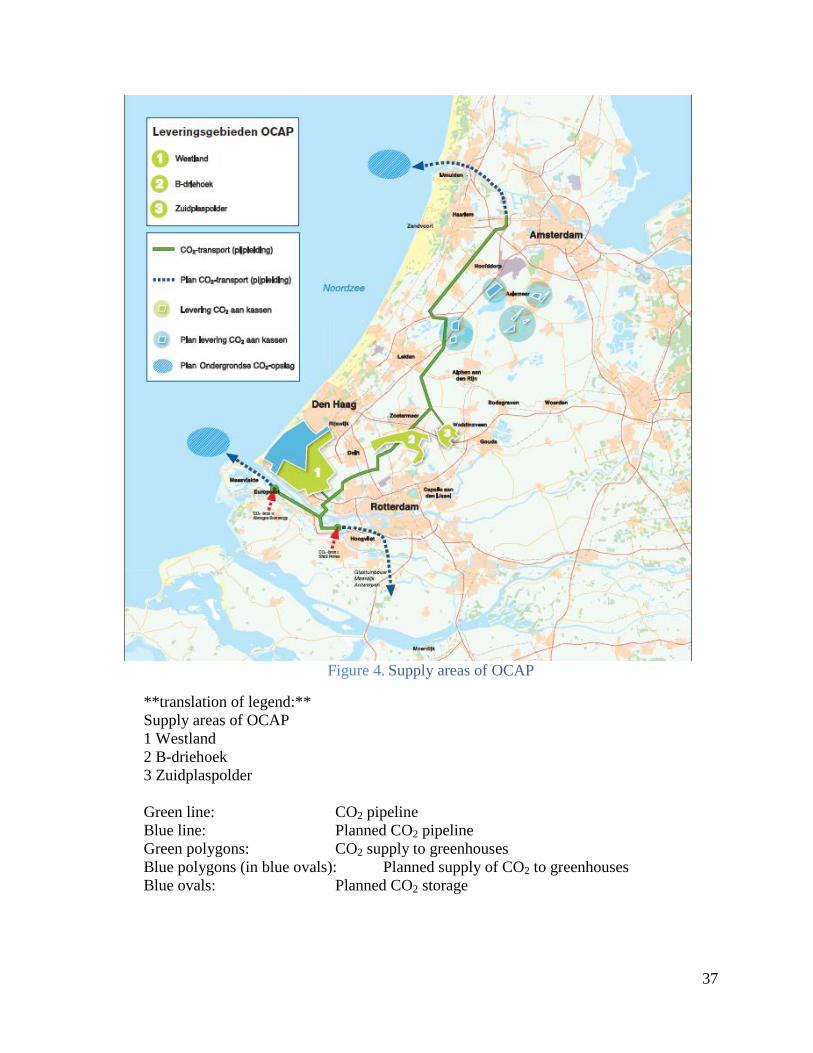
Figure 4. Supply areas of OCAP
**translation of legend:** Supply areas of OCAP 1 Westland 2 B-driehoek 3 Zuidplaspolder Green line: CO2 pipeline Blue line: Planned CO2 pipeline Green polygons: CO2 supply to greenhouses Blue polygons (in blue ovals): Planned supply of CO2 to greenhouses Blue ovals: Planned CO2 storage
37

In the meantime, other greenhouse areas spread around the country also offer possibilities to construct pipelines to connect to CO2 sources. The capacity of large point-sources of pure CO2 in the Netherlands will be about 5 Mt by 201589. The world demand for CO2 for greenhouse growing could very well increase significantly in the years to come. The world greenhouse area is much larger than the area in the Netherlands alone, and expands rapidly in some countries. As an illustration, Table 4 shows the data for protected horticulture of vegetables worldwide in 2006. Table 4: Estimated area protected horticulture (greenhouses/large tunnels) of
vegetables (in 10000 m2) as of 2006
Greenhouses Plastic greenhouses/large tunnels Asia 2,476 926,000 Europe 28,922 171,500 Africa/Middle East 6,682 50,600 North-America 1,350 11,050 Middle/South America - 9,510 Total 39,430 1,168,660 In the Netherlands, the greenhouse area is about 10,000 hectares. From Table 4, we can see that this is about 1% of the total permanent structures for vegetable growth. This means that the world-wide potential for CO2 utilization could theoretically be about 100 times the potential in the Netherlands. The real potential is even higher, because fruits and flowers are not included in the table, and because greenhouse usage has increased rapidly in some countries. Mexico, for instance, had 13,000 hectares of protected tomato growth by the end of 201290 (a larger area for one crop than all the area in the Netherlands today) and is now the world’s second-largest exporter of fresh vegetables. The practical potential is evidently lower. In some countries, the air in greenhouses is not enriched with CO2. Also, the need for ventilation makes enriching with CO2 less attractive. Nevertheless, the worldwide market potential for CO2 demand for this application is in the range of million tons to tens of million tons. It is important to realize that the size of the market here is larger than the size of the CO2 emission reductions. Savings come from avoided burning of natural gas, or other fuels, for CO2 production. However, economic considerations will lead to higher-CO2 levels in the greenhouse when the CO2 is available in pure form and at lower cost. Further, when the reference case does not use any CO2 at all, there are no reductions CO2 emissions. For the Netherlands, an emission reduction of more than 50% was estimated in 2004, but changes in market conditions would lead to lower reduction numbers now89.
89 CO2 Overdrachten onder het Europese systeem van emissiehandel, DHV, maart 2010, p.21; p.24 https://www.emissieautoriteit.nl/mediatheek/emissiehandel/achtergrondstudies/CO2%20overdrachten%20onder%20het%20systeem%20van%20emissiehandel%20-maart%202010.pdf 90 Personal communication, Jan Willem de Vries, Wageningen University
38

For Dutch horticulturists, the cost of CO2 is clearly outweighed by the benefits of increased, higher quality, production. This is generally speaking true for all methods of CO2 production (burning natural gas, transport by pipeline, buying from companies selling industrial gases). The economics of using CO2 depend on several factors, such as the cost-benefit tradeoffs for using pure CO2 versus flue gas and investment in a CHP facility. For example, using pure CO2 is better for plant productivity compared to using flue gas. Additionally, the conventional method of burning natural gas in a CHP cycle also generates electric power. Power generation may or may not be attractive depending on current and potential electricity supply and demand on the spot market and the relative values of prices and potential subsidies. Growers who also need electric light for their plants (typically for flowers) may be benefited by a CHP system. Nevertheless, pipeline CO2 in Netherlands (OCAP and WarmCO2) is a feasible alternative to on-site CHP, although growers pay a good price for the pipeline CO2, and use both systems.
3.3.3 Current State of Technology
The utilization of CO2 as a growth enhancer in greenhouses is applicable to many regions around the world. Utilization of pure industrial waste CO2 started in 2005 in the Netherlands, with the OCAP project. The WarmCO2 project followed in 2009. The extraction of the CO2 from the industrial streams is part of the existing process. CO2 is transported via pipelines in the gaseous phase. At night, the pressure can be increased to 30 bars, so that the pipeline acts as a buffer91.
It is important to note that establishing both the OCAP and the WarmCO2 network has been fully accepted by the Dutch public. The existence of a safe large-scale CO2 transport infrastructure over the past eight years may also help the advancement of geologic storage of CO2.
3.3.4 Economics of the technology
As already stated, the benefits of the addition of CO2 to the greenhouse atmosphere outweigh the costs in the Netherlands, but the economics are heavily dependent on factors such as local fuel prices, and the type of operation of the greenhouse (ventilation). The Ontario Ministry of Agriculture and Food suggests that cost for liquid CO2 range from CAD 110-200 per ton, excluding cost for hardware (tank and vaporizer units). Industrial waste CO2 per pipeline is sold at a price below €100 per ton. Generation with natural gas depends on energy prices and, the selling price of excess electricity for a CHP system.
An important factor when dosing CO2 is evidently the tightness of the greenhouses, and the required ventilation for cooling. In the Netherlands, there are also growers that operate hot-, and cold-storage systems in aquifers, which reduces venting.
91 http://www.ecn.nl/fileadmin/ecn/units/bs/Optiedoc_2005/factsheets/co2-ovg-01.pdf
39

3.3.5 Active International Projects, planned projects
In addition to the Dutch projects for the delivery of pure CO2 via pipeline to greenhouses identified in 3.3.2, there are several greenhouse areas which are now considering the possibility of having their own CO2 distribution, often with support from local or regional authorities. In Spain, Repsol performed the “CO2 Funnels” project at Puertollano which used industrial CO2 from the Repsol refinery complex for growing short-cycle crops in five 400 m2 tunnel-type Mediterranean greenhouses. The study was focused on evaluating the effect of dosing CO2 on the growth of several energy crops92.
3.3.6 Regulatory requirements for operations
Transportation of an industrial gas by pipeline in gaseous phase is subject to existing regulation. The work environment for personnel in a greenhouse fertilized with flue gas needs to be controlled and monitored carefully to mitigate potential risks due to high CO, NOx and ethylene levels. The use of industrial gases in the food industry in Europe is regulated by the European Industrial Gases Association, EIGA93. A similar situation will exist in other parts of the world.
3.3.7 Technology advancement needs/gaps, RD&D needs
There is a need for more insight into the use of CO2 in greenhouses worldwide, and the benefits resulting from the use of industrial CO2, in various parts of the world with differing climates, and for various common crops (since different crops have different needs).
Moreover, more insight or research into possibilities of new and integrated concepts that can couple surplus and demand for CO2 as well as energy would be valuable, and could optimize the entire energy and economic system. For example, the integration of greenhouses with power generation, CO2 (peak) demand, geothermal heat, cold storage, and solar energy is one option. Interestingly, solutions for re-use of CO2 might enable increased use of renewables such as geothermal energy in food production, as the Dutch greenhouse example shows. A holistic approach, rather than a one-dimensional technocratic perspective is important.
3.3.8 Potential for co-production Evidently, the advantage of the use of CO2 in greenhouses is in the higher production. Data on productivity improvements were provided in previous paragraphs.
92 http://www.repsol.com/es_en/corporacion/conocer-repsol/canal-tecnologia/proyectos-casos-estudio/otros-proyectos/proyecto-funnels/ 93 Vermeulen, P.C.M., Lans, C.J.M. van der, 2010. CO2 dosering in de biologische glastuinbouw, Rapport GTB-1085, Wageningen University & Research Centre (WUR).
40

4. CONSUMPTIVE APPLICATIONS
4.1 AGGREGATE, SECONDARY CONSTRUCTION MATERIAL (SCM)
4.1.1 Introduction
The development of SCMs based on carbonated matrices is an obvious-, but currently, poorly-developed route for CO2 utilization as an alternative to CCS. At present, there are few industrial processes utilising CO2 for the production of bulk-materials (cement and building materials) beyond the manufacture of precipitated fine powders for fillers in plastics, paint and food. This is due to:
• The cost of obtaining/transporting ‘waste’ CO2; • Market reluctance to the use of non-virgin materials; and • The need to conform with materials performance specifications.
Until the cost of products derived from captured and sequestrated CO2 are lower and acceptance is more widespread, processes that use CO2 in significant quantities will not become widely developed. Additionally, ‘cheap’ secondary materials produced from CO2 in high volumes have potential to disrupt established markets. As such, supply and demand might have to be controlled, thereby limiting the desired mitigating impact on emissions. The current bottleneck for using CO2 in viable mineral processes at an industrial scale is the rates of reaction that can be achieved67. Nevertheless, recent commercial initiatives utilising CO2 emissions through carbonation of magnesium- and calcium-based feedstock to convert them into ‘green’ aggregates are encouraging future investment and the wider development of SCMs. The conversion of CO2 can be completed by various treatments including electrochemistry, dewatering and drying of carbonates/bicarbonates. In recent years, government investment into RD&D associated with the utilization of CO2 has increased, most notably in the USA, Germany and Australia. For example, in the USA $100 million (M) has been invested in gas scrubbing and conversion research by 2011 (including plastics). In Germany in 2009, €118 M was similarly invested in research into the use of CO2 as a raw material. Several projects are now at the demonstration scale, with a small number of independent companies offering commercial products, although information on scale, yield and cost is difficult to obtain.
4.1.2 Metrics
Approximately 25 billion tonnes (Gt) of aggregates are used every year worldwide, with a potential value of about US$500 billion. If these primary aggregates are replaced by secondary aggregates comprising imbibed CO2, substantial volumes of the gas may be sequestered. However, to be successful in meeting the demands of the aggregate industry, including for use in concrete and ground engineering, SCMs must meet established technical performance requirements through national and international materials performance standards.
41

It is likely that all of the produced SCMs will not always have the required physical and chemical properties for some engineering applications, and this may affect potential technology development and application. As is the case with primary materials, SCMs will need to be ‘fit for purpose’. Assuming that a 100% mineralisation process could generate annually 20bn tonnes of carbonated aggregate of the required quality and at a price that is competitive with virgin or reclaimed sources, the prospects of the technology are positive94. Table 5 contains metrics for potential published processes involving the production of SCMs95.
Table 5: Metrics for aggregate production
Process (see 4.1.3) CO2 utilised Products value
(US$/tCO2) Energy
consumption Energy penalty
CO2 capture in-
built?
Alcoa 2-23Mt1 10-300 n/a n/a yes
Calera 1,500Mt1 7 (aggregates)
100 (per t cement)
0.08-0.28t CO2 emitted/t CO2
captured 8-28% yes
Calix 2-23Mt1 n/a n/a
17% for syngas and
7% for natural gas
yes
Cambridge Carbon Capture
50-1,000Mt1 n/a TBA n/a yes
Carbon8 3-9Kt2 10-18? -44kg CO2/t product
energy positive
yes (but not yet realised)
1: Mt: million tonnes per year 2: Actual by 2014 n/a: not available It is worth noting that the production of SCMs can include geologically-derived materials or waste products from industrial processes. The former are abundant but not always close to potential markets, whereas many industrial residues are produced closer to urban centres and are thus potential feedstock materials for the production of SCMs. A recent
94 Technical Group: CO2 Utilisation Options Task Force, CO2 Utilisation Options - Phase 1 Report, 2012, Carbon Sequestration Leadership Forum. 95 Cambridge Carbon Capture. Company Overview. 2011 [cited 2013 25 March]; Available from: http://cambcarbcap.files.wordpress.com/2010/11/ccc_company_overview_jan-10-v4.pdf
42

estimate96 of the sequestration potential of alkaline waste materials is in the region of 875Mt on an annual basis (Table 6).
4.1.3 Current State of Technology
Commercially available processes that imbibe CO2 into SCMs are limited in number at the present time. Table 7 gives the results of a review of published patents, indicating that processing of SCMs is technically possible, but that uptake is slower. .
Table 6: Alkaline industrial residues with potential for carbonation96
Waste Annual production (Mt)
Maximum CO2 capacity(kg/t waste)
Potential CO2 uptake (Mt)
Bauxite residues 120 53 6.3 Waste concretea 2,800 165 462
Cement kiln dustb 770 115 88.5 Coal fly ash 600 264 158
MSWI bottomc, d ashes 80 475 38.0 MSWI fly ashesc 20 120 2.4 Steelmaking slags 400 300 120
Total 4,790 - 875.7 a: Figures refer to cement production. Every tonne of concrete contains typically 10% cement b: For every tonne of cement, 0.25-0.30 tonnes of kiln dust are produced. Thus: 0.275×2,800=770Mt c: The annual production of municipal incineration ashes is estimated at 100Mt. If we assume that 80% comes as bottom and 20% as fly ashes then the respective figures would be 80Mt and 20Mt d: Ambient T and P are assumed
Table 7: Assessment of technology availability from published patents/patent families
Patent Number Year Description Organisation US8367025B2 US910555882
US7906086B2*
2006 2006 2006
Method for removing CO2 from a fluid stream and production of solid
products
C-Quest
*DC Comrie US8357270B2 US8333944B2 US8137444B2 US8006446B2
2008 2007 2009 2008
Electrochemical and other methods for removal of CO2 from waste
streams and production of materials with potential for re-use
Calera Corporation
WO20011020927A2 2008
Method for oxidation and carbonation of materials producing granular material with potential for
re-use in construction
PBE Descamps et al.
96 Araizi, P.K., Hills, C.D.., Maries, A., Gunning, P. and Wray D.S., 2013. The current status of commercialisation of carbonation technology. 4th International Conference on Accelerated Carbonation for Environmental and Materials Engineering, April 10-12, 2013 – Leuven, Belgium.
43

Patent Number Year Description Organisation
WO2007096671A1 WO2009024826A1
2006 2007
Method for production of construction aggregate from waste
and CO2
University of Greenwich
WO20020507008A1 GB2371298A
2001 2001
Treatment of solid contaminated materials with CO2 to produce material for re-use or disposal
Forkers Ltd
GB2461622A 2008 Production of CO2 absorbing
materials, with potential for use in construction
Calera Corporation
CO2 capture may involve gas compression and a reaction with water to form soluble carbonates/bicarbonates, prior to transformation into solid salts. These carbonates/bicarbonates can then be used as SCMs either as mineral fillers (such as those added to Portland cement or other bound building materials) or as primary materials in a process. Examples of processes which are currently being developed are discussed below: The Calera process97 uses absorbed flue gas which is captured and processed via an absorption unit into two main streams: (a) bicarbonates entering an electrochemical installation, and (b) CO2-free flue gas. For the production of sustainable SCMs, the precipitation, dewatering and drying of calcium carbonate (CaCO3) is required. Pure sodium hydroxide (NaOH) used is regenerated from the electrochemical unit. The Carbon8 process can utilise point source emissions directly, as demonstrated with combusted landfill gas98. The first UK commercial plant uses CO2 obtained in bulk from a waste source (sugar beet processing plant), located a few miles away for the production of aggregate. The solid waste that is carbonate-solidified is an air pollution control residue (APCr) supplied by powder tanker and the aggregate produced is carbon negative (-44kg CO2/t). The CO2 yield is 10-20% (w/w) depending on the feedstock materials, and aggregate production will increase to approximately 100 kt in 2014 with the construction of a second UK plant. Currently, the aggregate is used in the production of ‘carbon negative’ concrete building blocks99. Alcoa Inc. produces large volumes of CO2 and alkaline waste from aluminium processing. A carbon capture system, involving flue gas from its plants and a reaction with alkaline residues produced by the aluminium production process is being
97 Calera, Calera Technology: Our Process 2010; available from: http://www.calera.com/index.php/technology 98 Carbon8. Technology Overview. 2013 [cited 2013 25 March]; Available from: http://www.c8s.co.uk/technology.php. 99 Lignacite. 1st Genuine Carbon Negative Block. http://www.lignacite.co.uk/Environmental-Centre/1st-genuine-carbon-negative-block.html
44

commercially developed. The product has potential to be sold into the construction market100. Calix Limited is involved in minerals production and process calcium and magnesium carbonates as powder for the building, agriculture, water and power industries. The company is scaling-up its production and have recently purchase the intellectual property rights to the Novacem process (magnesia-based cement production)101. Cambridge Carbon and Capture’s (CCC) technology is proven at laboratory scale for the carbonation of silica/metal material for use in construction and (as a by-product) the production of carbon credits due to the generation of ‘carbon-free’ electrical energy. Candidate feed-stocks also comprise alkaline wastes, which are digested into reactive oxides/silicates and then reacted with captured CO2 gas95.
4.1.4 Economics of the technology
CO2 for use in SCM production can be captured by pre-, post-, or oxy-combustion technologies102
. The costs of CO2 capture and compression are estimated to be US$75-90/t CO2Error! Bookmark not defined., which is high and affects the economic production of CMs. Thus, the reduction in cost, or the integration of CO2 capture process with the SCM process (e.g., Carbon8 process), is needed. Cost reductions might be achieved by the development of more efficient capture systems, with potential reductions in prices to US$20-US$30/tCO2 being more favourable for the commercialisation of SCM processes103.
4.1.5 Active International Projects, planned projects
In 2010 the US Department of Energy (DOE) approved two projects to produce sustainable aggregates for the cement industry104:
• Alcoa Inc. (DOE share US$ 12 M): This project was aimed at producing carbonated materials for construction fillers, soil amendments and ‘green’ fertilisers. The applied process focuses on the effective conversion of flue gas CO2 into soluble carbonates/bicarbonates by an in-dust scrubber system using enzyme catalysts. The process operates at Alcoa’s aluminium refining plant at Point Comfort, Texas.
100 Alcoa Inc. Company's Overview. 2013 [cited 2013 25 March]; Available from: http://www.alcoa.com/global/en/home.asp. 101 Calix. A World Leader in Developing Innovative Sustainable Technology. 2013 [cited 2013 25 March]; Available from: http://www.calix.com.au/calix_overview.html. 102 Gibbins, J. and H. Chalmers, Carbon capture and storage. Energy Policy, 2008. 36(12): p. 4317-4322. 103 IPCC special report on carbon dioxide capture and storage, in Working Group III of the Intergovernmental Panel on Climate Change, B. Metz, et al., Editors. 2005: USA, New York. 104 DOE-Fossil Energy. Recovery Act: Innovative Concepts for Beneficial Reuse of Carbon Dioxide. 2012 [cited 2013 25 March]; Available from: http://www.fossil.energy.gov/recovery/projects/beneficial_reuse.html.
45
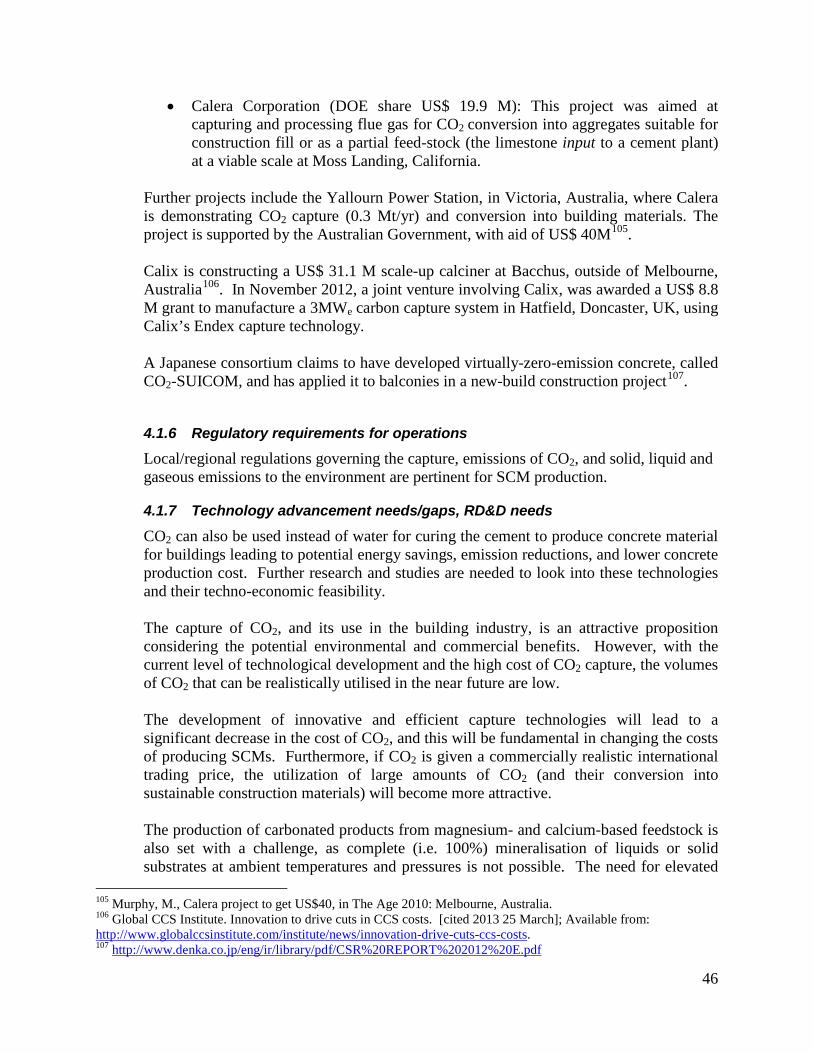
• Calera Corporation (DOE share US$ 19.9 M): This project was aimed at capturing and processing flue gas for CO2 conversion into aggregates suitable for construction fill or as a partial feed-stock (the limestone input to a cement plant) at a viable scale at Moss Landing, California.
Further projects include the Yallourn Power Station, in Victoria, Australia, where Calera is demonstrating CO2 capture (0.3 Mt/yr) and conversion into building materials. The project is supported by the Australian Government, with aid of US$ 40M105. Calix is constructing a US$ 31.1 M scale-up calciner at Bacchus, outside of Melbourne, Australia106. In November 2012, a joint venture involving Calix, was awarded a US$ 8.8 M grant to manufacture a 3MWe carbon capture system in Hatfield, Doncaster, UK, using Calix’s Endex capture technology. A Japanese consortium claims to have developed virtually-zero-emission concrete, called CO2-SUICOM, and has applied it to balconies in a new-build construction project107.
4.1.6 Regulatory requirements for operations
Local/regional regulations governing the capture, emissions of CO2, and solid, liquid and gaseous emissions to the environment are pertinent for SCM production.
4.1.7 Technology advancement needs/gaps, RD&D needs
CO2 can also be used instead of water for curing the cement to produce concrete material for buildings leading to potential energy savings, emission reductions, and lower concrete production cost. Further research and studies are needed to look into these technologies and their techno-economic feasibility. The capture of CO2, and its use in the building industry, is an attractive proposition considering the potential environmental and commercial benefits. However, with the current level of technological development and the high cost of CO2 capture, the volumes of CO2 that can be realistically utilised in the near future are low. The development of innovative and efficient capture technologies will lead to a significant decrease in the cost of CO2, and this will be fundamental in changing the costs of producing SCMs. Furthermore, if CO2 is given a commercially realistic international trading price, the utilization of large amounts of CO2 (and their conversion into sustainable construction materials) will become more attractive. The production of carbonated products from magnesium- and calcium-based feedstock is also set with a challenge, as complete (i.e. 100%) mineralisation of liquids or solid substrates at ambient temperatures and pressures is not possible. The need for elevated
105 Murphy, M., Calera project to get US$40, in The Age 2010: Melbourne, Australia. 106 Global CCS Institute. Innovation to drive cuts in CCS costs. [cited 2013 25 March]; Available from: http://www.globalccsinstitute.com/institute/news/innovation-drive-cuts-ccs-costs. 107 http://www.denka.co.jp/eng/ir/library/pdf/CSR%20REPORT%202012%20E.pdf
46

temperatures and pressures to obtain higher yields will have a negative impact on process costs. However, when the benefits of utilising CO2 in SCMs are to be defined, careful assessment of energy and CO2 balances for processes being developed must be made. Ideally, when calculating the amount of embodied carbon in SCMs, a robust, (and accepted) methodology should be used, which is independently verifiable by a reputable third party organisation. With the exception of the Carbon8 process, which is operating in a fully commercial environment, the main target of current projects (section 4.1.5) is to prove economic feasibility at a large-scale and that the SCMs produced meet the required technical specifications for use in construction activities and are fully accepted by the market.
4.1.8 Potential for co-production
Large emitting point sources such as power and gas plants are sources for the capture and compression of CO2. Direct CO2 capture ensures that CO2 emissions are minimised, but the atmospheric release of other pollutants (such as NOx and particulate matter) may also be prevented. A further benefit is that transportation costs are minimised, however, it is critical that the market for carbon-based SCMs is located not far from the source of their production, as the cost of transportation of dense, high-volume materials can significantly undermine the environmental benefit of sequestrating CO2 into SCMs.
47
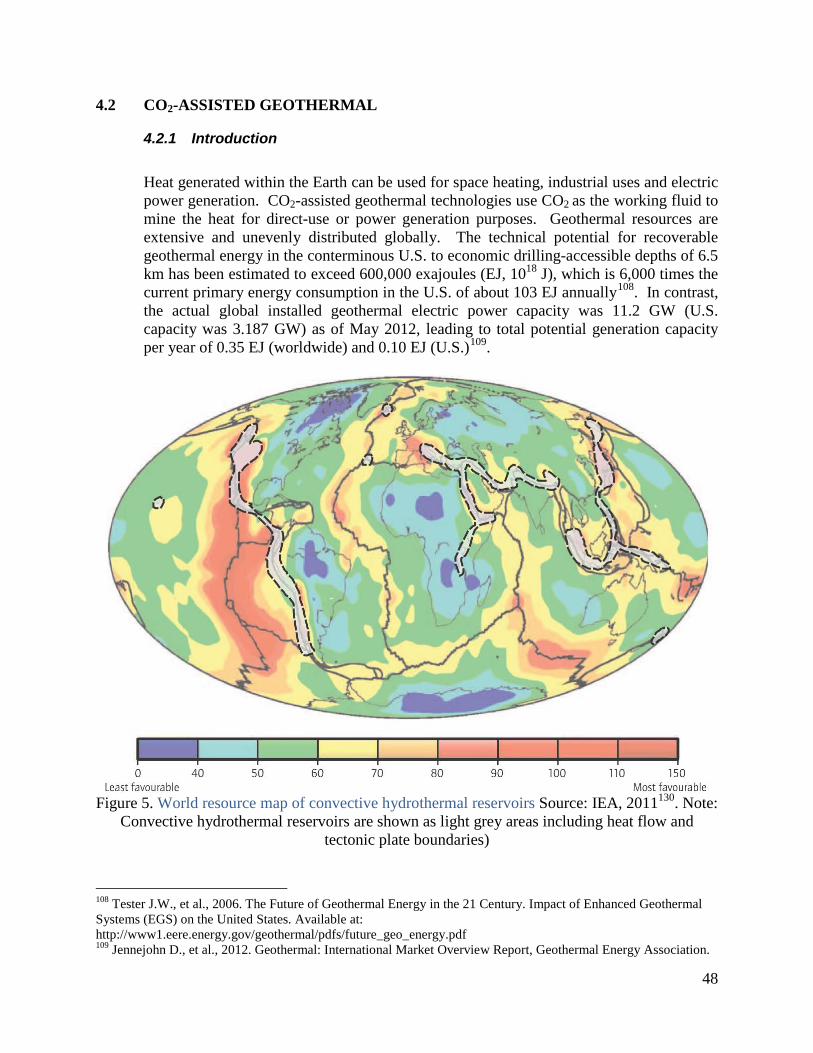
4.2 CO2-ASSISTED GEOTHERMAL
4.2.1 Introduction
Heat generated within the Earth can be used for space heating, industrial uses and electric power generation. CO2-assisted geothermal technologies use CO2 as the working fluid to mine the heat for direct-use or power generation purposes. Geothermal resources are extensive and unevenly distributed globally. The technical potential for recoverable geothermal energy in the conterminous U.S. to economic drilling-accessible depths of 6.5 km has been estimated to exceed 600,000 exajoules (EJ, 1018 J), which is 6,000 times the current primary energy consumption in the U.S. of about 103 EJ annually108. In contrast, the actual global installed geothermal electric power capacity was 11.2 GW (U.S. capacity was 3.187 GW) as of May 2012, leading to total potential generation capacity per year of 0.35 EJ (worldwide) and 0.10 EJ (U.S.)109.
Figure 5. World resource map of convective hydrothermal reservoirs Source: IEA, 2011130. Note:
Convective hydrothermal reservoirs are shown as light grey areas including heat flow and tectonic plate boundaries)
108 Tester J.W., et al., 2006. The Future of Geothermal Energy in the 21 Century. Impact of Enhanced Geothermal Systems (EGS) on the United States. Available at: http://www1.eere.energy.gov/geothermal/pdfs/future_geo_energy.pdf 109 Jennejohn D., et al., 2012. Geothermal: International Market Overview Report, Geothermal Energy Association.
48

Currently, large-scale commercial extraction of geothermal energy for energy production is limited to high-grade 'hydrothermal' resources found in active volcanic provinces shown in Figure 5. These systems have high-subsurface temperatures (typically exceeding 150 to 190 °C110) at shallow depths, and significant permeability allowing fluid circulation to occur naturally via well-connected fracture networks 108,111. In contrast, there is a considerably larger potential resource base to be found in amagmatic settings. These resources are generally deeper and are characterised by a different heat-source and much lower natural permeability. In order to extract heat from these systems the reservoirs must be engineered to allow the flow of fluid through the hot formation by enhancing existing fractures in the rock or creating new ones. This has led to these non-volcanic resources to be known as engineered (or enhanced) geothermal systems (EGS) The total amount of heat contained in amagmatic resources around the world has been estimated to be about 800 times that of the available volcanically driven 'hydrothermal' resource112,108. EGS systems are based on drilling boreholes to depths of 3 to 5 kilometers, injecting water at high pressure to enhance natural rock fractures or to create new ones, and extracting thermal energy by circulating water through a system of injection and production wells. The water can be provided by the deep reservoir itself without any supply of fresh water. For example, at the Soultz-sous-Forêt water-EGS pilot in France134, water (175 °C at 5000 m) from the deep reservoir is used to recover heat. The EGS concept is an outgrowth of several research programs conducted around the world starting in 1973. Because water is scarce in many arid regions throughout the world, and up to 5% of the injected water may be lost to the reservoir during circulation, D.W. Brown (2000)113 proposed that CO2 could be used as both heat transfer fluid and fracturing/shearing fluid instead of water in EGS developments. It has been suggested that the use of CO2 would reduce pumping costs, reduce scaling and silica dissolution issues, and result carbon sequestration in the crystalline basement rocks113. Supercritical CO2 (sc.CO2) has 60-75 percent lower specific heat (at 150 °C) compared to water. However, sc.CO2 also has significantly lower viscosity compared to water, zero surface tension, and can access fractures not wetted by water114. Supercritical CO2 also has a significantly higher mobility (density/viscosity) compared to water, and higher flow rates can be circulated through the turbine, resulting in an overall higher heat extraction rate, lower pumping costs, and higher net power output. There are two variations in CO2-assisted geothermal power production processes (see Figure 6):
• CO2-engineered geothermal systems (CO2-EGS)
110 Dickson, M., Fanelli, M., 2004. What is Geothermal Energy?, International Geothermal Association. Available at: http://www.geothermal-energy.org/geothermal_energy/what_is_geothermal_energy.html 111 Saar, 2012. The multi-functionality of geologically sequestered carbon dioxide: From geothermal energy extraction to renewable energy storage, Presented at Midwest Groundwater Conference, Oct 2, 2012. 112 Duchane, D., Brown, D.W., 2003. Hot Dry Rock (HDR) Geothermal Energy Research and Development at Fenton Hill, New Mexico. 113 Brown,D.W., 2000. A Hot Dry Rock Geothermal Energy Concept Utilizing Supercritical CO2 Instead of Water, Proceedings of the Twenty-Fifth Workshop on Geothermal Reservoir Engineering, Stanford University, Stanford, CA, January 24-26, 2000. Available at: http://www.geothermal-energy.org/pdf/IGAstandard/SGW/2000/Brown.pdf 114 GreenFire Energy, 2011. CO2 E™ (CO2-based Energy): Using CO2, pressure, and geothermal heat to provide clean, baseload electricity, energy storage and carbon sequestration.
49
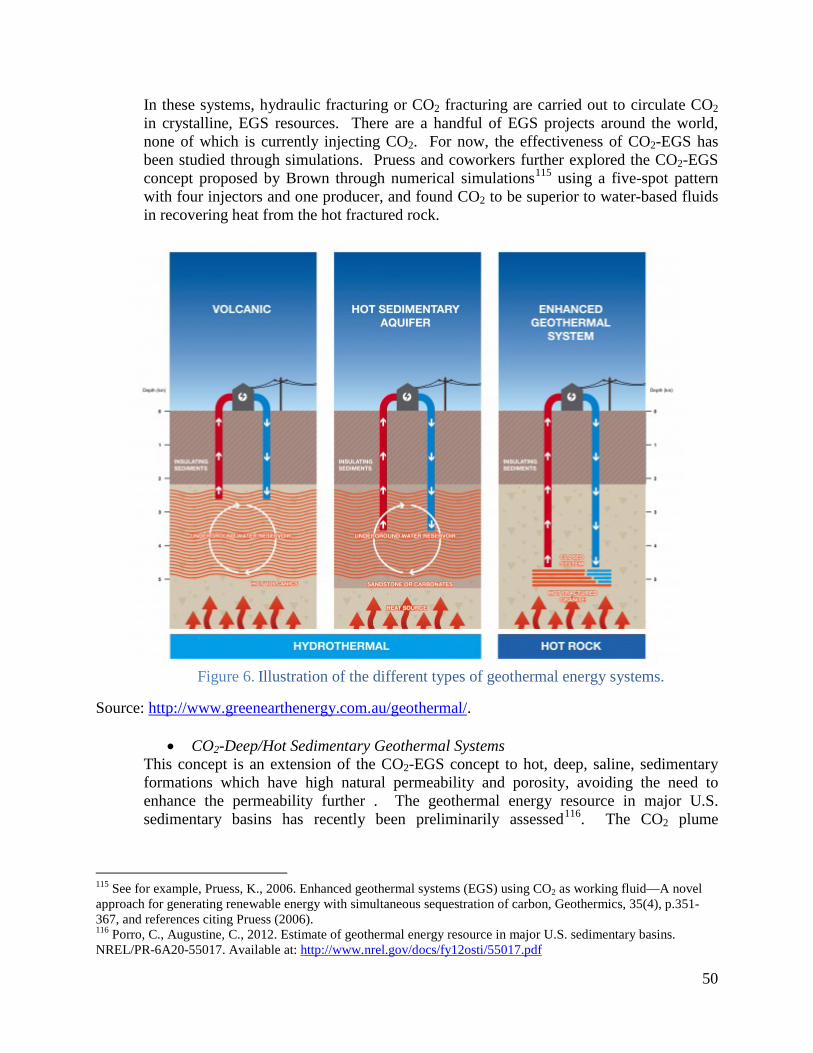
In these systems, hydraulic fracturing or CO2 fracturing are carried out to circulate CO2 in crystalline, EGS resources. There are a handful of EGS projects around the world, none of which is currently injecting CO2. For now, the effectiveness of CO2-EGS has been studied through simulations. Pruess and coworkers further explored the CO2-EGS concept proposed by Brown through numerical simulations115 using a five-spot pattern with four injectors and one producer, and found CO2 to be superior to water-based fluids in recovering heat from the hot fractured rock.
Figure 6. Illustration of the different types of geothermal energy systems.
Source: http://www.greenearthenergy.com.au/geothermal/.
• CO2-Deep/Hot Sedimentary Geothermal Systems This concept is an extension of the CO2-EGS concept to hot, deep, saline, sedimentary formations which have high natural permeability and porosity, avoiding the need to enhance the permeability further . The geothermal energy resource in major U.S. sedimentary basins has recently been preliminarily assessed116. The CO2 plume
115 See for example, Pruess, K., 2006. Enhanced geothermal systems (EGS) using CO2 as working fluid—A novel approach for generating renewable energy with simultaneous sequestration of carbon, Geothermics, 35(4), p.351-367, and references citing Pruess (2006). 116 Porro, C., Augustine, C., 2012. Estimate of geothermal energy resource in major U.S. sedimentary basins. NREL/PR-6A20-55017. Available at: http://www.nrel.gov/docs/fy12osti/55017.pdf
50

geothermal system (CPG) proposed by Saar and coworkers117,118,119 is an example of the
use of CO2 to extract heat from deep, hot, sedimentary formations with high thermal gradients. The concept is similar to CO2-EOR or saline aquifer storage in that the formation brine is displaced by CO2 during and before the start of power generation. The benefits of extracting geothermal energy from sedimentary rock are that the formations (referred to as reservoirs) are well characterized, and many geophysical data are already available from oil and gas logs. Drilling and reservoir fracturing techniques are proven in sedimentary environments. The drawbacks are that deep drilling is required to reach high temperatures, which is not yet commercial. Furthermore, formation permeability also typically decreases with depth, making deep drilling counterproductive.
4.2.2 Metrics The CO2 demand (or makeup rate) for the CO2-assisted geothermal processes has two components: the diffusive loss of CO2 to the formation/reservoir, and the reaction of scCO2 with rock minerals to form precipitates. Loss rates of 5% to 7% have been considered in models of CO2-EGS and CPG. The flow rate of CO2 and the amount of electricity generated vary with time, with the net-heat extraction and power output tailing off towards the end of the project. Typical quantities of additional CO2 injected per well from previous modeling studies are in the order of tens of kg CO2/s120. Total heat reservoir volumes of ~108
m3 are considered commercially viable for EGS121.
4.2.3 Current State of Technology
CO2-assisted geothermal systems consist of subsurface wells/reservoirs to allow the flow of CO2 through hot rocks or sedimentary rocks, and the surface heat transfer, power production, and pumping equipment. There are two types of cycles used for geothermal power generation: dry steam/flash cycles for temperatures > 180 °C, and binary cycles (e.g., organic Rankine cycles) for moderate to low temperatures122. Binary cycle power plants have an efficiency of 10% to 13%, which is lower than that of flash steam-water based geothermal plants. Recent developments of power cycles using CO2 as a working
117 Randolph, J.B. and Saar, M.O., 2011. Coupling carbon dioxide sequestration with geothermal energy capture in naturally permeable, porous geologic formations: Implications for CO2 sequestration. Energy Procedia, 4, 2206–2213. 118 Randolph, J.B. and Saar, M.O., 2011. Impact of reservoir permeability on the choice of subsurface geothermal heat exchange fluid: CO2 versus water and native brine. Proceedings for the Geothermal Resources Council 35th Annual Meeting: 23–26 Oct, 2011, San Diego, CA, USA. 119 Randolph, J.B., and Saar, M.O., 2011. Combining geothermal energy capture with geologic carbon dioxide sequestration, Geophysical Research Letters, 38, L10401, doi:10.1029/2011GL047265. 120 See for example, Ram Mohan, A., et al., Using CO2 from an IGCC plant as a heat transfer fluid for the extraction of geothermal energy for power generation from EGS. . Proceedings of the Thirty-Eighth Workshop on Geothermal Reservoir Engineering, Stanford University, Stanford, CA, February 11-13, 2013. 121 Pogacnik, J.A.,et al., 2013. CGS – Controlled wellbore-to-wellbore geothermal system flow. Proceedings of the Thirty-Eighth Workshop on Geothermal Reservoir Engineering, Stanford University, Stanford, CA, February 11-13, 2013 122 Eastman, A.D., Muir, M.P., 2013. CO2-EGS and the utilization of pressurized CO2 for purposes other than power generation. Proceedings of the Thirty-Eighth Workshop on Geothermal Reservoir Engineering, Stanford University, Stanford, CA, February 11-13, 2013.
51

fluid may further increase the heat-to-power conversion efficiency of heat sources at low temperatures123,124. CO2-assisted geothermal systems are at very early stages of development. Compared to CO2-EGS, the injection of CO2 in hot, sedimentary geothermal systems (e.g., CPG), has lower risks due to induced seismicity, but individual technologies such as deep well drilling, brine management, heat transfer, and power production need to be integrated and optimized in smaller-scale tests before large-scale tests can be conducted. There are two pilot-scale CO2-assisted geothermal tests being performed in the USA. GreenFire Energy plans to demonstrate CO2 injection in basement rocks at the St. Johns Dome in Arizona, leading to the production of 1 to 2 MW of geothermal electricity. The source of CO2 for this project is the gas produced from shallow overlying formations at the St. Johns Dome125. A pilot geothermal study on CO2 injection into deep, hot sedimentary formations is being conducted at the Southeast Regional Carbon Sequestration Partnership (SECARB) Cranfield site in Cranfield, Mississippi, USA126. Detailed site knowledge gained during earlier research-scale CO2 injections at the site will be used to plan and develop the CO2 injection into the deep (3.1 km), hot sediments using one injector and one producer. Recent simulations of CO2-EGS and hot-sedimentary geothermal systems have addressed the complex coupling between the flow, heat transfer, and geochemical reactions that occur when CO2 and residual water are circulated through the HDR system. Generally, several investigators note that the five-spot pattern is suitable for operation using scCO2 in EGS or CPG systems, and that the project lifetimes can exceed 25 years. Current experimental work at the laboratory scale is focussed on understanding rock-residual brine-CO2 interactions, and the two-phase flow of brine and supercritical CO2 through fractures and sedimentary rocks under conditions relevant to geothermal energy extraction127,128,129. Some key questions addressed by such studies include the change in
123 Robb, D., 2012. Supercritical CO2: The next big step? Turbomachinery International, v.53, no.5, p.22-28. 124 Sc.CO2 as a working fluid may improve the efficiency of power cycles, and is not supposed to be a means of mitigating climate change. 125 Muir, M.P., Eastman, A.D., 2013. Single-well low temperature CO2-based engineered geothermal system. Presented at the Geothermal Technologies Office 2013 Peer Review. 126 Freifeld, B., et al., 2012. Geothermal energy production coupled with CCS: a field demonstration at the SECARB Cranfield Site, Cranfield, Mississippi, USA. International Conference on Greenhouse Gas Technologies (GHGT-11), 18-22 November, 2012, Kyoto, Japan. 127 Mattson, E.D., et al., 2013. EGS-rock interactions with supercritical CO2 saturated with water, and water saturated with supercritical CO2. Proceedings of the Thirty-Eighth Workshop on Geothermal Reservoir Engineering, Stanford University, Stanford, CA, February 11-13, 2013 128 Smith M.M., et al., 2013. Experimental investigation of brine-CO2 flow through a Natural Fracture: Permeability increases with concurrent dissolution/precipitation reactions. Proceedings of the Thirty-Eighth Workshop on Geothermal Reservoir Engineering, Stanford University, Stanford, CA, February 11-13, 2013. 129 Petro M., et al., 2013. Experimental study of rock-fluid interactions using automated multi-channel system operated under conditions of CO2-based geothermal systems. Proceedings of the Thirty-Eighth Workshop on Geothermal Reservoir Engineering, Stanford University, Stanford, CA, February 11-13, 2013.
52

HDR or sedimentary formation permeability as a result of CO2 injection and CO2 leakage to the overlying strata.
4.2.4 Economics of the technology
The levelized costs of producing CO2-assisted geothermal heat or electricity are region specific and depend on the cost of CO2. Eastman and Muir122 note that the unit cost of water in the Western U.S. (~$0.1 to $0.2/t) is significantly lower than the cost of CO2 (~ $40/t to $100/t), leading to high first-fill and operational costs129. The costs of EGS and the costs of conventional hydrothermal plants may be considered as lower limiting estimates for CO2-assisted geothermal power systems. Levelized geothermal electricity generation costs for hydrothermal plants range from $50/MWhe to $110/MWhe depending on the heat content of the geothermal resource130. Estimated costs for EGS in the US and Europe vary from $100/MWhe to $190/MWhe and $250/MWhe to $300/MWhe respectively. The U.S. DOE aims to lower the LCOE of EGS electricity generation to $60/MWhe by 2030131. The cost of geothermal energy in Europe by 2015 is forecasted to be around 80€/MWhe. This value has to be compared with: - Between €50 to €130/MWhe for nuclear electricity - €40/MWhe for gas - €45/MWhe for coal - €40/MWhe for wind. In conclusion, the development of energy production from EGS systems is largely determined by its profitability. Currently, this production option is expensive because it requires very deep and costly boreholes and the financial risk is high due to the great uncertainty on reservoir productivity in unfamiliar geological media. The current scenarios do not expect an industrial deployment before 2020-2030. In this context and because of the additional cost induced by the introduction of CO2 into the system, the use of CO2 in the primary loop would raise the threshold of profitability of the geothermal installation.
4.2.5 Active International Projects, planned projects
In the US, GreenFire Energy was awarded a DOE grant in 2010 to implement a 1 to 2 MW-scale CO2-EGS project at the Springerville-St. Johns Dome in eastern Arizona. CO2 produced from shallow formations would be compressed and re-injected into granie/schist-containing basement rocks. The project involves drilling a test well to 6,500 ft depth, performing a huff-and-puff test by injecting and producing CO2 to obtain
130 IEA, 2011. Technology Roadmap: Geothermal Heat and Power,. Available at: http://www.iea.org/publications/freepublications/publication/Geothermal_Roadmap.pdf 131 http://www1.eere.energy.gov/geothermal/vision_mission_goals.html
53

and revise data on formation characteristics, and finally installing and testing a 1 to 2 MW geothermal electric generation system132. As discussed in section 4.2.3, the Cranfield geothermal pilot aims to demonstrate concurrent CO2 storage and geothermal electricity generation. Europe has 11 EGS projects under development in Croatia, France, Germany, Hungary, Ireland, United Kingdom, Slovakia, Slovenia, and Spain133. The lessons learned from the water-EGS pilot at Soultz-Sous-Forêts may be applicable for CO2-EGS projects in other parts of Europe and around the world134. There are 6 or more EGS projects of various styles which are at a range of stages of development in Australia. None of these projects are currently considering using CO2 as the primary fluid. Other countries such as India and China are known to be investigating potential EGS developments, although their exact progress and plans are unknown. It is not known if CO2-EGS is being considered.
4.2.6 Regulatory requirements for operations
One of the concerns with EGS projects is the potential for induced seismicity. For example, heightened public perceptions due to earthquakes generated concurrent with water injection at an EGS project in Basel, Switzerland resulted in the project's suspension in 2006. A protocol for addressing induced seismicity associated with EGS, based on experiences from several projects, was developed by the U.S. DOE to address the concerns of public and policymakers135. The steps suggested to address induced seismicity involve implementing a preliminary screening study, community outreach, selecting criteria for ground vibration and noise, establishing local seismic monitoring, quantifying the hazard from natural-, and induced-seismic events, characterizing the risk of induced-seismic events, and developing risk-based mitigation plans. Regulators may require the injection rates to be below that which can lead to observable seismicity. One example of regulatory requirements for CO2-EGS can be gleaned from the GreenFire Energy project which required mineral exploration, site access, well drilling, underground injection control (UIC) class V, and aquifer protection permits. This project is located in an area of low seismicity. A passive seismic network would be used for obtaining a seismic background before drilling and injection, and to monitor
132 Eastman, Muir, 2012. Update of a Trial of CO2-based Geothermal at the St. Johns Dome. Proceedings of the Thirty-Seventh Workshop on Geothermal Reservoir Engineering, Stanford University, Stanford, CA, Jan 30 - Feb 1, 2012. 133 Gibaud, J.P., 2011. Geothermal Electricity Market in Europe, European Geothermal Energy Council, Available at: http://egec.info/wp-content/uploads/2011/12/Geo-Elec-Market-Report-2011-.pdf 134 http://www.rets-project.eu/UserFiles/File/pdf/Best%20practices/ADEC/BP_SOULTZ_EN_v2.pdf 135 Majer, E., et al., 2012. Protocol for Addressing Induced Seismicity Associated with Enhanced Geothermal Systems, DOE/EE-0662. Available at: http://www1.eere.energy.gov/geothermal/pdfs/geothermal_seismicity_protocol_012012.pdf
54

fracture formation and fluid movement during fracturing, injection and production operations.
4.2.7 Technology advancement needs/gaps, RD&D needs
Although sc.CO2 can result in a higher-net power output compared to water, uncertainties associated with CO2 transport and reactions in the subsurface, long-term mechanical integrity of injection and production wells, reliability of the power plant, and reservoir response to CO2 injection may lead to the operators choosing water as a heat-exchange medium over sc.CO2. One of the main impediments to CO2-EGS is the risk of induced seismicity due to CO2 injection. Multiple monitoring technologies (e.g., microseismic, isotopes, tracers) need be deployed to ensure that the project managers have an accurate understanding of fracture development and flow in the subsurface. Community outreach and public acceptance are critical to project success. Creating and controlling permeability in basement rocks for large-scale CO2-EGS (wellbore-wellbore offset of ~100 m) to ensure that a large rock volume contacts the CO2 is a challenge121. If rock volume contacting the cold CO2 is inadequate, the project life would be limited due to the cooling of the active volume upon scCO2 circulation. Water management during EGS and CPG is a critical issue. Water produced from deep subsurface as a result of CO2 injection is typically saline, and may also contain high proportions of metal ions and needs to be properly handled and disposed. A surface reverse osmosis (RO) system may be used to produce fresh water, but requires additional capital and operating expenditures. As CO2 is injected in an EGS reservoir, the composition of the produced fluid would change from brine, brine+CO2, to CO2 because the injected CO2 displaces any existing fluids within the formation or fracture. In the case of CO2-EGS, water may be present as a result of fraccing performed to create the fracture flow paths. The displacement of brine by CO2 may lead to the precipitation of salts around the wellbore, reducing permeability136. Overcoming such problems may require the co-injection of CO2 and brine. A majority of the pressure drop for water-based EGS systems occurs as frictional losses in the reservoir. In contrast, the majority of pressure loss in CO2-EGS occurs in the wellbore. Wellbores need to be designed for CO2 to minimize pressure losses and pumping costs137.
136 Borgia, A., Pruess, K., Kneafsey, T.J., Oldenburg, C.M. and Pan L., 2012. Simulation of CO2-EGS in a fractured reservoir with salt precipitations, Proceedings of the ThirtySeventh Workshop on Geothermal Reservoir Engineering, Stanford University, Stanford, California. 137 Atrens A.D., et al., 2010. Electricity generation using a carbon-dioxide thermosiphon, Geothermics, v.39, p.161-169.
55

The water saturation of sc.CO2 has a detrimental effect on the conversion of silicates to carbonates and needs to be studied further as a carbonates may be formed in the reservoir formation and in wellbores, further increasing the risk of reduced permeability. Corrosion prevention certainly has to be considered and included in cost estimates when estimating the feasibility of CO2-EGS or CO2-CPG. Furthermore, the addition of even small impurities to CO2 changes the temperature and pressure at which the gas will transform to a liquid, solid or supercritical fluid. The addition of some gases (eg. N2, O2) provokes the transformation of the gas or the supercritical fluid into a liquid-gas mixture. These changes in phase behavior provoke corresponding changes in the transport and compressibility of the injected gas which can have dramatic effects on gas transport in the subsurface..
4.2.8 Potential for co-production
CO2-assisted geothermal has a high potential for the concurrent recovery of geothermal energy with simultaneous geologic storage of CO2, as discussed in the previous paragraphs. The extent to which this can be realized depends on the developments in each technology area and public perceptions of the injection of CO2 in the subsurface.
5. SUMMARY AND CONCLUSIONS
This report provides a more detailed summary and analysis of selected options to utilize carbon dioxide (CO2) from the Phase I report. As identified in the Phase I report, market potential for many of the utilization options is limited (i.e., small, and/or ‘niche’), with some exceptions (e.g., enhanced oil recovery - not a subject of this report - or the conversion of CO2 to fuels or chemicals). However, when taken cumulatively, the sum of these options can provide a number of technological mechanisms to utilize CO2 in a manner that has potential to provide economic benefits for fossil fuel fired power plants or industrial processes: As such, they may well be a means of supporting the early deployment of carbon capture and storage (CCS) in certain circumstances and accelerating deployment. CO2 has the potential to be used in the extraction of other energy resources, as a working fluid, and as a chemical feedstock. These applications have some market potential, although the technology maturity varies widely. Some applications, such as urea production, already have an existing global market, while others have the potential for significant markets but technical and economic challenges must be addressed.
5.1 MAIN TECHNICAL CHALLENGES The primary technical challenges surrounding several of the CO2 utilization options identified in this report center around research, development, and demonstration (RD&D) efforts to validate the utilization of CO2 as an option, reduce the cost and improve the efficiency.
56

The main technical challenges for the specific options are: CO2 for enhanced gas recovery (CO2-EGR): Numerous desk studies on CO2-EGR exist in the literature, but only a very limited number of field tests has been performed so far (both for CO2-EGR, as well as for N2-EGR). In general these field tests, with the nearly depleted K12-B gas field in the Dutch offshore sector being the most well-known (if not the only one), have injected too little amounts of CO2 to draw firm conclusions on the EGR potential. The primary technical challenges are to predict (early) breakthrough of CO2 (or any other driving gas like N2) at production wells, to predict the mixing of the gasses and to monitor the process. The lack of experience around this technology makes it difficult to assess its economic potential, though recently two projects in preparation for industrial (N2-)EGR have been announced, demonstrating at least the commercial interests. CO2 for shale gas recovery: Laboratory studies and some field tests have been performed using CO2 to preferentially displace methane and adsorb on shale formations. Further, tests have been performed using CO2 as a replacement fluid for water in the fracturing process. The primary technical issue with CO2 for shale gas recovery, utilizing CO2 as both the fracturing fluid and for methane displacement, is the lack of testing to understand the dynamics of the process and assess the costs. CO2 for shale oil recovery: The primary issue with utilizing CO2 as a fracturing fluid is cost relative to other alternatives. The technical challenges associated with CO2 use are the lack of appropriate viscosity enhancers that can improve stimulation operations or open opportunities for otherwise uneconomic reservoirs. Urea production: Urea is commercially produced today and there are no significant technical challenges. The technical challenges that do exist for urea are primarily related to the feedstock that is used to produce hydrogen and ammonia. For example, coal-derived feedstock is typically at the higher end of current global prices. Technology improvements in synthesis gas production are needed, but not advancements in urea synthesis/production. Algal routes to fuel, chemicals and animal feed stocks: The key technical challenges associated with using CO2 to enhance the cultivation of microalgae species as a precursor to various fuels, chemicals and animal feed stock are maximizing the lipid productivity, addressing possible contamination issues and developing cost-effective harvesting, processing, and dewatering techniques. Also, different system designs (e.g., open raceway ponds versus photobioreactors) pose different challenges relative to land use and process control (ponds), and gas-liquid mass transfer, prevention of wall-growth and energy efficiency for mixing/cooling (photobioreactors).
57

CO2 utilization in greenhouses: The primary technical issues with utilization of CO2 in greenhouses are their integration with various CO2 sources and quantifying the potential regional benefits from this utilization option. Aggregate and secondary construction material production: The key technical challenge for the utilization of CO2 for the production of building materials such as concrete is to improve the rate of reaction for the conversion/synthesis to optimize the process and product yields. Another challenge is ensuring that the products meet established cost and technical performance requirements and standards. CO2-assisted geothermal systems (CO2-EGS): There are several issues related to the use of CO2 in enhanced geothermal systems. These include limited knowledge of the geochemical impacts of CO2 and long-term retention of CO2 in the reservoir and the design and optimization of systems that utilize CO2 for heat extraction and subsequent power generation. Similar to other areas of utilization or storage of CO2 in the subsurface discussed in this report, CO2-EGS is not well understood.
58

5.2 RECOMMENDATIONS In summary, there are a wide range of CO2 utilization options available, which can serve as additional mechanisms for deployment and commercialization of CCS by providing an economic return for the capture and utilization of CO2. This Phase II report results in several recommendations that can assist with the continued development and deployment of non-EOR CO2 utilization options in this context.
1. For technologies which are commercially and technologically mature, such as urea production and utilization in greenhouses, efforts should be on demonstration projects. For urea production, the focus should be on the use of non-traditional feedstocks (such as coal) or ‘polygeneration’ concepts (e.g., those based on integrated gasification combined cycle (IGCC) concepts) which can help facilitate CCS deployment by diversifying the product mix and providing a mechanism for return on investment. For utilization in greenhouses, new and integrated concepts that can couple surplus and demand for CO2 as well as energy, thus optimizing the whole energy and economic system would be valuable.
2. Efforts that are focused on hydrocarbon recovery, such as CO2 for enhanced gas recovery
(via methane displacement), or CO2 utilization as a fracturing fluid, should focus on field tests to validate existing technologies and capabilities, and to understand the dynamics of CO2 interactions in the reservoir. R&D efforts on CO2 as a fracturing fluid should focus on the development of viscosity enhancers that can improve efficiency and optimize the process. Issues such as wellbore construction, monitoring and simulations should leverage those tools and technologies that currently exist in industry or are under development through existing CCS R&D efforts.
3. For algal routes to fuels and aggregate/secondary construction materials production, the
primary focus should be on R&D activities that address the key techno-economic challenges previously identified for these particular utilization options. Independent tests to verify the performance of these products compared to technical requirements and standards should be conducted. Support of small, pilot-scale tests of first generation technologies and designs could help provide initial data on engineering and process challenges of these options.
4. For CO2-assisted geothermal systems, more R&D and studies are necessary to address
the subsurface impacts of utilizing CO2 in this application. Additionally, small pilot-scale tests could provide some initial data on actual operational impacts and key engineering challenges that need to be addressed.
5. Finally, more detailed technical, economic, and environmental analyses should be
conducted to better quantify the potential impacts and economic potential of these
59

technologies and to clarify how R&D could potentially expand the market for these utilization options (e.g., in enhanced gas recovery) and improve the economic and environmental performance of the system. A holistic approach, incorporating several distinct perspectives, is important.
60