copyright is owned by the author of the thesis. …...wairapapa doc office, and phil casey and john...
TRANSCRIPT

Copyright is owned by the Author of the thesis. Permission is given for a copy to be downloaded by an individual for the purpose of research and private study only. The thesis may not be reproduced elsewhere without the permission of the Author.
New Zealand Passerines: a contribution to Passerine
phylogeny
A thesis presented in partial fulfilment of the requirements for the Degree of
Master of Science (MSc) in Genetics
Massey University,
Palmerston North, New Zealand
RYAN ENGLAND
2013

ii

iii
Abstract
The passerines are the largest avian order, with over 6000 species. There is strong
evidence to suggest that this group arose in Australasia, with most deep lineages located
in Australia, New Zealand and Papua New Guinea. The deepest lineage is the New
Zealand wrens, which diverged from the main passerine lineage, possibly around 80
mya. The second split between the suboscines (mainly new world distribution) and
oscines (Australasian origin) is well established. Within the oscines there are a number
of small basal lineages, all located within Australasia, then around 45 mya the large
division into the Passerida and the Core Corvoidea occurred. The Core Corvoidea have
undergone many rapid radiations early on in their history, which has made resolving the
relationships within the group complicated. The Passerida are classified into three main
superfamilies, but the relationships of these three are unresolved, and the monophyly of
each has been questioned.
Next generation Illumina sequencing was used to sequence the mitochondrial
genomes of six native passerine species. We report a sequenced mitochondrial genome
from a representative of each New Zealand passerine family, apparently a first for any
country. For four new species (the fernbird, tomtit, pipit and waxeye) the mitochondrial
genomes have been fully sequenced while there is partial mitochondrial genome
sequence for two other species (the browncreeper and bellbird). These have been
combined with the mitochondrial genome sequences of another 72 passerines including
seven previously unpublished genomes. Phylogenetic trees have been produced using
both maximum likelihood and Bayesian analyses, and these have been used to address a
number of questions surrounding the phylogeny of the passerines.
The placements of the native New Zealand species are highlighted, and in many
cases it confirms the results of earlier studies. The results suggest consideration needs to
be given for formally classifying the Petroicidae, Callaeidae and Notiomystidae as basal
Passerida, but whether these three families form a separate monophyletic group is still
unresolved. Part of the polytomy at the base of the Core Corvoidea has been resolved.
The monophyly of each of the three Passerida superfamilies have been confirmed, but it
is still unclear which of the three superfamilies branched off first, and there is no
support for the suggestion that the Paridae are their own fourth superfamily. A need for

iv
the formation of an extensive collection of tissue/DNA samples from New Zealand’s
vertebrates has been identified, and a number of suggestions for the use of
mitochondrial genome sequence when studying passerine phylogeny have been made.

v
Acknowledgments
Firstly I thank my co-supervisors David Penny and Gillian Gibb. David I appreciate
all the guidance and support over the last two years. Thank you Gill for originally
showing me the ropes and then how to build trees. To Trish McLenachan thanks for all
the help in the lab, organising samples and sequencing, and proofreading my work. To
Bennet McComish for the assembly of the fernbird mitochondrial genome. Lesley
Collins for teaching me the basics of bioinformatics.
Thanks to Lara Shepherd and Gillian Stone from Te Papa, Sandra Burles from the
Wairapapa DoC office, and Phil Casey and John Ewen, for providing tissue and blood
samples.
Thanks to the George Mason Scholarship and the Harwood Farm Trust for the
financial support.
To my family and friends thank you for all the support over the six years I have
been at Massey. I have made a lot of good friends and have some brilliant memories. To
Mum and Dad thanks for always making sure we were well fed, the help with shifting
flats, and all the years of making sure I pushed myself. I would not be the person I am
today without you two. To Ethan for being my brother, friend and fellow front rower.
You have always been there with me, either helping me out of or escalating the havoc
we tend to get ourselves into. And to Alicia thank you so much, you are my best friend
and I cannot wait to begin the next part of our journey together.

vi
Table of Contents
Abstract ........................................................................................................................................ iii
Acknowledgments ......................................................................................................................... v
Table of Contents ......................................................................................................................... vi
List of Figures .............................................................................................................................. viii
List of Tables .................................................................................................................................. x
Abbreviations................................................................................................................................ xi
1 Introduction ........................................................................................................................... 1
1.1 Passerines ...................................................................................................................... 1
1.1.1 Origin ..................................................................................................................... 1
1.1.2 The New Zealand wrens and suboscines ............................................................... 2
1.1.3 The basal oscines ................................................................................................... 8
1.1.4 The Core Corvoidea ............................................................................................. 11
1.1.5 Basal Passerida?................................................................................................... 13
1.1.6 The Passerida ....................................................................................................... 14
1.2 New Zealand’s passerines ........................................................................................... 18
1.3 Use of molecular data in phylogeny ............................................................................ 22
1.4 Project outline ............................................................................................................. 26
1.5 Overview of results ...................................................................................................... 27
2 Materials and Methods ....................................................................................................... 29
2.1 DNA extraction ............................................................................................................ 29
2.2 DNA amplification ........................................................................................................ 29
2.3 Capillary sequencing and confirmation of species ...................................................... 30
2.4 Illumina Sequencing .................................................................................................... 30
2.5 Genome assembly ....................................................................................................... 32
2.5.1 Pipit and tomtit .................................................................................................... 32
2.5.2 Fernbird ............................................................................................................... 33
2.5.3 Waxeye, browncreeper and bellbird ................................................................... 34
2.5.4 Completing the mitochondrial genomes ............................................................. 35
2.5.5 Transcriptome data ............................................................................................. 36
2.6 Phylogenetic analysis ................................................................................................... 37
3 Results ................................................................................................................................. 39

vii
3.1 DNA extraction and next generation sequencing sample preparation. ..................... 39
3.2 Illumina sequencing results ........................................................................................ 42
3.3 Genome assembly ....................................................................................................... 48
3.3.1 Pipit ..................................................................................................................... 48
3.3.2 Tomtit .................................................................................................................. 51
3.3.3 Fernbird ............................................................................................................... 55
3.3.4 Waxeye ................................................................................................................ 56
3.3.5 Browncreeper ..................................................................................................... 59
3.3.6 Bellbird ................................................................................................................ 61
3.4 Transcriptome reads ................................................................................................... 64
3.5 Phylogenetic analysis .................................................................................................. 64
4 Discussion ............................................................................................................................ 73
4.1 DNA extraction and Illumina sequencing .................................................................... 73
4.2 Phylogeny .................................................................................................................... 75
4.3 Molecular data ............................................................................................................ 82
4.4 Phylogeny an insight into physical characteristics ...................................................... 87
4.5 Conclusions ................................................................................................................. 89
5 References .......................................................................................................................... 91
6 Appendices .......................................................................................................................... 99
6.1 Supplementary tables ................................................................................................. 99
6.2 Supplementary figures .............................................................................................. 102

viii
List of Figures
Figure 1: Simplified view of phylogeny of the passerines showing the main lineages in the order .... 3
Figure 2: Network of Bayesian analysis of the passerines, based on mitochondrial data. ............... 10
Figure 3: The differing opinions on the phylogeny of the superfamilies of the Passerida. ................ 15
Figure 4: Electrophoresis of DNA extractions. ................................................................................... 40
Figure 5: Fast Q screen results for the browncreeper, bellbird, and waxeye reads. .......................... 46
Figure 6: Probability of base calling error along reads in fernbird mix. ............................................ 47
Figure 7: Length of fernbird mix reads after quality trim. ................................................................. 47
Figure 8: Pipit Mitochondrial Genome. .............................................................................................. 51
Figure 9: Tomtit mitochondrial genome. ........................................................................................... 54
Figure 10: Fernbird mitochondrial genome. ...................................................................................... 56
Figure 11: Waxeye mitochondrial genome.. ...................................................................................... 58
Figure 12: Browncreeper partial mitochondrial genome. ................................................................. 60
Figure 13: Bellbird and Browncreeper Blast2GO results from Velvet contigs ................................... 62
Figure 14: Bellbird partial mitochondrial genome. ............................................................................ 63
Figure 15: Maximum likelihood phylogenetic analysis tree from all 79 passerine species using
mitochondrial genome data (13588bp). ............................................................................................ 65
Figure 16: Bayesian analysis phylogenetic tree from all 79 passerine species using
mitochondrial genome data (13588bp).. ........................................................................................... 66

ix
Supplementary Figures
Supplementary Figure 1: Full Maximum Likelihood tree of 83 species. .......................................... 102
Supplementary Figure 2: Maximum Likelihood consensus network showing split of the three
suborders of the Passerines. ........................................................................................................... 103
Supplementary Figure 3: Maximum Likelihood consensus network of the Core Corvoidea. .......... 103
Supplementary Figure 4: Maximum Likelihood phylogenetic tree from 76 passerine species. ...... 104
Supplementary Figure 5: Maximum Likelihood consensus network showing split of the basal
Passerida (Australasian robins, New Zealand wattlebirds and hihi) from the Passerida. .............. 105
Supplementary Figure 6: Maximum Likelihood phylogenetic tree from all 63 Passerida species
(including basal Passerida).. ........................................................................................................... 106
Supplementary Figure 7: Maximum Likelihood phylogenetic tree from 61 Passerida species
(including basal Passerida). ............................................................................................................ 107
Supplementary Figure 8: Maximum Likelihood consensus network of the three superfamilies of
the Passerida. .................................................................................................................................. 108
Supplementary Figure 9: Maximum Likelihood consensus network of the superfamily
Sylvioidea.. ...................................................................................................................................... 109
Supplementary Figure 10: Maximum Likelihood consensus network of the superfamily
Sylvioidea. ....................................................................................................................................... 109
Supplementary Figure 11: Maximum Likelihood consensus network of the superfamily
Muscicapoidea. ............................................................................................................................... 110
Supplementary Figure 12: Maximum Likelihood consensus network of the superfamily
Passeroidea. .................................................................................................................................... 111

x
List of Tables
Table 1: Passerines with sequenced mitochondrial genomes. ............................................................ 5
Table 2: All native New Zealand Passerine populations and their conservation status. ................... 19
Table 3: The species extracted for this study. .................................................................................... 40
Table 4: Samples used for Illumina HiSeq sequencing at BGI. ........................................................... 41
Table 5: Samples used for Illumina MiSeq sequencing at NZGL.. ...................................................... 42
Table 6: Amount of data received back from BGI and NZGL after Illumina sequencing. .................. 42
Table 7: Fast QC quality scores of pipit, tomtit, waxeye, browncreeper and bellbird reads. ............ 44
Table 8: K-mer sweep of the pipit reads. ........................................................................................... 48
Table 9: Pipit contigs using K-mers 67 bases in length. ..................................................................... 49
Table 10: Pipit contigs using K-mers 41 bases in length. ................................................................... 49
Table 11: K-mer sweep of the tomtit reads.. ..................................................................................... 52
Table 12: Tomtit contigs using K-mers 71 bases in length. ............................................................... 52
Table 13: K-mer sweep of the waxeye reads.. ................................................................................... 57
Table 14: K-mer sweep of the browncreeper reads.. ......................................................................... 59
Table 15: K-mer sweep of the bellbird reads. .................................................................................... 61
Table 16: Mitochondrial genome genes extracted from the brain transcriptome reads.. ................ 64
Supplementary Tables
Supplementary Table 1: List of all primers used during study. .......................................................... 99
Supplementary Table 2: Estimation of DNA concentration using Nanodrop for the long range
PCR products of the waxeye. ........................................................................................................... 101

xi
Abbreviations
BGI - Beijing Genome Institute
BLAST - basic local alignment search tool
bp - base pairs
BWA - Burrows Wheeler Alignment
CI - Chatham Islands of New Zealand
DNA - Deoxyribonucleic acid
dNTP - Deoxyribonucleotide triphosphate
DoC - Department of Conservation (New Zealand)
kb - Kilo base (1000bp)
K/PG - Cretaceous Paleogene boundary
MGS - Massey University Genome Services
mtDNA - mitochondrial DNA
mya - million years ago
NI - North Island of New Zealand
NZ - New Zealand
PCR - Polymerase chain reaction
PNG - Papua New Guinea
RNA - Ribonucleic acid
rRNA - Ribosomal RNA
SapExo - Shrimp alkaline phosphatase and exonuclease
SI - South Island of New Zealand
tRNA - Transfer RNA

xii

1
1 Introduction
This introduction provides the background for this study on the phylogeny of the
avian order the passerines. First, an overview is given of what is known about the
phylogeny of the passerines, covering the group’s origin before focusing on the
different groups within the order: the New Zealand wrens, the suboscines, the deep
lineages within the oscines, the Core Corvoidea and the Passerida. How this project
relates to the New Zealand native passerines and their conservation is then examined,
followed by a summary of the molecular techniques used to study phylogeny. Last, an
outline of the project and a brief overview of the results are given.
1.1 Passerines
1.1.1 Origin
The passerines are the largest avian order; with almost 6,000 species; this order
contains around sixty percent of all living bird species (1, 2). The passerines are divided
into three main lineages: the New Zealand wrens, the suboscines and the oscines (see
later). The passerines likely evolved in Gondwana (1, 3), and species diversity is highest
in Australasia - defined as Australia, New Zealand (NZ) and Papua New Guinea (PNG).
Despite northern hemisphere fossils being better known generally, the oldest passerine
fossils of these birds are found in the southern hemisphere around 55 million years ago
(mya) in Queensland Australia, whilst the oldest passerine fossils found in the northern
hemisphere are only 34-30 million years old (1, 4). There are very few avian fossils that
have been dated to before the Cretaceous Paleogene boundary (K/Pg), 66 mya (5).
Some authors suggest this shows that there were few bird lineages during the
Cretaceous and that the majority of the avian lineages did not evolve until the Paleogene
(5). Overall, avian fossils have not preserved very well, which may be due to the
structure of avian bones which are pneumatised (hollow), so are relatively light. A study
using 80 complete avian mitochondrial genomes gives a divergence time of the
passerines from the other birds at between 78-95 mya (5). This precedes the K/PG
boundary, suggesting that the majority of the avian orders had formed by this time (5-7).
Passerines were certainly present in Australasia by the Eocene (56-34 mya), and by the
2
late Oligocene (~23 mya) many of the current passerine lineages were present (4). The
ancestor of all passerines is assumed to be insectivorous (8), but the passerines now fill
many different habitats, with multiple feeding types, and occupy every continent except
Antarctica.
Which group of birds are the closest relative to the passerines is controversial, and
there are as many as five different hypotheses answering this question (9). The
passerines were first thought to have been the sister lineage to a group of avian orders
containing the Falconidae (falcons), Rallidae (rails), Gruiformes (cranes) and
Cariamidae (seriemas) (10). Morphological data (11) suggested the passerines were
grouped with the ‘woodkings’ (Piciformes and Coraciiformes). Ericson et al., (12)
found, using nuclear loci, that the Passeriformes grouped with 3 other orders; the
Psittaciformes (parrots), Falconidae, and Cariamidae. Support for this was found using
19 nuclear loci in Hackett et al. (13), with strong support for the closest relatives to the
passerines being the Psittaciformes. Thirty independent noncoding nuclear loci used by
Wang et al. (9), provided further support for the phylogeny seen in Hackett et al. Suh et
al. (14), also found strong support from retro-transposon insertions for placing the
parrots as the passerines closest relative. Pratt et al., (7) stated that the morphological
and mitochondrial data did not support this phylogeny; instead they suggested the
Cuculiformes (cuckoos) were the closest relative to the passerines, and this view was
supported by Gibb (15). Pacheco et al. (5), again found no support for the Hackett
phylogeny; this study using 80 avian mitochondrial genomes had weak support for the
grouping of the passerines with the ‘woodkings’. Overall this question is unresolved
with no study having undisputable support for either scenario. It appears that what the
nuclear data is suggesting (passerines with parrots) differs from what the mitochondrial
and morphological data is suggesting (passerines with ‘woodkings’ or cuckoos). But for
this study the Psittaciformes will be used as the out-group for the passerines.
1.1.2 The New Zealand wrens and suboscines
Harrison et al. (16) sequenced the mitochondria of the New Zealand rifleman
Acanthisitta chloris; when compared to the sequence of other passerines it, as expected,
fitted neither into the suboscines or oscines (Figure 1), but belongs to its own third
suborder, the Acanthisitti. This is supported by multiple studies using both nuclear and
mitochondrial data (1, 2, 13).

3
Figure 1: Simplified view of phylogeny of the passerines showing the main lineages in the order
The suborder Acanthisitti is known as the New Zealand wrens, and comprises two
extant species, the rifleman (Acanthisitta chloris), and the rock wren (Xenicus
gilviventris), along with four other species which have become extinct since human
contact (4). Worthy et al. (4) describes a 7th species, the Kuiornis indicator for which
fossils were found in Otago. These fossils have been dated to the early Miocene (19-16
mya), and are the oldest passerine fossils found in New Zealand. Worthy et al., (4)
created a morphological tree comparing this fossil with all other Acanthisitti, based on
features of the bones. The tree placed Kuiornis indicator as the sister taxon to all other
Acanthisitti sampled by Worthy et al. (4).
The divergence of the Acanthisitti from the main passerine lineage is thought to
have occurred when Zealandia split from the rest of Gondwana (1, 17), estimated to
around 80 mya. The Acanthisitti is considered part of the ancient endemic component of
New Zealand birds (4), lineages that have inhabited Zealandia/New Zealand since the
split from the supercontinent. But recent studies (4) have suggested that Zealandia was
not completely separated from the supercontinent until around 55 mya, when the Cato
trough formed (18). Other groups suggest that the whole continent of Zealandia was
completely submerged around 25-22 mya (19). At the very most, only ~18% of current

4
New Zealand was above water at that time (20), all of it being low lying. I infer from
this that most, if not all, fauna and flora would have had to disperse to New Zealand
since. Therefore the estimation of 80 mya being that date Zealandia spit from
Gondwana may have no relevance to the divergence time of the New Zealand wrens
from the rest of the passerines; and as this event has been used to calibrate more recent
divergence events in the passerines (1, 21, 22) a different calibration point may need to
be used for future estimations. Pratt et al., (7) used different historical points to calibrate
avian divergence times and estimated the Acanthisitti split from the passerines around
61 mya. But for simplicity all the other divergence dates mentioned in this review have
been estimated using the 80 mya calibration point. This is because the vast majority of
passerine phylogenetic studies use the 80 mya calibration point, and I have copied these
dates directly into my thesis. Therefore there is some uncertainty surrounding these
dates, but they do proved a rough guide to the order of events. Ideally they would all be
estimated again using more credible calibration points, but this is beyond the scope of
my thesis.
Soon after the New Zealand wrens split off (between 67-81 mya) the remaining
passerines diverged into two main suborders: the oscines (Passeri) and the suboscines
(Tyranni) (1, 5). At this time South America was still attached to Australia, Africa and
Antarctica, known as the supercontinent Gondwana, and South America did not
separate until around 30-40 mya (23). The suboscines moved into what is now present
day South America and around 60-65 mya they diverged into two clades (1, 5). The
first, the Tyrannides, are now located within the new world, particularly South America,
and is the larger of the two clades (1). The Tyrannides contain the ovenbirds,
woodcreepers, antbirds, antthrushes, antpittas, tapaculos, gnateaters, gnatpittas, tyrant-
flycatchers, tityras, contigas and manakins. The second, the Eurylaimides, is a smaller
old world clade which originated in Africa and has expanded into Asia around the
Indian Ocean (1). The Eurylaimides consists of the broadbills, asities and pittas. There
are currently only two suboscines with fully sequenced mitochondrial genomes (the
fuscous flycatcher and broadbill), one from each clade, and a third (golden-collared
manakin) with mitochondrial transcriptome data (Table 1).

5
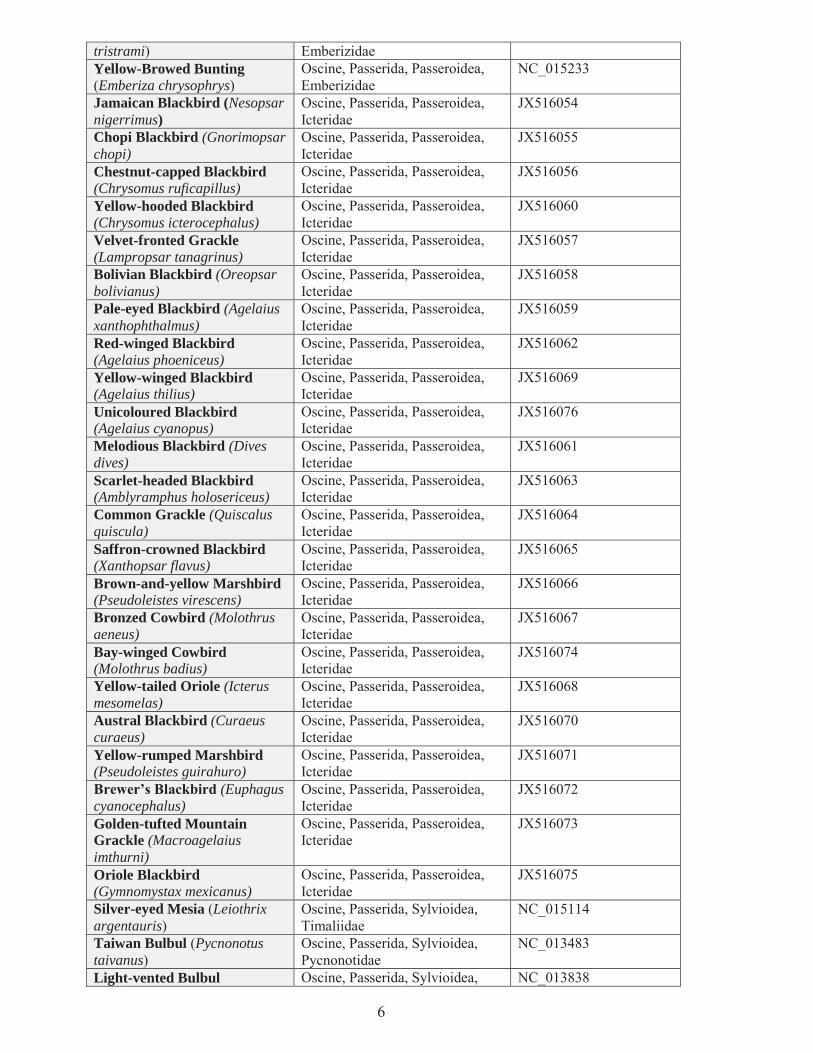
Table 1: Passerines with sequenced mitochondrial genomes. List of all passerine species (common and scientific names) with a sequenced mitochondrial genome or transcriptome, where they are classified on passerine tree, what type of data and where sourced from, including GenBank accession number. Species Classification Type and source NZ Rifleman (Acanthisitta chloris)
Acanthisitti, Acanthisittidae Near complete, GenBank, AY325307
Fuscous Flycatcher (Cnemotriccus fuscatus)
Suboscine (Tyrani), Tyrannidae NC_007975
Broadbill (Smithornis sharpie) Suboscine (Tyrani), Eurylaimidae NC_000879 Lyrebird (Menura novaehollandiae)
Oscine, Menuridae NC_007883
Tui (Prosthemadera novaeseelandiae)
Oscine, Meliphagoidea, Meliphagidae
Complete, Gillian Gibb (15), KC545404
Grey Warbler (Gerygone igata)
Oscine, Meliphagoidea, Acanthizidae
Complete, Briar Smith, unpublished, KC545399
European Magpie (Pica pica) Oscine, Core Corvoidea, Corvidae NC_015200 Azurawinged Magpie (Cyanopica cyanus)
Oscine, Core Corvoidea, Corvidae NC_015824
Rook (Corvus frugilegus) Oscine, Core Corvoidea, Corvidae NC_002069 Mongolian Ground Jay (Podoces hendersoni)
Oscine, Core Corvoidea, Corvidae NC_014879
Eurasian Jay (Garrulus glandarius)
Oscine, Core Corvoidea, Corvidae NC_015810
NZ fantail (Rhipidura fuliginosa)
Oscine, Core Corvoidea, Rhipiduridae
Complete, Briar Smith, unpublished, KC545405
Saddleback (Philesturnus carunculatus)
Oscine, Callaeidae Complete, Gillian Gibb (15), KC545403
Hihi (Notiomystis cincta) Oscine, Notiomystidae Complete, Gillian Gibb (15), KC545400
Myna (Sturnus tristis) Oscine, Passerida, Muscicapoidea, Sturnidae
NC_015195
White-cheeked Starling (Sturnus cineraceus)
Oscine, Passerida, Muscicapoidea, Sturnidae
NC_015237
Red-billed Starling (Sturnus sericeus)
Oscine, Passerida, Muscicapoidea, Sturnidae
NC_014455
Crested Myna (Acridotheres cristatellus)
Oscine, Passerida, Muscicapoidea, Sturnidae
NC_015613
Common hill Myna (Gracula religiosa)
Oscine, Passerida, Muscicapoidea, Sturnidae
NC_015898
Siberian Rubythroat (Luscinia calliope)
Oscine, Passerida, Muscicapoidea, Muscicapidae
NC_015074
Blue and white Flycatcher (Cyanoptila cyanomelana)
Oscine, Passerida, Muscicapoidea, Muscicapidae
NC_015232
Yellow-rumped Flycatcher (Ficedula zanthopygia)
Oscine, Passerida, Muscicapoidea, Muscicapidae
NC_015802
Grey-Capped Finch (Carduelis sinica)
Oscine, Passerida, Passeroidea, Fringillidae
NC_015196
Siskin (Carduelis spinus) Oscine, Passerida, Passeroidea, Fringillidae
NC_015198
Indigo Bird (Vidua chalybeata) Oscine, Passerida, Passeroidea, Viduidae
NC_000880
Zebrafinch (Taeniopygia guttata)
Oscine, Passerida, Passeroidea, Estrildidae
NC_007897
Tristram’s Bunting (Emberiza Oscine, Passerida, Passeroidea, NC_015234
6
tristrami) Emberizidae Yellow-Browed Bunting (Emberiza chrysophrys)
Oscine, Passerida, Passeroidea, Emberizidae
NC_015233
Jamaican Blackbird (Nesopsar nigerrimus)
Oscine, Passerida, Passeroidea, Icteridae
JX516054
Chopi Blackbird (Gnorimopsar chopi)
Oscine, Passerida, Passeroidea, Icteridae
JX516055
Chestnut-capped Blackbird (Chrysomus ruficapillus)
Oscine, Passerida, Passeroidea, Icteridae
JX516056
Yellow-hooded Blackbird (Chrysomus icterocephalus)
Oscine, Passerida, Passeroidea, Icteridae
JX516060
Velvet-fronted Grackle (Lampropsar tanagrinus)
Oscine, Passerida, Passeroidea, Icteridae
JX516057
Bolivian Blackbird (Oreopsar bolivianus)
Oscine, Passerida, Passeroidea, Icteridae
JX516058
Pale-eyed Blackbird (Agelaius xanthophthalmus)
Oscine, Passerida, Passeroidea, Icteridae
JX516059
Red-winged Blackbird (Agelaius phoeniceus)
Oscine, Passerida, Passeroidea, Icteridae
JX516062
Yellow-winged Blackbird (Agelaius thilius)
Oscine, Passerida, Passeroidea, Icteridae
JX516069
Unicoloured Blackbird (Agelaius cyanopus)
Oscine, Passerida, Passeroidea, Icteridae
JX516076
Melodious Blackbird (Dives dives)
Oscine, Passerida, Passeroidea, Icteridae
JX516061
Scarlet-headed Blackbird (Amblyramphus holosericeus)
Oscine, Passerida, Passeroidea, Icteridae
JX516063
Common Grackle (Quiscalus quiscula)
Oscine, Passerida, Passeroidea, Icteridae
JX516064
Saffron-crowned Blackbird (Xanthopsar flavus)
Oscine, Passerida, Passeroidea, Icteridae
JX516065
Brown-and-yellow Marshbird (Pseudoleistes virescens)
Oscine, Passerida, Passeroidea, Icteridae
JX516066
Bronzed Cowbird (Molothrus aeneus)
Oscine, Passerida, Passeroidea, Icteridae
JX516067
Bay-winged Cowbird (Molothrus badius)
Oscine, Passerida, Passeroidea, Icteridae
JX516074
Yellow-tailed Oriole (Icterus mesomelas)
Oscine, Passerida, Passeroidea, Icteridae
JX516068
Austral Blackbird (Curaeus curaeus)
Oscine, Passerida, Passeroidea, Icteridae
JX516070
Yellow-rumped Marshbird (Pseudoleistes guirahuro)
Oscine, Passerida, Passeroidea, Icteridae
JX516071
Brewer’s Blackbird (Euphagus cyanocephalus)
Oscine, Passerida, Passeroidea, Icteridae
JX516072
Golden-tufted Mountain Grackle (Macroagelaius imthurni)
Oscine, Passerida, Passeroidea, Icteridae
JX516073
Oriole Blackbird (Gymnomystax mexicanus)
Oscine, Passerida, Passeroidea, Icteridae
JX516075
Silver-eyed Mesia (Leiothrix argentauris)
Oscine, Passerida, Sylvioidea, Timaliidae
NC_015114
Taiwan Bulbul (Pycnonotus taivanus)
Oscine, Passerida, Sylvioidea, Pycnonotidae
NC_013483
Light-vented Bulbul Oscine, Passerida, Sylvioidea, NC_013838

7
(Pycnonotus sinensis) Pycnonotidae Orphean Warbler (Sylvia crassirostris)
Oscine, Passerida, Sylvioidea, Sylviidae
NC_010229
Blackcap (Sylvia atricapilla) Oscine, Passerida, Sylvioidea, Sylviidae
NC_010228
Reed Warbler (Acrocephalus scirpaceus)
Oscine, Passerida, Sylvioidea, Acrocephalidae
NC_010227
Tree Swallow (Tachycineta bicolor)
Oscine, Passerida, Sylvioidea, Hirundinidae
JQ071614
Violet-green Swallow (Tachycineta thalassina)
Oscine, Passerida, Sylvioidea, Hirundinidae
JQ071615
Golden Swallow (Tachycineta euchrysea)
Oscine, Passerida, Sylvioidea, Hirundinidae
JQ071616
Bahama Swallow (Tachycineta cyaneoviridis)
Oscine, Passerida, Sylvioidea, Hirundinidae
JQ071617
Tumbes Swallow (Tachycineta stolzmanni)
Oscine, Passerida, Sylvioidea, Hirundinidae
JQ071618
Mangrove Swallow (Tachycineta albilinea)
Oscine, Passerida, Sylvioidea, Hirundinidae
JQ071619
White-winged Swallow (Tachycineta albiventer)
Oscine, Passerida, Sylvioidea, Hirundinidae
JQ071620
White-rumped Swallow (Tachycineta leucorrhoa)
Oscine, Passerida, Sylvioidea, Hirundinidae
JQ071621
Chilean Swallow (Tachycineta meyeni)
Oscine, Passerida, Sylvioidea, Hirundinidae
JQ071622
Gray-breasted Martin (Progne chalybea)
Oscine, Passerida, Sylvioidea, Hirundinidae
JQ071623
Hume’s Ground Tit (Pseudopodoces humilis)
Oscine, Passerida, Paridae NC_014341
Species I have worked on: Song Thrush (Turdus philomelos)
Oscine, Passerida, Muscicapoidea, Turdidae
Complete, KC545406, (24)
Fernbird (Bowdleria punctata) Oscine, Passerida, Sylvioidea, Locustellidae
Complete, KC545398
Tomtit (Petroica macrocephala)
Oscine, Petroicidae Complete, KC545402
Pipit (Anthus novaeseelandiae) Oscine, Passerida, Passeroidea, Motacillidae
Complete, KC545397
Waxeye (Zosterops lateralis) Oscine, Passerida, Sylvioidea, Zosteropidae
Complete, KC545407
Browncreeper (Mohoua novaeseelandiae)
Oscine, Core Corvoidea, Pachycephalidae
Incomplete (10555 bp), KC545409
Bellbird (Anthornis melanura) Oscine, Meliphagoidea, Meliphagidae
Incomplete (9453 bp), KC545408
New Zealand robin (Petroica australis)
Oscine, Petroicidae Complete, Gerrit Hartig, unpublished, KC545401
Golden-Collared Manakin (Manacus vitellinus)
Suboscine (Tyrani), Pipridae Transcriptome (2), SRR029477–78
American Crow (Corvus brachyrhynchos)
Oscine, Core Corvoidea, Corvidae Transcriptome (2), SRR029463–64
Pied Flycatcher (Ficedula hypoleuca)
Oscine, Passerida, Muscicapoidea, Muscicapidae
Transcriptome (2), SRR029159–61
Blue Tit (Parus caeruleus) Oscine, Passerida, Paridae Transcriptome (2), SRR029162

8
1.1.3 The basal oscines
The oscines remained in Australasia radiating into many different lineages before
some, at least on four separate occasions, dispersed out of Australasia into the rest of the
world (1). There are a number of small lineages known as the basal oscines, which
radiated off the oscine tree before the large split between the Core Corvoidea and
Passerida (Figure 1). The oldest of these are the family the Menuridae (13, 15), which
consists of only two species, both known as lyrebirds and both are endemic to Australia.
The mitochondrial genome of one of these species (Menura novaehollandiae) was
sequenced by Slack et al. (25). These are estimated to have branched off after the K/PG
boundary between 48-67 mya (5). The second division formed the lineage containing
both the tree creepers (Climacteridae) and the bowerbirds (Ptilonorhynchidae), seen in
Figure 2. These lineages diverged from the oscines again after the K/PG boundary (1,
13, 15), supported by multiple studies using different molecular data sets; both groups
are endemic to Australia and PNG.
The third division within the oscines leads to the largest Australasian passerine
radiation, the superfamily Meliphagoidea, broke away from the remaining oscines (26).
The majority of the Meliphagoidea species are endemic to either Australia or PNG, but
some have dispersed into the Pacific Islands, including New Zealand, with one species
spreading up into Southeast Asia. The monophyly of this superfamily has been
confirmed by multiple researchers (26), but where exactly the lineage branches off the
main oscine tree has in the past been controversial. Some initially placed the group
within the Core Corvoidea (27), but they are now considered to be basal oscines (15,
28), as seen in Figure 2. The superfamily is split into four families: The Maluridae,
Pardalotidae, Acanthizidae, and Meliphagidae.
The Maluridae is the basal family of the four, and includes the fairy emu and grass
wrens. The next two families are closely related, the Pardalotidae (pardalotes) and the
Acanthizidae (Australasian warblers). The Acanthizidae are monophyletic (26, 29); they
originated within Australia and split from the other Meliphagoidea during the late
Oligocene (~27 mya). Within this family is the genus Gerygone, which contains the
New Zealand species Gerygone igata (grey warbler), the mitochondrial genome of this
species has previously been sequenced but has not been published (Table 1). The genus
has undergone a major radiation within the last 5 mya (29). The closest relative of the
grey warbler is the Norfolk Island species, Gerygone modesta, perhaps indicating a
single dispersal event from Australia within the last few million years (29).

9
Sister to the Pardalotidae and Acanthizidae is the Meliphagidae, or the honey eaters.
Gardner et al. (26) suggested that this family has had a large effect on the evolution of
many flowering plants throughout Australasia. The New Zealand endemics, the tui and
bellbird, form one of four clades within the Meliphagidae. The tui mitochondrial
genome has previously been sequenced but has not been published (Table 1). This New
Zealand clade diverged from the other clades around 19-31 mya (30). Whether this
occurred in New Zealand or Australia is unresolved, but by 2.9 mya they had reached
New Zealand and had split into the two species (22). No detailed study of the
relationship between the four clades of the honey eaters has been carried out (26).
Two other small Australasian basal oscine lineages are the logrunners
(Orthonychidae) and the Australian babblers (Pomatostomidae); these were initially
placed within the Core Corvoidea by Irestedt & Ohlson (31). But Norman et al. (28)
found they diverged before the Core Corvoidea and Passerida split, with the logrunners
perhaps joining at the base of the Meliphagoidea (Figure 2).

10
Figu
re 2
: Net
wor
k of
Bay
esia
n an
alys
is o
f the
pas
seri
nes,
base
d on
mito
chon
dria
l dat
a. F
igur
e m
odifi
ed fr
om G
ibb
(15)
, pro
duce
d fr
om M
r Bay
es re
sults
in
Split
s tre
e. T
he ro
ot o
f the
tree
is o
n th
e rif
lem
an b
ranc
h. T
here
is a
larg
e un
reso
lved
pol
ytom
y at
bas
e of
Cor
e C
orvo
idea
. Mito
chon
dria
l dat
a is
in th
e fo
rm o
f ei
ther
full
mito
chon
dria
l gen
omes
or 2
-5 m
itoch
ondr
ial g
enes
(15)
.

11
1.1.4 The Core Corvoidea
The oscines then split into two large lineages the Core Corvoidea and Passerida,
during the mid-Paleogene, around 45 mya (13, 32). The Core Corvoidea are the most
diverse lineage in Australasia (28); and Jonsson et al. (32) suggests that they radiated
from the islands of Papua New Guinea. The Papuan islands first formed around the late
Eocene (~34 mya), due to tectonic activity from the Australian plate moving northward.
At this time we see the first radiation of the Core Corvoidea (32). Supporting this is the
fact that Core Corvoidea diversity is highest in PNG, and every lineage that is outside of
the Austral-Papuan region has a closely related sister lineage in PNG (32). The Core
Corvoidea has dispersed out of Australasia radiating to fill many different niches, firstly
reaching Asia around 40-37 mya, then Africa (29-26 mya) and the Americas (28-25
mya) (1). Jonsson et al., (32) suggests that Core Corvoidea evolution on the Papuan
islands selected for species that were good at dispersing over water, unlike in Australia,
which may explain why they as a lineage were so successful at dispersing throughout
the world. In addition because of the mountains, there may have been more diverse
habitats in PNG than in Australia. This also goes against the long held model of island
biogeography where species flow (disperse) from continents to islands (sinks), but not
the other way around as niche availability on continents is much smaller, so therefore it
is harder for island species to establish themselves back onto the adjacent continents
(32). In this case though, the islands were a conduit to the rest of the world.
A number of large radiations have occurred within the Core Corvoidea in a
relatively short time frame (28). This has made the resolution of relationships within the
Core Corvoidea very difficult and created what is described as a polytomy, where more
than two (in this case five) lineages split apart within a short space of time (33), as seen
in Figure 2 at the base of the Core Corvoidea. The basal lineage of the group are the
sitella (Neosittidae) which are located within Australasia, providing further support for
the Core Corvoidea originating in the region, whilst the majority of the other lineages in
the group have representatives that are located elsewhere in the world (33). The New
Zealand fantail (Rhipidura fuliginosa) is part of the large fantail family Rhipiduridae;
genetic diversity in this family is relatively low (34). The family dispersed relatively
recently throughout Australasia with some species reaching into Asia (30, 34). Where
they are placed within the Core Corvoidea is unresolved. Some studies place them as
basal to the crows, monarch flycatchers, and drongos (31, 33), whilst Gibb (15) placed

12
the fantails with the piopios, an extinct NZ species, and the figbirds either as a sister
group to the Vireos or branching off at the polytomy site (Figure 2). More data from a
range of molecular sources is needed to fully resolve this polytomy. The centre of
diversity and likely origin for the Rhipiduridae family is PNG (34), and the family can
be divided into six main clades. The NZ fantail is part of a clade containing species
found in Australia, PNG, NZ and the Pacific Islands (34). The other clades are located
in PNG or have moved north into Asia (34).
Three New Zealand species, the browncreeper, whitehead and yellowhead, make up
the genus Mohoua; this is classified within the family Pachycephalidae, which also
includes the whistlers and Pitohui (33, 35). The Pachycephalidae has now been found to
be paraphyletic with genera spread throughout different clades within the Core
Corvoidea (28). The placement of the genus Mohoua is unresolved; some studies place
it with the whistlers (28), whilst Gibb (15) found it to branch off the crows, and Jonsson
et al., (32) found the Mohoua diverged from the site of the large polytomy, estimating it
to have occurred around the late Eocene (34 mya). A pattern that has been found in the
Core Corvoidea is for the species of the mountains of Papuan islands to be related to
species found in the dry areas (west of the Great Dividing Range) in Australia, with the
species found in the eastern rainforests of Australia basal to these (28).
There are two types of polytomy; hard and soft. A hard polytomy is seen when there
are many diversification events within a short time; and very little change in the
molecular sequence occurs between each event (36). This type of polytomy may never
be resolved no matter how much molecular data is used. A soft polytomy occurs when
insufficient molecular data has been compared between the different lineages to indicate
the order of the diversification events (36). To distinguish between the two the use of a
range of molecular loci, with different evolutionary properties, is needed (36). Fuchs et
al. (36) used ten loci, a mix of mitochondrial, autosomal, and sex linked, to resolve the
phylogeny of the Malaconotidea, an old world clade within the Core Corvoidea. There
are now six sequenced mitochondrial genomes, one transcriptome and one partial
mitochondrial genome from within the Core Corvoidea (Table 1). One mechanism that
does increase the chance of getting a polytomy are introgression events between the
diverging lineages (36)

13
1.1.5 Basal Passerida?
There are a number of lineages for which it is unresolved whether they are basal
groups of the Core Corvoidea or the Passerida (1, 28). One of these groups is the
Australasian robins (Petroicidae). The centre of diversity of the Petroicidae is Australia
and PNG with 40 of the 46 species found there (37). This group likely originated in
Australia but has dispersed out to PNG, the Pacific Islands and New Zealand (30).
These were previously assigned to either the Core Corvoidea (10) or the Meliphagoidea
(38), both hypotheses were consistent with the centre of diversity being in Australasia.
But recent work (15, 28, 31) instead found strong support for their placement at the base
of the Passerida, a largely northern hemisphere centred lineage. The placement of the
Petroicidae at the base of the Passerida suggests the family’s evolutionary history is
relatively long.
Miller and Lambert (39) investigated the relatedness of the three species native to
New Zealand; The New Zealand robin (Petroica australis), the Chatham Island black
robin (Petroica traverseri), and the New Zealand tomtit (Petroica macrocephala), along
with two species found on Norfolk Island and Fiji. They analysed two regions of the
mitochondrial genome, the Cytochrome-b gene and the control region, and found the
black robin was sister to the tomtit and the NZ robin joined with the Pacific species and
an Australian species was the out-group to all. This was unexpected as the morphology
and behaviour of the black and NZ robins are very similar, compared to the tomtit, and
they have always been classed as sister taxa (39). This lead Miller and Lambert (39) to
suggest that the black robin is a result of an ancient hybridization event between the NZ
robin and the tomtit, but nuclear data will be needed to clarify this. There is also some
evidence (39) to suggest the genus Petroica evolved in Australia and had two invasions
into New Zealand. First, a longer history for the NZ robin than the tomtit is indicated by
the NZ robins being more derived from the Australian Petroica species than the tomtits.
Also the North and South Island subspecies of the NZ robin are more genetically
distinct than the two tomtit subspecies indicating the robin subspecies have been
separated for a longer time. This is mostly speculation and cannot be proved without
testing all Australian species in the genus.
The satin birds of the genus Cnemophilus, are native to the PNG mountains, and
were originally placed within the Core Corvoidea with the birds of paradise when
Barker et al. (1) looked at RAG-1 data. But more recent studies (15, 21) with

14
mitochondrial data found that they formed into a clade with the Petroicidae, at the base
of the Passerida (Figure 2).
The New Zealand wattlebirds (Callaeidae), are a family made up of the three New
Zealand species, the kokako and the saddleback (which are both endangered), and the
huia (which became extinct during the 20th century) (21). These were originally
classified as basal Core Corvoidea (1, 33) based largely on data from the nuclear gene
RAG-1. But other studies (15, 21, 31) using different nuclear and mitochondrial data
show very strong support for their placement as basal Passerida, either sharing a
common ancestor with the Petroicidae and Cnemophilus around 29-41 mya (21) as seen
in Figure 2, or branching off the Passerida more recently than these two (15). The New
Zealand wattlebirds were thought of as being part of the ancient lineages that have a
vicariant origin in New Zealand (30), primarily because the taxon is only found in NZ.
However Shepherd et al. (21) showed that this taxon split from the Passerida more
recently than Zealandia split from Gondwana, indicating they must have dispersed here.
The New Zealand species Notiomystis cincta (hihi or stichbird) was originally
placed with the honeyeaters in the Meliphagoidea (27, 30). However now there is strong
support for this species comprising its own family, the Notiomystidae, and diverging
from the NZ wattlebird lineage around 33 mya (22). The placement of the
Notiomystidae here was supported by Gibb (15) using complete mitochondrial genome
data. These four lineages; the Australasian robins, the New Zealand wattlebirds, the hihi
and the Cnemophilus, will be referred to in this study as basal Passerida. As reported
here, there are now four mitochondrial genomes available from species in these groups.
By analysing these along with genomes from representatives of the crown Passerida and
Core Corvoidea, confirmation of their placement at the base of the Passerida branch
should be found.
1.1.6 The Passerida
The Passerida is traditionally made up of three main superfamilies: the Sylvioidea,
Passeroidea, and Muscicapoidea (2). The family Paridae is sometimes also classified as
a fourth superfamily. The Passerida originated in Australasia around 45 mya, which
involved firstly a large radiation in Australasia, followed by dispersal out into the world,
followed by other large radiations resulting in the formation of many of the lineages that
represent the Passerida today (1, 32, 40).

15
All species in the crown Passerida contain an 18bp deletion in the GADPH gene and
their monophyly is undisputed (1). As mentioned above this group is split into three
main super families: the Sylvioidea, Muscicapoidea, and Passeroidea. There is
uncertainty about how these three superfamilies have diverged. Some studies (1, 41)
state that the Sylvioidea is sister to the other two super families, with the Muscicapoidea
and Passeroidea diverging later. Other studies using nuclear data (13, 40) group the
Sylvioidea with the Muscicapoidea. Lastly mitochondrial transcriptome sequencing by
Nabholz et al., (2) has shown the Muscicapoidea is basal to the two other superfamilies,
summarised in Figure 3 from Nabholz et al. (2). There is also strong support for the split
of some lineages originally placed within the Sylvioidea to form its own superfamily the
Paridae (2, 40, 41). Such uncertainty leads to the question: are these true monophyletic
groups? Gibb (15) used full mitochondrial genomes but only had three representatives
from the Sylvioidea and two from the Passeroidea. Nabholz et al. (2) continued this by
adding mitochondrial transcript data from an extra Sylvioidea, a representative from
both the Muscicapoidea and the Paridae but did not receive strong support for the
branching of the superfamilies as seen in Figure 3.
Figure 3: The differing opinions on the phylogeny of the superfamilies of the Passerida. Figure from Nabholz et al. (2). A) From Barker et al. (1) based on RAG1 and 2 genes (4165 bp) from 144 species. B) and C) are both from the Johansson et al. study (40) but differ in the number of genes used to create the tree B) with 3 genes (2315 bp) and C) with 6 genes (7288 bp). D) Is from the Nabholz et al. (2) study based on mitochondrial genomes and transcriptomes from 15 passerine species.
There are now 62 complete and one near-complete (Rifleman) mitochondrial
genomes of passerines on GenBank (as of the 20/11/2012), as well as the four
transcriptomes from Nabholz et al. (2). Five genomes used by Gibb (15), and the NZ
fantail (unpublished) will be added to the five mitochondrial genomes I have completed:

16
Bowdleria punctata (fernbird), Anthus novaeseelandiae (pipit), Zosterops lateralis
(waxeye), Petroica macrocephala (tomtit) and Turdus philomelos (song thrush), see
Table 1. This means there are now a total of 78 passerine mitochondrial genomes to
compare, including multiple representatives of each of the three superfamilies of the
Passerida along with two from the Paridae. These genomes could be analysed to resolve
the phylogeny of the Passerida, allowing for a greater understanding of the relationships
between the superfamilies, as well as the divisions within these. All the available
passerine sequences could also be analysed to resolve other questions surrounding
certain parts of passerine phylogeny mentioned above.
The Sylvioidea are found throughout the world, but their diversity is centred in the
Indo-Pacific area. The superfamilies phylogeny is relatively unresolved. At the base of
the group a lineage made up of the tits and chickadees branches off; these are
considered by some to be their own superfamily the Paridae (2), see Figure 3. This is
then followed by a polytomy of four lineages (33). The three smallest include the larks
and other minor groups, while the largest of the four contains the warblers, bulbuls, old
world babblers and swallows. The relationships within this large group are also
unresolved due to the formation of another large polytomy, indicating that the
Sylvioidea radiated very rapidly and resolution will be very difficult (8, 33). The four
Sylvioidea species analysed in Nabholz et al. (2) are part of the largest Sylvioidea
lineage mentioned above, so do not help resolve this phylogeny. Sequenced
mitochondrial genomes from representatives of the other three groups should aid in the
resolution of this superfamily.
There are three native New Zealand species within the Sylvioidea superfamily. The
fernbird (Bowdleria punctata) has been classified in its own genus (10), but other
studies have suggested that it should become part of a closely related Australian warbler
genus Megalurus (30). These have been grouped in a clade with Acrocephalus
scirpaceus (33). The monophyly of this clade will be tested using the phylogenetic trees
created in this thesis.
The second native Sylvioidea is Zosterops lateralis, known as the waxeye or
silvereye; it is native to NZ but not endemic, with the same species found in Australia
and some Pacific Islands. The waxeye first arrived in NZ in 1856, but this is thought to
have been a self-introduction, so the species is classified as a native (42). Moyle et al.
(17) used data from three mitochondrial and three nuclear genes from 300 individuals of

17
the families Timaliidae, the babblers, and the Zosteropidae to resolve the evolutionary
history of these families and uncover their origins (17). The Moyle et al. (17) data
shows that the two families group within the Sylvioidea, with strong support for the
placement of the Zosteropidae as a sister group to the Timaliidae. The Timaliidae has
one representative with a fully sequenced mitochondrial genome (the silver-eyed mesia
Leiothrix argentauris). These two species (Zosterops lateralis and Leiothrix
argentauris) should group together in the phylogenetic tree, supporting the findings of
Moyle et al. (17). One calibration point for passerine phylogeny uses the age of the
Solomon Islands, for the diversification of the Zosteropidae from the crown Yuhina, and
is thought to have occurred a maximum of 8.8 mya (17). The Zosteropidae are thought
to originate in mainland Asia, along with two of the babbler clades (17); this would be
an example of passerines re-invading Australasia. The Zosteropidae are estimated to
have split from the Timaliidae between 16-21 mya (17). The Zosteropidae family has
been described as a great speciator (43), containing around 100 species which have all
evolved within the last 10 million years.
The last Sylvioidea native is the welcome swallow (Hirundo neoxena). This species
is also thought to have self-introduced to New Zealand in the 1950s (42). It is therefore
a native, but is not endemic, with the species distributed across Australia and other
Pacific Islands. The welcome swallow is part of the family Hirundinidae, for which 10
mitochondrial genomes from different species of this family have become available
(44). Therefore, the welcome swallow mitochondrial genome sequence was not
considered for sequencing in this study.
The Passeroidea are found mainly in the Europe, Asia and the Americas; the
majority are herbivores and include the sparrows, wagtails, finches (41). The division of
the Passeroidea is also unresolved with large polytomies (33), and some traditional
lineages have been found to be paraphyletic (41). But there are now 29 sequenced
mitochondrial genomes, from many different lineages within the Passeroidea
superfamily (Table 1). This large amount of molecular data should help resolve some of
polytomies in the Passeroidea. One NZ native belongs to this superfamily; the pipit
(Anthus novaeseelandiae). The pipit is native but not endemic to New Zealand with the
species distributed across the whole of Australasia (30). The pipit is part of the
worldwide distributed family Motacillidae, and the NZ pipit may represent a re-invasion
back into Australasia from the outside.

18
The Muscicapoidea on the other hand is a relatively well resolved superfamily, with
strong support for the monophyly of groups within (41). They are the smallest of the
three superfamilies and are found mostly in Europe, Asia, and Africa, with one family
in the Americas. They include the thrushes, starlings, old world flycatchers, and chats
(41). There are no New Zealand natives in this lineage but some have been introduced
by humans (30), including the song thrush (Turdus philomelos), for which a
mitochondrial genome is now avaliable (24). In total there are 10 species with a
sequenced mitochondrial genome or transcriptome from the Muscicapoidea (Table 1).
The Bombycillidae (waxwings) are a family that was originally placed within the
Muscicapoidea but are now suggested to be a basal group to the three superfamilies
(41).
1.2 New Zealand’s passerines In New Zealand there are around 30 passerine species (45), 20 of these are native of
which 17 are endemic. Some belong to an endemic family/genera (Acanthisittidae,
Callaeidae, Notiomystidae, Mohoua, Turnagra), but many of the other native species
have closely related species located elsewhere in the world (45), indicating that many
are probably relatively recent arrivals. Studies of passerine molecular data indicate there
have been 14 events of dispersal or vicariance of passerines into New Zealand (30).
A list of the conservation status of all organisms that have been recorded in New
Zealand since 1800 is maintained by the Department of Conservation (42). The
conservation classification status is determined for each taxon by taking into account the
population size, the population trend (increasing, decreasing or stable), the breeding
range, and whether the taxa has been affected by humans; a full description of how taxa
are classified into these categories is detailed in Miskelly et al. (42). As of 2008 there
are 428 avian taxa on the list, to subspecies/population level (42). Of these, 20 are
extinct, 77 are threatened (split into 24 nationally critical, 15 nationally endangered, and
38 nationally vulnerable), 93 taxa are ‘at risk’ (18 declining, 10 recovering, 17 relict,
and 48 naturally uncommon), 36 are native residents that are not threatened, 165 are
coloniser, vagrant, or migrant, and 36 are introduced and naturalised (42). There are 12
passerine families with species native to New Zealand (42), and 51 passerine taxa; 11
taxa are extinct, 1 is nationally critical, 3 nationally endangered, 6 nationally vulnerable,
5 are declining, 3 recovering, 9 naturally uncommon, and 13 are not threatened (Table
2).

19
Table 2: All native New Zealand Passerine populations and their conservation status: Sorted by the family; lists scientific name, common name, each subspecies/population and their conservation status. Classification of lineages and the conservation status is defined by Miskelly et al. (42), in 2008, using the New Zealand Threat Classification System. Family Scientific name Common name Subspecies/
population Conservation status
Acanthisittidae Acanthisitta chloris
NZ rifleman NI rifleman (granti) At Risk – Declining
SI rifleman (chloris) At Risk - Declining
Xenicus gilviventris
Rock wren Threatened –Nationally Vulnerable
Xenicus longipes
Bush wren SI bush wren (longipes)
Extinct
NI bush wren (stokesi)
Extinct
Stead’s bush wren (variabilis)
Extinct
Traversia lyalli Lyall’s wren Extinct Acanthizidae Gerygone
albofrontata CI warbler Threatened –
Nationally Vulnerable
Gerygone igata Grey warbler Not Threatened
Callaeidae Callaeas cinerea
SI kokako Extinct
Callaeas wilsoni NI kokako Threatened –Nationally Vulnerable
Heteralocha acutirostris
Huia Extinct
Philesturnus carunculatus
SI saddleback At Risk - Recovering
Philesturnus rufusater
NI saddleback At Risk - Recovering
Hirundinidae Hirundo tahitica Pacific swallow Welcome swallow (neoxena)
Not Threatened
Meliphagidae Anthornis melanura
Bellbird NZ bellbird (melanura)
Not Threatened
Three Kings bellbird (obscura)
At Risk – Naturally Uncommon
Poor Knights bellbird (oneho)
At Risk – Naturally Uncommon
Anthornis melanocephala
CI bellbird Extinct
Prosthemadera novaeseelandiae
Tui NZ Tui (novaeseelandiae)
Not Threatened
CI tui Threatened – Nationally Endangered
Motacillidae Anthus novaeseelandiae
NZ pipit NZ pipit (novaeseelandiae)
At Risk - Declining

20
Auckland Island pipit (aucklandicus)
At Risk - Recovering
CI pipit (chathamensis)
At Risk – Naturally Uncommon
Antipodes Island pipit (steindachneri)
At Risk – Naturally Uncommon
Notiomystidae Notiomystis cincta
Hihi/stitchbird Threatened – Nationally Endangered
Pachycephalidae Mohoua albicilla
Whitehead Not Threatened
Mohoua novaeseelandiae
Browncreeper Not Threatened
Mohoua ochrocephala
Yellowhead Threatened –Nationally Vulnerable
Petroicidae Petroica australis
NZ robin SI robin (australis) Not Threatened
Stewart Island robin (rakiura)
Threatened –Nationally Vulnerable
Petroica longipes
NI robin Not Threatened
Petroica macrocephala
Tomtit Yellow-breasted tomtit (macrocephala)
Not Threatened
Pied tomtit (toitoi) Not Threatened
CI tomtit (Chatamensis)
Threatened – Nationally Endangered
Black tomtit (dannefaerdi)
At Risk – Naturally Uncommon
Auckland Island tomtit (marrineri)
At Risk – Naturally Uncommon
Petroica traversi
Black robin Threatened – Nationally Critical
Rhipiduridae Rhipidura fuliginosa
Fantail SI fantail (fuliginosa)
Not Threatened
NI fantail (placabilis)
Not Threatened
CI fantail (penita) At Risk – Naturally Uncommon
Sylviidae Bowdleria punctata
Fernbird SI fernbird (punctata)
At Risk - Declining
NI fernbird (vealeae)
At Risk - Declining
Stewart Island fernbird (stewartiana)
Threatened –Nationally Vulnerable

21
Snares fernbird (caudata)
At Risk – Naturally Uncommon
Codfish Island fernbird (wilsoni)
At Risk – Naturally Uncommon
Bowdleria rufescens
CI fernbird Extinct
Turnagridae Turnagra capensis
Piopio SI piopio (capensis) Extinct
Stephens Island piopio (minor)
Extinct
Turnagra tanagra
NI piopio Extinct
Zosteropidae Zosterops lateralis
Silvereye (lateralis) Not Threatened
The NZ pipit subspecies are all at risk, with the mainland subspecies declining
despite the offshore island subspecies either recovering or being stable (Table 2), while
there are different subspecies found in Australia and PNG. Fernbird populations in both
the North Island (NI) and South Island (SI) are declining; the Stewart Island population
is threatened and nationally vulnerable, and the two offshore populations are at risk and
classified as naturally uncommon (42). This is a relatively grim situation for the species
as all of the populations are at risk of extinction. The bellbird mainland subspecies is not
threatened, whilst its two offshore island populations are naturally uncommon; as things
stand it is very unlikely this species will become extinct (42). Both the browncreeper
and waxeye are not threatened, and are relatively common (42). Within the tomtit
species there are five subspecies. The NI and SI subspecies are not threatened but two of
the offshore island subspecies are naturally uncommon, and the Chatham Island (CI)
subspecies is nationally endangered (42). While this means the tomtit species is not
likely to become extinct there is a very real chance that some of the natural diversity of
the species will be lost unless measures are taken to conserve it. In general the New
Zealand bird species/subspecies that are recovering are taxa that are being actively
managed on predator-free offshore islands (42). An example is the saddleback which
has been relocated to nine predator free islands, resulting in a population increase from
500 to around 5000 (46). Whilst no new native land species have become extinct since
the 1960s, it is probable that some will go extinct in the near future (47). Many of
mainland populations are threatened with extinction, their numbers are continuing to
decline and their distributions are contracting (42). This would result in a loss of genetic

22
variation for the species which could have a large influence on how the species is able
to adapt to future threats, such as disease (47).
The Department of Conservation (DoC) only have limited resources to manage the
conservation of New Zealand’s native birds. For the five years up to 2005, DoC
received around $118.3 million in funding for conserving biodiversity on land (47).
From this funding pest management, habitat restoration and species recovery
programmes were performed (47), almost $10 million was spent on kiwi sanctuaries and
$17 million on recovery programmes for other species. A variety of methods are used
including transferring bird populations to predator-free off-shore islands, onsite
breeding programmes, and rearing in captivity and releasing into managed
environments (46). One question is: how do the government and DoC decide which
species to conserve? The focus has been on conserving species level diversity, in
particular recovery programmes for species that are facing extinction (47).
Understanding the phylogeny of the Passerines is important for making informed
decisions around funding the conservation of each species. To insure the greatest
diversity both above and below species level is conserved, DoC first needs to have a
clear understanding of the diversity of New Zealand’s species. Phylogenetic trees can be
used as a tool to assess how unique each species is, and how to allocate conservation
resources.
1.3 Use of molecular data in phylogeny What are the best molecular markers to use in these phylogenetic studies? Earlier
studies used single genes such as the nuclear genes RAG-1, RAG-2, myoglobin (1), the
mitochondrial genes Cytochrome b (CytB), or areas in the control region (39), or a
combination of these markers (31, 41, 48). Each marker is not ideal for resolving all
levels of phylogeny. Treplin et al. (41) states that much of passerine classifications has
been based around RAG-1 when in fact this gene has low resolving power when there
have been rapid radiations, which is what is seen in the oscines. Barker et al. (1) used
RAG-1, and studies since have disagreed with their placement of many of the basal
Passerida and Core Corvoidea (15, 31, 41), and other genes work better. Treplin et al.
(41) found that the nuclear ZENK gene had good resolving power for divergences
between 10-60 mya.
As the technology we use to sequence DNA and analyse molecular data improves
we have seen the use of more molecular data per species. Next generation sequencing

23
allows large amounts of molecular data to be sequenced from a single sample, and is
cheaper than the conventional capillary sequencing. Which makes resolving complex
radiations (e.g. polytomies) achievable and cost effective (49). Hackett et al. (13) used
19 nuclear nuclear loci from 169 bird species to look at the deeper relationships between
birds, but even with this amount of data Pratt et al. (7) found that the evidence from
both morphological data and full mitochondrial genome sequence did not agree with all
of Hackett’s placements, e.g. the placement of the parrots as closest relative to the
passerines. Pratt et al. (7) states using smaller sequences such as single genes or intron
sequences do not result in good estimates for times of divergence. Nabholz et al. (2)
observes that phylogenies produced from combinations of nuclear markers are weakly
supported for passerine relationships.
Mitochondrial genomes are becoming a popular molecular marker for resolving
phylogeny. Data from complete mitochondrial genomes (5, 7, 15), or the mitochondrial
transcriptome (2) have been used by many of the more recent studies to achieve good
resolution of passerine phylogeny. The circular mitochondrial genome is fast evolving,
doesn’t undergo recombination, and it is relatively easy to amplify its DNA (50, 51),
making it a useful marker for phylogenetic studies. The mitochondrial genome is
expected to have a substitution rate which can be used as a molecular clock (51, 52). As
the mitochondrial genes are critical to the functioning of the entire cell there is a
constraint that prevents them from evolving too rapidly and changing their function
(51). This constraint means that non-synonymous substitutions should rarely happen,
while the synonymous substitution rate is expected to be relatively high due to the
relatively inefficient mitochondrial DNA repair system (51). This leads to the
assumption that the vast majority of mutations seen in the mitochondrial genome are
neutral (51, 53). Also as the genome is asexual it is assumed there will be an irreversible
accumulation of slightly deleterious mutations (54), the process known as Muller’s
ratchet.
Many phylogenetic studies using the mitochondrial genome do not take into account
the different evolutionary rates of different regions of the genome can have. The
different rates can cause a bias in the phylogenetic analysis, to avoid this bias some
studies don’t analyse the full genome (55). Partitioning the molecular data allows the
use of all the heterogeneity by applying separate evolutionary models to the different
parts of the mitochondrial genome (55). The partitioning that worked best in the study
by Powell et al. (55) was based on the codon position in protein coding genes, RNA

24
secondary structure, and whether the region is coding or non-coding. The partitioning
used by Pratt et al. (7) will be applied to the molecular data in this study, and is the
same as is recommended by Powell et al. (56).
There are a number of potential sources of error which can have an effect on
resolving phylogeny, including: introgression, incomplete lineage sorting, base
composition, gene duplication/orthologs, long branch attraction and sampling error.
Individual gene trees often look different to the true species tree. This can be caused by
gene flow after the initial lineage splitting event (29, 36, 51), known as introgression.
Introgression is normal and has been shown to occur naturally in many different animals
including birds (57, 58), beetles (59), mice (60), and even humans (61). A study on the
passerine family the Parulidae found that the phylogenetic tree produced using
mitochondrial DNA did not match with the plumage colour characteristics (58). Lovette
(58) found that the colourful yellow plumage trait was found in distantly related species
within the family. Lovette (58) suggests there possibly was gene flow after the lineages
had initially diverged and the yellow plumage trait was inherited from the distant
relative. Incomplete lineage sorting can also cause problems for resolving phylogeny
(62); this is where the phylogeny produced from a single gene does not match the
overall or true phylogeny, it is caused by genetic drift.
The use of multiple loci, under different evolutionary constraints (such as a
combination of mitochondrial, autosomal and sex-linked genes) may help resolve the
problems caused by introgression and incomplete lineage sorting (29, 36). Overall,
mitochondrial data from protein, rRNA, and tRNA coding genes has been found to be
very informative in resolving phylogeny (29). A study using mitochondrial genomes
from ten species from a swallow genus Tachycineta found that analyses of data from
complete protein-coding sequence was not enough to fully resolve the phylogeny of the
lineage (44), complete resolution could only be achieved by including data from non-
coding regions in the analyses. The group also found no evidence for positive selection
occurring on the mitochondrial genome (44), indicating there was selection for
preserving the function of the mitochondrial genes.
Base composition of the molecular data can also have a large effect on phylogenetic
trees. Nabholz et al. (63) found that GC content variation had a large effect on the
placement of taxa in phylogenetic trees. They found that a higher recombination rate
was associated with a higher GC content. When studying the relationship between
25
different avian orders it was found that when GC variation was not accounted for, the
parrots did not group as the sister lineage to the passerines (63). This was due to the
relatively low GC content of the parrots and ratites. But when the GC variation was
accounted for, by using RY coding for the third codon (replacing all A and G with R
and all T and C with Y), there was strong support for the parrots as the sister group to
the passerines (63).
Some studies have used the presence of a transposon, found in the control region of
many birds, or the duplication of the control region to determine phylogeny (5, 64, 65).
Often the non-coding control region is duplicated in avian species (5), a duplication
appears to have occurred on multiple occasions within the passerines. Within the 78
species with sequenced mitochondrial genomes, 26 species, belonging to five distinct
lineages, have a duplicated control region. The duplication is likely caused by slipped
strand mis-pairing, often due to the presence of repeats at either of ends of the junctions
of the control regions (66). Mitochondria are thought to be under pressure to be compact
(66), so the elimination of these extra copies of genes/regions is assumed to be selected
for, with mutations making extra copies non-functional followed by the elimination of
the pseudogene. This process is known as the tandem duplication/random loss model of
mitochondrial genome rearrangement (66). The study by Schirtzinger et al. (66)
demonstrated that control region duplication has occurred on at least six occasions in
the parrot lineage. There has been no evidence for any loss of a duplicated control
region, giving no support for the hypothesis that there is selection for eliminating the
duplicate (66). It would be interesting to see if there is any evidence of duplication
elimination occurring in the passerines? Or if each distinct lineage with a duplicated
control region is due to a separate duplication event?
When studying phylogeny there are restrictions on how much molecular data one
can use, because it is both expensive to collect the data (nucleotide sequence), and the
larger the data set the more computer hours the phylogenetic software takes to run the
analysis. Therefore there is a need to strike a balance between two possible strategies on
how much molecular data is used from each the species. The first is to have more data
from a few taxa, and the second is to have more taxa but a smaller amount of data from
each. There are advantages and disadvantages to both. With fewer taxa a problem is
long branch attraction; this is where two sequences that are highly dissimilar to the other
sequences in the analysis cluster together even though this may not represent the true
phylogeny. One way to stop this is to “break up” these long branches by including

26
sequence from relatively close relatives of the two sequences. With more taxa with
smaller amounts of data from each another problem arises that is sampling error. If an
error is made in the sequencing of the DNA and a base is changed this can affect the
resolution of the phylogeny by creating an artificial signal. The effect the signal has is
increased when only small amounts of sequence from each species are compared as
there are fewer nucleotides to compare. Overall increased taxon sampling in the form of
more species with more molecular data from each, such as multiple species with
sequenced mitochondrial genomes, will increase the accuracy of the phylogenetic
analysis.
1.4 Project outline The passerines are diverse and numerous and understanding their history is far from
complete. Many studies have gone some way to explaining the phylogeny of the order
as a whole, whilst others have focused on specific taxa. The fact that passerines have
undergone such large and rapid radiations have made resolving their history very
complicated, and we may never fully understand it. But with every extra study the
phylogenetic tree is taking form, providing a clearer understanding of the evolution of
the group. A number of deep areas are now well established such as the Gondwanian
origin of the passerines and the Australasian origin of the oscines, the division into the
three suborders, and the placement of a number of the basal oscines. But many of the
more recent divergences require more research to resolve conflicting results between
different studies. These conflicts include the placement of many of the basal Passerida,
the polytomy seen at the base of the Core Corvoidea, and the relationships between the
three superfamilies of the Passerida.
New Zealand has 20 native passerine species, 17 of which are endemic, these belong
to 12 families (three endemic). A number of these species are threatened or at risk of
extinction, and fully understanding the diversity of the native passerines is important for
the conservation of the group.
The aim of this project is to have a fully sequenced mitochondrial genome from
each of New Zealand’s native passerine families. These will be used as a molecular
catalogue for all of New Zealand’s passerine families, which should provide an insight
into the diversity of the native passerines, and will provide more information for
conservation. Phylogenetic trees using the genomes of New Zealand species along with
all other available passerine genomes will be constructed. These trees will be used to

27
address a number of questions surrounding passerine phylogeny (discussed above), and
also the placement of a number of New Zealand taxa within the order.
Objective 1: Construct a sequenced mitochondrial genome from each of New
Zealand’s passerine families.
Objective 2: Use these genomes along with all other available genomes to construct
a robust phylogeny for the passerines, which will then be used to address a number of
questions surrounding the avian order.
1.5 Overview of results The mitochondrial genomes of the fernbird, pipit, tomtit, and waxeye have
successfully been sequenced. The mitochondrial genome of both the browncreeper and
bellbird has been partially sequenced. All have been annotated and are submitted to
GenBank. They have been aligned with 66 available passerine mitochondrial genomes
from GenBank and seven other unpublished passerine genomes sequenced by others of
my research group. Phylogenetic trees using both maximum likelihood and Bayesian
analyses have been constructed. These trees have been used to address a number of the
questions surrounding the phylogeny of the passerines such as the placement of the
Australasian robins, NZ wattlebirds and the hihi as Basal Passerida.

28
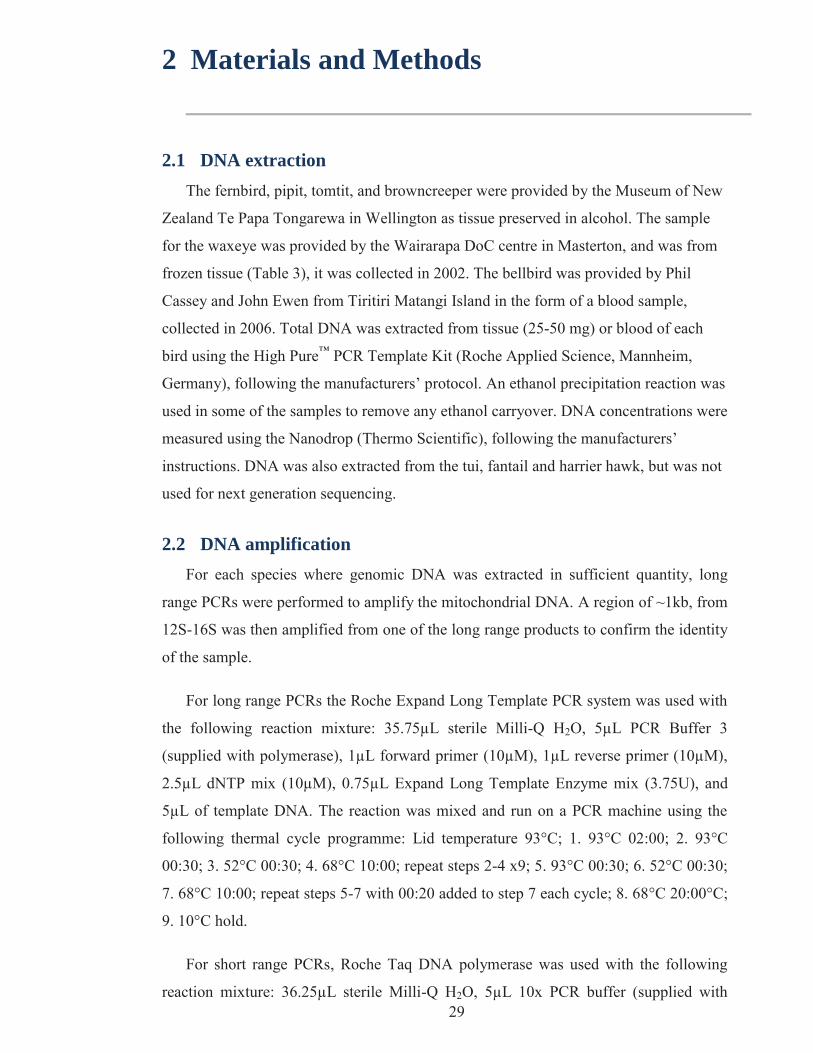
29
2 Materials and Methods
2.1 DNA extraction The fernbird, pipit, tomtit, and browncreeper were provided by the Museum of New
Zealand Te Papa Tongarewa in Wellington as tissue preserved in alcohol. The sample
for the waxeye was provided by the Wairarapa DoC centre in Masterton, and was from
frozen tissue (Table 3), it was collected in 2002. The bellbird was provided by Phil
Cassey and John Ewen from Tiritiri Matangi Island in the form of a blood sample,
collected in 2006. Total DNA was extracted from tissue (25-50 mg) or blood of each
bird using the High Pure™ PCR Template Kit (Roche Applied Science, Mannheim,
Germany), following the manufacturers’ protocol. An ethanol precipitation reaction was
used in some of the samples to remove any ethanol carryover. DNA concentrations were
measured using the Nanodrop (Thermo Scientific), following the manufacturers’
instructions. DNA was also extracted from the tui, fantail and harrier hawk, but was not
used for next generation sequencing.
2.2 DNA amplification For each species where genomic DNA was extracted in sufficient quantity, long
range PCRs were performed to amplify the mitochondrial DNA. A region of ~1kb, from
12S-16S was then amplified from one of the long range products to confirm the identity
of the sample.
For long range PCRs the Roche Expand Long Template PCR system was used with
the following reaction mixture: 35.75μL sterile Milli-Q H2O, 5μL PCR Buffer 3
(supplied with polymerase), 1μL forward primer (10μM), 1μL reverse primer (10μM),
2.5μL dNTP mix (10μM), 0.75μL Expand Long Template Enzyme mix (3.75U), and
5μL of template DNA. The reaction was mixed and run on a PCR machine using the
following thermal cycle programme: Lid temperature 93°C; 1. 93°C 02:00; 2. 93°C
00:30; 3. 52°C 00:30; 4. 68°C 10:00; repeat steps 2-4 x9; 5. 93°C 00:30; 6. 52°C 00:30;
7. 68°C 10:00; repeat steps 5-7 with 00:20 added to step 7 each cycle; 8. 68°C 20:00°C;
9. 10°C hold.
For short range PCRs, Roche Taq DNA polymerase was used with the following
reaction mixture: 36.25μL sterile Milli-Q H2O, 5μL 10x PCR buffer (supplied with

30
polymerase), 2μL forward primer (20μM), 2μL reverse primer (20μM), 1μL dNTP mix
(10μM), 0.25μL Taq polymerase (1.25U), and 3μL of template DNA. The reaction
mixture was mixed and run on a PCR machine using the following thermal cycle
programme: Lid temperature 94°C; 1. 94°C 03:00; 2. 93°C 00:30; 3. 52°C 00:30; 4.
72°C 02:00; repeat steps 2-4 x34; 5. 72°C 05:00°C; 9. 10°C hold.
Primer combinations were found by examining previous avian mitochondria studies
and using the laboratory primer database, (full list of primers used is in Supplementary
Table 1). During the extractions and PCRs, 1% (w/v) agarose gels in 1x TAE (Tris
Acetate EDTA) were run and visualised on a Gel Doc™ (Bio-Rad®) using SYBR®-
Safe (Invitrogen). A negative control was always included to check for contaminants. A
1kb+ ladder (Invitrogen) was included to estimate size and concentration of PCR
products. 5μL of the PCR products were purified enzymatically for sequencing using
2μL shrimp alkaline phosphatase and 1μL exonuclease (USB®); this digested excess
dNTPs and single stranded primers left in the reaction.
2.3 Capillary sequencing and confirmation of species The short range PCR products were used as templates for the v3.1 BigDye®
Terminator Cycle Sequencing reactions (Applied Biosystems). Products were
sequenced in the forward and reverse direction using primers that generated the short
range product. The sequencing reactions and clean up were performed by the Massey
University Genome Service centre (MGS). Products were then sequenced on the ABI
3730 automated sequencers (Applied Biosystems), at MGS. Sequences were viewed and
aligned in Geneious, versions 5 and 6 (Biomatters). By running the sequence on the
programme nucleotide BLAST (Basic Local Alignment Search Tool) (67), the sequence
was used to confirm that the DNA belonged to the correct species. In some cases there
were no sequences available from the New Zealand species so if the DNA sequence
matched a close relative of the expected species it was assumed the DNA was from the
correct species.
2.4 Illumina Sequencing A Qubit® Flurometer (Life Technologies™) was used to measure the quality and
quantity of the DNA samples, and whether there was any protein or RNA
contamination, before being sent for sequencing. Three DNA samples were then sent to
the Beijing Genome Institute (BGI). The pipit and tomtit DNA were very degraded and

31
were run as single samples on their own lane. The fernbird’s DNA was good quality and
quantity and was mixed in with other DNA (from a frog, mollusc and fish). These four
species DNA were not indexed because it was assumed there was sufficient divergence
in their mitochondrial DNA sequence that later separation would be possible. The
samples were sequenced using the Illumina® Solexa HiSeq® 2000 sequencing pipeline.
A hard drive containing the paired end short 100bp reads was received back from BGI;
these reads were in fastq format. After base calling, the low quality and ambiguous base
calls were filtered out using the Chastity filter. The read data was then available to us
for genome assembly. The quality of the reads were assessed using the software Fast
QC, which gives an overview of any problems with the reads such as read quality,
content and identifies if there were any over represented sequences indicating
contamination.
The waxeye was prepared as five long range PCR products spanning the entire
mitochondrial genome, using the following primer combinations: Av1753F12S-
Av5201tmetR, Av4165nd1F-Av7662co1R, Av7318co1F-Av10116co3R, Av9942co3F-
Av16137tproR, and Av15671cytbF-Av2150R12S. These waxeye products were run on
a 1% w/v in 1x TAE agarose gel and the Zymoclean™ Gel DNA Recovery Kit was
used to extract the PCR products. The DNA concentrations of these clean PCR products
were measured using Nanodrop (Supplementary Table 2). Before being sent for
Illumina sequencing at New Zealand Genomics Limited (NZGL) the products were
combined together so that there was an equal concentration of each in the mixed
sample.
REPLI-g® (Qiagen®) was used on the browncreeper and bellbird complete
genomic DNA to amplify the total genome, because the DNA was degraded and low in
concentration. The waxeye, browncreeper and bellbird were then sent to NZGL for
Illumina sequencing, each was given a unique index and the samples were run together
in the same lane. The Qubit® Flurometer was used again to measure the DNA
concentrations and contamination levels of these samples. They were sequenced using
the Illumina MiSeq®, the bellbird and browncreeper were prepared as an Illumina
TruSeq® DNA libraries, whilst the waxeye was an Illumina Nextera® library. TruSeq®
DNA library preparation involves the use of magnetic beads for the shearing of DNA
into fragments. It has higher accuracy but takes significantly longer and requires 50ng
of total DNA. Nextera® library preparation involves enzymatic fragmentation which is
quicker but less accurate, though it requires only 1ng of total DNA.

32
The read data from NZGL was returned as 150bp paired-end reads, in fastq format.
The quality of the reads were assessed using SolexaQA (68), Fast QC (69), and FastQ
Screen (70). The raw reads were then processed by using the software BWA (Burrows-
Wheeler Aligner) (71), and reads that map to the PhiX genome were removed. The
PhiX genome is a small virus genome which is added to the DNA before sequencing at
a very low level. It is used after sequencing to quickly estimate error rates.
2.5 Genome assembly
2.5.1 Pipit and tomtit
The mitochondrial genomes of the pipit and the tomtit were assembled as follows.
First, the FastX toolkit was used to remove the adapters from the short reads. The
software BWA (Burrows-Wheeler Aligner) (71) was used to map the short reads to a
reference genome. The zebrafinch (Taeniopygia guttata) and Tristram’s bunting
(Emberiza tristrami) were chosen as the reference genomes for the pipit because all
three belong to the superfamily Passeroidea, and they have been separated for less than
30 million years (1). The rook (Corvus frugilegus) was chosen as the reference genome
for the tomtit because the Australasian robins were thought to be part of the Core
Corvoidea (1), and when the 1kb region sequenced from the tomtit sample was run
through the program BLAST the closest match was the rook. Very few reads mapped to
both the reference genomes (see results), indicating there were too many sequence
differences between the species.
Velvet (72) was then used for de novo assembly of the genome: first, the paired
reads were joined together using the shuffling function. Velvet is a de novo sequence
assembler that uses a De Bruijn based assembly method. A K-mer sweep was performed
which identified a K-mer length that produced the highest N50 for the set of reads. A K-
mer sweep is where the 100bp reads are broken into smaller fragments (K-mers) of a
certain length, to find the optimal K-mer length to assemble the set of reads (73). The
N50 is a statistic which estimates the mean contig size for the assembly (73). K-mers of
67 were best for the pipit, and 71 for the tomtit (Table 8 and Table 11), using an
expected coverage of auto (which cuts off contigs with coverage less than half the
median coverage). The contigs produced by Velvet at this K-mer length, were run
through BLAST against GenBank identifying any that matched with other passerines on
GenBank (see Table 9 and Table 12 for contigs found).
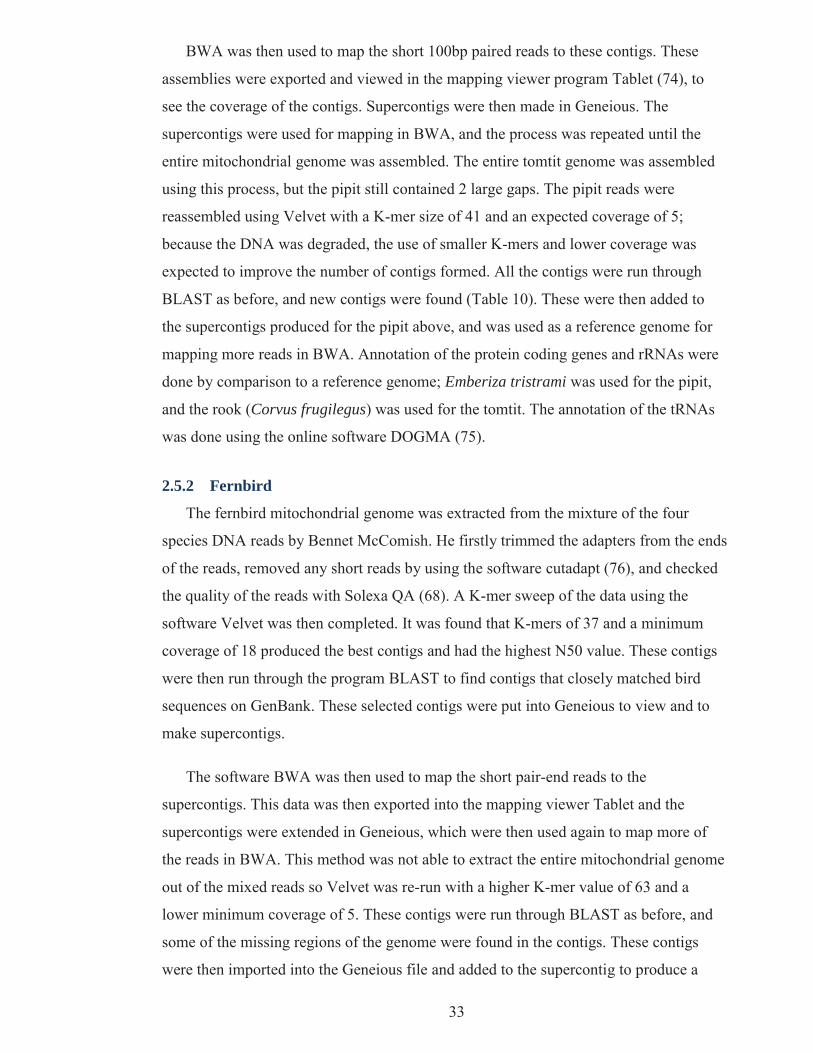
33
BWA was then used to map the short 100bp paired reads to these contigs. These
assemblies were exported and viewed in the mapping viewer program Tablet (74), to
see the coverage of the contigs. Supercontigs were then made in Geneious. The
supercontigs were used for mapping in BWA, and the process was repeated until the
entire mitochondrial genome was assembled. The entire tomtit genome was assembled
using this process, but the pipit still contained 2 large gaps. The pipit reads were
reassembled using Velvet with a K-mer size of 41 and an expected coverage of 5;
because the DNA was degraded, the use of smaller K-mers and lower coverage was
expected to improve the number of contigs formed. All the contigs were run through
BLAST as before, and new contigs were found (Table 10). These were then added to
the supercontigs produced for the pipit above, and was used as a reference genome for
mapping more reads in BWA. Annotation of the protein coding genes and rRNAs were
done by comparison to a reference genome; Emberiza tristrami was used for the pipit,
and the rook (Corvus frugilegus) was used for the tomtit. The annotation of the tRNAs
was done using the online software DOGMA (75).
2.5.2 Fernbird
The fernbird mitochondrial genome was extracted from the mixture of the four
species DNA reads by Bennet McComish. He firstly trimmed the adapters from the ends
of the reads, removed any short reads by using the software cutadapt (76), and checked
the quality of the reads with Solexa QA (68). A K-mer sweep of the data using the
software Velvet was then completed. It was found that K-mers of 37 and a minimum
coverage of 18 produced the best contigs and had the highest N50 value. These contigs
were then run through the program BLAST to find contigs that closely matched bird
sequences on GenBank. These selected contigs were put into Geneious to view and to
make supercontigs.
The software BWA was then used to map the short pair-end reads to the
supercontigs. This data was then exported into the mapping viewer Tablet and the
supercontigs were extended in Geneious, which were then used again to map more of
the reads in BWA. This method was not able to extract the entire mitochondrial genome
out of the mixed reads so Velvet was re-run with a higher K-mer value of 63 and a
lower minimum coverage of 5. These contigs were run through BLAST as before, and
some of the missing regions of the genome were found in the contigs. These contigs
were then imported into the Geneious file and added to the supercontig to produce a

34
sequence spanning the entire mitochondrial genome, except for one small gap in the
first control region. The fernbird’s genome was then annotated using Geneious, with the
reed warbler’s (Acrocephalus scirpaceus) genome used as reference for the protein and
rRNA coding genes and the online software DOGMA as above to find the tRNAs. The
reed warbler was used as the reference genome for the assembly and annotation of the
fernbird mitochondrial genome because the two genera, Bowdleria and Acrocephalus,
have been grouped together in a clade within the Sylvioidea (33). The fernbird data
from the earlier capillary sequencing also matched closest to the reed warbler in a
BLAST comparison.
2.5.3 Waxeye, browncreeper and bellbird
The reads from the waxeye, browncreeper and bellbird were 150bp paired-end reads
in fastq format. The following species were used as reference genomes for the
assembly: for the waxeye – the silver-eyed mesia (Leiothrix argentauris), for the
browncreeper - the rook (Corvus frugilegus), and for the bellbird - the tui
(Prosthemadera novaeseelandiae). The silver-eyed mesia was used for the waxeye
because their families (the Timaliidae and the Zosteropidae, respectively) are
considered sister families (17). The rook was used for the browncreeper as both belong
to the Core Corvoidea. Finally, the tui was used for the bellbird as both belong to the
Meliphagidae (22).
The reads were mapped to the reference genome using the software BWA and
Bowtie 2 (77). With Bowtie 2 the reads were mapped using local alignment which maps
differently than the default end to end alignment. Local alignment allows reads to map
if part of the read matches the reference genome, even if the ends of the read are
different. End to end alignment aligns the total read to the reference genome, so if part
of the read differs significantly to the reference genome the whole read will not align.
Local alignment works well when the reads are long (such as 150 bp) and when the
template DNA was degraded, as was the case with the browncreeper. A K-mer sweep
for each species was then run on Velvet and Velvet was used for de novo assembly of
the reads at the optimal K-mer length. All contigs produced were run on BLAST against
GenBank, any that matched passerines were added to the supercontigs made from BWA
and Bowtie 2. BLAST2go (78) was used to run the contigs produced in Velvet for the
bellbird reads at K-mer length of 97bp and the browncreeper reads at a K-mer length of
35bp.

35
2.5.4 Completing the mitochondrial genomes
The mitochondrial genome of the tomtit was complete after assembling the Illumina
reads. The pipit mitochondrial genome had two gaps after assembly, one in the Cox3
gene and the other in the 5’ region of the control region. The Cox3 gap was closed by
PCR using total pipit genomic DNA as the template and the primers Av10307Cox3F,
Av10647Cox3F, and Av10884nd3R. Sequencing was done as above using these
primers. New primers were designed in Geneious: Pipitnd6F and PipitcontrolR, and the
control region gap was covered as above. Five regions within the genome had low
coverage (reads are from only one DNA strand), two were located adjacent to the gaps
mentioned above. The other three existed within the genes Cox1, CytB and ND6.
Capillary sequencing was to confirm these sequences, using the primers Av7318Cox1F,
Av9025tlysR, Av15671cytbF, Av16137tproR, Pipitnd6F, and PipitcontrolR.
The fernbird had a small gap in the 5’ region of the first control region; this gap was
closed by first using PCR with the following primers, Av15671cytbF-Av16137tproR,
on total genomic DNA. This PCR product was then sequenced in the forward and
reverse directions by the MGS on the ABI3730 sequencer. The sequence was edited in
Geneious and the control region gap closed. Similarly capillary sequencing was also
used to confirm two regions in the 12S gene where coverage was very low, using the
primers Av510dloopF, Av1249tpheF, Av1272tpheR, Av2150R12S.
The waxeye had two large contigs spanning a large region of the mitochondrial
genome; one from the second control region to Cox3 and the other from CytB into the
first control region. Two gaps remained, the first around 4000bp in length from Cox3 to
CytB and the other around 1500bp from the first control region to the second control
region. Both total genomic DNA and long range PCR products were used as templates
for short range PCRs. These products were then sequenced using the same methods
discussed above by the MGS on the ABI3730 sequencer. Six new primers were
designed in Geneious for the covering of the gaps in the waxeye mitochondrial genome;
WeND5F, WeCytBF, WeCytbR, WeCR1F, WeCR1R and WeND6R. A full list of the
primers used is found in Supplementary Table 1.
For the bellbird the Illumina sequencing produced only two reads that mapped to the
tui, and no contigs were made by Velvet that matched passerines, it was therefore
assumed the Illumina sequencing of the Bellbird DNA sample did not work. Therefore
the bellbird genome was sequenced using capillary sequencing, using the same DNA

36
extraction as before as the template for short range PCR. The full list of primers used is
found in Supplementary Table 1.
The browncreeper genome was in multiple contigs with many gaps. The DNA
extracted from the tissue samples was very degraded and was low in concentration, all
was used when preparing the Illumina Nextera sequencing library so none remained for
PCR and further capillary sequencing. To complete this genome new tissue will need to
be obtained.
Gerrit Hartig sequenced the majority of the New Zealand robin (Petroica australis)
using capillary sequencing. Two gaps remained one in the ND4 gene and the other from
within the first control region to tPhe; these two gaps were covered by myself using
long and short range PCR and capillary sequencing. Two new primers were designed
using Geneious: AvtGluRobR and AvND6RobF to partially cover the second gap.
2.5.5 Transcriptome data
Nabholz et al. (2) used brain transcriptome sequenceing reads data from the study by
Kunstner et al. (79) to assemble the sequence of the mitochondrial protein coding genes
of four passerines. These four were the American crow - Corvus brachyrhynchos
(SRR029463–64), pied flycatcher - Ficedula hypoleuca (SRR029159–61), golden-
collared manakin - Manacus vitellinus (SRR029477–78), and blue tit - Parus caeruleus
(SRR029162). The birds’ brain transcriptomes was sequenced using the 454
transcriptome sequencing technologies (Roche). I used these transcriptome reads to
assemble the sequence of the rRNA and some of the tRNA genes from these four
species. The reads were downloaded from the GenBank read database as .sra files. The
sra toolkit was used to extract the read files using the software fastq.pileup. The reads
were imported into Geneious, and the genes were assembled using the Geneious
functions multiple align, map to reference, and de novo assembly. The following close
relatives were used as reference genomes: the rook for the American crow, the yellow-
rumped flycatcher for the pied flycatcher, the ground tit for the blue tit, and the fuscous
flycatcher for the golden-collared manakin. These rRNA and tRNA gene sequences
were added to the protein coding genes to form nearly complete mitochondrial
transcriptome sequences of the four species for use in the phylogenetic analysis.

37
2.6 Phylogenetic analysis All 79 passerine genomes (Table 1) and four parrot genomes; kakapo (Strigops
habroptilus), lovebird (Agapornis roseicollis), cobalt-winged parakeet (Brotogeris
cyanoptera), and cockatiel (Nymphicus hollandicus) were aligned using Geneious. The
four parrots used were selected from the phylogeny of Pacheco et al. (5), covering the
full diversity of parrots with mitochondrial genomes available. The sequences were
aligned at the amino acid level for protein coding genes and based on the stem and loop
secondary structure for the RNA genes. The data set contains 12 protein coding genes, 2
rRNAs and 21 tRNAs. Stop codons (often incomplete), ND6 (light-stranded encoded),
gaps and ambiguous sites adjacent to the gaps were not included in the alignment. These
sites have been shown to be the most heterogeneous and, therefore, typically do not
perform well in phylogenetic studies when the species are not closely related (5, 52).
Where species genomes are incomplete the missing nucleotides were filled using
question marks (?). The full data had 13588bp from each species. The data set had five
partitions: 1) first codon of all 12 protein coding genes, 2) second codon, 3) third codon,
4) stems of rRNA and tRNA coding genes, 5) loops of rRNA and tRNA coding genes,
this is the same as is used by Pratt et al. (7). RY coding was used for the third codon of
protein coding genes, these are the most variable of the five partitions (65, 80), and has
been shown to decrease the differences in nucleotide composition and increase the
proportion of observable changes in along each branch of the phylogenetic tree (5).
Phylogenetic analysis was done using the CIPRES Science Gateway (81). RAxML-
HPC2 (82) was used for maximum likelihood (ML) analysis with bootstrapping, with
default parameters set. The GTR-CAT model was used for the bootstrapping phase and
GTR-GAMMA for the final tree inference. MrBayes (83) was used for Bayesian
analysis. 10 million generations were run, sampling every 2500th generation, with a burn
in phase of the first 10% of trees. Sampling of the Monte Carlo Markov Chain from
MrBayes were assessed using Tracer v1.5 (84) to check for convergence, and the trees
were summarized using the software TreeAnotator (85). The trees were viewed, and
edited using Fig Tree v1.40, with Splits Tree version 4 (86) used for constructing
consensus networks. Subsets of the taxa set were run using both RaxML and MrBayes
using the above methods.
Initially both maximum likelihood and Bayesian phylogenetic analyses were run
using all 83 species (Table 1). Various subsets of these species were used for additional

38
ML analyses using RaxML to confirm results seen from the full data set trees. All used
13588bp from each species. The following subsets were used: The full set removing any
species that have uncalled bases (76 species remain - Supplementary Figure 4). All
Passerida including the four New Zealand basal Passerida (63 species - Supplementary
Figure 6). Then all Passerida removing Ficedula hypoleuca and Lampropsar
tanagrinus, as these had large amounts of uncalled bases and had close relatives already
in the set (61 species - Supplementary Figure 7). All Sylvioidea and including Parus
caerulus (19 species - Supplementary Figure 10).

39
3 Results
3.1 DNA extraction and next generation sequencing sample
preparation. DNA was extracted from 9 birds (Table 3). DNA extractions from the kokako,
shining cuckoo and sooty shearwater were not successful. The extractions from the
fernbird, waxeye, tui, and fantail had very high DNA concentrations (over 100ng/μl),
whilst the pipit and browncreeper DNA concentration was very low (around 10ng/μl)
(Table 3). Confirmation of extraction by gel electrophoresis (Figure 4) shows that DNA
can be seen from each bird species. The fernbird, tomtit, pipit, harrier hawk, tui, fantail
and waxeye are all bright, high molecular weight DNA bands, indicating high DNA
concentration and most of the DNA is in long fragments (Figure 4A). The browncreeper
DNA has low molecular weight and is a smear, indicating the DNA is degraded into
fragments 1kb or smaller (Figure 4B). The bellbird DNA is a high molecular weight but
is a smear, indicating the DNA is degraded but in 2kb+ fragments (Figure 4C). Both the
browncreeper and bellbird smears were dull which meant the DNA concentrations were
low.
The BLAST (67) results show that the nucleotide sequence from the fernbird
extraction matched closest to the reed warbler, which is a passerine from the Sylvioidea
(Table 3), the superfamily in which the fernbird is classified. The tomtit matched the
tomtit 12S gene sequence on GenBank. The pipit matched with Tristram’s bunting, and
both are classified in the Passeroidea superfamily. The browncreeper matched with the
rook, both in the Core Corvoidea. The waxeye matched the silver-eyed mesia, with both
being classified in the Sylvioidea superfamily. The tui matched the tui sequence on
GenBank, while the fantail matches the fantail and the bellbird the bellbird. The harrier
hawk matched another member of the order Falconidae - the western marsh harrier
(Table 3). These results confirm that the DNA extracted was from the correct species,
and could then be used for Illumina Solexa sequencing. The tui, harrier hawk and fantail
DNA samples were not used any further in this study and are stored for future use.

40
Table 3: The species extracted for this study. Samples of muscle tissue collected from three sources. Extracted DNA concentration of sample measured on the Nanodrop in ng/μl. DNA was used to make 1kb product from part of the mitochondrial genome (12S-16S regions); this region was sequenced using capillary sequencing on an ABI3730 sequencer (MGS). The sequence was run on BLAST against GenBank. Results give species with closest match to extracted sequence. Species Provided by, source
and year collected Extracted DNA concentration (ng/μl)
1kb sequence closest match (Blast)
Fernbird (Bowdleria punctata)
Te Papa, Wellington Codfish Island, 1997
189 Reed warbler (Arcocephalus scirpaceus)
Tomtit (Petroica macrocephala)
Te Papa, Wellington, DM88862, no collection data
46.2 Tomtit (Petroica macrocephala)
Pipit (Anthus novaeseelandiae)
Te Papa, Wellington, OR.011943, Auckland Islands, 1966
10.7 Tristram’s bunting (Emberiza tristrami)
Browncreeper (Mohoua novaeseelandiae)
Te Papa, Wellington, OR.022865, Southland, 1983
11.8 Browncreeper (Mohoua novaeseelandiae)
Waxeye (Zosterops lateralis)
Wairarapa DoC, 2002 114 Silver-eyed mesia (Leiothrix argentauris)
Tui (Prosthemadera novaeseelandiae)
Wairarapa DoC, 2008 165 Tui (Prosthemadera novaeseelandiae)
Fantail (Rhipidura fuliginosa)
Wairarapa DoC, Masterton, 2004
107.7 Fantail (Rhipidura fuliginosa)
Harrier Hawk (Circus approximans)
Wairarapa DoC, L-38051, 2008
39 Western marsh-harrier (Circus aeruginosus)
Bellbird (Anthornis melanura)
P Cassey & J Ewen, C77620, Tiritiri Matangi Island, 2006
20.2 Bellbird (Anthornis melanura)
Figure 4: Electrophoresis of DNA extractions. A) Lanes 1 and 9: 1kb+ ladder, lanes 2-8: Total DNA of the fernbird, tomtit, pipit, harrier hawk, tui, fantail, and waxeye. B) Lane 1: Total DNA of browncreeper, lane 2: 1kb+ ladder. C) Lane 1: Total DNA of bellbird, lane 2: blank, lane 3: 1kb+ ladder. D) DNA after REPLIg®: Lane 1: 1kb+ladder, lane 2: Bellbird, lane 3: Browncreeper.

41
The quality and concentration of the DNA samples were re-checked using a Qubit®
Fluorometer by the MGS, prior to the library construction. The Qubit® results (Table
4) differ significantly from the Nanodrop results (seen in Table 3). The reason for this is
unresolved. Firstly the Qubit results were measured two months after the Nanodrop
results, so the fernbird and tomtit samples may have degraded in this time, but why the
pipit concentration has increased is unknown. REPLI-g® was used on the bellbird and
the browncreeper to amplify the genomic DNA; this caused an increase in DNA
concentration from 20.2 to 54.5 ng/μl for the bellbird, and an increase from 11.8 to 20
ng/μl for the browncreeper (Table 3 and Table 5). The bellbird sample contained
significant levels of RNA (Table 5), which may have been sequenced with the bellbirds
DNA during Illumina sequencing. The TruSeq® library prep requires 50 ng of total
DNA, while Nextera® requires only 1 ng, so all three samples had sufficient DNA for
Illumina sequencing (Table 5).
Table 4: Samples used for Illumina HiSeq sequencing at BGI. The pipit and tomtit DNA were sent as single samples, whilst the fernbird DNA was mixed with frog, mollusc and fish DNA. For the three bird species a full genomic DNA sample was used. The concentration of DNA in the sample was determined by a Qubit® Fluorometer. The volume is the amount of each sample sent, and total DNA is calculated from concentration and volume. The total of the mix in bottom row is the concentration after the samples are combined together.
Species Template Qubit (ng/μl) Volume (μl) Total DNA (ng)
Pipit Genome 30.0 50 1500
Tomtit Genome 36.8 50 1840 MIX: Frog Genome 8.37 50 418.5 Fernbird Genome 69.9 20 1398 Mollusc 1 Genome 33.4 20 668 Fish Genome 55 30 1650 Total 37.2 120 4464

42
Table 5: Samples used for Illumina MiSeq sequencing at NZGL. The five waxeye long range PCR products were combined together. DNA and RNA concentrations were measured, using Qubit, before and after the library sample preparation step. The Volume used and total DNA is the amount used for the library prep. The DNA concentrations before library prep for the bell bird and browncreeper are after REPLI-g®. RNA concentration is a measure of contamination. Sample DNA Conc.
pre library prep (ng/μl)
RNA Conc. pre library prep (ng/μl)
Library sample prep method
Volume used (μl)
Total DNA (ng)
DNA Conc. post library prep (ng/μl)
RNA Conc. post library prep (ng/μl)
Bellbird 54.5 4.2 Illumina TruSeq®
40 2180 7.35 <0.02
Browncreeper 20 <0.02 Illumina TruSeq®
25 500 0.701 <0.02
Waxeye (combined LRs)
1.08 <0.02 Illumina Nextera®
15 16.2 1.42 <0.02
3.2 Illumina sequencing results The sequencing data was received back in fastq format. For both the pipit and tomtit
there were over 1 billion bases after cleaning (removing of uncalled base reads), whilst
the fernbird mix had over 3 billion bases of clean reads (Table 6). There were 195
million bases of read data for the waxeye, 285 million for the browncreeper, and 375
million for the bellbird (Table 6). Around 1 million bases of data is required to provide
sufficient reads to recover a mitochondrial genome, indicating there should be enough
read data here for each of the genomes. One problem is that the majority of the reads
sequenced here will be from sources of DNA other than the target mitochondrial
genome, such as the nuclear genome and because of the age of some of the samples we
also expect some microbial contaminants.
Table 6: Amount of data received back from BGI and NZGL after Illumina sequencing. Fernbird mix is the mix mentioned in Table 4. For the BGI reads: Raw data is read data after base calling. Clean data is the read data after the use of a Chastity filter to remove ambiguous base calls and low quality reads. For the NZGL reads: Clean data is after the reads have been processed by removing any reads mapping to the PhiX genome The reads from BGI are short paired 100bp reads, the NZGL reads are short paired 150bp reads.
Sample Raw data (million bases)
Clean data (million bases)
BGI reads (Illumina HiSeq) Pipit 2877 1857 Tomtit 1660 1147 Fernbird mix 4553 3366 NZGL reads (Illumina MiSeq) Waxeye 195 Browncreeper 285 Bellbird 375

43
The quality of the pipit, tomtit, waxeye, browncreeper and bellbird reads were
assessed using the software Fast QC, with results summarized in Table 7. The basic
statistics look at the number of reads, size of reads and GC content overall, the sets of
reads from the five species were all found to be good quality. The per base sequence
quality scores indicate the quality of each base over the length of the 100-150 base
reads. For all sets of reads the quality is lower at the start and the end of each read,
which indicates trimming may need to be done. But for four of the species the quality
score still remains good for the majority of the reads, and have passed this quality
assessment, only the bellbird has a warning, with the quality particularly poor after the
100th base mark. All the species reads passed the per sequence quality score, indicating
the vast majority of the reads are good quality. Per base sequence content indicates if
the position along the read influences the base call. The pipit had no position base call
bias, but the other four all had a warning or failed, with the 10 bases at the beginning of
the reads having a slight base bias, which may indicate contamination. The per base GC
content is the proportion of G/C at each position on the read, the browncreeper and
bellbird had a warning while the waxeye failed indicating there were positions along the
reads where there was an unusual G/C content. For the per sequence GC content there
was a warning for the tomtit and browncreeper, with the waxeye and bellbird failing,
this was because on average the reads had a lower or higher GC content than would
have been expected. This usually indicates there is a specific contaminant in the sample
(a sequence that appears multiple times in the library).
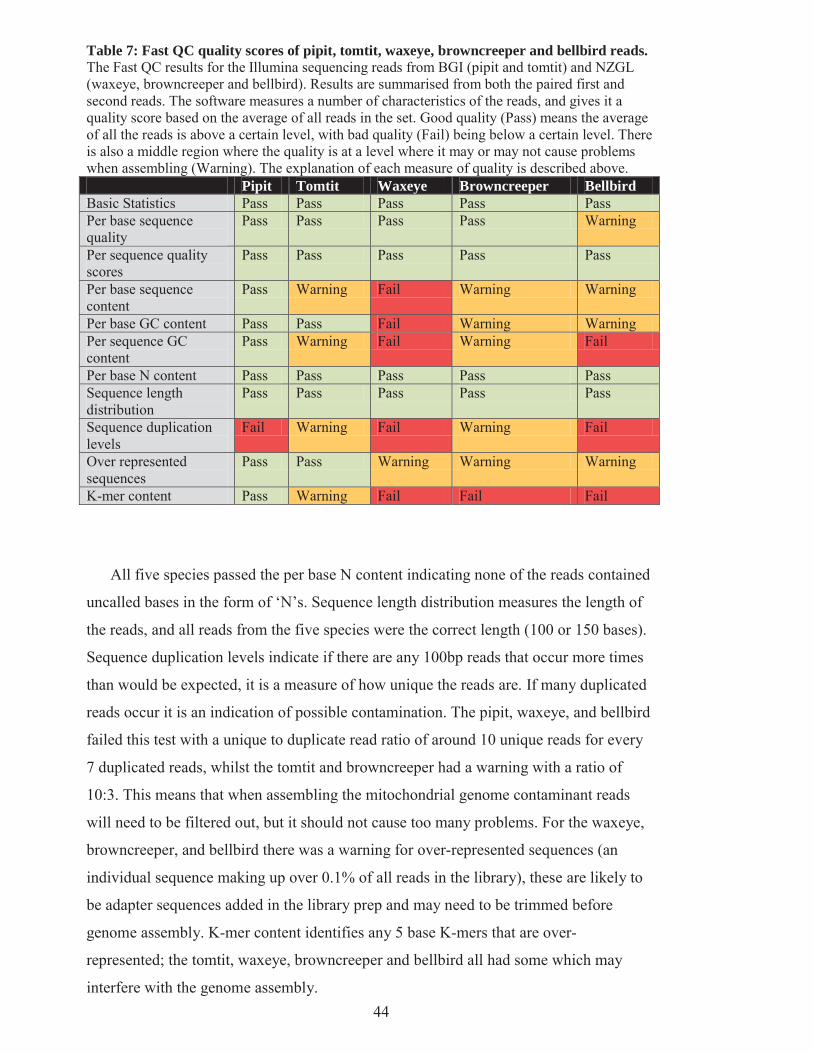
44
Table 7: Fast QC quality scores of pipit, tomtit, waxeye, browncreeper and bellbird reads. The Fast QC results for the Illumina sequencing reads from BGI (pipit and tomtit) and NZGL (waxeye, browncreeper and bellbird). Results are summarised from both the paired first and second reads. The software measures a number of characteristics of the reads, and gives it a quality score based on the average of all reads in the set. Good quality (Pass) means the average of all the reads is above a certain level, with bad quality (Fail) being below a certain level. There is also a middle region where the quality is at a level where it may or may not cause problems when assembling (Warning). The explanation of each measure of quality is described above. Pipit Tomtit Waxeye Browncreeper Bellbird Basic Statistics Pass Pass Pass Pass Pass Per base sequence quality
Pass Pass Pass Pass Warning
Per sequence quality scores
Pass Pass Pass Pass Pass
Per base sequence content
Pass Warning Fail Warning Warning
Per base GC content Pass Pass Fail Warning Warning Per sequence GC content
Pass Warning Fail Warning Fail
Per base N content Pass Pass Pass Pass Pass Sequence length distribution
Pass Pass Pass Pass Pass
Sequence duplication levels
Fail Warning Fail Warning Fail
Over represented sequences
Pass Pass Warning Warning Warning
K-mer content Pass Warning Fail Fail Fail
All five species passed the per base N content indicating none of the reads contained
uncalled bases in the form of ‘N’s. Sequence length distribution measures the length of
the reads, and all reads from the five species were the correct length (100 or 150 bases).
Sequence duplication levels indicate if there are any 100bp reads that occur more times
than would be expected, it is a measure of how unique the reads are. If many duplicated
reads occur it is an indication of possible contamination. The pipit, waxeye, and bellbird
failed this test with a unique to duplicate read ratio of around 10 unique reads for every
7 duplicated reads, whilst the tomtit and browncreeper had a warning with a ratio of
10:3. This means that when assembling the mitochondrial genome contaminant reads
will need to be filtered out, but it should not cause too many problems. For the waxeye,
browncreeper, and bellbird there was a warning for over-represented sequences (an
individual sequence making up over 0.1% of all reads in the library), these are likely to
be adapter sequences added in the library prep and may need to be trimmed before
genome assembly. K-mer content identifies any 5 base K-mers that are over-
represented; the tomtit, waxeye, browncreeper and bellbird all had some which may
interfere with the genome assembly.

45
The waxeye, browncreeper, and bellbird also had Fast Q screen and Solexa QA (68)
quality assessment. A Fast Q screen checks for contamination. It was set to screen all
the reads to see if any matched E. coli, yeast, PhiX, Illumina adapters, and cloning
vector sequences. The results show that none of the reads match these five sources of
sequence contamination (Figure 5). The Solexa QA programme gives a number of
outputs, which are comparable to the results from Fast QC, but are measured in different
ways. First, there is a measure of quality over the length of the reads; the bellbird had a
decrease in the quality towards the ends of the reads. This decrease in quality confirms
the warning given for per base sequence quality from Fast QC for the bellbird (Table 7).
Second, the next measure is the error rate over the read length, for all three species there
was a very low error rate with only a very slight increase in error rate at the last base of
the length. And last, a measure of the length of the reads with all being 150 bases long
confirming sequence length distribution result (Table 7).
The fernbird was assembled by Bennet McComish. Adapters were removed from all
the reads from the mix using the software Cutadapt (76). The reads were then run on
Solexa QA, software that measures the quality of the reads. It estimated the probability
that an error in base calling occurred along the read, and graphs the average for all reads
in the set. The probability of a base calling error occurring was 0 until around the 90th
base in the read where it began to increase to under 0.05 by the 100th base (Figure 6).
This means that for the first 90 bases of the read we can be very confident the base call
was correct, but after the 90th base some bases may be called incorrectly. To remove
these errors the software Quality trimmer (87) was used which removed any bases in a
read where the confidence in the base calling was below the threshold (p=0.005). This
trimmed all the bases after the low confidence base call. After this the majority of reads
were still 100 bases long (Figure 7).

46
Figure 5: Fast Q screen results for the browncreeper, bellbird, and waxeye reads. The program Fast Q screen compares all reads to sequence from E coli, yeast, Phix, Illumina adapters, and cloning vectors, checking for sources of contamination in the reads. The paired data is shown by two sets for each species (read 1 and read 2). None of the reads in any read set have matched the potential sources of contamination shown here by all reads being in the no hits column.

47
Figure 6: Probability of base calling error along reads in fernbird mix. Error probability at around 0 until around the 90th base when it increases to around 0.05 by the 100th base.
Figure 7: Length of fernbird mix reads after quality trim. Reads trimmed when the confidence of the base call is below threshold p=0.005. All remaining bases after low quality bases were removed by the software Quality trimmer.

48
3.3 Genome assembly
3.3.1 Pipit
The processed pipit reads were run on the software BWA (71) which maps the reads
to the reference genome, the zebrafinch (Taeniopygia guttata). Only 344 reads mapped
to the zebrafinch genome, covering around 12% of the mitochondrial genome. The
mapping results were viewed in Tablet and a consensus sequence was extracted, that
when run on BLAST matched to Passerines. The fact that only a small proportion of the
genome was extracted using mapping is probably an indication that the pipit genome is
too divergent from the reference genome used.
The de novo assembly software Velvet (72) was then used. For the pipit a K-mer
sweep was performed using an expected coverage set at auto. The highest N50 value
was seen at the K-mer length of 67 (Table 8), so the resulting contigs were looked at
further. The contigs were all run on BLAST against GenBank; the majority were
contaminants matching bacterial and fungal sequences. Eight contigs were found that
matched Passerines (Table 9), covering 15435 bases of the genome. All genes except
ND6, tRNAs Pro and Glu and the control region were recovered and there were also a
number of gaps within the genes ND1, Cox1, Cox3, and CytB. Contigs made using a K-
mer length of 41 were then run on BLAST to see if any additional regions of the
genome could be found. 5 Contigs matched passerines spanning a total of 16468 bases
(Table 10). These contigs extended into the control region, removed the gap in the ND6
gene and shortened the gap in the CytB gene, but still a number of gaps remained.
Table 8: K-mer sweep of the pipit reads. Performed using shuffled paired reads from the pipit data, on the software Velvet with expected coverage set to Auto. K-mer is the length in bases of the K-mer. Estimated coverage is the average coverage (in bases) of all the contigs, estimated by Velvet. N50 is a statistic describing the quality of the assembled contigs (higher numbers equal better quality). Max contig length is the length in bp of the longest contig made by Velvet. K-mer Estimated
Coverage N50 Max contig length
(bp) Total number of contigs
21 2.8 728 15615 25128 31 3.5 877 18118 23651 41 4.1 1678 20042 10261 51 5.1 1744 19446 9565 61 6.2 2589 26814 4760 63 6.4 2587 26812 4610 65 6.5 2627 26810 4438 67 6.7 2683 26808 4180 69 6.8 2618 26806 4045 71 7.0 2616 26804 3891
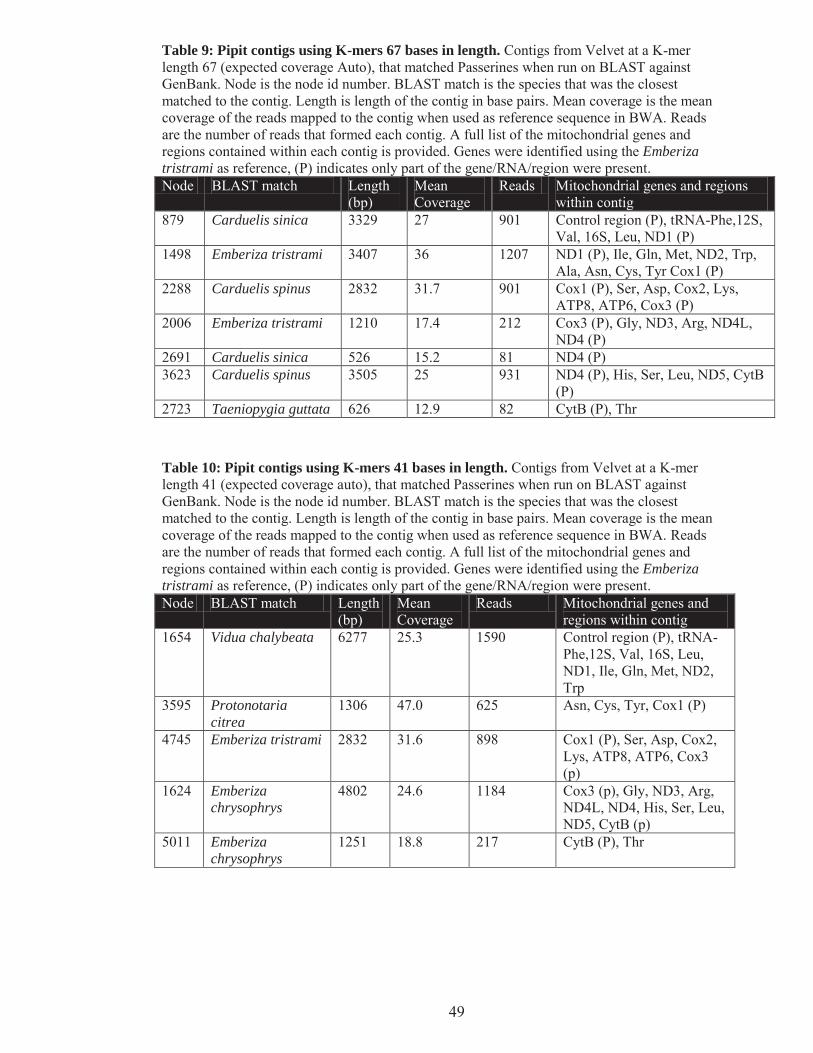
49
Table 9: Pipit contigs using K-mers 67 bases in length. Contigs from Velvet at a K-mer length 67 (expected coverage Auto), that matched Passerines when run on BLAST against GenBank. Node is the node id number. BLAST match is the species that was the closest matched to the contig. Length is length of the contig in base pairs. Mean coverage is the mean coverage of the reads mapped to the contig when used as reference sequence in BWA. Reads are the number of reads that formed each contig. A full list of the mitochondrial genes and regions contained within each contig is provided. Genes were identified using the Emberiza tristrami as reference, (P) indicates only part of the gene/RNA/region were present. Node BLAST match Length
(bp) Mean Coverage
Reads Mitochondrial genes and regions within contig
879 Carduelis sinica 3329 27 901 Control region (P), tRNA-Phe,12S, Val, 16S, Leu, ND1 (P)
1498 Emberiza tristrami 3407 36 1207 ND1 (P), Ile, Gln, Met, ND2, Trp, Ala, Asn, Cys, Tyr Cox1 (P)
2288 Carduelis spinus 2832 31.7 901 Cox1 (P), Ser, Asp, Cox2, Lys, ATP8, ATP6, Cox3 (P)
2006 Emberiza tristrami 1210 17.4 212 Cox3 (P), Gly, ND3, Arg, ND4L, ND4 (P)
2691 Carduelis sinica 526 15.2 81 ND4 (P) 3623 Carduelis spinus 3505 25 931 ND4 (P), His, Ser, Leu, ND5, CytB
(P) 2723 Taeniopygia guttata 626 12.9 82 CytB (P), Thr
Table 10: Pipit contigs using K-mers 41 bases in length. Contigs from Velvet at a K-mer length 41 (expected coverage auto), that matched Passerines when run on BLAST against GenBank. Node is the node id number. BLAST match is the species that was the closest matched to the contig. Length is length of the contig in base pairs. Mean coverage is the mean coverage of the reads mapped to the contig when used as reference sequence in BWA. Reads are the number of reads that formed each contig. A full list of the mitochondrial genes and regions contained within each contig is provided. Genes were identified using the Emberiza tristrami as reference, (P) indicates only part of the gene/RNA/region were present. Node BLAST match Length
(bp) Mean Coverage
Reads Mitochondrial genes and regions within contig
1654 Vidua chalybeata 6277 25.3 1590 Control region (P), tRNA-Phe,12S, Val, 16S, Leu, ND1, Ile, Gln, Met, ND2, Trp
3595 Protonotaria citrea
1306 47.0 625 Asn, Cys, Tyr, Cox1 (P)
4745 Emberiza tristrami 2832 31.6 898 Cox1 (P), Ser, Asp, Cox2, Lys, ATP8, ATP6, Cox3 (p)
1624 Emberiza chrysophrys
4802 24.6 1184 Cox3 (p), Gly, ND3, Arg, ND4L, ND4, His, Ser, Leu, ND5, CytB (p)
5011 Emberiza chrysophrys
1251 18.8 217 CytB (P), Thr

50
A supercontig of the contigs recovered was made in Geneious; a consensus
sequence was extracted filling the gaps with ‘N’s. This consensus sequence was then
used as a reference genome for mapping reads in BWA, which extended the regions
covered. The process was repeated a number of times until all genes were covered and
only two gaps remained one within the Cox3 gene, and one in the control region just
after tRNA Glu (Figure 8). When compared to both E. tristrami and the zebrafinch, the
gap in Cox3 appeared to be only 2bp long, but no reads were found to cover the gap.
The two gaps were closed using PCR and capillary sequencing. There were five regions
where coverage was low (reads were from only one DNA strand), two were located at
the edge of the gaps mentioned above. The other three existed within the genes Cox1,
CytB and ND6, the base calling of these sites were confirmed using capillary
sequencing, this means that all bases have been sequenced in both directions. The
genome length to date is 16798 bases long, and has a mean coverage depth of 24 reads
(Std. dev. 17 reads), and the maximum coverage depth is 114 reads. The genes were
annotated using Emberiza tristrami as the reference genome, and the DOGMA software
was used to find the tRNAs. The total genome is 16798bp long and the gene
arrangement is the same as was first reported for Gallus gallus.

51
Figure 8: Pipit Mitochondrial Genome. Assembled using Velvet, BWA and Geneious. Annotated using Emberiza tristrami as the reference genome, and DOGMA to find the tRNAs. Two gaps remained after assembly of Illumina HiSeq reads, one in Cox3 coding region, and one in the non-coding control region. These were later covered using capillary sequencing by MGS.
3.3.2 Tomtit
The rook (Corvus frugilegus) was used as the reference genome for the tomtit reads.
The tomtit reads were trimmed, removing the ends of the reads. They were then run on
the software BWA which maps the reads to a reference genome. Only 613 reads
mapped to the rook genome, covering only 16% of the genome. The mapping results
were viewed in Tablet and a consensus sequence was extracted, that when run on
BLAST matched to Passerines. Again this is probably an indication that the rook is too
far diverged from the tomtit to be used as a reference genome.

52
A K-mer sweep was then performed in Velvet using an expected coverage set at
auto. The highest N50 value was seen at a K-mer length of 71 (Table 11). This was the
highest K-mer length available in Velvet at the time (November 2011), and as the N50
is still relatively low at 71 (244), the optimal K-mer length is most likely higher than
this. The contigs made at 71 were then run through BLAST against GenBank; the
majority were contaminants matching bacterial and fungal sequences. Three contigs
were found that matched Passerines (Table 12), covering 16661 bases of the genome.
Table 11: K-mer sweep of the tomtit reads. Performed using shuffled paired reads from the tomtit data, on the software Velvet with expected coverage set to Auto. K-mer is the length in bases of the K-mer. Estimated coverage is the average coverage (in bases) of all the contigs, estimated by Velvet. N50 is a statistic describing the quality of the assembled contigs (higher numbers equal better quality). Max contig length is the length in bp of the longest contig made by Velvet. K-mer Estimated Coverage N50 Max contig
length (bp) Total number of contigs
21-51 Doesn’t work 61 1.8 141 12891 47490 65 2.9 151 17771 12615 71 4.68 244 28131 6653 Table 12: Tomtit contigs using K-mers 71 bases in length. Contigs from Velvet at a K-mer length 71 (expected coverage Auto), that matched Passerines when run on BLAST against GenBank. Node is the node id number. BLAST match is the species that was the closest matched to the contig. Length is length of the contig in base pairs. Mean coverage is the mean coverage of the reads mapped to the contig when used as reference sequence in BWA. Reads are the number of reads that formed each contig. A full list of the mitochondrial genes and regions contained within each contig is provided. Genes were identified using the Corvus frugilegus as a reference genome, (P) indicates only part of the gene/RNA/region were present. Node BLAST
match Length (bp)
Mean Coverage
Reads Mitochondrial genes and regions within contig
861 Luscinia calliope
13105 133.1 17459 ND6 (P), tGlu, non-coding region 2, tPhe,12S,t Val, 16S, tLeu, ND1, tIle, tGln, tMet, ND2, tTrp, tAla, tAsn, tCys, tTyr Cox1, tSer, tAsp, Cox2, tLys, ATP8, ATP6, Cox3, tGly, ND3, tArg, ND4L, ND4, tHis, tSer, tLeu, ND5 (P)
445 Gracula religiosa
2258 130 2949 ND5 (P), CytB, tThr, non-coding region 1 (P)
4609 Petroica traversi
1298 103.8 1348 tThr (P), non-coding region 1, tPro, ND6 (P)

53
All genes and a duplicated control region were recovered, but there were two gaps
within the genes ND5 and ND6. A super contig of the three contigs was made in
Geneious; a consensus sequence was extracted filling the gaps with Ns. This was then
used as a reference genome for mapping reads in BWA, which extended the genome
into the gaps. The process was repeated a number of times until the entire genome was
recovered (Figure 9). The genome length is 16861 bases long, and has a mean coverage
depth of 129 reads (Std. dev. 32), and the maximum coverage depth is 264 reads. The
genes were annotated using the rook (Corvus frugilegus) as the reference genome, and
DOGMA software was used to find the tRNAs. All of the tomtit genes appear to be the
same length as those of the rook. The control region is located between the genes tThr
and tPro. A duplicated piece of the control region, 190bp long, is found between tGlu
and tPhe, this small duplication is seen in the New Zealand robin (Petroica australis) as
well. There are two regions where the coverage was relatively low (within 12S rRNA
and ND2 gene); the base calling of this region was confirmed using PCR and capillary
sequencing.

54
Figure 9: Tomtit mitochondrial genome. Assembled using Velvet, BWA and Geneious. Annotated using Corvus frugilegus as the reference genome, and DOGMA to find the tRNAs.

55
3.3.3 Fernbird
For the fernbird mitochondrial genome a K-mer sweep in Velvet was performed
using an expected coverage set at 18. The highest N50 value was seen at the K-mer
length of 37. The contigs made at 37 were then run on BLAST against GenBank. A
number of contigs were found that matched Passerines, but they did not cover the entire
genome. Bennet next tried the contigs generated using a K-mer length of 63 with an
expected coverage of 12. When run on BLAST more contigs were found that matched
Passerines. The contigs from these two K-mer lengths were combined in Geneious, and
a super contig spanning 17991 bases was generated (Figure 10). A single gap remained
in the first control region next to tThr (Figure 10), the length of this gap was unknown.
This gap was later covered using PCR and capillary sequencing done by the MGS. This
supercontig was then used as a reference genome for mapping in BWA. The genome
has a mean coverage depth of 54.2 reads (standard deviation of 21), and the maximum
coverage depth is 153 reads. There are two regions within the 12S rRNA where the
coverage was low; the base calling of these sites were checked using PCR and capillary
sequencing. The genes were annotated using the Taiwan bulbul (Pycnonotus taivanus)
as the reference genome, and DOGMA software to find the tRNAs. There is a
duplicated control region, with the first found between tThr and tPro, and the second
between tGlu and tPhe, this gene arrangement is seen in many of the passerines, and
was first identified in the falcons (88).

56
Figure 10: Fernbird mitochondrial genome. Assembled using Velvet, BWA and Geneious. Annotated using Pycnonotus taivanus as the reference genome, and DOGMA to find the tRNAs. One gap remained in the first control region (unknown length) after assembling the Illumina reads. This gap was covered using capillary sequencing by MGS.
3.3.4 Waxeye
The silver-eyed mesia’s (Leiothrix argentauris) mitochondrial genome was used as
reference genomes for the assembly of the waxeye gnome. The processed reads were
mapped to the reference genome in BWA. Only around 3000 reads initially mapped to
the reference genome. The contigs made from BWA and the reference genome
continued to be used in BWA to map extra reads, extending out the contigs. This
method produced two large contigs spanning from the second control region to Cox3
and from CytB into the first control region. Overall 655,771 reads in total had mapped
to the two supercontigs, with an average coverage depth of 8986 reads. Two gaps

57
remained the first around 4000bp in length from Cox3 to CytB and the other around
1500bp from the first control region to the second control region.
A de novo assembly of the reads was then tried using the software Velvet. A K-mer
sweep was performed using Velvet; this identified the K-mer length that produced the
highest N50 for the set of reads. K-mers of 127 was best for the waxeye (Table 13),
using an expected coverage of auto (which cuts off contigs with coverage less than half
the median coverage). Other expected coverage values were tried but Auto was found to
have the highest N50. The contigs produced by Velvet at this K-mer length, were run
through BLAST identifying any that matched with other passerines (not shown). All
matched within the supercontig made using BWA, so we were unable by this method to
cover the two gaps in the mitochondrial genome. However the two gaps in the waxeye
genome were covered using PCR and capillary sequencing, a full list of primers used is
found in Supplementary Table 1. The completed waxeye mitochondrial genome spans
17,973bp and contains a duplicated control region (Figure 11). A duplicated control
region is also found in the waxeye mitochondrial genome, and is the same gene
arrangement as the fernbird.
Table 13: K-mer sweep of the waxeye reads. Performed using shuffled paired reads from the waxeye data, on the software Velvet. K-mer is the length in bases of the K-mer. Expected coverage set at Auto means contigs are cut when coverage reaches less than half the median coverage. N50 is a statistic describing the quality of the assembled contigs (higher numbers equal better quality). Max contig length is the length in bp of the longest contig made by Velvet. K-mer Expected coverage N50 Max contig
length (bp) Total number of contigs
101 Auto 101 5730 5200 121 Auto 584 5553 185 127 Auto 1699 6151 43 127 4 750 6151 83 127 10 765 2481 77

58
Figure 11: Waxeye mitochondrial genome. Assembled using Velvet, BWA and Geneious. Annotated using Leiothrix argentauris as the reference genome, and DOGMA to find the tRNAs. Two gaps remained after assembling the Illumina reads; the first from Cox3 to CytB, and the second from Control region 1 to Control region 2. These gaps was covered using capillary sequencing by MGS.

59
3.3.5 Browncreeper
The rook (Corvus frugilegus) was used as the reference genome for the
browncreeper reads. BWA was used to map the processed reads to the reference
genome; the contigs made from BWA were then used to map extra reads. After multiple
runs in BWA 105 reads were aligned into around 20 small contigs covering many
different regions of mitochondrial genome. After BWA another mapping software,
Bowtie 2 (77), was used on the reads. Bowtie 2 was run using local mapping, this is
where any section along the 150bp reads can be mapped to the reference genome, and if
the ends are different they are trimmed. Local mapping differs from the default end to
end mapping where the ends of the reads are mapped first, if these don’t match the
reference genome the whole read does not map. The use of local mapping extended the
contigs produced from BWA for the browncreeper, with 253 reads formed into 21
contigs with a mean coverage depth of 3.5 reads.
The K-mer sweep of the browncreeper reads found the highest N50 at K-mers 127
bp in length (Table 14). When contigs were run on BLAST against GenBank, no
sequences were found to match avian mitochondrial data. A low expected coverage
value of 5 was tried at K-mer lengths of 127 and 97, and the contigs produced by Velvet
were run on BLAST. Three from the K-mer length of 97 matched passerine
mitochondrial DNA (not shown), they match what had already been produced using
BWA and Bowtie 2.
Overall 10,555 bases of the browncreeper genome has been sequenced, with
sequence from 2 rRNA, 17 tRNA and 11 protein coding genes, along with over 1000bp
of the control region. As no DNA from the browncreeper remained the gaps were not
covered using PCR and capillary sequencing.
Table 14: K-mer sweep of the browncreeper reads. Performed using shuffled paired reads from the browncreeper data, on the software Velvet. K-mer is the length in bases of the K-mer. Expected coverage set at Auto means contigs are cut when coverage reaches less than half the median coverage. N50 is a statistic describing the quality of the assembled contigs (higher numbers equal better quality). Max contig length is the length in bp of the longest contig made by Velvet. K-mer Expected coverage N50 Max contig
length (bp) Total number of contigs
97 5 287 1701 4450 107 Auto 631 6876 1101 115 Auto 788 6868 713 121 Auto 2151 21874 312 127 Auto 2940 21986 183 127 5 831 6041 453

60
Figure 12: Browncreeper partial mitochondrial genome. Assembled using Velvet, BWA, Bowtie2 and Geneious. Annotated using Corvus frugilegus as the reference genome, and DOGMA to find the tRNAs. Twenty one gaps remain after assembling the Illumina reads, indicated here by the green symbol, the size of each is unknown.

61
3.3.6 Bellbird
For the bellbird the tui (Prosthemadera novaeseelandiae) was used as a reference
genome. The reads were run on BWA, but only two reads mapped to the tui genome.
The reads were then run through Bowtie 2, using local mapping, but only the same two
reads were found. Two bellbird mitochondrial genes had been previously sequenced, the
12S rRNA and the NADH2 gene, these were tried as reference genomes in both BWA
and Bowtie 2, and no reads mapped. The K-mer sweep in Velvet of the bellbird reads
found the highest N50 at K-mers of 57 (Table 15). The program Blast2GO (78) was
used to run the contigs produced through BLAST against GenBank. No passerine
contigs were found, a summary of the species distribution of the BLAST results for K-
mers of 97bp in length shows the contigs matched bacteria (Figure 13A). These results
suggested that none of the “bellbird” reads were actually from bellbird DNA, but were
made from contaminant bacterial DNA instead. With the browncreeper BLAST2GO
was used to run all the contigs produced from the browncreeper reads as a comparison;
it found the vast majority of contigs also matched bacteria, but a small proportion were
passerine indicating some of the reads were from browncreeper DNA.
Table 15: K-mer sweep of the bellbird reads. Performed using shuffled paired reads from the bellbird data, on the software Velvet. K-mer is the length in bases of the K-mer. Expected coverage set at Auto means contigs are cut when coverage reaches less than half the median coverage. N50 is a statistic describing the quality of the assembled contigs (higher numbers equal better quality). Max contig length is the length in bp of the longest contig made by Velvet. K-mer Expected coverage N50 Max contig
length (bp) Total number of contigs
57 Auto 359 4256 66781 97 Auto 267 1533 8077 107 Auto 241 1792 5620 127 Auto 138 2033 1466

62
Figure 13: Bellbird and Browncreeper Blast2GO results from Velvet contigs. Contigs run through BLAST against GenBank. A) The species distribution of the “bellbird” contigs when run on BLAST. Made at K-mer length of 97bp. B) Browncreeper contigs top matching species distribution. Made at K-mer length of 35bp. The only avian DNA identified here is the zebrafinch (Taeniopygia guttata) highlighted in the browncreeper reads.
Short range PCR using total genomic DNA and capillary sequence was then used to
sequence the bellbird genome. A partial mitochondrial genome (9453bp) of the bellbird
has been sequenced (Figure 14). 2 rRNA, 14 tRNA, and 10 protein coding genes are at
least partially sequenced, while nine gaps remain un-sequenced. It would have been
good to have another Meliphagidae mitochondrial genome (because it is a basal oscine),
but it does not affect our aim of having one mitochondrial genome from every New
Zealand family of passerines. It will be a future project to complete the bellbird genome.

63
Figure 14: Bellbird partial mitochondrial genome. Assembled using Geneious. Annotated using Prosthemadera novaeseelandiae as the reference genome, and DOGMA to find the tRNAs. Nine gaps remain after capillary sequencing, indicated here by the green symbol, the size of each gap is unknown.

64
3.4 Transcriptome reads Using the brain transcriptome sequenceing reads data from Kunstner et al. (79), the
sequence of some of the mitochondrial genes have been assembled, with Nabholz et al.
(2) assembling the protein coding genes, and myself assembling the rRNA and tRNA
genes. The full list of which genes have been extracted from each species is found in
Table 16. Around 14,000 bp from each of the four species has been extracted.
Table 16: Mitochondrial genome genes extracted from the brain transcriptome reads. Reads were sequenced using the 454 transcriptome sequencing by Kunstner et al. (79). The protein coding genes were assembled by Naholz et al. (2), and the tRNA and rRNA were assembled by myself. A full list of the mitochondrial genes assembled from the transcriptome reads is given for each species. The full gene sequence has been assembled unless indicated as being only partial (P). Species Mitochondrial genes assembled from reads Total bases Golden-collared manakin - Manacus vitellinus
tPhe (P), 12S, 16S, tLeu, ND1, tMet (P), ND2, tTyr, Cox1, tSer, tAsp, Cox2, tLys, ATP8, ATP6, Cox3, tGly, ND3, ND4L (P), ND4, tHis (P), ND5 (P), CytB
14,287
American crow - Corvus brachyrhynchos
12S, 16S (P), tLeu (P), ND1, tIle, tGln (P), ND2, Cox1, tSer, tAsp, Cox2, ATP8 (P), ATP6, Cox3, tGly, ND3, ND4L (P), ND4, ND5 (P), CytB, ND6, tGlu (P)
14,061
Pied flycatcher - Ficedula hypoleuca
12S, 16S, ND1, tIle (P), ND2, tTyr, Cox1, tSer, Cox2, ATP8 (P), ATP6, Cox3 (P), tGly, ND3, ND4L (P), ND4 (P), ND5, CytB
14,563
Blue tit - Parus caeruleus
tPhe, 12S, tVal (P), 16S, tLeu, ND1, tIle, tGln, tMet (P), ND2 (P), Cox1, tSer, tAsp, Cox2, tLys, ATP8, ATP6, Cox3, ND3, ND4 (P), ND5, CytB
14,314
3.5 Phylogenetic analysis The results of both the maximum likelihood (Figure 15) and Bayesian (Figure 16)
analysis phylogenetic trees are discussed, focusing on certain parts of the tree using
maximum likelihood analyses consensus networks. Analyses were run using the full
species data set (83 species with 13588bp of mitochondrial data from each) and smaller
species sets (see section 2.6). Maximum likelihood phylogenetic analyses were
conducted using RaxML (82), producing a set of possible trees and a “best tree”
summarized from this set showing support for each node in the form of a posterior
probability bootstrap. Initially five million generations were run on MrBayes (83),
sampling every 2500th generation, but Tracer v1.5 suggested that the effective sample
size (ESS) was too small. 10 million generations, still sampling every 2500th generation,
was found to produce a large enough ESS so was therefore used for all MrBayes
analyses. All the trees produced after a burn in of 1 million generations were then
summarized into the Bayesian analysis phylogenetic tree (Figure 16).

65
Fi
gure
15:
Max
imum
like
lihoo
d ph
ylog
enet
ic a
naly
sis t
ree
from
all
79 p
asse
rine
spec
ies u
sing
mito
chon
dria
l gen
ome
data
(135
88bp
). Fo
ur p
arro
ts w
ere
incl
ude
as a
n ou
t-gro
up b
ut h
ave
been
rem
oved
to im
prov
e vi
ewin
g. A
ll no
des h
ave
full
post
erio
r pro
babi
lity
boot
stra
p su
ppor
t (10
0) u
nles
s ind
icat
ed. P
rodu
ced
from
max
imum
like
lihoo
d an
alys
is re
sults
from
Rax
ML
in F
ig T
ree
v1.4
0. T
he 1
3 as
teris
ks (*
), si
gnal
the
spec
ies m
itoch
ondr
ial g
enom
e ha
s bee
n se
quen
ced
by o
ur
grou
p an
d is
unp
ublis
hed.

66
Fi
gure
16:
Bay
esia
n an
alys
is p
hylo
gene
tic tr
ee fr
om a
ll 79
pas
seri
ne sp
ecie
s usi
ng m
itoch
ondr
ial g
enom
e da
ta (1
3588
bp).
Four
par
rots
wer
e in
clud
ed a
s an
out-g
roup
but
hav
e be
en re
mov
ed to
impr
ove
view
ing.
All
node
s hav
e fu
ll po
ster
ior p
roba
bilit
y bo
otst
rap
supp
ort (
1) u
nles
s ind
icat
ed. P
rodu
ced
from
Bay
esia
n an
alys
is re
sults
from
MrB
ayes
in F
ig T
ree
v1.4
0. T
he 1
3 as
teris
ks (*
), si
gnal
the
spec
ies m
itoch
ondr
ial g
enom
e ha
s bee
n se
quen
ced
by o
ur g
roup
and
is u
npub
lishe
d.

67
The parrots have all grouped together (Supplementary Figure 1), with full bootstrap
support for the branching pattern seen in Pacheco et al. (5). There is also undisputed
support for the monophyly of the passerines (Figure 15). The diverging of the three
main sub-orders, the Acanthisitti, suboscines and oscines, has not been resolved in
either the maximum likelihood (Figure 15) and the Bayesian (Figure 16) analyses. Both
trees have weak support for the grouping of the suboscines with the rifleman
(Acanthisitta chloris). The consensus network from the maximum likelihood analysis
(Supplementary Figure 2) demonstrates this, with around a third of the trees produced
grouping the rifleman with the suboscines, while almost half have the rifleman as sister
to the oscines and suboscines.
There is full bootstrap support for the suboscines as a group (Figure 15 and Figure
16). The suboscines have diverged into the two expected lineages; the Tyrannides from
the Americas (Cnemotriccus fuscatus and Manacus vitellinus) and the Eurylaimides
from Africa and Asia (Smithornis sharpei). The oscines have also all grouped together
as expected with complete bootstrap support (Figure 15 and Figure 16). The first to
diverge from the oscine branch is the lyrebird (Menura novahollandiae), followed by
the three Meliphagoidea. The grey warbler (Gerygone igata) is sister to the two closely
related honey-eater species the tui (Prosthemadera novaseelandiae) and bellbird
(Anthornis melanura).
The next branching event is the splitting of the two large oscine lineages: the Core
Corvoidea and the Passerida. The Core Corvoidea as a whole has full support in both
the maximum likelihood and Bayesian analysis phylogenetic trees (Figure 15 and
Figure 16). The first to diverge from the lineage is the New Zealand native the
browncreeper (Mohoua novaeseelandiae), followed by the other native, the fantail
(Rhipidura fuliginosa), both of these events are fully supported. At the crown of Core
Corvoidea is the crow group represented by six species. There is complete support for
them as a monophyletic group, but little support for any of the divergence events within
the group, apart from the pairing of the two Corvus species (Supplementary Figure 3).
The pairing of Cyanopica and Podoces is seen in both the maximum likelihood (Figure
15) and Bayesian (Figure 16) trees, with weak support (50 and 0.79). Pica and Garrulus
also are paired together (33 and 0.98), with some support for grouping this pair with the
two Corvus (35 and 0.98). When taxa with uncalled bases were removed (including the
Core Corvoidea: Corvus brachyrhynchos and Mohoua novaeseelandiae), the branching

68
pattern of the crows changed (Supplementary Figure 4), but again no node has strong
support.
Note that the Australasian robins (Petroica australis and Petroica macrocephala),
the New Zealand wattlebirds (Philesturnus carunculatus) and the hihi (Notiomystis
cincta) have all branched off at the base of the Passerida. There are three questions
surrounding the three families (Petroicidae, Callaeidae and Notiomystidae) that make up
the “basal Passerida”. First, there is full support from both the maximum likelihood and
Bayesian phylogenetic trees (Figure 15 and Figure 16) for the placement of these three
families at the base of the Passerida. Second are the three families monophyletic? There
is only weak support (67%) from the maximum likelihood tree (Figure 15), but there is
full support from the Bayesian analysis (Figure 16). Third what is the exact order of
branching of the three families? There is full bootstrap support for the joining of the two
Petroica together. The Bayesian analysis (Figure 16) has very strong support (0.98) for
the Petroicidae pairing with the Notiomystidae, but the consensus network
(Supplementary Figure 5) shows only 53% of the trees produced from the maximum
likelihood analysis have the robins grouping with the hihi. Another 39% have the
Callaeidae and Notiomystidae paired together (Supplementary Figure 5), and the
Petroicidae are the sister group. When all taxa with uncalled bases are removed from the
data set the bootstrap support for the monophyly of the “basal Passerida” increases
slightly from 67% to 70% (Supplementary Figure 4). The support for the grouping of
the Petroicidae with the Notiomystidae also increases from 53% to 60%. When running
the 63 Passerida species including these four basal Passerida, the support for the four
together increases to 100%, but support for Petroica with the Notiomystis decreases to
54% (Supplementary Figure 6).
The monophyly of the Passerida without the basal Passerida is fully supported from
both the maximum likelihood and Bayesian analysis phylogenetic trees that the three
superfamilies of the Passerida all group (Figure 15 and Figure 16). But how the three
superfamilies split apart is still unresolved. There is weak support (56% and 0.74) for
the Passeroidea grouping with the Muscicapoidea, with the Sylvioidea as the basal
group. But as the maximum likelihood consensus network shows a significant
percentage (33%) of the trees produced in RaxML also support the Passeroidea pairing
with the Sylvioidea (Supplementary Figure 8). A number of different maximum
likelihood trees were made, the first removed any taxa with uncalled bases
(Supplementary Figure 4), which again grouped the Passeroidea with the

69
Muscicapoidea, but support had dropped to only 54%. When only the Passerida species
were run (Supplementary Figure 6) the Passeroidea now paired with the Sylvioidea with
weak support (59%), and when two species were removed (Ficedula hypoleuca and
Lampropsar tanagrinus, as they had uncalled bases) the support for the Passeroidea and
Sylvioidea grouping together improved to 73% (Supplementary Figure 7). What all
these different trees show is that how the three superfamilies have diverged is still
unresolved, and increasing the number of species used in these phylogenetic analyses
has not improved the resolution. However, so far each of the three superfamilies appears
to be monophyletic.
The Paridae were considered by some studies (2) as their own superfamily, there are
only two species classified in this lineage used in this study; Parus caeruleus and
Pseudopodoces humilis. The two species are placed in different locations on the
phylogenetic trees (Figure 15 and Figure 16) suggesting the Paridae are not
monophyletic. In this Pseudopodoces humilis is found within the Muscicapoidea with
full support from both trees. This suggests Pseudopodoces humilis has been wrongly
classified within the Paridae and should instead be classified as part of the
Muscicapoidea. The only other Paridae used in this study is Parus caeruleus (blue tit)
which has branched off at the base of the Sylvioidea. The support for this is very strong
in both trees (Figure 15 and Figure 16). As this is the superfamily in which the Paridae
were originally classified, I find no support for them as their own superfamily. Although
based on the branch length in both analyses, they are clearly a very deep lineage within
the Sylvioidea.
There is full support from both trees for the monophyly of the Sylvioidea (Figure 15
and Figure 16). At the base of the Sylvioidea is a polytomy, with the two different
phylogenetic trees giving different branching patterns (Figure 15 and Figure 16). There
is only weak support for the majority of the nodes in this superfamily; this is
demonstrated by the consensus network of the maximum likelihood phylogenetic tree
(Supplementary Figure 9). Only two groupings have strong support; the first is the large
group containing the nine Tachycineta species and Progne chalybea, the other is the
grouping of the New Zealand native Zosterops lateralis (waxeye), with Leiothrix
argentauris and the two Sylvia species. Five different lineages have split apart from
polytomy site (Supplementary Figure 9), one of the lineages consists of the New
Zealand fernbird (Bowdleria punctata). There does appear to be weak support for the
grouping of the four species above with the two Pycnonotus species (Supplementary

70
Figure 10). The Bayesian analysis tree has the Tachycineta fully resolved (Figure 16),
but in the maximum likelihood tree there is an unresolved site in the Tachycineta
(Supplementary Figure 9). The maximum likelihood trees produced by using only
Sylvioidea taxa improved the resolution, with strong support for a number of divergence
events (Supplementary Figure 10). There is now full bootstrap support for the
divergence pattern seen in the Bayesian analysis tree (Figure 16)
The monophyly of the Muscicapoidea is fully supported, with the 11 species that
were classified in the superfamily all grouping together (Figure 15 and Figure 16). The
Muscicapoidea in general is well resolved with full support for the majority of
branching events from both the maximum likelihood and Bayesian phylogenetic trees
(Figure 15 and Figure 16). There is a division at the base into two groups. The two
Ficedula species have paired together as expected, these group with another pair made
of Luscinia calliope and Pseudopodoces humilis, which as mentioned above appears to
have been wrongly classified as part of the Sylvioidea family the Paridae. Cyanoptila
cyanomelana branches below these four followed by the song thrush (Turdus
philomelos), which as expected is found within this superfamily. In the other half of the
Muscicapoidea there is a group of four species made of the three Sturnus species and
Acridotheres cristatellus. Branching off basal to these four is Gracula religiosa. How
the Sturnus and Acridotheres species diverge is unresolved in the full maximum
likelihood tree (Figure 15). The consensus network shows just over half of the trees
produced in RaxML supported splitting the foursome into two pairs (Supplementary
Figure 11), with the Acridotheres pairing with Sturnus tristis, but around 40% of the
other trees had Sturnus sericus as the sister taxa of this pair. What is definite is that
Acridotheres cristatellus lies within the genus Sturnus, questioning the monophyly of
the Sturnus.
There are 29 Passeroidea species analysed here have all grouped together supporting
the monophyly of the superfamily (Figure 15 and Figure 16), and most of the
divergences within are fully supported by both the maximum likelihood and Bayesian
analyses. At the base of the superfamily the pair Taeniopygia guttata and Vidua
chalybeata diverge from the other species. The next to branch off is the New Zealand
native the pipit (Anthus novaeseelandiae), followed by the two Carduelis species, then
the two Emberiza species, leaving the large Icteridae family which consists of the
remaining 22 species. The consensus network (Supplementary Figure 12) of the
maximum likelihood analysis has strong support for most divergence events in this

71
large family, but at a number of sites there is uncertainty, this is likely due to the
relatively short time between each divergence event.

72

73
4 Discussion
4.1 DNA extraction and Illumina sequencing The Illumina sequencing worked well for the fernbird, tomtit, pipit and waxeye
samples, with the majority of their mitochondrial genomes being sequenced. But the
Illumina sequencing did not work very well for both the browncreeper and bellbird, and
it was not possible to assemble the full mitochondrial genomes of these two species.
Only two of the bellbird reads mapped to the available bellbird mitochondria sequence
or to the full tui mitochondrial genome (a close relative). A large number of reads
assembled into contigs that matched bacteria when run through BLAST2go against
GenBank (Figure 13). And with the browncreeper reads only around 250 reads mapped
to passerine sequence, again a large proportion of the reads assembled into contigs that
matched bacteria (Figure 13). Both of these results indicate that the DNA samples used
for Illumina sequencing contained only a very small amount of bird DNA, and a large
amount of contaminant DNA. The possible reasons for this I will discuss further.
When the DNA was extracted from the tissue samples both the browncreeper (11.8
ng/μl) and bellbird (20.2 ng/μl) had very low concentrations (Table 3), but the pipit
DNA (10.7 ng/μl) was also low though the full genome was assembled using the reads
produced from its DNA sample. The DNA in the browncreeper and the bellbird were
also degraded, the DNA is visible as smears in the gel electrophoresis photo (Figure 4).
The browncreeper DNA was extracted from an old museum sample provided by Te
Papa, collected in 1983, it had been preserved in ethanol since then. While the bellbird
was extracted from blood collected in 2006 and had been stored chilled (but not frozen)
for six years. The long-time stored in ethanol or as chilled blood may be the reason why
these two samples had very low DNA concentrations and were degraded. There would
also have been considerable opportunity for the samples to become contaminated with
bacteria during this time.
But at this stage there was still passerine DNA in the samples, PCR was used to
amplify a small region of the mitochondrial genome and the products were capillary
sequenced by the MGS. Only primer combinations which produced products around
1000bp worked for the bellbird DNA sample, but for the browncreeper I was only able
to produce even smaller products (~400bp). When the sequence from these PCR
74
products was run on BLAST against GenBank they both matched passerines (Table 3).
So there was definitely passerine DNA in the samples, but the question still remains
how much was bird DNA and how much was bacterial contaminant DNA?
Because the DNA was low concentration and degraded, REPLI-g® (Qiagen®) was
used on both the browncreeper and bellbird samples. This amplifies the DNA producing
long concatenated DNA products. REPLI-g® works well on samples with low DNA
concentrations, but DNA fragments greater than 2-3kb (10kb is optimal) are preferred
for amplification (89, 90). As both DNA samples were degraded (average fragment
length under 1kb), especially the browncreeper, it is possible contaminant DNA from
bacteria was targeted by the REPLI-g® enzyme for amplification instead of the
passerine DNA. Previous studies have shown that when REPLI-g® amplifies a sample
of DNA it does so in a biased manner (89, 90); sequences with lower GC content and
higher numbers of repeats are amplified preferentially. The bacterial DNA may have
had a lower GC content than the mitochondrial genomes and had repeats, and was
therefore amplified by the REPLI-g® enzyme instead. After REPLI-g® the DNA
concentration had increased and the samples were now a higher molecular weight
(Table 5 and Figure 4).
When the quality of the Illumina sequencing reads were checked using Fast QC both
the browncreeper and bellbird reads were given warnings or failed a number of
categories (Table 7). But they did not appear to be any worse quality then both the
waxeye and tomtit reads, from which both their mitochondrial genomes were
successfully assembled. Fast Q screen was then run on the bellbird and browncreeper
reads to check for any possible signs of contamination by comparing the reads to E.
coli, yeast, PhiX, adapters and vectors. No matches were seen (Figure 5), suggesting the
reads were free of contamination. But when run on BWA out of the 2.5 million bellbird
Illumina sequencing reads only two were passerine, the majority were bacterial. BWA
did not work very well for the browncreeper as well, out of 1.9 million reads only 121
mapped to the reference genome. Bowtie 2 was then tried which maps the reads locally
(Material and Methods section 2.5.3), and another 132 reads mapped to the reference
genome. Often these reads were partially browncreeper sequence and part pFossil-
cloning vector sequence (GenBank number: JX069762 and JX069764). Perhaps this
pFossil-cloning vector sequence was added to reads during the REPLI-g® process? In
Geneious the pFossil sequence was then trimmed from the reads. Using this method

75
only small regions of the browncreeper’s mitochondrial genome were recovered (253
reads, 2.2 mean coverage of 10555 bases).
While the use of tissue from museum samples is not ideal because they are often
old, the DNA is degraded, and are more likely to be contaminated compared to fresh
samples. But museum samples are still very useful for improving phylogenetic studies,
and in some occasions they are the only option. Many of the species which are useful
for understanding phylogeny are endangered, extinct, under restrictions for the taking of
live samples, or in geographically isolated locations, this makes the use of fresh tissue
samples difficult (91).
Nevertheless it is a recommendation from the present work that New Zealand
establishes a bank of good tissue/DNA samples that are available for use in research
such as sequencing. The Australian National Wildlife Collection (managed by CSIRO)
is a very good example. They have a large and extensive collection of Australia’s land
vertebrates, which are available for use in research and includes a bank of frozen tissue
from Australasian birds (92). During this study it was difficult to find good quality
tissue samples for many of New Zealand’s native species, and often all that was
available were old museum samples. It would be useful if there was a national database
where different museums, government departments, universities and research institutes
could document what native animal and plant samples they have, how they are stored
(tissue or DNA), and if the samples have been used previously for research. Then
anyone who is conducting research could access this database, find samples of the
species they are interested in and organise the use of these samples.
4.2 Phylogeny Many of the results here are not novel but are instead confirmation of results seen in
previous studies on passerine phylogeny. All the New Zealand taxa have branched off
the phylogenetic tree in the group they were expected to be placed in, but there is
evidence to suggest some lineages may need reclassification. I will now go through the
different parts of the passerine tree discussing certain aspects of the tree including
interesting placements of taxa.
The order of divergence of the three suborders, the Acanthisitti, suboscines and
oscines, is unresolved in both the maximum likelihood and Bayesian phylogenetic trees
(Figure 15 and Figure 16). But the placement of the Acanthisitti suborder as sister to the

76
other passerines, with the oscines and suboscines splitting later has been well
established by many studies (1, 2, 5, 13). In this study the only out-group taxa used
were the parrots, in other studies (5, 13) they have used representatives from a number
of avian orders, and there has been full support for the rifleman at the base of the
passerines. One reason why the rifleman may have grouped with the suboscines in a
large proportion of the trees produced is because of long branch attraction. The rifleman
has been separated from all other birds in this study for possibly around 80 million years
(1, 17), that means a large amount of changes to the mitochondrial genome sequence
would have accumulated. And as there are many oscines but only three suboscine
genomes there could be some attraction. A possible solution to this problem would be to
sequence extra mitochondrial genomes from both the New Zealand wrens (only other
extant species is the rock wren Xenicus gilviventris) and other suboscines. These extra
genomes may break up the long branches, thus preventing long branch attraction. There
was also full support for the monophyly of both the suboscines and oscines. The
phylogeny of the suboscines has not been studied in any detail using mitochondrial
genomes (5); the sequencing of extra genomes from these may also provide support for
hypotheses made about their evolutionary history.
The lyrebird (Menura novahollandiae) is sister to the other oscines, this confirms
the results from other studies (1, 13, 15) that the Menuridae is the most basal oscine
lineage. The next lineage to diverge from the main oscine branch was the three
Meliphagoidea species the grey warbler (Gerygone igata), tui (Prosthemadera
novaeseelandiae) and bellbird (Anthornis melanura). This again confirms what has been
seen in other studies (26, 28, 29), that they form a monophyletic group that branches of
basally to the large Core Corvoidea and Passerida split. The sequencing of a
mitochondrial genome from a representative of the other two families within the
Meliphagoidea (Pardalotidae and Maluridae), along with other deep oscine lineages
such as the Climacteridae (tree creepers), Ptilonorhynchidae (bowerbirds),
Pomatostomidae (Australian babbler), and Orthonychidae (logrunners), would be very
useful for studying the deep phylogeny of the oscines.
All of the Core Corvoidea species have grouped together with full bootstrap support
from both the maximum likelihood and Bayesian analysis phylogenetic trees (Figure 15
and Figure 16). This confirms the monophyly of the group. The relationships within the
Core Corvoidea are poorly resolved (52). Multiple studies have found a polytomy at the
base of the Core Corvoidea (15, 32), with as many as five different lineages more or less

77
branching from the same point. Previous studies using full mitochondrial genome data
have only used species from the true crow family (Corvidae); only the rook (5), the rook
and American crow (2), or the full genome of the rook with a few mitochondrial genes
of other Core Corvoidea (15). This is the first study to use non Corvidae: the full
mitochondrial genome of the fantail (Rhipidura fuliginosa) and the partial genome of
the browncreeper (Mohoua novaeseelandiae), and we can therefore begin to break up
the polytomy. The fantail had previously been placed with the crows (31, 33), or with
piopios and vireos or at the polytomy (15). While the Mohoua has been grouped with
the whistlers (28), or the crows (15), or branching of at the polytomy (32). We now
have very strong support for the placement of the Mohoua as sister to the fantail and
crows. The mitochondrial genome sequence of the other groups within the Core
Corvoidea superfamily are now needed; including a vireo (Vireonidae), whistler
(Pachycephalidae), bird-of-paradise (Paradisaeidae). These could allow a full resolution
of the Core Corvoidea polytomy. The browncreeper mitochondrial genome also needs
to be completed.
At the crown of Core Corvoidea the six true crow (Corvidae) species have all
grouped together with full support (Figure 15 and Figure 16). But it is unresolved how
they have all split apart, with little support for any of the divergence events apart from
the pairing of the two Corvus species together (Supplementary Figure 3).The Core
Corvoidea originated in Australasia (32), and both the Mohoua (34) and the
Rhipiduridae (33) have their centre of diversity here. This suggests these two lineages
diverged away from the Corvidae while the Core Corvoidea was still only in
Australasia. Jonsson et al. (32) suggests that the formation of the Papuan islands around
34 mya selected for greater flying in the Core Corvoidea and provided the group a
passage to reach the rest of the world from Australia. Once the group reached Asia they
underwent many rapid radiations filling the many different ecological niches present in
the rest of the world (32). As the six crows used here are all found in either Eurasia or
the Americas, they may represent the radiations that rapidly expanded after the
Corvoidea escaped Australasia. This would explain why resolving this part of the tree is
very difficult as many divergence events would have occurred in a short space of time,
allowing very few molecular sequence changes to accumulate between each divergence
event.
The three families (Petroicidae, Callaeidae and Notiomystidae) that make up the
basal Passerida have all been placed in different positions on the tree by earlier studies

78
including in the Core Corvoidea and the Meliphagoidea (1, 10, 27, 30, 33). However
more recent studies agree and have now placed them at the base of the Passerida (15,
21, 22, 28, 31). The present study is the first that uses full mitochondrial genome
sequence from at least one species of each of the three families. There is full support for
the placement of these three families branching off at the base of the Passerida (Figure
15 and Figure 16), confirming the above studies which focused on the families
individually. This suggests the species that make up these three families should be
formally reclassified as Passerida. Whether these three families all group together
forming their own monophyletic group is still unresolved although there is support for
this (Figure 15, Figure 16 and Supplementary Figure 5). The three basal Passerida
families may only be grouping together due to long branch attraction as they are all
relatively long branches and the three families have been separated for around 30
million years (21, 22). The sequencing of the Kokako (Callaeas cinereus) and extra
Petroicidae would help break these long branches up, providing better resolution of the
phylogeny of the basal Passerida.
Previous studies have used the presence of duplicated control regions to resolve
phylogeny (64, 65). The saddleback has only one control region between tGlu and tPhe,
this is the gene arrangement that is seen in most passerines and presumably the common
ancestor of all three basal Passerida lineages. The Petroicidae have a partial duplication
of the control region, their first control region is located between tThr and tPro and is
large (1095-1097 bp), while the second control region is found between tGlu and tPhe
and is relatively small (190-246 bp). This suggests there has been a duplication of its
control region into the 1st control region position (Figure 9), followed by considerable
reduction of the original control region (2nd control region position). The hihi has a
duplicated tPro, ND6, tGlu, and control region, with the second copy following directly
after the first, this is not seen anywhere else in the passerines. These duplicated genes in
the hihi are all the same length and identical sequence, and the two control regions are
almost identical (the second has around 100bp extra on the 3’ end), the lack of
nucleotide changes in these genes/regions suggests the duplication event has occurred
relatively recently. So overall these duplication events have not provided any insight
into how the three families have split apart. These three families are all found only in
Australasia so dating when they broke from the main Passerida branch will provide an
upper limit for the time when the Passerida dispersed out into the rest of the world.

79
The three superfamilies of the Passerida (Sylvioidea, Passeroidea and
Muscicapoidea) have all grouped together with full support, and there is full support for
the monophyly of each of the three superfamilies, but their order of divergence still
remains unresolved. There is weak support (56% and 0.74) for the grouping of the
Passeroidea with the Muscicapoidea (Figure 15 and Figure 16). This is the branching
order seen in other studies using nuclear data (1, 41), and the latest study using full
mitochondrial genomes from 33 passerines (52), but disagrees with other studies using
smaller amounts of mitochondrial data (2, 40) and Hackett et al. (13). This uncertainty
is likely due to the rapid radiation of the Passerida where the three superfamilies all split
apart within a short time period; this has meant there are only short interior nodes
between the three superfamilies. Overall the question of which of the three
superfamilies diverged first from the Passerida is still not resolved, a new approach is
needed to solve it. The use of more molecular data in the form of mitochondrial
genomes from multiple species of each superfamily has not improved the resolution. In
the molecular data section of the discussion below (section 4.3) I will discuss some
possibilities for improving the resolution of some of these sites on the phylogenetic tree
that remain unresolved.
The Paridae are a family that are traditionally classified in the superfamily
Sylvioidea, but some have suggested they are their own superfamily (2, 40, 41). There
are two species classified within the Paridae with mitochondrial genome sequence
available, the Hume’s ground tit (Pseudopodoces humilis) and the blue tit (Parus
caeruleus). Pseudopodoces humilis was placed within the Muscicapoidea with full
support (Figure 15 and Figure 16), while Parus caeruleus branched off at the base of the
Sylvioidea. The placement of these two Paridae species in different parts of the tree
suggests the current Paridae family is not a monophyletic group. The Hume’s ground tit
(Pseudopodoces humilis) was originally placed within the Core Corvoidea, but James et
al. (93) suggested that it should be instead placed within the Paridae. Our placement of
the species within the Muscicapoidea was also seen in the recent study by Marshall et
al. (52), who found Pseudopodoces humilis paired with Luscinia calliope. Both the
maximum likelihood and Bayesian phylogenetic trees (Figure 15 and Figure 16) have
strong support (80% and 0.97) for this pairing. Therefore, we suggest Pseudopodoces
humilis needs to be reclassified as part of Muscicapoidea, possibly in the same family as
Luscinia calliope. The other Paridae Parus caeruleus branched off at the base of the
Sylvioidea, as this is the superfamily where the Paridae were originally classified I find

80
little support for the suggestion that they are their own superfamily. Before a decision
can be made mitochondrial genome sequence from other Paridae needs to be collected,
which can then be used to test whether the Paridae (minus Pseudopodoces humilis) is a
natural monophyletic group. The position where Parus caeruleus diverged from the
main Sylvioidea branch is very deep; this suggests the Paridae family has been
separated from the other species in the superfamily for a considerable amount of time.
The rest of the Sylvioidea have grouped together with complete bootstrap support
(Figure 15 and Figure 16), but the splitting within Sylvioidea is still unresolved
(Supplementary Figure 9). A number of my findings for the Sylvioidea support the
results of Jonsson and Fjeldsa (33) who looked at the relationships of different families
with the superfamily. They separated the different families into 13 clades. I have the
native waxeye Zosterops lateralis and Leiothrix argentauris paired together
(representing clade 12), these have grouped with the two Sylvia species (clade 13),
confirming previous studies results (17, 33). The polytomy seen in Figure 15 and Figure
16, is also seen in other studies (8, 33), where seven clades diverge at the same point on
the tree, my study does not improve the resolution of this site with five different
lineages diverging from this point (Supplementary Figure 9). Jonsson and Fjeldsa (33)
placed the fernbird’s genus (Bowdleria) in a clade with the genus Acrocephalus, but I
have found no support for this pairing. Both the Bayesian analysis (Figure 16) and
maximum likelihood consensus network (Supplementary Figure 10) provides strong
support for the branching pattern seen Cerasale et al. (44) who examined the phylogeny
of the Tachycineta.
The majority of divergence events in the Muscicapoidea had strong support and the
superfamily is relatively well resolved (Figure 15 and Figure 16). My results confirmed
the branching pattern seen in previous studies on the Muscicapoidea (33, 41, 52).
Jonsson and Fjeldsa (33) divided the Muscicapoidea into six clades, clade four
contained the Sturnus, Acridotheres, and Gracula, clade five is represented here by
Turdus, and the other five species all belong to clade six. Clades five and six are
expected to pair together with four branching off basal to this pair (33), this is
confirmed by both trees (Figure 15 and Figure 16). One part of the Muscicapoidea is
still unresolved; how the Sturnus and Acridotheres species diverge. Just over half of the
trees produced in the maximum likelihood analysis supported splitting the foursome
into two pairs (Supplementary Figure 11), with the Acridotheres pairing with Sturnus
tristis, but around 40% of the other trees had Sturnus sericeus as the sister taxa of this

81
pair. What is fully supported is the pairing of Acridotheres cristatellus with Sturnus
sericus, and the placement of Acridotheres within the Genus Sturnus, questioning the
monophyly of Sturnus. Previous studies have also found Sturnus to be paraphyletic (33,
91, 94), due to a number of other genera being found within this genus, including the
Acridotheres. Sturnus tristis has sometimes been classified as Acridotheres tristis, so it
would be expected that it groups with Acridotheres cristatellus (91, 94). Also the other
two Sturnus, S. sericeus and S. cieraceus, have been shown to be sister taxa and this
pairing has strong support (91, 94). The pair have also been renamed as Poiopsar by
some studies (91) making a genus comprising only these two species. The 26 species of
European starlings that traditionally made up the paraphyletic genus Sturnus have been
classified into as many as 10 different genera (91).
Most divergence events within the Passeroidea are fully supported by both the
maximum likelihood and Bayesian analyses (Figure 15 and Figure 16), the results here
also confirm much of what was given by Jonsson and Fjeldsa (33). The pair
Taeniopygia guttata and Vidua chalybeata branch off at the base of the superfamily,
they represent clade 7. In the study by Jonsson and Fjeldsa (33) there was a polytomy
seen with clades 8, 9, 10 ,11-21 all branching from the same point. This is now partially
resolved with strong support for clade 9 (the New Zealand native Anthus
novaeseelandiae) branching off basally to clades 10 (Carduelis), 20 (Emberiza) and 21
(The large Icteridae family containing the remaining 22 species). The large new world
blackbird family Icteridae was studied by Powell et al. (55) using full mitochondrial
genomes. Overall the maximum likelihood and Bayesian analyses phylogenetic trees
(Figure 15 and Figure 16) confirm the results in Powell et al. (55). Some minor
disagreements were found, but these occurred at the sites were the bootstrap support
was very weak (Supplementary Figure 12).
Some recommendations for the conservation of New Zealand’s native passerines
can be made based on the phylogenetic results produced in this study (Figure 15 and
Figure 16) and other studies. There are a number of passerine lineages that are native to
New Zealand that are genetically very diverse from other passerines found anywhere
else in the world. First, the rifleman and the rock wren make up their own suborder the
Acanthisitti, which have been separated from all other passerines for potentially around
80 million years (17) and are possibly the only passerines that have inhabited New
Zealand since it split from Gondwana, so are phylogenetically distinctive. The rifleman
is at risk of extinction with both of its populations declining (Table 2), while the rock

82
wren is nationally vulnerable to extinction, the preservation of these two species should
be one of the highest priorities for DoC. The three families that make up the basal
Passerida should also be a high priority for DoC. The three families are: the Callaeidae,
containing the kokako (nationally vulnerable) and the saddleback (at risk), the
Notiomystidae, containing only the hihi (nationally endangered), and the Petroicidae,
containing four native species (46 species worldwide). These are also an important part
of New Zealand’s biodiversity, and they have been separated from the Passerida for
possibly around 30 million years (21, 22). All three Meliphagoidea species (tui, bellbird
and grey warbler) are not threatened with extinction, although a number of their
populations are at risk or threatened which may have unforeseeable implications in the
future. The four native lineages within the crown Passerida (Zosterops, Bowdleria,
Anthus and Hirundo) all have close relatives found elsewhere in the world. Too much
uncertainty surrounds the subdivisions within the Core Corvoidea to make an informed
decision about how genetically diverse the Mohoua or Rhipidura really are.
4.3 Molecular data As mentioned above the use of mitochondrial genomes as a molecular marker for
the understanding of the phylogeny of the passerines has been very useful, and has
produced phylogenetic trees (Figure 15 and Figure 16) that have strong support for the
majority of branching events. But a number of subdivisions remain unresolved (see
phylogeny section of discussion above). The use of many mitochondrial genomes from
these lineages has not improved the resolution of the branching pattern, because it is
likely that there was only a very short time between each divergence event, which
meant very few changes in the nucleotide sequence were able to accumulate. So what
are the options for improving the resolution? First, even more nuclear molecular data
from each species in the study could be collected and compared. Second, the number of
taxa with sequenced mitochondrial genomes could be increased. Third, we could use the
data we have now more effectively.
Studies using both mitochondrial and nuclear DNA markers have been found to be
the most informative for resolving phylogeny in the passerines (94). When introgression
or incomplete lineage sorting occurs within the mitochondrial genome nuclear markers
will be needed to completely resolve the phylogeny of the lineage (50, 51),
introgression may have occurred at some subdivisions within the passerines. The results
from this study will also need to be tested by comparing them to other molecular

83
markers, such as nuclear genes, introns, intragenic regions, microsatellites, deletions
and transposons. Perhaps much of the nuclear gene data available from the 79 passerine
species analysed here could be added to the mitochondrial genome nucleotide alignment
and the phylogenetic trees reproduced. Hackett et al. (13) used 19 nuclear intron loci
from 80 different birds including 24 passerines, Treplin et al. (41) used four nuclear
genes from 80 passerines (26 families), and many other studies that have used nuclear
data to focus on specific lineages within the passerines (17, 26, 28, 34).
The genes on the mitochondrial genome are known to be under selection (51, 52,
95), under both purifying selection to remove any mutations that have a negative effect
on the functioning of the mitochondria, and positive selection where mutations that
increase the efficiency of respiration in certain environments will be selected for.
Dowling et al. (95) states that because there is a large amount of interactions between
mitochondrial and nuclear genes and their products, when there is selection on nuclear
genes there will likely be some selection pressure placed on the connected
mitochondrial genes. Also Marshall et al. (52) suggested that because the passerines are
the largest avian order and there is huge diversity in their habitats (climate and altitude)
and diets (type, calorie content and distribution), it is understandable that different
species face different selection pressures on their mitochondrial genes. These selection
pressures would lead to variation in the efficiency of the core process the mitochondria
performs for the cell, respiration. This means we cannot rule out that the mitochondrial
genomes of different lineages have convergently evolved; which would influence the
phylogenetic analyses of these genomes. Therefore the mitochondrial genome should be
used as one of many molecular markers of phylogeny (55).
As mentioned above there are situations where extra sequenced mitochondrial
genomes would be useful for improving resolution in the phylogeny. These include
when lineages are not represented at all by a species with a sequenced mitochondria
(such as some of the groups in the Core Corvoidea that branch off at the polytomy and
some of the deep Australian oscines), or where representation is low (New Zealand
wrens, suboscines and basal Passerida). Pacheco et al. (5), states that by adding extra
mitochondrial genomes from critical groups the stability of a number of phylogenetic
hypothesises have increased when looking at the base of the neoaves phylogeny. This
should also work with adding more mitochondrial genomes from certain groups within
then passerines. But multiple genomes have not improved resolution in number of

84
already highly represented lineages such as the three Passerida superfamilies, the true
crows (Corvidae) and the Sylvioidea.
Perhaps in these lineages where multiple genomes have already been sequenced the
molecular data needs to be used more effectively. One way to do this is use different
partitioning of the nucleotide sequence. Partitioning has been shown to give different
results when resolving phylogeny: In this study the mitochondrial genome was split into
five partitions: 1st, 2nd and 3rd (RY) codons, RNA stems and loops. This has been used
in other studies (5, 7, 65), and has been shown to have high resolving power. Another
possible partitioning scheme divides the protein coding genes into three groups based on
the mutation rate, with the tRNAs, the 12S and the 16S genes making another three
partitions, this has been used in a number of studies of avian phylogeny (5, 96). Pacheco
et al. (5) used a third scheme with 15 different partitions, the 12 protein coding genes
separately, 12S, 16S, and the tRNAs combined. The study found this partitioning
worked better than the other two partitioning schemes mentioned above as it allowed
the parameters of each protein coding gene to be optimized separately, which allowed
their variable evolutionary rates to be taken into account. Perhaps this partitioning
scheme could be tested using the 79 passerine mitochondrial genomes to compare if it
improves the resolution of any sites compared to the five partitions.
The use of different genes or regions of the mitochondrial genome sometimes
produces slightly different phylogenetic tree topologies, often due to different
substitution rates (50). Single mitochondrial genes have been shown to have insufficient
variation in them to be informative for phylogeny (50), but the full mitochondrial
genome may not be required for all phylogenetic studies. Duchene et al. (50) found that
a subset of mitochondrial genes can be just as informative (by producing the same
results) as the full mitochondrial genome. When studying two different lineages within
the cetaceans only around 25% of the genome was needed to reproduce the full
mitochondrial genome results (50), the only problem was the most informative (highest
resolving power) gene subset was different for the two lineages and finding out these
genes required analysing the full mitochondrial genome! This may sound unhelpful but
if the mitochondrial genomes of the current 79 passerines are analysed we may be able
to identify which genes are the most informative. Then only these subsets of genes
would need to be collected from other passerine species for future phylogenetic studies.

85
What subset of genes is the most informative for studying passerine phylogeny?
When looking at 33 species of passerines Marshall et al. (52) found the most variable
sites in the mitochondrial genome were the intragenic regions, the ND6 gene and the
control region while the two rRNA coding genes (12S and 16S) were the least variable.
Each protein coding gene also had different rates of synonymous substitutions (change
in nucleotide sequence that does not change the amino acid translated) and non-
synonymous substitutions (mutation in the nucleotide sequence that causes a change in
the amino acid sequence when translated). The Cox3 gene had the lowest synonymous
substitution rate, ND6 had the highest (52). While ND5 had the highest non-
synonymous rate, and four genes (Cox1, Cox3, ATP8 and ND3) had no non-
synonymous substitutions (52). Overall it was observed the NADH dehydrogenase
genes (ND) have higher variation than the other protein coding genes (Cox, ATP, CytB)
(52).
Synonymous substitutions are assumed to be neutral (they should not be selected for
or against) as there will be no effect on how the resulting protein functions, but non-
synonymous can be positively selected for or negatively selected against as they may
change how the protein functions. Therefore the rate of synonymous substitutions (dS)
can be higher than the rate of non-synonymous substitutions (dN). The ratio of non-
synonymous substitutions to synonymous substitutions is known as the dN/dS ratio.
When Marshall et al. (52) compared each genes dN/dS ratio they found it differed at the
different levels of taxonomy. This suggested that each gene was evolving independently
and is under different selection pressures in different species. They compared the rates
at three levels of taxonomy: between four subspecies of chaffinch (Fringilla coelebs),
the Fringillidae family (Fringilla coelebs, Fringilla teydea, Carduelis sinica and
Carduelis spinus), and all passerine species available. At the highest taxonomic level
the synonymous substitution rate was found to be saturated, with variation mainly
relying on the non-synonymous substitution rate (52). Marshall et al., (52) found that
ND5 had the highest dN/dS ratio at the four subspecies level, suggesting it may not be
informative when studying phylogeny at higher taxonomic levels. The three genes that
had the highest dN/dS ratio at the family and order taxonomic levels were ATP8, ND6
and ND2 indicating these genes may have greater phylogenetic resolving power at
higher taxonomic levels.
Pacheco et al. (5) calculated the average substitution rate for each gene in the
mitochondrial genome for the passerines and a number of other avian orders. They

86
found that all of the passerine protein coding genes and the tRNAs had a higher
substitution rate then the avian average (5), which is consistent with the mitochondrial
genes are evolving faster in the passerines than in the other birds, which has been well
known since Harrison et al. (16). The rRNAs, tRNAs and Cox1 had the lowest
substitution rates of the passerine mitochondrial genes, with around 0.003 substitutions
per site per million years. The genes with the highest substitution rate was ND2 (0.009)
followed by ATP6 and ND3 (~0.007). This is consistent with what is seen in the study
by Marshall et al. (52), who found the rRNAs and the Cox genes have the lowest
variation (therefore substitution rate), while the ND genes have the highest variation.
As most of the deeper divergence events focused on in my study on passerine
phylogeny occurred at least 30 million years ago, some of these fast evolving genes may
not be suitable for resolving phylogeny. These fast evolving genes may have reached
saturation of synonymous substitution and there is a large chance the same change in the
nucleotide sequence could have occurred independently on multiple occasions. For
example the ND2 gene has an estimated substitution rate of 0.009 substitutions per site
per million years. If this rate is extrapolated out to 30 million yeas (0.009 x 30 = 0.27)
there is around a 30% chance the each nucleotide has changed in this time. As some
nucleotides are constrained by selection to remain the same, the substitution rate of the
other sites must be higher. This means there is a very high chance that two independent
lineages could have independently substituted the same nucleotide complicating the
phylogenetic analysis. But these fast evolving genes may also be the only way to
resolve polytomies. Polytomies occur when more than two divergence events happen
within a very short time frame, meaning very few nucleotide changes have occurred
between each divergence event. ND2 with its substitution rate of 0.009 per site per
million years is around 1000bp long, this means nine substitutions occur on average in
the gene every million years. With many of the polytomies such as the three Passerida
superfamilies diverging within what is likely to be only a few million years this gene
would be able to provide some evidence about the correct order of branching. The key is
to use these different evolving genes in a way that allows us to use the valuable rare
changes in the fast evolving genes without getting false signals due to chance
independent substitutions in different lineages.
At the highest taxonomic level (the whole order of passerines) synonymous
substitution rates appear to become saturated and overall rate variation seems to be
mainly driven by the non-synonymous rate (52). RY coding of the third codon tries to

87
account for much of this, by removing some of the noise caused by this saturation of
synonymous substitutions (16). One possible solution would be to assess the different
taxonomic levels separately. The RY coding of the third codon could be removed when
the synonymous substitution rate has not become saturated, such as at lower levels of
taxonomy such as within a family. Or perhaps it may be beneficial to remove the third
codon data all together when looking at higher taxonomy levels such as the passerine
whole order. Saturation of nucleotide variation should also be taken into account when
choosing genes for gene subsets or removing uninformative data from mitochondrial
genome (50).
4.4 Phylogeny an insight into physical characteristics One must be careful in using physical characteristics for resolving phylogeny, as a
number of traits have been shown to have evolved on an number of independent
occasions by convergent evolution (91), such as skull morphological changes in
response to prying open soil to grab food, or migratory behaviour (both in the starlings).
As the phylogeny of the Passerines is slowly becoming better resolved the can we use it
to tell us something else about the evolution of the group. Does it give any insight into
what the common ancestor of certain groups were like? Looking at the more basal
species of each lineage do we see certain physical/ecological characteristics of the
common ancestor? Does it tell us anything about the biogeography of the group?
Can the passerine phylogeny tell us anything about the evolution of flight? There are
two main hypothesis of how birds evolved flight. The first was the top down: This is
where birds were originally climbers of trees, they then evolved the ability to fly by first
being able to parachute or glide down from the tree to the ground (97), in much the
same way as the flying squirrels do today. The other possible hypothesis is the bottom
up option: This is where birds have evolved flight by first evolving wings for aiding in
running, either along the ground (98) or up an inclined surface (99), and were then
adapted for taking flight. The ancestors of birds have developed the physical
characteristics (feathers, wings, light body) essential for flight, for some other reason
and then borrowed these for flight (98, 100). Feathers are now essential for flight in
birds, but the presence of feathers in fossils predates the assumed ability of the species
to fly (100). On some dinosaur fossils they have been found where there shape would
not have allowed flight. They would have evolved earlier where they possibly had a
function in firstly insulation for thermo-regulation and then sexual attraction (being

88
colourful) (100). They were then later adapted for use in powered flight. Can the avian
phylogeny provide an insight into which of these hypotheses is more likely?
The most basal lineage in the Aves are the Palaeognaths (101), containing the ratites
and tinamous. Flight has been shown to have been lost on multiple independent
occasions in the group (101), and the majority now cannot fly, with only the tinamous
still being able to fly. The Palaeognaths are all ground foragers and the common
ancestor of all was assumed to be a relatively poor flier. The next group to branch from
the main avian branch are the combined group of the galliformes and anseriformes (5),
these are also ground/water foragers and the majority are relatively poor fliers, in the
sense they cannot fly between branches in a tree. Also the basal species within many of
the other avian orders are also ground foragers and poor fliers; this suggests that the
common ancestor of all birds was a ground forager. This would provide evidence for the
hypotheses that flight evolved from the ground up (98, 99), not from the trees down.
Within the passerines the basal group is the New Zealand wrens which are basically
flightless capable of only hopping around the ground. Also many of the deep oscines are
poor fliers; it is not until the tips of the Passerida, Core Corvoidea and Meliphagoidea
that we see very strong fliers that spend the majority of their time in trees. This would
also support the ground up hypotheses.
How then have many of the passerines evolved the ability to be such strong fliers,
capable of difficult feats such as catching insects in the air? The Oscines originated in
Australia (1, 15, 22), and to stay here would not have required any great ability for
flight. But lineages that were good fliers were able to disperse further out into the world,
to locations where there were unoccupied niches such as flying insectivores or
honeyeaters. A number of studies have provided support for this: Jonsson et al. (32)
suggested the adaption of the Core Corvoidea to flying over water in the Papuan Islands
selected for lineages that were strong fliers, which allowed them to radiate out to the
rest of the world. This is probably also true for the Passerida which originated in
Australia as well, and the task of flying to PNG would have placed a selection pressure
on flight ability, and because of this the majority of the Passerida are now very strong
fliers. A number of groups within the passerines have very high speciation rates these
are the Zosteropidae (insectivore or fruit and nectar), the Turdus (insectivore or
omnivore), the Pachycephalidae (insectivore) and the Myzomela (honeyeater) (43), they
are all insectivores or honeyeaters which involves flight. The honeyeaters of the
Meliphagidae also have radiated out into one of the most diverse Australasian passerine
89
family (26), their flying ability would have allowed them to be such successful
speciators. The Petroicidae originated in Australia and PNG before dispersing to the
Pacific Islands. But only lineages with a flycatcher body form have dispersed into these
smaller islands of the Pacific (37), this suggests the unoccupied ecological niches on
these islands were only available for lineages that were strong fliers. Most bird
speciation events are caused by geographical isolation (allopatric) as opposed to
ecological isolation (sympatric) (37), this suggests that the reason the passerines have
become so diverse and numerous is partially due to their ability to disperse to different
locations. While the Passerines were probably originally poor fliers, the selection for the
characteristics needed for flight has allowed the order as a whole to be one of the most
successful vertebrate orders, with ~6000 species occupying many different ecological
niches worldwide.
Avian genomes are relatively compact and streamlined, with fewer repeats and non-
coding DNA than in other vertebrates (102). This was assumed to be an adaptation
which allowed flight in birds, and is supported by the fact that flightless birds have
larger genomes than flying birds (102). Organ et al. (102), looked at the relationship
between the size of the genome and the size of the osteocyte (bone cell) and found that
in extant tetrapods 59% of the variation seen in genome size was predicted by the size
of the osteocyte. They then used this to predict the size of the genomes of 31 extinct
dinosaurs (102). They calculated that the small genome evolved before the evolution of
the avians, and before flight, after the split of the two main dinosaur lineages,
Ornithischiums and Theropods (which birds belong to) (102). From this study they
inferred that genome size reduction was not an adaption that evolved to allow flight.
The study also estimated that the genome size of avian lineages has not change in the
last 230 million years (102), but that flight and genome size may be functionally related.
4.5 Conclusions I have successfully sequenced the full mitochondrial genome sequence of the
fernbird, tomtit, pipit and waxeye, and have also sequenced partial mitochondrial
genomes for the browncreeper and bellbird. This means there is now at least a partial
reference mitochondrial genome for each family of the native New Zealand passerines,
apparently a first for any country. These genomes were aligned and analysed along with
seven previously unpublished genomes from New Zealand passerines, four
mitochondrial transcriptomes and all available passerine genomes on GenBank (63

90
species), producing maximum likelihood and Bayesian analyses phylogenetic trees. A
number of exciting results have been seen, and each New Zealand species has been
branched off where expected. In particular there is strong support of the placement of
the Petroicidae, Callaeidae and Notiomystidae at the base of the Passerida in the
phylogenetic tree. There is evidence to suggest that these should be formally classified
as Passerida, although whether the three families form a monophyletic group is
unresolved. The polytomy at the base of the Core Corvoidea is starting to be resolved,
but sequenced mitochondrial genomes from representatives of some lineages are still
needed. Our results support an Australasian origin for the oscines. We recommend a
greater availability of tissue or DNA specimens of New Zealand native species for use
in research. I have identified a need to sequence deep oscines from Australasia. Perhaps
the New Zealand passerines could also have their mitochondrial genomes sequenced
down to the generic level, this would require the completion of the browncreeper and
bellbird genomes along with the sequencing of the kokako, rock wren and welcome
swallow.

91
5 References
1. Barker FK, Cibois A, Schikler P, Feinstein J, & Cracraft J (2004) Phylogeny and diversification of the largest avian radiation. Proceedings of the National Academy of Sciences of the United States of America 101(30):11040-11045.
2. Nabholz B, Jarvis ED, & Ellegren H (2010) Obtaining mtDNA genomes from next-generation transcriptome sequencing: A case study on the basal Passerida (Aves: Passeriformes) phylogeny. Molecular Phylogenetics and Evolution 57(1):466-470.
3. Jetz W, Thomas GH, Joy JB, Hartmann K, & Mooers AO (2012) The global diversity of birds in space and time. Nature 491(7424):444-448.
4. Worthy TH, Hand SJ, Nguyen JMT, Tennyson AJD, Worthy JP, Scofield RP, Boles WE, & Archer M (2010) Biogeographical and Phylogenetic Implications of an Early Miocene Wren (Aves: Passeriformes: Acanthisittidae) from New Zealand. Journal of Vertebrate Paleontology 30(2):479-498.
5. Pacheco MA, Battistuzzi FU, Lentino M, Aguilar RF, Kumar S, & Escalante AA (2011) Evolution of Modern Birds Revealed by Mitogenomics: Timing the Radiation and Origin of Major Orders. Molecular Biology and Evolution 28(6):1927-1942.
6. Brown JW, Rest JS, Garcia-Moreno J, Sorenson MD, & Mindell DP (2008) Strong mitochondrial DNA support for a Cretaceous origin of modern avian lineages. BMC Biology 6(6).
7. Pratt RC, et al. (2009) Toward resolving deep neoaves phylogeny: data, signal enhancement, and priors. Molecular Biology and Evolution 26(2):313-326.
8. Alstrom P, Ericson PGP, Olsson U, & Sundberg P (2006) Phylogeny and classification of the avian superfamily Sylvioidea. Molecular Phylogenetics and Evolution 38(2):381-397.
9. Wang N, Braun EL, & Kimball RT (2012) Testing Hypotheses about the Sister Group of the Passeriformes Using an Independent 30-Locus Data Set. Molecular Biology and Evolution 29(2):737-750.
10. Sibley CG & Ahlquist JE (1990) Phylogeny and classification of birds : a study in molecular evolution (Yale University Press, New Haven) pp xxiii, 976.
11. Livezey BC & Zusi RL (2007) Higher-order phylogeny of modern birds (Theropoda, Aves : Neornithes) based on comparative anatomy. II. Analysis and discussion. Zoological Journal of the Linnean Society 149(1):1-95.
12. Ericson PGP. Anderson CL, Britton T, Elzanowski A, Johansson US, Kallersjo M, Ohlson JI, Parsons TJ, Zuccon D, & Mayr G (2006) Diversification of Neoaves: integration of molecular sequence data and fossils. Biology letters 2(4):543-547.
13. Hackett SJ, Kimball RT, Reddy S, Bowie RCK, Braun EL, Braun MJ, Chojnowski JL, Cox WA, Han KL, Harshman J, Huddleston CJ, Marks BD, Miglia KJ, Moore WS, Sheldon FH, Steadman DW, Witt CC, & Yuri T (2008) A phylogenomic study of birds reveals their evolutionary history. Science 320(5884):1763-1768.
14. Suh A, Paus M, Kiefmann M, Churakov G, Franke FA, Brosius J, Kriegs JO, & Schmitz J (2011) Mesozoic retroposons reveal parrots as the closest living relatives of passerine birds. Nature Communications 2:443.

92
15. Gibb GC (2010) Birds in a tree: a journey through avian phylogeny, with particular emphasis on the birds of New Zealand. PhD Thesis, Massey University.
16. Harrison GL, McLenachan PA, Phillips MJ, Slack KE, Cooper A, & Penny D (2004) Four new avian mitochondrial genomes help get to basic evolutionary questions in the late Cretaceous. Molecular Biology and Evolution 21(6):974-983.
17. Moyle RG, Andersen MJ, Oliveros CH, Steinheimer FD, & Reddy S (2012) Phylogeny and Biogeography of the Core Babblers (Aves: Timaliidae). Systematic Biology 61(4):631-651.
18. Schellart WP, Lister GS, & Toy VG (2006) A Late Cretaceous and Cenozoic reconstruction of the Southwest Pacific region: Tectonics controlled by subduction and slab rollback processes. Earth-Science Reviews 76(3-4):191-233.
19. Trewick SA, Paterson AM, & Campbell HJ (2007) Hello New Zealand. Journal of Biogeography 34(1):1-6.
20. McDowall RM (2008) Process and pattern in the biogeography of New Zealand - a global microcosm? Journal of Biogeography 35(2):197-212.
21. Shepherd LD & Lambert DM (2007) The relationships and origins of the New Zealand wattlebirds (Passeriformes, Callaeatidae) from DNA sequence analyses. Molecular Phylogenetics and Evolution 43(2):480-492.
22. Driskell A, & Christidis L (2007) A new endemic family of New Zealand passerine birds: adding heat to a biodiversity hotspot. Australian Journal of Zoology 55(2):73-78.
23. Crisp MD, Trewick SA, & Cook LG (2011) Hypothesis testing in biogeography. Trends in ecology & evolution 26(2):66-72.
24. England R (2010) The Song Thrush’s contribution to resolving Passerine phylogeny. (Massey University, Palmerston North).
25. Slack KE, Delsuc F, McLenachan PA, Arnason U, & Penny D (2007) Resolving the root of the avian mitogenomic tree by breaking up long branches. Molecular Phylogenetics and Evolution 42(1):1-13.
26. Gardner JL, Trueman JWH, Ebert D, Joseph L, & Magrath RD (2010) Phylogeny and evolution of the Meliphagoidea, the largest radiation of Australasian songbirds. Molecular Phylogenetics and Evolution 55(3):1087-1102.
27. Driskell AC & Christidis L (2004) Phylogeny and evolution of the Australo-Papuan honeyeaters (Passeriformes, Meliphagidae). Molecular Phylogenetics and Evolution 31(3):943-960.
28. Norman JA, Ericson PGP, Jonsson KA, Fjeldsa J, & Christidis L (2009) A multi-gene phylogeny reveals novel relationships for aberrant genera of Australo-Papuan core Corvoidea and polyphyly of the Pachycephalidae and Psophodidae (Aves: Passeriformes). Molecular Phylogenetics and Evolution 52(2):488-497.
29. Nyari AS & Joseph L (2012) Evolution in Australasian Mangrove Forests: Multilocus Phylogenetic Analysis of the Gerygone Warblers (Aves: Acanthizidae). Plos One 7(2).
30. Trewick SA & Gibb GC (2010) Vicars, tramps and assembly of the New Zealand avifauna: a review of molecular phylogenetic evidence. Ibis 152(2):226-253.
31. Irestedt M & Ohlson JI (2008) The division of the major songbird radiation into Passerida and 'core Corvoidea' (Aves : Passeriformes) - the species tree vs. gene trees. Zoologica Scripta 37(3):305-313.

93
32. Jonsson KA, Fabre PH, Ricklefs RE, & Fjeldsa J (2011) Major global radiation of corvoid birds originated in the proto-Papuan archipelago. Proceedings of the National Academy of Sciences of the United States of America 108(6): 2328-2333.
33. Jonsson KA & Fjeldsa J (2006) A phylogenetic supertree of oscine passerine birds (Aves : Passeri). Zoologica Scripta 35(2):149-186.
34. Nyari AS, Benz BW, Jonsson KA, Fjeldsa J, & Moyle RG (2009) Phylogenetic relationships of fantails (Aves: Rhipiduridae). Zoologica Scripta 38(6):553-561.
35. Spellman GM, Cibois A, Moyle RG, Winker K, & Barker FK (2008) Clarifying the systematics of an enigmatic avian lineage: What is a bombycillid? Molecular Phylogenetics and Evolution 49(3):1036-1040.
36. Fuchs J, Irestedt M, Fjeldsa J, Couloux A, Pasquet E, & Bowie RCK (2012) Molecular phylogeny of African bush-shrikes and allies: Tracing the biogeographic history of an explosive radiation of corvoid birds. Molecular Phylogenetics and Evolution 64(1):93-105.
37. Christidis L, Irestedt M, Rowe D, Boles WE, & Norman JA (2011) Mitochondrial and nuclear DNA phylogenies reveal a complex evolutionary history in the Australasian robins (Passeriformes: Petroicidae). Molecular Phylogenetics and Evolution 61(3):726-738.
38. Christidis L & Schodde R (1991) Relationships of the Australo-Papuan songbirds - protein evidence. Ibis 133:277-285.
39. Miller HC & Lambert DM (2006) A molecular phylogeny of New Zealand's Petroica (Aves : Petroicidae) species based on mitochondrial DNA sequences. Molecular Phylogenetics and Evolution 40(3):844-855.
40. Johansson US, Fjeldsa J, & Bowie RCK (2008) Phylogenetic relationships within Passerida (Aves : Passeriformes): A review and a new molecular phylogeny based on three nuclear intron markers. Molecular Phylogenetics and Evolution 48(3):858-876.
41. Treplin S, Siegert R, Bleidorn C, Thompson HS, Fotso R, & Tiedemann R (2008) Molecular phylogeny of songbirds (Aves : Passeriformes) and the relative utility of common nuclear marker loci. Cladistics 24(3):328-349.
42. Miskelly CM, Dowding JE, Elliott GP, Hitchmough RA, Powlesland RG, Robertson HA, Sagar PM, Scofield RP, & Taylor GA (2008) Conservation status of New Zealand birds, 2008. Notornis 55(3):117-135.
43. Moyle RG, Filardi CE, Smith CE, & Diamond J (2009) Explosive Pleistocene diversification and hemispheric expansion of a "great speciator''. Proceedings of the National Academy of Sciences of the United States of America 106(6):1863-1868.
44. Cerasale DJ, Dor R, Winkler DW, & Lovette IJ (2012) Phylogeny of the Tachycineta genus of New World swallows: Insights from complete mitochondrial genomes. Molecular Phylogenetics and Evolution 63(1):64-71.
45. Zuccon D & Ericson PGP (2011) Molecular and morphological evidences place the extinct New Zealand endemic Turnagra capensis in the Oriolidae. Molecular Phylogenetics and Evolution 62:414-426.
46. DoC: Our remarkable birds. Retrieved 23/11/2012, from http://www.doc.govt.nz/conservation/native-animals/birds/our-remarkable-birds/
47. Green W & Clarkson B (2006) Review of the New Zealand Biodiversity Strategy Themes. Retrieved 20/11/2012, from http://www.doc.govt.nz/documents/conservation/nz-biodiversity-strategy-themes.pdf

94
48. Norman JA, Boles WE, & Christidis L (2009) Relationships of the New Guinean songbird genera Amalocichla and Pachycare based on mitochondrial and nuclear DNA sequences. Journal of Avian Biology 40(6):640-645.
49. Lerner HRL & Fleischer RC (2010) Prospects for the use of next-generation sequencing methods in ornithology. The Auk 127(1):4-15.
50. Duchene S, Archer FI, Vilstrup J, Caballero S, & Morin PA (2011) Mitogenome Phylogenetics: The Impact of Using Single Regions and Partitioning Schemes on Topology, Substitution Rate and Divergence Time Estimation. Plos One 6(11).
51. Galtier N, Nabholz B, Glemin S, & Hurst GDD (2009) Mitochondrial DNA as a marker of molecular diversity: a reappraisal. Molecular Ecology 18:4541-4550.
52. Marshall HD, Baker AJ, & Grant AR (2013) Complete mitochondrial genomes from four subspecies of common chaffinch (Fringilla coelebs): New inferences about mitochondrial rate heterogeneity, neutral theory, and phylogenetic relationships within the order Passeriformes. Gene 517(1):37-45.
53. Weinreich DM & Rand DM (2000) Contrasting patterns of non-neutral evolution in proteins encoded in nuclear and mitochondrial genomes. Genetics 156:385-399.
54. Rand DM (2008) Mitigating Mutational Meltdown in Mammalian Mitochondria. PLoS Biology 6(2).
55. Powell AFLA, Barker FK, & Lanyon SM (2013) Empirical evaluation of partitioning schemes for phylogenetic analyses of mitogenomic data: An avian case study. Molecular Phylogenetics and Evolution 66:69-79.
56. Powell AFLA, Barker FK, & Lanyon SM (2013) Empirical evaluation of partitioning schemes for phylogenetic analyses of mitogenomic data: An avian case study. Molecular Phylogenetics and Evolution 66(1):69-79.
57. Dabrowski A, Fraser R, Confer JL, & Lovette IJ (2005) Geographic variability in mitochondrial introgression among hybridizing populations of Golden-winged (Vermivora chrysoptera) and Blue-winged (V.opinus) Warblers. Conservation Genetics 6(5):843-853.
58. Lovette IJ (2004) Molecular phylogeny and plumage signal evolution in a trans Andean and circum Amazonian avian species complex. Molecular Phylogenetics and Evolution 32(2):512-523.
59. Raupach MJ, Astrin JJ, Hannig K, Peters MK, Stoeckle MY, & Wägele JW (2010) Molecular species identification of Central European ground beetles(Coleoptera: Carabidae) using nuclear rDNA expansion segments and DNA barcodes. Frontiers in zoology 7(26):1-15.
60. Stower H (2012) Evolutionary genomics: Introgression in natural populations. Nature Reviews Genetics 13(10):675-675.
61. Reich D, Green RE, Kircher M, Krause J, Patterson N, Durand EY, Viola B, Briggs AW, Stenzel U, Johnson PLF, Maricic T, Good JM, Marques-Bonet T, Alkan C, Fu Q, Mallick S, Li H, Meyer M, Eichler EE, Stoneking M, Richards M, Talamo S, Shunkov MV, Derevianko AP, Hublin JJ, Kelso J, Slatkin M, & Pääbo S (2010) Genetic history of an archaic hominin group from Denisova Cave in Siberia. Nature 468(7327):1053-1060.
62. Matzke A, Churakov G, Berkes P, Arms EM, Kelsey D, Brosius J, Kriegs JO, & Schmitz J (2012) Retroposon insertion patterns of neoavian birds: strong evidence for an extensive incomplete lineage sorting era. Molecular biology and evolution 29(6):1497-1501.
63. Nabholz B, Kunstner A, Wang R, Jarvis ED, & Ellegren H (2011) Dynamic evolution of base composition: causes and consequences in avian phylogenomics. Molecular Biology and Evolution 28(8):2197-2210.
95
64. Treplin S & Tiedemann R (2007) Specific chicken repeat 1 (CR1) retrotransposon insertion suggests phylogenetic affinity of rockfowls (genus Picathartes) to crows and ravens (Corvidae). Molecular Phylogenetics and Evolution 43(1):328-337.
65. Gibb GC, Kardailsky O, Kimball RT, Braun EL, & Penny D (2007) Mitochondrial genomes and avian phylogeny: complex characters and resolvability without explosive radiations. Molecular Biology and Evolution 24(1):269-280.
66. Schirtzinger EE, Tavares ES, Gonzales LA, Eberhard JR, Miyaki CY, Sanchez JJ, Hernandez A, Müeller H, Graves GR, Fleischer RC, & Wright TF (2012) Multiple independent origins of mitochondrial control region duplications in the order Psittaciformes. Molecular Phylogenetics and Evolution 64(2):342-356.
67. Altschul SF, Gish W, Miller W, Myers EW, & Lipman DJ (1990) Basic Local Alignment Search Tool. Journal of Molecular Biology 215(3):403-410.
68. Cox MP, Peterson DA, & Biggs PJ (2010) SolexaQA: At-a-glance quality assessment of Illumina second-generation sequencing data. BMC Bioinformatics 11.
69. Andrews SR (2010) Fast QC v.0.10 (Available from http://www.bioinformatics.babraham.ac.uk/projects/fastqc/).
70. Andrews SR (2011) FastQ Screen v0.3 (Available from http://www.bioinformatics.babraham.ac.uk/projects/fastq_screen/).
71. Li H & Durbin R (2009) Fast and accurate short read alignment with Burrows-Wheeler Transform. Bioinformatics 25:1754-1760.
72. Zerbino DR & Birney E (2008) Velvet: algorithms for de novo short read assembly using de Bruijn graphs. Genome Research 18:821-829.
73. Miller JR, Koren S, & Sutton G (2010) Assembly algorithms for next-generation sequencing data. Genomics 95(6):315-327.
74. Milne I, Bayer M, Cardle L, Shaw P, Stephen G, Wright F, & Marshall D (2010) Tablet—next generation sequence assembly visualization. Bioinformatics 26(3):401-402.
75. Wyman SK, Jansen RK, & Boore JL (2004) Automatic annotation of organellar genomes with DOGMA. Bioinformatics 20(17):3252-3255.
76. Martin M (2011) Cutadapt removes adapter sequences from high-throughput sequencing reads. EMBnet 17:10-12.
77. Langmead B & Salzberg S (2012) Fast gapped-read alignment with Bowtie 2. Nature Methods 9:357-359.
78. Conesa A, Götz S, Garcia-Gomez JM, Terol J, Talon M, & Robles M (2005) Blast2GO: a universal tool for annotation, visualization and analysis in functional genomics research. Bioinformatics 21:1-13.
79. Kunstner A, Wolf JB, Backström N, Whitney O, Balakrishnan CN, Day L, Edwards SV, Janes DE, Schlinger BA, Wilson RK, Jarvis ED, Warren WC, & Ellegren H (2010) Comparative genomics based on massive parallel transcriptome sequencing reveals patterns of substitution and selection across 10 bird species. Molecular Ecology 19:266-276.
80. Phillips MJ, Delsuc F, & Penny D (2004) Genome-scale phylogeny and the detection of systematic biases. Molecular Biology and Evolution 21(7):1455-1458.
81. Miller MA, Pfeiffer W, & Schwartz T (2010) Creating the CIPRES Science Gateway for Inference of Large Phylogenetic Trees. Proceedings of the Gateway Computing Environments Workshop:1-8.

96
82. Stamatakis A (2006) RAxML-VI-HPC: Maximum Likelihood-based Phylogenetic Analyses with Thousands of Taxa and Mixed Models. Bioinformatics 22(21):2688-2690.
83. Huelsenbeck JP & Ronquist F (2001) MRBAYES: Bayesian inference of phylogenetic trees. Bioinformatics 17(8):754-755.
84. Rambaut A & Drummond AJ (2007) Tracer v1.5 (Available from http://beast.bio.ed.ac.uk/Tracer ).
85. Drummond AJ, Suchard MA, Xie D, & Rambaut A (2012) Bayesian phylogenetics with BEAUti and the BEAST 1.7. Molecular Biology and Evolution 29(8):1969-1973.
86. Huson DH & Bryant D (2006) Application of phylogenetic networks in evolutionary studies. Molecular Biology and Evolution 23(2):254-267.
87. FASTX-Toolkit (2009) v.0.0.11 ( Available from http://cancan.cshl.edu/labmembers/gordon/fastx_toolkit/).
88. Mindell DP, Sorenson MD, & Dimcheff DE (1998) Multiple independent origins of mitochondrial gene order in birds. Proceedings of the National Academy of Sciences of the United States of America 95(18):10693-10697.
89. Pinard R, de Winter A, Sarkis GJ, Gerstein MB, Tartaro KR, Plant RN, Egholm M, Rothberg JM, & Leamon JH (2006) Assessment of whole genome amplification-induced bias through high-throughput, massively parallel whole genome sequencing. BMC Genomics 7:216.
90. Han T, Chang CW, Kwekel JC, Chen Y, Ge Y, Martinez-Murillo F, Roscoe D, Težak Z, Philip R, Bijwaard K, & Fuscoe JC (2012) Characterization of whole genome amplified (WGA) DNA for use in genotyping assay development. BMC Genomics 13:217-232.
91. Lovette IJ, McCleery BV, Talaba AL, & Rubenstein DR (2008) A complete species-level molecular phylogeny for the "Eurasian" starlings (Sturnidae : Sturnus, Acridotheres, and allies): Recent diversification in a highly social and dispersive avian group. Molecular Phylogenetics and Evolution 47(1):251-260.
92. Gill BJ (2006) Birds in Australian and New Zealand museums - a major resource for ornithology. New Zealand Journal of Zoology 33(4):299-315.
93. James HF, Ericson PGP, Slikas B, Lei FM, Gill FB, & Olson SL (2003) Pseudopodoces humilis, a misclassified terrestrial tit (Paridae) of the Tibetan Plateau: evolutionary consequences of shifting adaptive zones. Ibis 145(2):185-202.
94. Lovette IJ & Rubenstein DR (2007) A comprehensive molecular phylogeny of the starlings (Aves: Sturnidae) and mockingbirds (Aves: Mimidae): Congruent mtDNA and nuclear trees for a cosmopolitan avian radiation. Molecular Phylogenetics and Evolution 44(3):1031-1056.
95. Dowling DK, Friberg U, & Lindell J (2008) Evolutionary implications of non-neutral mitochondrial genetic variation. Trends in Ecology & Evolution 23(10):546-554.
96. Pereira SL & Baker AJ (2006) A molecular timescale for galliform birds accounting for uncertainty in time estimates and heterogeneity of rates of DNA substitutions across lineages and sites. Molecular Phylogenetics and Evolution 38(2):499-509.
97. Longrich N (2006) Structure and function of hindlimb feathers in Archaeopteryx lithographica. Paleobiology 32(3):417-431.
98. Garner JP, Taylor GK, & Thomas ALR (1999) On the origins of birds: the sequence of character acquisition in the evolution of avian flight. Proceedings of the Royal Society B-Biological Sciences 266(1425):1259-1266.

97
99. Dial KP (2003) Wing-assisted incline running and the evolution of flight. Science 299(5605):402-404.
100. Longrich NR, Vinther J, Meng QJ, Li QG, & Russell AP (2012) Primitive Wing Feather Arrangement in Archaeopteryx lithographica and Anchiornis huxleyi. Current Biology 22(23):2262-2267.
101. Phillips MJ, Gibb GC, Crimp EA, & Penny D (2010) Tinamous and moa flock together: mitochondrial genome sequence analysis reveals independent losses of flight among ratites. Systematic Biology 59(1):90-107.
102. Organ CL, Shedlock AM, Meade A, Pagel M, & Edwards SV (2007) Origin of avian genome size and structure in non-avian dinosaurs. Nature 446(7132):180-184.

98

99
6 Appendices
6.1 Supplementary tables Supplementary Table 1: List of all primers used during study. Name of primers, nucleotide sequence of the primer and a description of what the primers were used for. Name Sequence Used For Av438dloopF TCACGWGAAATSAGCW
ACTC Short range PCR and sequencing: waxeye
Av492dloopR GGGTKTAGGGGGAAAGAAT
Short range PCR and sequencing: waxeye
Av510dloopF ATTCTTTCCCCCTAMACC
Short range PCR and sequencing: fernbird, bellbird, and NZ robin
Av1249tPheR TGGCATCTTCAGTGYCATGCTT
Short range PCR and sequencing: waxeye and NZ robin
Av1753F12S AAACTGGGATTAGATACCCCACTAT
Long range PCR: all species Short range PCR and sequencing: all species
Av1806R12S AGTTTTAAGCGTTTGTGCTCGTA
Short range PCR and sequencing: NZ robin
Av2150R12S GAGGGTGACGGGCGGTRTGTAC
Long range PCR: waxeye and NZ robin Short range PCR and sequencing: all species
Av2246F12S GAGGTAAGTGGTAACAAGGTAAG
Short range PCR and sequencing: bellbird
Av2703F16S GACTTGTTAGTAGAGGTGAAAAGCC
Short range PCR and sequencing: bellbird
Av2901R16S GCACTCTTTGTTGRTGGCTGCTT
Long range PCR: fernbird Short range PCR and sequencing: all species
Av3782R16S CGGTCTGAACTCAGATCACGTA
Short range PCR and sequencing: bellbird
Av3787F16S CGATTAACAGTCCTACGTG
Short range PCR and sequencing: bellbird
Av4165ND1F CGAAAARTCCTAAGCTACATRCA
Short range PCR and sequencing: waxeye
Av4747ND1F CCATTCGCCCTATTCTTCCTAGC
Short range PCR and sequencing: bellbird
Av4921ND1F CCCACGATTTCGMTAYGACCA
Short range PCR and sequencing: bellbird
Av5201tMetR CCATCATTTTCGGGGTATGG
Long range PCR: all species Short range PCR and sequencing: all species
Av5583ND2R CCTTGGAGGACTTCTGGGAA
Short range PCR and sequencing: bellbird
Av6335tTrpF GGCCTTCAAAGCCTTAAATAAGAG
Short range PCR and sequencing: bellbird
Av7138CoIF ACATTCTTTGAYCCWGCRGGAGG
Long range PCR: waxeye
Av7195CoIR GGTAATTAGGACGGATCAGACAA
Short range PCR and sequencing: bellbird
Av7546CoIF GTCGGAATAGACGTAGACAC
Short range PCR and sequencing: bellbird
Av7662CoIR AGGAAGATGAAGCCYAGAGCTCA
Short range PCR and sequencing: bellbird
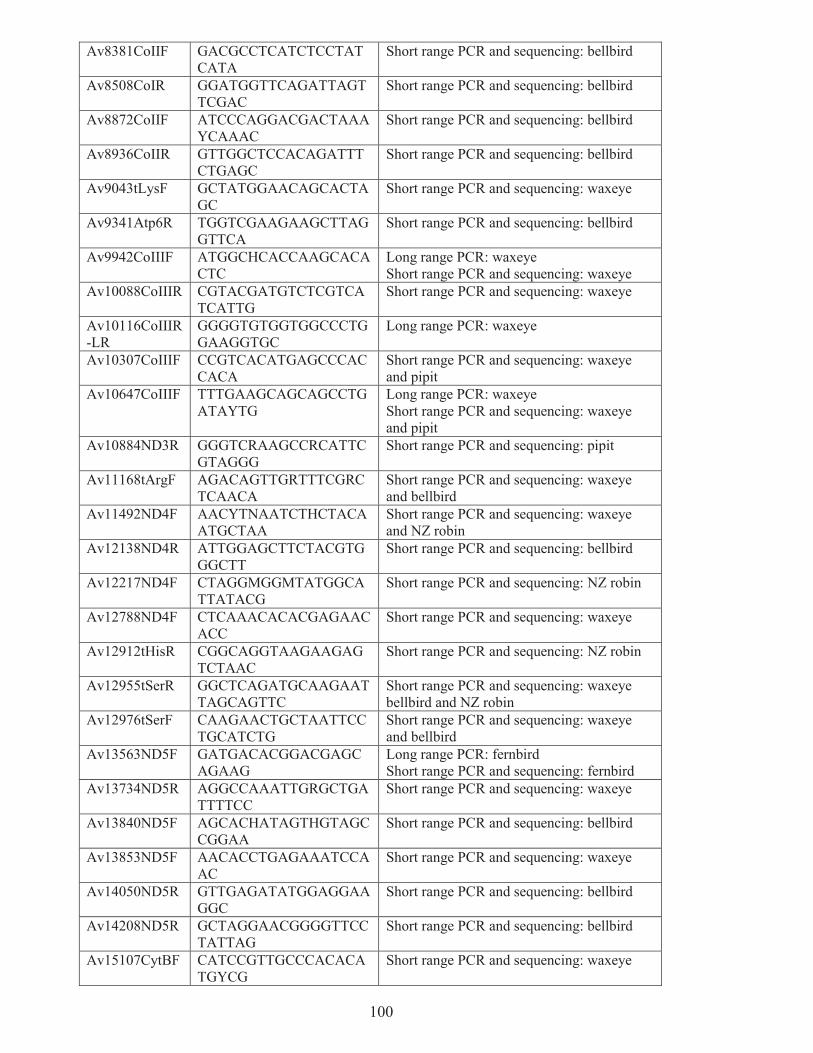
100
Av8381CoIIF GACGCCTCATCTCCTATCATA
Short range PCR and sequencing: bellbird
Av8508CoIR GGATGGTTCAGATTAGTTCGAC
Short range PCR and sequencing: bellbird
Av8872CoIIF ATCCCAGGACGACTAAAYCAAAC
Short range PCR and sequencing: bellbird
Av8936CoIIR GTTGGCTCCACAGATTTCTGAGC
Short range PCR and sequencing: bellbird
Av9043tLysF GCTATGGAACAGCACTAGC
Short range PCR and sequencing: waxeye
Av9341Atp6R TGGTCGAAGAAGCTTAGGTTCA
Short range PCR and sequencing: bellbird
Av9942CoIIIF ATGGCHCACCAAGCACACTC
Long range PCR: waxeye Short range PCR and sequencing: waxeye
Av10088CoIIIR CGTACGATGTCTCGTCATCATTG
Short range PCR and sequencing: waxeye
Av10116CoIIIR-LR
GGGGTGTGGTGGCCCTGGAAGGTGC
Long range PCR: waxeye
Av10307CoIIIF CCGTCACATGAGCCCACCACA
Short range PCR and sequencing: waxeye and pipit
Av10647CoIIIF TTTGAAGCAGCAGCCTGATAYTG
Long range PCR: waxeye Short range PCR and sequencing: waxeye and pipit
Av10884ND3R GGGTCRAAGCCRCATTCGTAGGG
Short range PCR and sequencing: pipit
Av11168tArgF AGACAGTTGRTTTCGRCTCAACA
Short range PCR and sequencing: waxeye and bellbird
Av11492ND4F AACYTNAATCTHCTACAATGCTAA
Short range PCR and sequencing: waxeye and NZ robin
Av12138ND4R ATTGGAGCTTCTACGTGGGCTT
Short range PCR and sequencing: bellbird
Av12217ND4F CTAGGMGGMTATGGCATTATACG
Short range PCR and sequencing: NZ robin
Av12788ND4F CTCAAACACACGAGAACACC
Short range PCR and sequencing: waxeye
Av12912tHisR CGGCAGGTAAGAAGAGTCTAAC
Short range PCR and sequencing: NZ robin
Av12955tSerR GGCTCAGATGCAAGAATTAGCAGTTC
Short range PCR and sequencing: waxeye bellbird and NZ robin
Av12976tSerF CAAGAACTGCTAATTCCTGCATCTG
Short range PCR and sequencing: waxeye and bellbird
Av13563ND5F GATGACACGGACGAGCAGAAG
Long range PCR: fernbird Short range PCR and sequencing: fernbird
Av13734ND5R AGGCCAAATTGRGCTGATTTTCC
Short range PCR and sequencing: waxeye
Av13840ND5F AGCACHATAGTHGTAGCCGGAA
Short range PCR and sequencing: bellbird
Av13853ND5F AACACCTGAGAAATCCAAC
Short range PCR and sequencing: waxeye
Av14050ND5R GTTGAGATATGGAGGAAGGC
Short range PCR and sequencing: bellbird
Av14208ND5R GCTAGGAACGGGGTTCCTATTAG
Short range PCR and sequencing: bellbird
Av15107CytBF CATCCGTTGCCCACACATGYCG
Short range PCR and sequencing: waxeye

101
Av15266CytbR TATCCTACGAAGGCAGTTGCTA
Short range PCR and sequencing: bellbird
Av15425CytBR GGAAGTGAAGGGCGAAGAATC
Short range PCR and sequencing: waxeye
Av15671CytbF CCCAGAAAACTTCACACCAGC
Long range PCR: waxeye Short range PCR and sequencing: fernbird, pipit and bellbird
Av15951CytbF CCCTTCATCATCATTGGCCAA
Long range PCR: NZ robin Short range PCR and sequencing: waxeye
Av16137tProR ARAATRCCAGCTTTGGGAGTTGG
Long range PCR: fernbird and waxeye Short range PCR and sequencing: fernbird, pipit, waxeye and NZ robin
Av16152tProF CTCCAGCTCCCAAAGCTG
Short range PCR and sequencing: waxeye
Av16531ND6F ACCACCARCATHCCCCCYAAATA
Short range PCR and sequencing: waxeye and NZ robin
Av16653ND6F GGAGAAGGATTGGATGCCACTG
Short range PCR and sequencing: pipit
Av16728tGluR GGYTTTTCAGGCCGTAGRTCTTGG
Short range PCR and sequencing: waxeye
Av16758tGluF TRTGGCYTGAAAARCCRTCGTTG
Short range PCR and sequencing: waxeye, pipit and NZ robin
PipitND6F AGCCGCTACCACCAACCCCA
Short range PCR and sequencing: pipit
PipitcontrolR GCCTGGTGGGATGTCTGTCCG
Short range PCR and sequencing: pipit
AvtGluRobR CTCCGGGATCCGTGGCCTGA
Short range PCR and sequencing: NZ robin
AvND6RobF TTAAAAGCAGCCCCGCCCCC
Short range PCR and sequencing: NZ robin
WeND5F ACCCGCCTAGCTCTAGGTAGCA
Short range PCR and sequencing: waxeye
WeCytBF TCCACATCGGCCGAGGCTTT
Short range PCR and sequencing: waxeye
WeCytbR AGCCTCGGCCGATGTGGAAGT
Short range PCR and sequencing: waxeye
WeCR1F GCCCCCGCGCCTTTTACCTT
Short range PCR and sequencing: waxeye
WeCR1R TCGTGTGACGCGTGTGTTGGG
Short range PCR and sequencing: waxeye
WeND6R CGGTGTCTTTGGCGGCGGAT
Short range PCR and sequencing: waxeye
Supplementary Table 2: Estimation of DNA concentration using Nanodrop for the long range PCR products of the waxeye. After clean up using the Zymoclean™ Gel DNA Recovery Kit.
LR PCR product DNA Conc. (ng/μl) Av1753F12S-Av5201tmetR 26.5 Av4165nd1F-Av7662co1R 32.2 Av7318co1F-Av10116co3R 43.8 Av9942co3F-Av16137tproR 28.2 Av15671cytbF-Av2150R12S 32.4

102
6.2
Supp
lem
enta
ry fi
gure
s
Supp
lem
enta
ry F
igur
e 1:
Ful
l max
imum
like
lihoo
d tr
ee o
f 83
spec
ies.
Incl
udes
the
four
par
rot s
peci
es a
s the
out
-gro
up. P
rodu
ced
from
max
imum
like
lihoo
d an
alys
is o
n R
axM
L, u
sing
full
mito
chon
dria
l gen
ome
data
(135
88bp
). Po
ster
ior p
roba
bilit
y va
lues
show
supp
ort f
or e
ach
node
. Mad
e in
Fig
Tre
e v1
.40.

103
Supplementary Figure 2: Maximum likelihood consensus network showing split of the three suborders of the Passerines. Posterior probability threshold is set at 33%; all other nodes are fully supported (100%) and are not shown. Consensus network made in Splits Tree v4.11.3 using RaxML maximum likelihood data from the full species set (83 species); all oscines were condensed into a single branch.
Supplementary Figure 3: Maximum likelihood consensus network of the Core Corvoidea. Posterior probability threshold is set at 33%. Consensus network made in Splits Tree v4.11.3 using RaxML maximum likelihood analysis data from the full species set (83 species), all other passerines were condensed into a single branch.

104
Supplementary Figure 4: Maximum likelihood phylogenetic tree from 76 passerine species. Original species set of 83 had all species removed which had uncalled bases. Produced from maximum likelihood analysis on RaxML, using full mitochondrial genome data (13588bp). Posterior probability values show support for each node. Made in Fig Tree v1.40.

105
Supplementary Figure 5: Maximum likelihood consensus network showing split of the basal Passerida (Australasian robins, New Zealand wattlebirds and hihi) from the Passerida. Posterior probability threshold is set at 33%. Consensus network made in Splits Tree v4.11.3 using RaxML maximum likelihood analysis data from the full species set (83 species), all other passerines were condensed into a single branch.

106
Supplementary Figure 6: Maximum likelihood phylogenetic tree from all 63 Passerida species (including basal Passerida). Produced from maximum likelihood analysis on RaxML, using full mitochondrial genome data (13588bp). Posterior probability values show support for each node. Made in Fig Tree v1.40.

107
Supplementary Figure 7: Maximum likelihood phylogenetic tree from 61 Passerida species (including basal Passerida). Ficedula hypoleuca and Lampropsar tanagrinus were removed from data set as they had uncalled bases and had relatively close relatives in data set. Produced from maximum likelihood analysis on RaxML, using full mitochondrial genome data (13588bp). Posterior probability values show support for each node. Made in Fig Tree v1.40.

108
Supplementary Figure 8: Maximum likelihood consensus network of the three superfamilies of the Passerida. Posterior probability threshold is set at 33%. Consensus network made in Splits Tree v4.11.3 using RaxML maximum likelihood analysis data from the full species set (83 species). The species in each group have been condensed into a single branch. Australasian robins, NZ wattlebirds and hihi make up the basal Passerida.

109
Supplementary Figure 9: Maximum likelihood consensus network of the superfamily Sylvioidea. Posterior probability threshold is set at 28%. Consensus network made in Splits Tree v4.11.3 using RaxML maximum likelihood analysis data from the full species set (83 species), all other passerines were condensed into a single branch.
Supplementary Figure 10: Maximum likelihood consensus network of the superfamily Sylvioidea. Posterior probability threshold is set at 20 Consensus network made in Splits Tree v4.11.3 using RaxML maximum likelihood analysis data from the 19 Sylvioidea species only (83 species).

110
Supplementary Figure 11: Maximum likelihood consensus network of the superfamily Muscicapoidea. Posterior probability threshold is set at 30%. Made on Splits Tree v4.11.3 using RaxML maximum likelihood analysis data from the full species set (83 species), all other passerines were condensed into a single branch.

111
Supplementary Figure 12: Maximum likelihood consensus network of the superfamily Passeroidea. Posterior probability threshold is set at 30%. Made on Splits Tree v4.11.3 using RaxML maximum likelihood analysis data from the full species set (83 species), all other passerines were condensed into a single branch.