consumer perception towards various mobile service providers
TRANSCRIPT

www.ijcrt.org © 2021 IJCRT | Volume 9, Issue 3 March 2021 | ISSN: 2320-2882
IJCRT2103383 International Journal of Creative Research Thoughts (IJCRT) www.ijcrt.org 3126
CONSUMER PERCEPTION TOWARDS
VARIOUS MOBILE SERVICE PROVIDERS
Dr. Somabhusana Janakiballav Mishra
Assistant Professor, Amity Global Business School, Bhubaneswar
Debasish Rout
Assistant Professor, Amity Global Business School, Bhubaneswar
Dr. Ashamayee Mishra
Assistant Professor, Amity Global Business School, Bhubaneswar
Mr. Biswajeet Sahu
Student, BBA IV, Amity Global Business School, Bhubaneswar
ABSTRACT
Connectivity with everyone is a crucial element in today’s cyber world and mobile service is one among
them. In India after globalization the telecom sector was deregulated and today it is one of the fastest
growing industries because of stiff competition among different service providers. The telecom service
providers are adopting different strategies to woo the customers, but they must customize before designing
any service or offer. In this research paper, attempts have been made to find out the factors that customers
emphasize more while selecting the service provider. Network quality, customer service, pricing strategies
is the major factors. The research was conducted through online with help Google Forms. Data was
collected from 112 respondents and further calculated by using techniques such as chi-square, column
graphs and bar graphs. It has been found that consumers prefer prepaid plans instead of post-paid plans and
all most every customer treat their mobile phone as a necessity. They generally use their mobile phone for
their personal use and for both incoming and outgoing calls as well as internet. The study reveals that JIO is
the most preferred mobile phone service providers among consumers followed by Airtel and VI. Most of the
respondents replied that they are satisfied with the service provided by their mobile service provider. From
the analysis, we can conclude that there is no significant association between gender and age with type of
plans customers choose. There is a significant association between gender and age with how long the
respondents are availing the service of the mobile service provider and also there is a significant association
between gender and how much expenditure customers made per month.
Keywords: Network quality, customer service, pricing strategies, Mobile service provider, consumer
perception

www.ijcrt.org © 2021 IJCRT | Volume 9, Issue 3 March 2021 | ISSN: 2320-2882
IJCRT2103383 International Journal of Creative Research Thoughts (IJCRT) www.ijcrt.org 3127
INTRODUCTION
Mobile Services is one of the fast-moving industries in India. With the economy opening up there is cut-
throat competition in this sector. The widespread use of mobile phone has increased over the past decade to
the point of becoming an essential part of business, commerce, and society.
Most important mobile phones give access to the world anytime, anywhere and have come to provide great
assistance to users. Mobile phones are also economically priced to be affordable by the majority.
The rise in growth and development of information technology and mobile devices has made the Indian
mobile phone service markets more and more competitive. It is assumed by all mobile service providers that
value added services increases the customer loyalty. But does value added services fulfilling all the
customer needs and it is the only factor that influences the loyalty of the customers. Being a buyer’s market,
the mobile companies must go an extra mile by not limiting themselves to only giving range of offers.
Because today’s customers are very smart, and they easily understand the techniques of luring them.
Customers are more concerned about the value addition and defect free processes. Especially in the current
scenario in the corona outbreak period where they were not able go outside, internet and uninterrupted
connectivity with everyone was very crucial. Online academic classes in schools, colleges, universities,
work from home for employees, OTT applications, online from the e-commerce sites are some of the
frequently done activities of people in the lockdown period. Now in this case those service providers who
have given uninterrupted and non-complaining services to people are the most sought after by customers. In
addition to the above some of the value added things which customers remember are mobile number
portability, voice message, MMS,SMS, unbreakable signals, easy recharging, video calling etc.
Customer perception is the process to assess how customers perceive services, how they assess, whether
they have experienced quality service and whether they are satisfied or not. Customer perception is directly
related to customer expectation. Due to the dynamic nature of expectation perception of any person may
also shift over time, person, place or culture.
Customers perceive services in terms of the quality of the service and how satisfied they are overall with
their experiences. The study will throw light on the customer satisfaction towards different services
provided by different service providers.
LITERATURE REVIEW
DeoskarAruna (2009), in her study “A study of mobile services from customer’s perspective”, shows the
spectacular revolution in information technology happened in India which boosted telecom sector. The main
objective is to study the impact of customer service on customer satisfaction and to associate various factors
like data coverage, billing facilities with it. The findings gathered by testing data using SPSS states that all
the sub parameters like billing service and data coverage has a significant impact on the customer
satisfaction influencing customer perception.
Menon (2014) in the study entitled “Customer perception towards A public Sector Telecom Company
(BSNL) in Mobile services” focuses on consumer perception about government Indian company BSNL
using primary research data. The variables takes here are age groups, Income of the family, qualification,
opinions and also studied their correlation in between these factors. The correlation significance between
these factors is 0.05 according to analysis.
Kalyani Pawan (2015) in her research study “An Empirical Study on Reliance JIO Effect, Competitor’s
Reaction and Customer Perception on the JIO’S Pre- Launch Offer” “states the future effects that will be
observed after the launch of JIO. The study includes overall scenario of telecom sector, its history and its
growth projected. The paper shows the future scope in this sector and different type strategies used by
various companies.

www.ijcrt.org © 2021 IJCRT | Volume 9, Issue 3 March 2021 | ISSN: 2320-2882
IJCRT2103383 International Journal of Creative Research Thoughts (IJCRT) www.ijcrt.org 3128
Sudheesh et al. (2015) in their study paper “A comparative study on customer satisfaction towards Airtel &
Vodafone with reference to Avadi, Chennai” reviews the consumer perception about the two giants in
Indian telecom industry; Vodafone and Airtel in city Chennai. The consumers expect different services from
networks; this study highlights those services and the importance of the same.
Sugunathi Meena and Shanthi R. (2017) in their research paper conducted a study based on customer
opinions about service they are using with parameters responsiveness, reliability, empathy, assurance and
tangibility. The factors which matters most are on time and right service when customer expects it.
Debarun Chakraborty (2013), in his research found out that preference of customers are more inclined
towards those service providers who has a brand of his own and extends un-paralleled services with respect
to wide network coverage, unbreakable signal and connectivity.
Kavitha et al (2013), in their article titled “A study on Customer satisfaction towards Vodafone sim card
special reference in Madurai city” determined the consumer satisfaction on Vodafone service providers’
services in Madurai district and to find out the consumers mentality towards using the services.
Lehtinen&Lehtinen (1991) suggested in their research that process and output are complementary to each
other as far as quality-of-service provider is concerned. Customers asses the quality from the tangible aspect
of the service process without any significant errors.
Wang and Lo (2002)concluded in their findings that of all the factors of influencing the customers, network
quality and after sales service of these providers are the deciding factors of survivability.
Ranaweera and Neely (2003) studied and searched that retention of customers is very much dependent on
their perception towards price, service, quality of not only mobile service providers but also in fixed line
telephone services.
Gopica (2015) in her research paper “Growth and development of telecom sectors in India-an overview” the
paper gives an idea about telecom origin and also about the huge evolution that has taken place in this
sector. The paper in view of researcher gives an overview about the various authorities like Telecom
Regulatory Authority of India also the different networks which are present in this industry.
Dr.K. Moorthy1, K.Selvaraju2, K.Ayiswarya3 (17th Jan 2017)inferred in their research that internet has
changed the day to day processes of people as far as their style, nature, socializing aspect, sharing of
information, flow of ideas are concerned.In order to make them satisfy the service providers have to cover
extra mile to satisfy their needs and wants on their terms.
RESEARCH METHODOLOGY
This research study was based on a survey made online. A structured questionnaire was used for data
collection. An online survey on google forms was designed to determine the consumer perception towards
various mobile service providers in Bhubaneswar. 112 respondents from various localities of
Bhubaneswar were selected as sample. Data is analyzed by simple percentage analysis, cross tabulations,
chi-square and charts using Excel.
OBJECTIVES OF THE STUDY
To find out customers satisfaction towards various mobile service providers.
To study the association of demographics with the type of plan consumer choose and loyalty
To study the factors affecting the buying decision of consumers.
ANALYSIS AND INTERPRETATION
On the basis of data collected from 112 respondents from the city of Bhubaneswar the following analysis
has been made and we have found that out of 112 respondents 53 belong to 18-20 age group, 50 belong to
21-23 and 9 only belong to 24-30. So mostly the study is made on the youths of the city. Table -1 represents
the number of respondents belong to different age groups and the same is also represented in chart-1.

www.ijcrt.org © 2021 IJCRT | Volume 9, Issue 3 March 2021 | ISSN: 2320-2882
IJCRT2103383 International Journal of Creative Research Thoughts (IJCRT) www.ijcrt.org 3129
Table – 1 – Age of respondents
AGE NO OF RESPONDENTS
18-20 53
21-23 50
24-30 9
Chart – 1 – Age of respondents
It has been found that out of 112 respondents 27 are female and 85 are male. Table -2 below is depicting
that. It is also clearly seen from the chart-2 that majority of the respondents are male.
Table – 2 – Gender of respondents
GENDER NO OF RESPONDENTS
FEMALE 27
MALE 85
Chart – 2 – Gender of respondents
It has been found that (Table – 3) out of 112 respondents 44 are B.Tech followed by 15 BBA. The number
of respondents belonging to different educational background can be clearly seen from Chart-3.
53 50
9
18-20 21-23 24-30
Age of Respondents
27
85
FEMALE MALE
Gender

www.ijcrt.org © 2021 IJCRT | Volume 9, Issue 3 March 2021 | ISSN: 2320-2882
IJCRT2103383 International Journal of Creative Research Thoughts (IJCRT) www.ijcrt.org 3130
Table – 3– Educational qualification of respondents
EDUCATIONAL QUALIFICATION
NO OF RESPONDENTS
12TH COMPLETED 12
B.TECH 44
BBA 15
B.SC 9
B.COM 11
DIPLOMA 4
MBA 12
B. PHARMA 3
M.COM 2
Chart – 3– Educational qualification of respondents
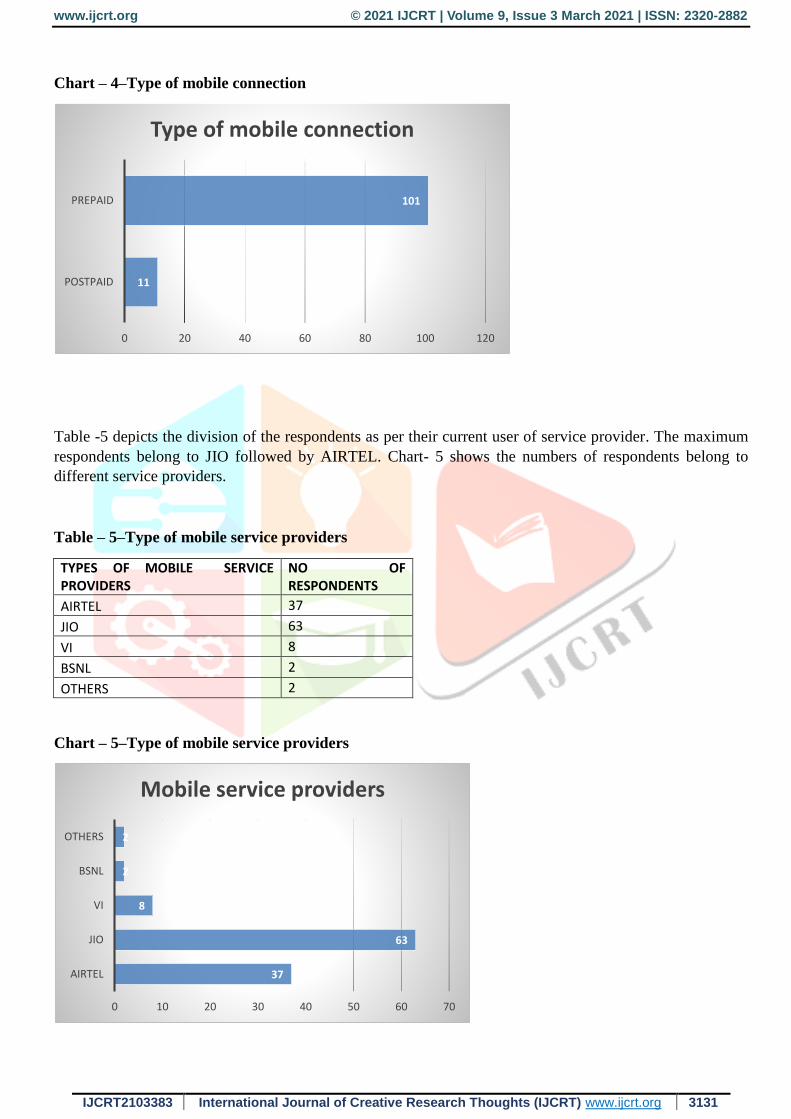
Table -4 shows number of respondents according to their type of mobile connection. The maximum
respondents are prepaid users in comparison to Post-paid users. Chart-4 shows that majority of the users are
prepaid users.
Table – 4–Type of mobile connection
TYPE OF MOBILE CONNECTION NO OF RESPONDENTS
POSTPAID 11
PREPAID 101
12
44
15
9 11 412
3 205
101520253035404550
Education
www.ijcrt.org © 2021 IJCRT | Volume 9, Issue 3 March 2021 | ISSN: 2320-2882
IJCRT2103383 International Journal of Creative Research Thoughts (IJCRT) www.ijcrt.org 3131
Chart – 4–Type of mobile connection
Table -5 depicts the division of the respondents as per their current user of service provider. The maximum
respondents belong to JIO followed by AIRTEL. Chart- 5 shows the numbers of respondents belong to
different service providers.
Table – 5–Type of mobile service providers
TYPES OF MOBILE SERVICE PROVIDERS
NO OF RESPONDENTS
AIRTEL 37
JIO 63
VI 8
BSNL 2
OTHERS 2
Chart – 5–Type of mobile service providers
11
101
0 20 40 60 80 100 120
POSTPAID
PREPAID
Type of mobile connection
37
63
8
2
2
0 10 20 30 40 50 60 70
AIRTEL
JIO
VI
BSNL
OTHERS
Mobile service providers

www.ijcrt.org © 2021 IJCRT | Volume 9, Issue 3 March 2021 | ISSN: 2320-2882
IJCRT2103383 International Journal of Creative Research Thoughts (IJCRT) www.ijcrt.org 3132
It has been found that (Table – 6) out of 112 respondents 94 are satisfied with the service provided by the
present mobile service provider they belong to. Chart – 6 represents the same. It can be seen that 18
respondents are dissatisfied with the service provided by their current mobile service provider.
Table –6–Number of customers satisfied with the service
CUSTOMER SATISFACTION
NO OF RESPONDENTS
YES 94
NO 18
Chart –6–Number of customers satisfied with the service
Table- 7 is a cross table that shows the observed value of chi square test which is conducted to know the
association between gender and type of plans they choose (Monthly or quarterly). Respondents are
categories on the basis of their chosen plans. There are two types of plans monthly, quarterly.
H01: There is no significant association between gender and type of plans customers choose.
Table – 7–Cross table for gender and type of plans
Count of PLAN Column Labels
Row Labels Monthly plan Quarterly plan
Grand Total
Female 5 22 27
Male 30 55 85
Grand Total 35 77 112
Table- 8 shows the expected values and the p value of chi square test which are conducted to know the
association between gender and type of plans they choose (Monthly or quarterly). The p value here is 0.1
which is greater than 0.05. Hence the null hypothesis is accepted here. So we can conclude that there is no
significant association between gender and type of plans customers choose.
94
180
20
40
60
80
100
YES NO
Satisfaction

www.ijcrt.org © 2021 IJCRT | Volume 9, Issue 3 March 2021 | ISSN: 2320-2882
IJCRT2103383 International Journal of Creative Research Thoughts (IJCRT) www.ijcrt.org 3133
Table –8–Chi-square test with p value for gender and type of plans
Count of PLAN Column Labels
Row Labels Monthly plan Quarterly plan
Grand Total
Female 8.4375 18.5625 27
Male 26.5625 58.4375 85
p value 0.101354774
H02: There is no significant association between age and type of plans customers choose.
The following cross Table-9 shows the observed value of chi square test which is conducted to know the
association between age and plans customers choose. Respondents are categories on the basis of their
chosen plans. Also respondents are categorised on the basis of age i.e. 18-20, 21-23 and 24-30.
Table – 9–Cross table for age and type of plans
Count Plan Column Labels
Row Labels Monthly plan Quarterly plan Total
18-20 30 23 53
21-23 18 32 50
24-30 5 4 9
Total 53 59 112
Table- 10 shows the expected values and the p value of chi square test which are conducted to know the
association between age and type of plans they choose (Monthly or quarterly). The p value here is 0.09
which is greater than 0.05. Hence the null hypothesis is accepted here. So we can conclude that there is no
significant association between age and type of plans customers choose.
Table –10–Chi-square test with p value for age and type of plans
Count Plan Column Labels
Row Labels Monthly plan Quarterly plan
18-20 25.08035714 27.91964286
21-23 23.66071429 26.33928571
24-30 4.258928571 4.741071429
p value 0.097903359
H03: There is no significant association between gender and how long the respondents are availing the
service of the mobile service provider.

www.ijcrt.org © 2021 IJCRT | Volume 9, Issue 3 March 2021 | ISSN: 2320-2882
IJCRT2103383 International Journal of Creative Research Thoughts (IJCRT) www.ijcrt.org 3134
Table-11 depicts the observed value of chi square test which is conducted to know the association between
gender and how long the respondents are availing the service of the mobile service provider. We have
categorised the data into < 2years, 2—4 years and > 4years.
Table –11–Cross table for gender and how long the respondents are availing the service of the mobile
service provider
For how long you are availing with the services of your present service provider?
Column Labels
Row Labels Less than 2 years
2-4 Years
More than 4 years
Grand Total
Female 7 12 8 27
Male 52 26 7 85
Grand Total 59 38 15 112
Table- 12 shows the expected values and the p value of chi square test which are conducted to know the
association between genders and how long the respondents are availing the service of the mobile service
provider. The p value here is 0.005 which is less than 0.05. Hence the null hypothesis is rejected. So we can
conclude that there is a significant association between gender and how long the respondents are availing
the service of the mobile service provider.
Table –12–Chi-square test with p value for gender and how long the respondents are availing the
service of the mobile service provider
For how long you are availing with the services of your present service provider?
Column Labels
Row Labels Less than 2 years 2-4 Years
More than 4 years
Female 14.22321429 9.160714286 3.616071429
Male 44.77678571 28.83928571 11.38392857
p value 0.00150635
H04: There is no significant association between age and how long the respondents are availing the service
of the mobile service provider.

www.ijcrt.org © 2021 IJCRT | Volume 9, Issue 3 March 2021 | ISSN: 2320-2882
IJCRT2103383 International Journal of Creative Research Thoughts (IJCRT) www.ijcrt.org 3135
Table-13 is a cross table that represents the observed value of chi square test which is conducted to know
the association between age and how long the respondents are availing the service of the mobile service
provider.
Table –13–Cross table for age and how long the respondents are availing the service of the mobile
service provider
For how long you are availing with the services of your present service provider?
Column Labels
Row Labels
less than 2 Years 2-4 Years
More than 4 years
Grand Total
18-20 40 8 5 53
21-23 10 31 9 50
24-30 1 3 5 9
Grand Total 51 42 19 112
Table- 14 depicts the expected values and the p value of chi square test which are conducted to know the
association between age and how long the respondents are availing the service of the mobile service
provider. The p value here is 0.000 which is less than 0.05. Hence the null hypothesis is rejected. So we can
conclude that there is a significant association between age and how long the respondents are availing the
service of the mobile service provider.
Table –14– Chi-square test with p value age and how long the respondents are availing the service of
the mobile service provider
For how long you are availing with the services of your present service provider?
Column Labels
Row Labels less than 2 Years 2-4 Years
More than 4 years
18-20 24.13393 19.875 8.991071
21-23 22.76786 18.75 8.482143
24-30 4.098214 3.375 1.526786
p value 4.42326E-09
H05: There is no significant association between gender and how much expenditure is made by the
customer per month.
www.ijcrt.org © 2021 IJCRT | Volume 9, Issue 3 March 2021 | ISSN: 2320-2882
IJCRT2103383 International Journal of Creative Research Thoughts (IJCRT) www.ijcrt.org 3136
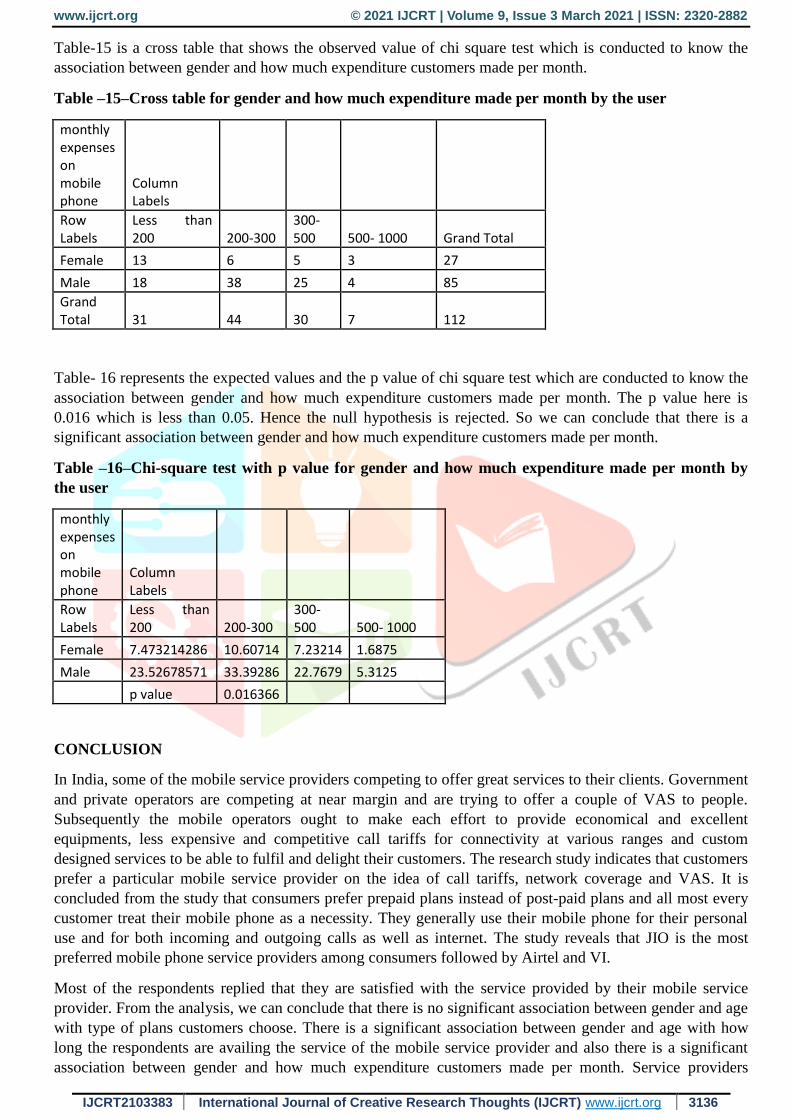
Table-15 is a cross table that shows the observed value of chi square test which is conducted to know the
association between gender and how much expenditure customers made per month.
Table –15–Cross table for gender and how much expenditure made per month by the user
monthly expenses on mobile phone
Column Labels
Row Labels
Less than 200 200-300
300-500 500- 1000 Grand Total
Female 13 6 5 3 27
Male 18 38 25 4 85
Grand Total 31 44 30 7 112
Table- 16 represents the expected values and the p value of chi square test which are conducted to know the
association between gender and how much expenditure customers made per month. The p value here is
0.016 which is less than 0.05. Hence the null hypothesis is rejected. So we can conclude that there is a
significant association between gender and how much expenditure customers made per month.
Table –16–Chi-square test with p value for gender and how much expenditure made per month by
the user
monthly expenses on mobile phone
Column Labels
Row Labels
Less than 200 200-300
300-500 500- 1000
Female 7.473214286 10.60714 7.23214 1.6875
Male 23.52678571 33.39286 22.7679 5.3125
p value 0.016366
CONCLUSION
In India, some of the mobile service providers competing to offer great services to their clients. Government
and private operators are competing at near margin and are trying to offer a couple of VAS to people.
Subsequently the mobile operators ought to make each effort to provide economical and excellent
equipments, less expensive and competitive call tariffs for connectivity at various ranges and custom
designed services to be able to fulfil and delight their customers. The research study indicates that customers
prefer a particular mobile service provider on the idea of call tariffs, network coverage and VAS. It is
concluded from the study that consumers prefer prepaid plans instead of post-paid plans and all most every
customer treat their mobile phone as a necessity. They generally use their mobile phone for their personal
use and for both incoming and outgoing calls as well as internet. The study reveals that JIO is the most
preferred mobile phone service providers among consumers followed by Airtel and VI.
Most of the respondents replied that they are satisfied with the service provided by their mobile service
provider. From the analysis, we can conclude that there is no significant association between gender and age
with type of plans customers choose. There is a significant association between gender and age with how
long the respondents are availing the service of the mobile service provider and also there is a significant
association between gender and how much expenditure customers made per month. Service providers

www.ijcrt.org © 2021 IJCRT | Volume 9, Issue 3 March 2021 | ISSN: 2320-2882
IJCRT2103383 International Journal of Creative Research Thoughts (IJCRT) www.ijcrt.org 3137
should create an emotional relationship with the consumer through innovative plans and enhance their
services quality and brand image, better connectivity and goodwill with the consumer because the consumer
always want more from their operators.
REFERENCES
Deoskar, A. (2009), A study of mobile services from customer’s perspective. PhD thesis, available
at http://shodhganga.inflibnet.ac.in/bitstream/10603/1997/6/06_abstract.pdf
Menon, S. D. (2014), Customer Perception towards A Public Sector Telecom Company (BSNL) in
Mobile Services International Journal of Management and Social Sciences Research, volume 3,
no.3 pp. 29-34.
Suguanthi, M., Shanthi, R. (2017), Customer perception towards service quality in
IndianTelecommunication industry, International journal of business and management invention,
volume 6,issue 6, pp. 44-51.
Gopika, G.G. (2014), Growth and Development of Telecom Sector in India – An overview, IOSR
Journal of Business and Management, volume 16, issue 9, pp. 25-36.
DebarunChakraborty, “Customer Satisfaction And Expectation Towards Aircel: A Research
Conducted In West Midnapore”, International Monthly Refereed Journal of Research In
Management & Technology, Volume II, January 2013, Pp 114 – 127.
T.N.R.Kavitha&S.DuraiMurugan, “A Study on Customer Satisfaction towards Vodafone Sim Card
Special Reference In Madurai City”, IOSR Journal of Business and Management, Pp 29 – 32.
Lehtinen, J.R., &Lehtinen, U. (1991). Two approaches to service quality dimensions. The Service
Industries Journal, 11(3), 287-303.
Wang, Yonggui, & Lo, Hing Po. (2002). Service Quality, Customer Satisfaction and Behaviour
Intentions: Evidence from China’s Telecommunication Industry. Info, 4(6), 50-60.
Ranaweera, Chatura, & Neely, Andy. (2003), Some Moderating Effects on the service quality-
customer Retention link. International Journal of Operation & Production Management, 23(2), 230-
248.
Sudheesh, S.S, Chand, A., Subraman, A.K (2015), A comparative study on customer satisfaction
towards Airtel & Vodafone with reference to Avadi, Chennai, ZENITH International Journal of
Multidisciplinary Research, vol.5 (6), pp. 74-83.
KalyaniPawan(2015), “An Empirical Study on Reliance JIO Effect, Competitor’s Reaction and
Customer Perception on the JIO’S Pre- Launch Offer”. Journal of Management Engineering and
Information Technology(JMEIT),vol.3,Pp 18-36.
Dr. K. Moorthy1 , K.Selvaraju2 , K.Ayiswarya3(17 th January 2017), A Study On Customer
Behavioral Intention And Satisfaction Towards Internet Service Providers With Special Reference
To Tamil Nadu, International Conference on Science technology & management.