confectionery: 2005 issued ju - census · table 1b. summary of manufacturers' shipments of...
TRANSCRIPT
Confectionery: 2005 Issued July 2006
MA311D(05)-1
Current IndustrialReports
Current data are released electronically on Internet base) for 2005 was 6,111 million pounds,for all individual surveys as they become avail- compared to 5,780 million pounds in 2004, anable. Use: http://www.census.gov/mcd/. increase of 5.7 percent. Total value of ship-Individual reports can be accessed by choosing ments of confectionery products (excluding"Current Industrial Reports (CIR)," clicking on chewing gum, bubble gum, and chewing gum"CIRs by Subsector;" then choose the survey of base) for 2005 was $15,264 million, comparedinterest. Follow the menu to view the PDF file to $14,636 million in 2004, an increase of 4.3or to download the worksheet file (XLS format) percent.to your personal computer.
The quantity of chocolate and chocolate-typeThese data are also available on Internet confectionery products shipped increased 6.3through the U.S. Department of Commerce percent, while the quantity of nonchocolate-and STAT-USA by subscription. The Internet type confectionery products increased by 5.1 address is: www.stat-usa.gov/. Follow the percent. The value of chocolate-type confec-prompts to register. Also, you may call tionery products shipped increased 3.6 percent,202-482-1986 or 1-800-STAT-USA, for while the value of nonchocolate-type confec-further information. tionery products increased 6.1 percent. SUMMARY OF FINDINGS: Total quantity of ship- For general CIR information, explanation of ments of confectionery products (excluding general terms and historical note, see the chewing gum, bubble gum, and chewing gum appendix.
U S C E N S U S B U R E A U U.S. Department of Commerce Economics and Statistics Administration
Helping You Make Informed Decisions U.S. CENSUS BUREAU
Address inquiries concerning these data to Consumer Goods Industries Branch, Manufacturing and Construction Division (MCD), Washington, DC 20233-6900, or call Ronanne Vinson, 301-763-7692.
For mail or fax copies of this publication, please contact the Information Services Center, MCD, Washington, DC 20233-6900, or call 301-763-4673.
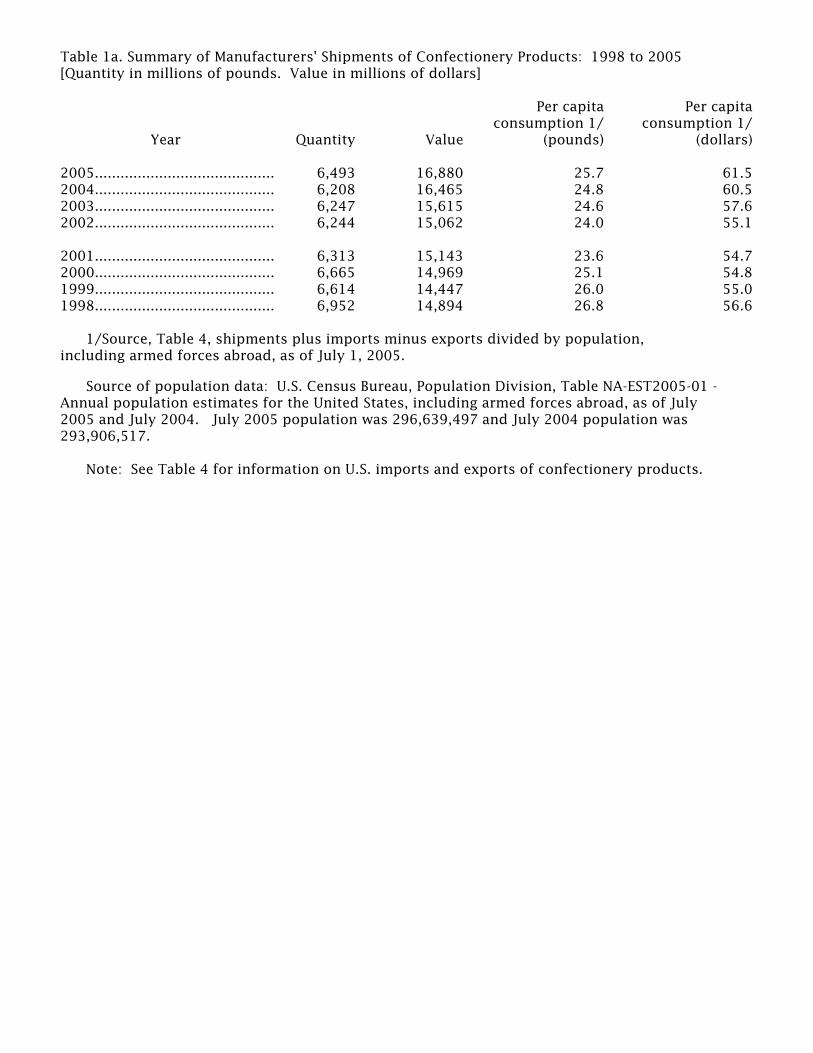
Table 1a. Summary of Manufacturers' Shipments of Confectionery Products: 1998 to 2005[Quantity in millions of pounds. Value in millions of dollars]
Per capita Per capita consumption 1/ consumption 1/
Year Quantity Value (pounds) (dollars)
2005.......................................... 6,493 16,880 25.7 61.52004.......................................... 6,208 16,465 24.8 60.52003.......................................... 6,247 15,615 24.6 57.62002.......................................... 6,244 15,062 24.0 55.1
2001.......................................... 6,313 15,143 23.6 54.72000.......................................... 6,665 14,969 25.1 54.81999.......................................... 6,614 14,447 26.0 55.01998.......................................... 6,952 14,894 26.8 56.6
1/Source, Table 4, shipments plus imports minus exports divided by population, including armed forces abroad, as of July 1, 2005.
Source of population data: U.S. Census Bureau, Population Division, Table NA-EST2005-01 -Annual population estimates for the United States, including armed forces abroad, as of July 2005 and July 2004. July 2005 population was 296,639,497 and July 2004 population was 293,906,517.
Note: See Table 4 for information on U.S. imports and exports of confectionery products.
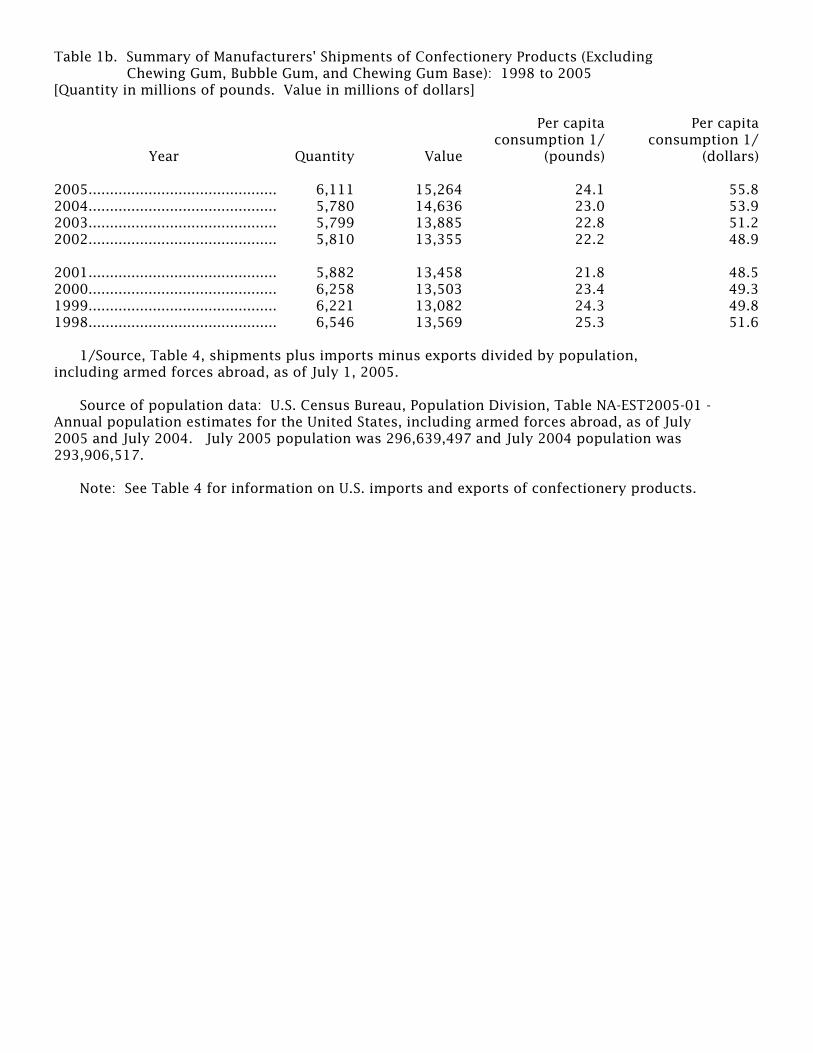
Table 1b. Summary of Manufacturers' Shipments of Confectionery Products (Excluding Chewing Gum, Bubble Gum, and Chewing Gum Base): 1998 to 2005[Quantity in millions of pounds. Value in millions of dollars]
Per capita Per capita consumption 1/ consumption 1/
Year Quantity Value (pounds) (dollars)
2005............................................ 6,111 15,264 24.1 55.82004............................................ 5,780 14,636 23.0 53.92003............................................ 5,799 13,885 22.8 51.22002............................................ 5,810 13,355 22.2 48.9
2001............................................ 5,882 13,458 21.8 48.52000............................................ 6,258 13,503 23.4 49.31999............................................ 6,221 13,082 24.3 49.81998............................................ 6,546 13,569 25.3 51.6
1/Source, Table 4, shipments plus imports minus exports divided by population, including armed forces abroad, as of July 1, 2005.
Source of population data: U.S. Census Bureau, Population Division, Table NA-EST2005-01 -Annual population estimates for the United States, including armed forces abroad, as of July 2005 and July 2004. July 2005 population was 296,639,497 and July 2004 population was 293,906,517.
Note: See Table 4 for information on U.S. imports and exports of confectionery products.
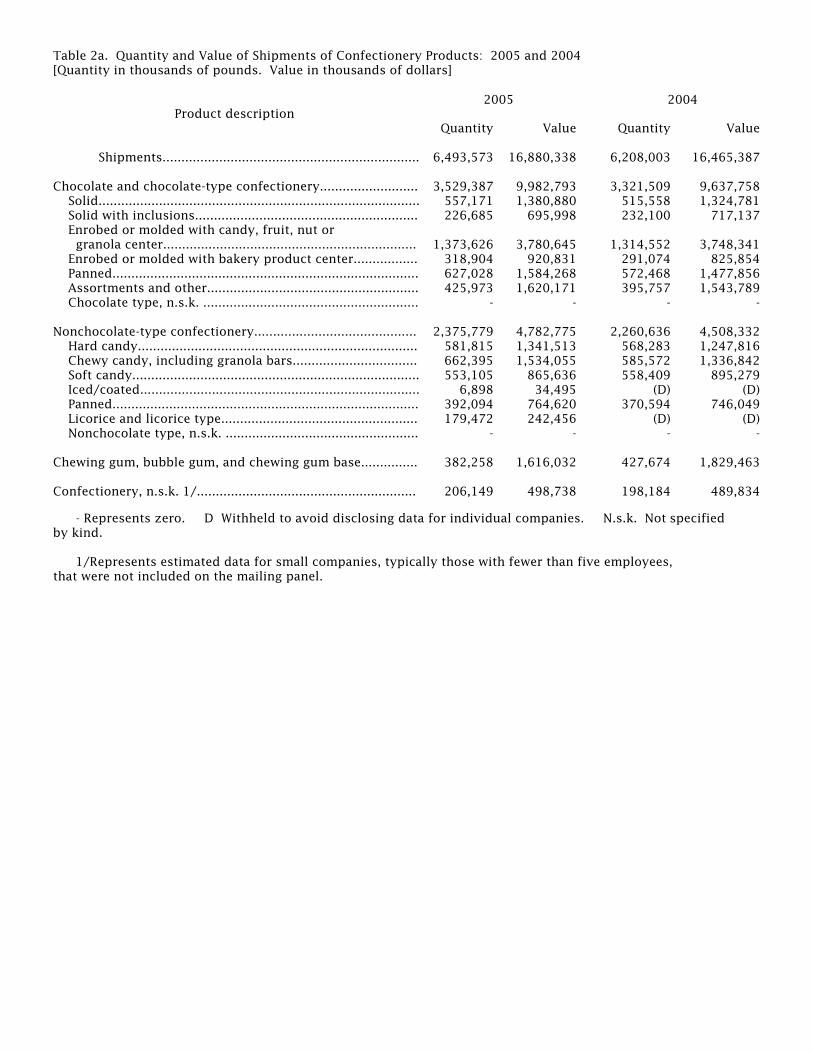
Table 2a. Quantity and Value of Shipments of Confectionery Products: 2005 and 2004[Quantity in thousands of pounds. Value in thousands of dollars]
Product descriptionQuantity Value Quantity Value
Shipments.................................................................... 6,493,573 16,880,338 6,208,003 16,465,387
Chocolate and chocolate-type confectionery.......................... 3,529,387 9,982,793 3,321,509 9,637,758 Solid..................................................................................... 557,171 1,380,880 515,558 1,324,781 Solid with inclusions........................................................... 226,685 695,998 232,100 717,137 Enrobed or molded with candy, fruit, nut or granola center................................................................... 1,373,626 3,780,645 1,314,552 3,748,341 Enrobed or molded with bakery product center................. 318,904 920,831 291,074 825,854 Panned................................................................................. 627,028 1,584,268 572,468 1,477,856 Assortments and other........................................................ 425,973 1,620,171 395,757 1,543,789 Chocolate type, n.s.k. ......................................................... - - - -
Nonchocolate-type confectionery........................................... 2,375,779 4,782,775 2,260,636 4,508,332 Hard candy.......................................................................... 581,815 1,341,513 568,283 1,247,816 Chewy candy, including granola bars................................. 662,395 1,534,055 585,572 1,336,842 Soft candy............................................................................ 553,105 865,636 558,409 895,279 Iced/coated.......................................................................... 6,898 34,495 (D) (D) Panned................................................................................. 392,094 764,620 370,594 746,049 Licorice and licorice type.................................................... 179,472 242,456 (D) (D) Nonchocolate type, n.s.k. ................................................... - - - -
Chewing gum, bubble gum, and chewing gum base............... 382,258 1,616,032 427,674 1,829,463
Confectionery, n.s.k. 1/.......................................................... 206,149 498,738 198,184 489,834
- Represents zero. D Withheld to avoid disclosing data for individual companies. N.s.k. Not specifiedby kind.
1/Represents estimated data for small companies, typically those with fewer than five employees,that were not included on the mailing panel.
2005 2004
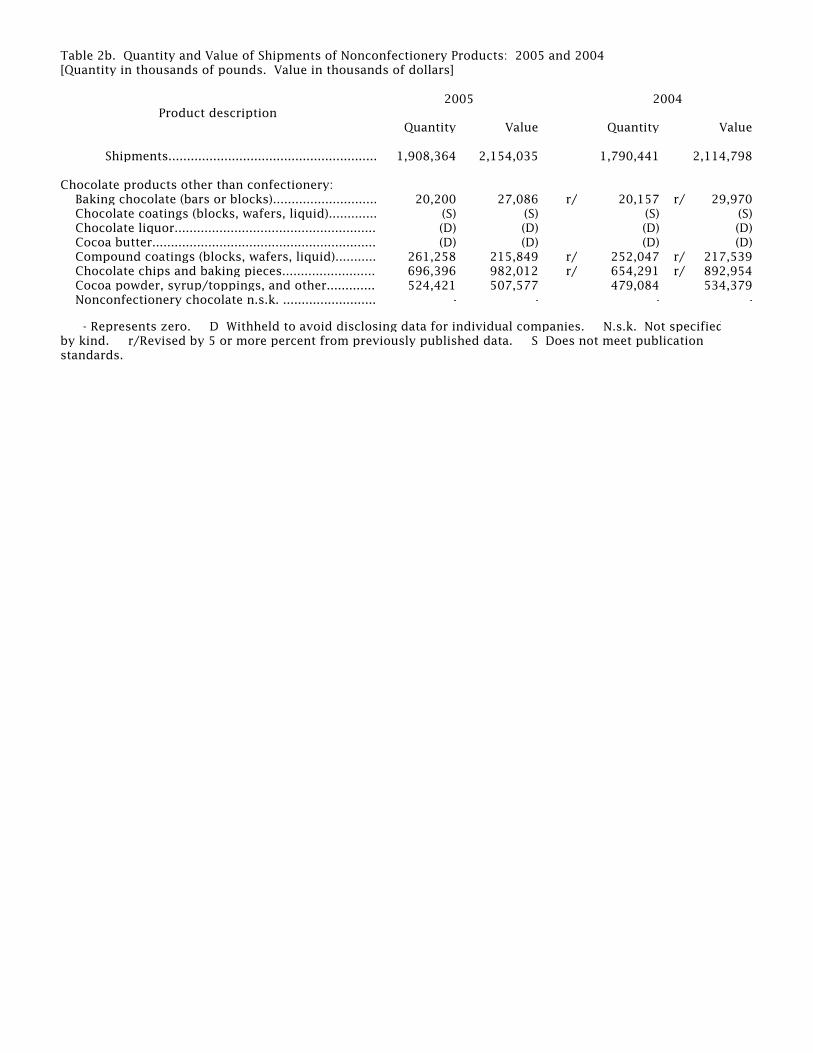
Table 2b. Quantity and Value of Shipments of Nonconfectionery Products: 2005 and 2004[Quantity in thousands of pounds. Value in thousands of dollars]
Product descriptionQuantity Value Quantity Value
Shipments........................................................ 1,908,364 2,154,035 1,790,441 2,114,798
Chocolate products other than confectionery: Baking chocolate (bars or blocks)............................ 20,200 27,086 r/ 20,157 r/ 29,970 Chocolate coatings (blocks, wafers, liquid)............. (S) (S) (S) (S) Chocolate liquor...................................................... (D) (D) (D) (D) Cocoa butter............................................................ (D) (D) (D) (D) Compound coatings (blocks, wafers, liquid)........... 261,258 215,849 r/ 252,047 r/ 217,539 Chocolate chips and baking pieces......................... 696,396 982,012 r/ 654,291 r/ 892,954 Cocoa powder, syrup/toppings, and other............. 524,421 507,577 479,084 534,379 Nonconfectionery chocolate n.s.k. ......................... - - - -
- Represents zero. D Withheld to avoid disclosing data for individual companies. N.s.k. Not specifiedby kind. r/Revised by 5 or more percent from previously published data. S Does not meet publication standards.
2005 2004

Table 3. Consumption of Selected Ingredients by the U.S. Confectionery Industry: 2005 and 2004[Quantity in thousands of pounds. Value in thousands of dollars]
Materials Quantity Value Quantity Value
Materials consumed........................................... (X) 4,131,733 (X) 3,963,981
Sugar (cane-beet)............................................................ 2,404,237 663,189 2,367,551 658,321Cocoa beans................................................................... 697,169 603,160 729,265 571,046Corn syrup including HFCS and dextrose...................... 1,402,857 172,264 1,363,482 162,671Chocolate liquor, imported............................................ (D) (D) (S) (S)Chocolate liquor, domestic............................................ (D) (D) 13,070 17,603Cocoa powder composition coatings............................. (S) (S) (S) (S)Cocoa cake or powder.................................................... 127,185 84,114 130,340 90,882Cocoa butter................................................................... 241,620 435,780 247,822 393,380Chocolate coatings, milk................................................ 216,288 203,350 237,847 227,348Chocolate coatings, other than milk.............................. 111,047 100,913 114,889 106,991Fats and oils................................................................... 228,785 112,547 221,772 102,107Gum base........................................................................ (D) (D) 66,934 62,565Milk and milk products.................................................. 1,083,423 517,852 1,052,761 481,863Peanuts, shelled basis.................................................... 327,843 158,983 326,548 150,387Almond kernels.............................................................. 53,731 105,141 50,675 81,024Other nuts and nut meats (kernels)............................... 35,104 100,366 38,421 97,970Coconut meat................................................................. 5,601 5,322 5,511 5,192Other edible materials 1/............................................... 501,978 728,999 493,913 710,371Materials, n.s.k. ............................................................. (X) 2,133 (X) 2,048
D Withheld to avoid disclosing data for individual companies. N.s.k. Not specified by kind.S Does not meet publication standards. X Not applicable.
1/Includes corn starch, essential oils, eggs and egg products, fruits, jams, and other materials on which specific data were not collected.
Note: Materials such as parts, containers, etc., consumed in the manufacturing process are not reported in this survey. This information is available in the 2002 Economic Census report for industries 311320, 311330, and 311340. Specifically excluded in this report are freight charges and other direct charges incurred by the establishment, fuels consumed, parts, containers, scrap, electric energy purchases, work done by others on materials or parts furnished by other establishments (contract work), and cost of products bought and resold in the same condition.
2005 2004
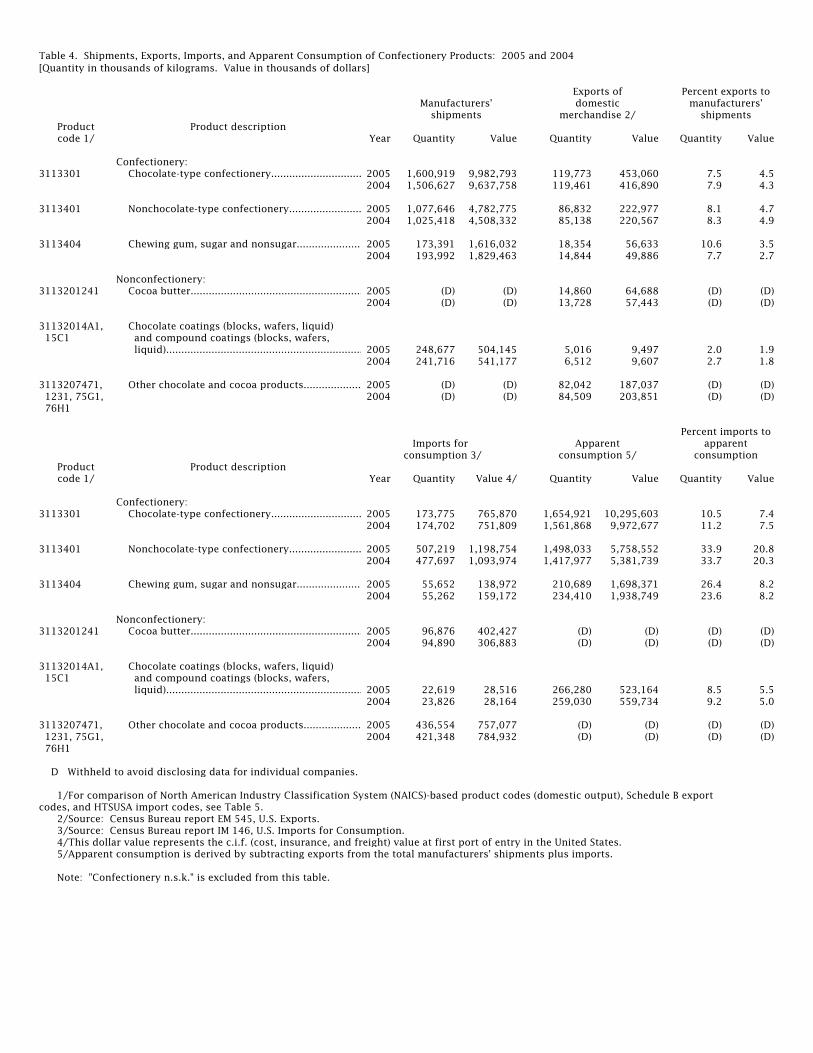
Table 4. Shipments, Exports, Imports, and Apparent Consumption of Confectionery Products: 2005 and 2004[Quantity in thousands of kilograms. Value in thousands of dollars]
Product Product descriptioncode 1/ Year Quantity Value Quantity Value Quantity Value
Confectionery:3113301 Chocolate-type confectionery.............................. 2005 1,600,919 9,982,793 119,773 453,060 7.5 4.5
2004 1,506,627 9,637,758 119,461 416,890 7.9 4.3
3113401 Nonchocolate-type confectionery........................ 2005 1,077,646 4,782,775 86,832 222,977 8.1 4.72004 1,025,418 4,508,332 85,138 220,567 8.3 4.9
3113404 Chewing gum, sugar and nonsugar..................... 2005 173,391 1,616,032 18,354 56,633 10.6 3.52004 193,992 1,829,463 14,844 49,886 7.7 2.7
Nonconfectionery:3113201241 Cocoa butter......................................................... 2005 (D) (D) 14,860 64,688 (D) (D)
2004 (D) (D) 13,728 57,443 (D) (D)
31132014A1, Chocolate coatings (blocks, wafers, liquid) 15C1 and compound coatings (blocks, wafers,
liquid)................................................................. 2005 248,677 504,145 5,016 9,497 2.0 1.92004 241,716 541,177 6,512 9,607 2.7 1.8
3113207471, Other chocolate and cocoa products................... 2005 (D) (D) 82,042 187,037 (D) (D) 1231, 75G1, 2004 (D) (D) 84,509 203,851 (D) (D) 76H1
Imports for consumption 3/
Product Product descriptioncode 1/ Year Quantity Value 4/ Quantity Value Quantity Value
Confectionery:3113301 Chocolate-type confectionery.............................. 2005 173,775 765,870 1,654,921 10,295,603 10.5 7.4
2004 174,702 751,809 1,561,868 9,972,677 11.2 7.5
3113401 Nonchocolate-type confectionery........................ 2005 507,219 1,198,754 1,498,033 5,758,552 33.9 20.82004 477,697 1,093,974 1,417,977 5,381,739 33.7 20.3
3113404 Chewing gum, sugar and nonsugar..................... 2005 55,652 138,972 210,689 1,698,371 26.4 8.22004 55,262 159,172 234,410 1,938,749 23.6 8.2
Nonconfectionery:3113201241 Cocoa butter......................................................... 2005 96,876 402,427 (D) (D) (D) (D)
2004 94,890 306,883 (D) (D) (D) (D)
31132014A1, Chocolate coatings (blocks, wafers, liquid) 15C1 and compound coatings (blocks, wafers,
liquid)................................................................. 2005 22,619 28,516 266,280 523,164 8.5 5.52004 23,826 28,164 259,030 559,734 9.2 5.0
3113207471, Other chocolate and cocoa products................... 2005 436,554 757,077 (D) (D) (D) (D) 1231, 75G1, 2004 421,348 784,932 (D) (D) (D) (D) 76H1
D Withheld to avoid disclosing data for individual companies.
1/For comparison of North American Industry Classification System (NAICS)-based product codes (domestic output), Schedule B export codes, and HTSUSA import codes, see Table 5. 2/Source: Census Bureau report EM 545, U.S. Exports. 3/Source: Census Bureau report IM 146, U.S. Imports for Consumption. 4/This dollar value represents the c.i.f. (cost, insurance, and freight) value at first port of entry in the United States. 5/Apparent consumption is derived by subtracting exports from the total manufacturers' shipments plus imports.
Note: "Confectionery n.s.k." is excluded from this table.
Manufacturers'shipments
Exports ofdomestic
merchandise 2/
Percent exports tomanufacturers'
shipments
Apparentconsumption 5/
Percent imports toapparent
consumption

Table 5. Comparison of North American Industry Classification System (NAICS)-Based Product Codes With Schedule B Export Codes, and HTSUSA Import Codes: 2005
Product Product description Export Importcode code 1/ code 2/
3113301, Total, chocolate and chocolate-type confectionery products 1806.31.0040 1806.31.0041 3000 and nonconfectionery chocolate products........................................ 1806.31.0080 1806.31.0049
1806.32.1000 1806.31.00801806.32.3550 1806.32.01001806.90.0063 1806.32.04001806.90.0073 1806.32.06001806.90.0083 1806.32.08001806.90.0093 1806.32.1400
1806.32.16001806.32.18001806.32.30001806.32.55001806.32.6000
1806.32.70001806.32.80001806.32.9000
1806.90.01001806.90.05001806.90.08001806.90.10001806.90.15001806.90.18001806.90.20001806.90.25001806.90.28001806.90.30001806.90.35001806.90.39001806.90.45001806.90.49001806.90.55001806.90.59001806.90.90111806.90.90191806.90.9090
3113401 Total, nonchocolate confectionery products....................................... 1704.90.3000 1704.90.3520 1704.90.7000 1704.90.3550
1704.90.35902106.90.9985
3113404 Chewing gum, sugar and nonsugar..................................................... 1704.10.0000 1704.10.0000 3113201241 Cocoa butter......................................................................................... 1804.00.0000 1804.00.0000
31132014A1, Chocolate coatings (blocks, wafers, liquid) and compound 15C1 coatings (blocks, wafers, liquid)......................................................... 1806.20.6000 1806.20.6000
1803.10.00001803.20.00001805.00.00001806.10.05001806.10.10001806.10.15001806.10.22001806.10.24001806.10.28001806.10.34001806.10.3800
Page 1
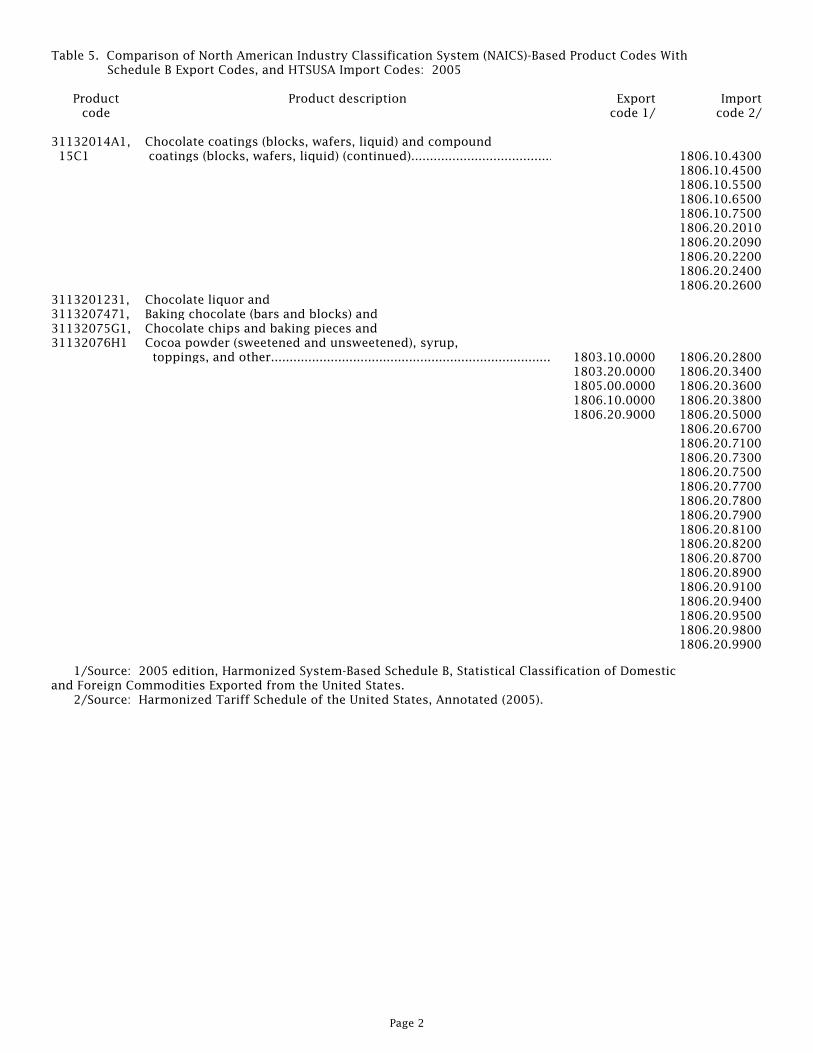
Table 5. Comparison of North American Industry Classification System (NAICS)-Based Product Codes With Schedule B Export Codes, and HTSUSA Import Codes: 2005
Product Product description Export Importcode code 1/ code 2/
31132014A1, Chocolate coatings (blocks, wafers, liquid) and compound 15C1 coatings (blocks, wafers, liquid) (continued)...................................... 1806.10.4300
1806.10.45001806.10.55001806.10.65001806.10.75001806.20.20101806.20.20901806.20.22001806.20.24001806.20.2600
3113201231, Chocolate liquor and3113207471, Baking chocolate (bars and blocks) and31132075G1, Chocolate chips and baking pieces and31132076H1 Cocoa powder (sweetened and unsweetened), syrup,
toppings, and other........................................................................... 1803.10.0000 1806.20.28001803.20.0000 1806.20.34001805.00.0000 1806.20.36001806.10.0000 1806.20.38001806.20.9000 1806.20.5000
1806.20.67001806.20.71001806.20.73001806.20.75001806.20.77001806.20.78001806.20.79001806.20.81001806.20.82001806.20.87001806.20.89001806.20.91001806.20.94001806.20.95001806.20.98001806.20.9900
1/Source: 2005 edition, Harmonized System-Based Schedule B, Statistical Classification of Domesticand Foreign Commodities Exported from the United States. 2/Source: Harmonized Tariff Schedule of the United States, Annotated (2005).
Page 2
Current Industrial Reports A-1
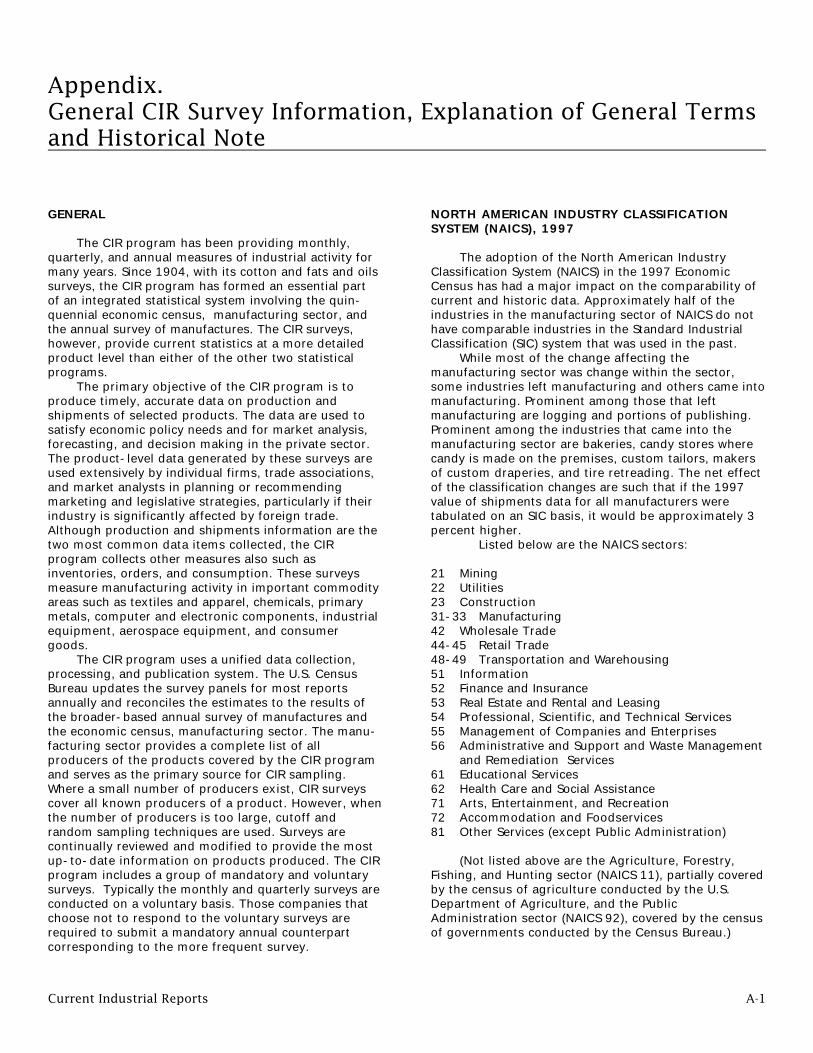
Appendix. General CIR Survey Information, Explanation of General Termsand Historical Note
GENERAL
The CIR program has been providing monthly,quarterly, and annual measures of industrial activity formany years. Since 1904, with its cotton and fats and oilssurveys, the CIR program has formed an essential partof an integrated statistical system involving the quin-quennial economic census, manufacturing sector, andthe annual survey of manufactures. The CIR surveys,however, provide current statistics at a more detailedproduct level than either of the other two statisticalprograms.
The primary objective of the CIR program is toproduce timely, accurate data on production andshipments of selected products. The data are used tosatisfy economic policy needs and for market analysis,forecasting, and decision making in the private sector.The product-level data generated by these surveys areused extensively by individual firms, trade associations,and market analysts in planning or recommendingmarketing and legislative strategies, particularly if theirindustry is significantly affected by foreign trade.Although production and shipments information are thetwo most common data items collected, the CIRprogram collects other measures also such asinventories, orders, and consumption. These surveysmeasure manufacturing activity in important commodityareas such as textiles and apparel, chemicals, primarymetals, computer and electronic components, industrialequipment, aerospace equipment, and consumergoods.
The CIR program uses a unified data collection,processing, and publication system. The U.S. CensusBureau updates the survey panels for most reportsannually and reconciles the estimates to the results ofthe broader-based annual survey of manufactures andthe economic census, manufacturing sector. The manu-facturing sector provides a complete list of allproducers of the products covered by the CIR programand serves as the primary source for CIR sampling.Where a small number of producers exist, CIR surveyscover all known producers of a product. However, whenthe number of producers is too large, cutoff andrandom sampling techniques are used. Surveys arecontinually reviewed and modified to provide the mostup-to-date information on products produced. The CIRprogram includes a group of mandatory and voluntarysurveys. Typically the monthly and quarterly surveys areconducted on a voluntary basis. Those companies thatchoose not to respond to the voluntary surveys arerequired to submit a mandatory annual counterpartcorresponding to the more frequent survey.
NORTH AMERICAN INDUSTRY CLASSIFICATIONSYSTEM (NAICS), 1997
The adoption of the North American IndustryClassification System (NAICS) in the 1997 EconomicCensus has had a major impact on the comparability ofcurrent and historic data. Approximately half of theindustries in the manufacturing sector of NAICS do nothave comparable industries in the Standard IndustrialClassification (SIC) system that was used in the past.
While most of the change affecting themanufacturing sector was change within the sector,some industries left manufacturing and others came intomanufacturing. Prominent among those that leftmanufacturing are logging and portions of publishing.Prominent among the industries that came into themanufacturing sector are bakeries, candy stores wherecandy is made on the premises, custom tailors, makersof custom draperies, and tire retreading. The net effectof the classification changes are such that if the 1997value of shipments data for all manufacturers weretabulated on an SIC basis, it would be approximately 3percent higher.
Listed below are the NAICS sectors:
21 Mining22 Utilities23 Construction31-33 Manufacturing42 Wholesale Trade44-45 Retail Trade48-49 Transportation and Warehousing51 Information52 Finance and Insurance53 Real Estate and Rental and Leasing54 Professional, Scientific, and Technical Services55 Management of Companies and Enterprises56 Administrative and Support and Waste Management
and Remediation Services61 Educational Services62 Health Care and Social Assistance71 Arts, Entertainment, and Recreation72 Accommodation and Foodservices81 Other Services (except Public Administration)
(Not listed above are the Agriculture, Forestry,Fishing, and Hunting sector (NAICS 11), partially coveredby the census of agriculture conducted by the U.S.Department of Agriculture, and the PublicAdministration sector (NAICS 92), covered by the censusof governments conducted by the Census Bureau.)
Current Industrial Reports A-2
The 20 NAICS sectors are subdivided into 96subsectors (three-digit codes), 313 industry groups(four-digit codes), and, as implemented in the UnitedStates, 1170 industries (five- and six-digit codes).
FUNDING
The Census Bureau funds most of the surveys.However, a number of surveys are paid for either fullyor partially by other Federal Government agencies orprivate trade associations. A few surveys are mandated,but all are authorized by Title 13 of the United StatesCode.
RELIABILITY OF DATA
Survey error may result from several sourcesincluding the inability to obtain information about allcases in the survey, response errors, definitionaldifficulties, differences in the interpretation ofquestions, mistakes in recording or coding the reporteddata, and other errors of collection, response,coverage, and estimation. These nonsampling errorsalso occur in complete censuses. Although no directmeasurement of the biases due to these nonsamplingerrors has been obtained, precautionary steps weretaken in all phases of the collection, processing, andtabulation of the data in an effort to minimize theirinfluence.
A major source of bias in the published estimates isthe imputing of data for nonrespondents, for latereporters, and for data that fail logic edits. Missingfigures are imputed based on period-to-periodmovements shown by reporting firms. A figure isconsidered to be an impute if the value was not directlyreported on the questionnaire, directly derived fromother reported items, directly available fromsupplemental sources, or obtained from the respondentduring the analytical review phase. Imputation generallyis limited to a maximum of 10 percent for any one datacell. Figures with imputation rates greater than 10percent are suppressed or footnoted. The imputationrate is not an explicit indicator of the potential error inpublished figures due to nonresponse, because theactual yearly movements for nonrespondents may ormay not closely agree with the imputed movements.The range of difference between the actual andimputed figures is assumed to be small. The degree ofuncertainty regarding the accuracy of the publisheddata increases as the percentage of imputationincreases. Figures with imputation rates above 10percent should be used with caution.
DATA REVISIONS
Statistics for previous years may be revised as theresult of corrected figures from respondents, latereports for which imputations were originally made, orother corrections. Data that have been revised by morethan 5percent from previously published data areindicated by footnotes.
DISCLOSURE
The Census Bureau collects the CIR data under theauthority of Title 13, United States Code, whichspecifies that the information can only be used forstatistical purposes and cannot be published or releasedin any manner that would identify a person, household,or establishment. "D" indicates that data in the cell havebeen suppressed to avoid disclosure of informationpertaining to individual companies.
EXPLANATION OF GENERAL TERMS
Capacity. The maximum quantity of a product that canbe produced in a plant in 1 day if operating for 24hours. Includes the capacity of idle plants until the plantis reported to be destroyed, dismantled, or abandoned.
Consumption. Materials used in producing orprocessing a product or otherwise removing theproduct from the inventory.
Exports. Includes all types of products shipped toforeign countries, or to agents or exporters forreshipment to foreign countries.
Gross shipments. The quantity or value of physicalshipments from domestic establishments of all productssold, transferred to other establishments of the samecompany, or shipped on consignment, whether fordomestic or export sale or use. Shipments of productspurchased for resale are omitted. Shipments ofproducts made under toll arrangements are included.
Interplant transfers. Shipments to other domesticplants within a company for further assembly,fabrication, or manufacture.
Inventories. The quantity or value of finished goods,work in progress, and materials on hand.
Machinery in place. The number of machines of aparticular type in place as of a particular date whetherthe machinery was used for production, prototype, orsampling, or was idle. Machinery in place includes allmachinery set up in operating positions.
Net receipts. Derived by subtracting the materials heldat the end of the previous month from the sum ofmaterials used during the current month.
Production. The total volume of products produced,including: products sold; products transferred or addedto inventory after adjustments for breakage, shrinkage,and obsolescence, plus any other inventory adjustment;and products that undergo further manufacture at thesame establishment.
Quantities produced and consumed. Quantities ofeach type of product produced by a company forinternal consumption within that same company.
Current Industrial Reports A-3
Quantity and value of new orders. The sales valueof orders received during the current reporting periodfor products and services to be delivered immediatelyor at some future date. Also represents the net salesvalue of contract change documents that increase ordecrease the sales value of the orders to which they are related, when the parties concerned are in substantialagreement as to the amount involved. Included asorders are only those that are supported by bindinglegal documents such as signed contracts or lettercontracts.
Quantity and value of shipments. The figures onquantity and value of shipments represent physicalshipments of all products sold, transferred to otherestablishments of the same company, or shipped onconsignment, whether for domestic or export sale. Thevalue represents the net sales price, f.o.b. plant, to thecustomer or branch to which the products are shipped,net of discounts, allowances, freight charges, andreturns. Shipments to a company's own branches areassigned the same value as comparable appropriateallocation of company overhead and profit. Productsbought and resold without further manufacture areexcluded.
Stocks. Total quantity of ending finished inventory.
Unfilled orders (backlog). Calculated by adding netnew orders and subtracting net sales from the backlogat the end of the preceding year.
HISTORICAL NOTE
Data on confectionery products have beencollected by the Census Bureau since1926. In 1989,data tables showing the quantity and value of shipmentsof chocolate and nonchocolate-type confectionery, bytype of product and package, were discontinued. Alsodiscontinued in 1989 were data showing the sales andresales of confectionery by type of customer.
Starting with the 1990 report, data showing thequantity and value of shipments by type of product ofother chocolate products (nonconfectionery) wereadded. Starting with the 1993 report, data for chewinggum were added. Historical data may be obtained from CurrentIndustrial Reports (called Facts for Industry before 1959)available at your local Federal Depository Library.