compendium of practices in climate-smart agriculture and
TRANSCRIPT

GGGICompendium of Practices in Climate-Smart Agriculture and Solar Irrigation


Compendium of Practices in Climate-Smart Agriculture and Solar Irrigation
i
Acknowledgements
Copyright © March 2021
The Global Green Growth Institute 19F Jeongdong Building, 21-15, Jeongdong-gil Jung-gu, Seoul, Korea 100-784
The Global Green Growth Institute does not make any warranty, either express or implied, or assumes any legal liability or responsibility for the accuracy, completeness, or any third party’s use or the results of such use of any information, apparatus, product, or process disclosed of the information contained herein or represents that its use would not infringe privately owned rights.
Editor: Nargiza Nizamedinkhodjayeva
Reviewers: Romain Brille, Malle Fofana, Juhern Kim, Frank Rijsberman, and Hee Kyung Son
Layout Designer: Serena Spurgeon

Compendium of Practices in Climate-Smart Agriculture and Solar Irrigation
Table of Contents
ii
Acknowledgements i
Abbreviation and Acronyms vi
Introduction 1
Background 1
Module 1. What is climate-smart agriculture and why do we need it? 2
1.0 What is climate-smart agriculture? 2
1.1 What happens if our agriculture is not climate-smart? 3
1.2 Climate-smart agriculture is about scale 4
Module 2. Climate-smart agriculture techniques, practices and technologies 5
2.0 Landscape approach 5
2.1 Agroforestry 7
2.2 Water Management 13
2.3 Ecosystem approach to fisheries and aquaculture 15
2.4 Soil management practices 15
2.4.0 Intercropping 15
2.4.1 Crop rotation 16
2.4.2 Fallow management 17
2.4.3 Conservation, zero and minimum tillage 18
2.5 Contour farming and terrace farming 22
2.6 Cross-slope barriers 22
2.7 Vertical farming 30
2.8 Integrated food-energy systems (IFES) 32
2.9 Adjustment of crop variety 34
2.10 Nutrient management 34
2.11 Livestock and grasslands management 37
2.12 Breeding for climate change 40
Module 3. Solar-powered irrigation system (SPIS) 43
3.0 Brief Overview 43
3.1 Economic viability of solar-powered irrigation 46
3.2 Challenges with solar irrigation 47
3.3 Current trends 50
3.4 Future trends 51

Compendium of Practices in Climate-Smart Agriculture and Solar Irrigation
Module 4. Modeling solutions 57
4.0 Agricultural Production Systems sIMulator (APSIM) and Crop Ecological Requirements Database 57
4.1 Flood and drought prediction models 59
4.2 Africa Soil Information Service (AfSIS) 59
4.3 FAO databases and software for sustainable food production 62
4.4 Agricultural Market Information System (AMIS) 65
Module 5. Low emissions development tools 66
Module 6. CSA gender and youth aspects 72
Module 7. Value chains 78
7.1 Key Findings 79
7.2 Priority Actions 81
Module 8. Financing CSA 83
8.0 Access to market 83
8.1 Financial requirements and costs of adapting CSA technologies 83
8.2 Climate finance for agriculture and livelihoods 84
8.3 Insurance mechanisms 84
Module 9. CSA Institutions 86
9.0 Nationally Appropriate Mitigation Actions (NAMA) 86
9.1 Need for a systemic approach for CSA 87
9.2 Good governance 88
9.3 Making CSA work for the poor 89
9.4 How to overcome CSA challenges? 91
9.4 Risk management and good practice 91
Module 10. CSA logframe 96
10.1 Example of a CSA logframe: CCAFS–CGIAR activities, 2012–2015 96
iii

Compendium of Practices in Climate-Smart Agriculture and Solar Irrigation
iv
List of case studies
Case study 2.0.1 Landscape approach in Ethiopia 6Case study 2.0.2 Colombian hillsides 6Case study 2.0.3 Landscape approach in Rwanda 6Case study 2.2.1 Simple and low-cost drip irrigation system 14Case study 2.3.1 Ecosystem approach to fisheries and aquaculture in Nicaragua: lessons learned 15Case study 2.4.1 Fallow management in Southeast Asia 17Case Study 2.4.2 Solutions in fallow management, Vietnam 18Case Study 2.4.3 Benefits of zero tillage in rainfed farming 21Case study 2.5.1 Contour plowing and terraces (CTCN, 2014) 22Case study 2.7.1 How is it implemented? 31Case study 2.10.1 Micro-dosing as a pathway to Africa’s Green Revolution 35Case study 2.11.1 Integration of fodder shrubs and cactus in the feeding of small ruminants in the arid zones of North Africa 38Case study 2.11.2 Feeding strategies for sustainable cattle production, Swaziland 38Case study 2.12.1 Breeding for adaptation to drought and heat in cowpea 41Case study 2.12.2 Yield and water use of irrigated tropical aerobic rice systems in the Philippines 41Case study 2.12.3 Participatory on-farm evaluation of the performance of drought-tolerant maizevarieties in the guinea savannas of Nigeria 42Case study 3.1 Solar irrigation in Morocco for mitigating climate change 52Case study 3.2 Women farmers benefit from SPIS 53Case Study 3.3 Solar panel arrays to offer solution to volatile energy prices in California 54Case study 3.4 Smallholders in Kenya 54Case study 3.5 Groundwater governance in Mexico 55Case study 6.1 Mesoamerican Agro-enviromental Program (MAP) for gender integrationinto climate-smart agriculture 73Case study 6.2 Engaging youth in climate-smart agriculture in Sub-Saharan Africa 77Case study 7.1 Climate risk profiles approach 78Case study 7.2 Climate-resilient coffee value chains in Uganda 79Case study 8.1 Climate finance: lessons learned from western Kenya 85Case study 9.1 Conservation agriculture in Indonesia, Ethiopia, Tunisia, Spain and Boliviabetween 1960 and 2010 88Case study 9.2 Innovation and food security 90Case study 9.3 Farmer climate coping strategies 91
List of figuresFigure 1.1 Effects of global warming on agriculture 3Figure 2.1 The extent of agroforestry 8Figure 2.2 Ecological aquaculture 15Figure 2.3 Benefits of crop rotation 16Figure 2.4 Soil loss and water run-off: conventional, no-till and double-crop no-till compared 21Figure 2.5 Cross-slope barriers benefits in carbon and yield 24Figure 2.6 Phosphate management 37Figure 2.7 Flood and drought prediction model 59Figure 2.8 AfSIS 61Figure 2.9 Good governance 88

Compendium of Practices in Climate-Smart Agriculture and Solar Irrigation
v
List of picturesPicture 2.1 Major ways in which trees and forest resources impact smallholder livelihoods 7Picture 2.2 Cheap and expensive drip irrigation 14Picture 2.3 Contour farming 22Picture 2.4 Cut-and-carry forage systems 38Picture 9.1 Vision for farmer-centric accounting system for smallholders in developing countries 90
List of tablesTable 2.1.1 Multiple benefits of agroforestry 7Table 2.1.2 Common agroforestry (AF) practices 9Table 2.6.1 Benefits of cross-slope barriers 23Table 2.6.2 Cross-slope barriers: climate-change mitigation potential 24Table 2.6.3 Cross-slope barriers: climate-change adaptation potential 25Table 2.6.4 Practice of cross-slope barriers 25Table 2.6.5 Considerations for establishment of cross-slope barriers 26Table 2.6.6 Specifics of cross-slope barriers 27Table 2.6.7 Cross-slope barriers: constraints and solutions 28Table 2.6.8 Establishment and maintenance costs 29Table 2.6.9 Production benefits 29Table 3.1 Advantages of solar-powered irrigation 44Table 3.2 Disadvantages of solar-powered irrigation 45Table 3.3 Advantages and disadvantages of solar-powered and diesel-driven systems 46Table 4.1 FAO databases 62Table 6.1 Strengths and weaknesses of MAP-Norway outcome indicators and adjustments proposed 74Table 6.2 MAP-Norway quantitative gender indicators 76Table 9.1 How to use SHARED 93Table 9.2 Effective use of SHARED 95
List of toolsTool 2.1 Agroforestry Species Switchboard (Agroforestry Switchboard) 9Tool 5.0 The Agro-Chain Greenhouse Gas Emissions (ACGE) 66Tool 5.1 Global Yield Gap Atlas (GYGA) 66Tool 5.2 Samples: Standard assessment of agricultural mitigation potential and livelihoods 67Tool 5.3 GHG mitigation in rice information kiosk 67Tool 5.4 MRV platform for agriculture 67Tool 5.5 CSA guide 68Tool 5.6 Smallholder agriculture monitoring and baseline assessment tool 69Tool 5.7 CCAFS-MOT: a mitigation options tool for agriculture 69Tool 5.8 Climate-smart agriculture rapid appraisal (CSA-RA) prioritization tool 69Tool 5.9 Climate-smart agriculture prioritization framework 70Tool 5.10 The ex-ante carbon-balance tool 71Tool 9.1 Stakeholder Approach to Risk Informed & Evidence Based Decision Making (SHARED Decision Hub) 92

Compendium of Practices in Climate-Smart Agriculture and Solar Irrigation
Abbreviations and Acronyms
ACGE Agro-Chain Greenhouse Gas Emissions
AfSIS Africa Soil Information Service
AMIS Agricultural Market Information System
APSIM Agricultural Production Systems sIMulator
BMZ the Government of Germany
CAM Crassulacean acid metabolism
CSA Climate-smart agriculture
CCAFS CGIAR Research Program on Climate Change, Agriculture and Food Security
CGIAR Consultative Group for International Agricultural Research
CIAT International Center for Tropical Agriculture
GIDMaPS Global integrated drought monitoring and prediction system
CIESIN Center for International Earth Science Information Network
CIMMYT International Maize and Wheat Improvement Center
COP Conference of Parties under UNFCCC
CTCN Climate Technology Center and Network
EAFA Ecosystem Approach to Fisheries and Aquaculture
ECOCROP Crop Ecological Requirements Database
EX-ACT Ex-Ante Carbon-balance Tool
FANRPAN Food Agriculture Natural Resources Policy Analysis Network
FAO Food and Agriculture Organization of the United Nations
GIDMaPS Global integrated drought monitoring and prediction system
GIZ Deutsche Gesellschaft für Internationale Zusammenarbeit GmbH
GRA Global Research Alliance for Agricultural Greenhouse Gases
GYGA Global Yield Gap Atlas
ICRAF World Agroforestry Centre
IFES Integrated Food Energy Systems
IISD International Institute for Sustainable Development
IPCC Intergovernmental Panel on Climate Change
LDSF Land Degradation Surveillance Framework
MAP Mesoamerican Agro-enviromental program
MOT Mitigation Options Tool
MRV Measurement, reporting and verification
NAMA Nationally Appropriate Mitigation Actions
vi

Compendium of Practices in Climate-Smart Agriculture and Solar Irrigation
NDC Nationally Determined Contribution
PAEGC Powering Agriculture: An Energy Grand Challenge for Development
SACC Sustainable Agriculture in a Changing Climate
SHARED Stakeholder Approach to Risk Informed and Evidence Based Decision Making
SIDA the Government of Sweden
SPIS Solar-powered irrigation system
TropAg Tropical Agriculture and Rural Environment Program
UNFCCC United Nations Framework Convention on Climate Change
USAID United States Agency for International Development
Abbreviations and Acronyms (cont.)
vii

1
Compendium of Practices in Climate-Smart Agriculture and Solar Irrigation
Introduction
Background
By the year 2050, the world population will be approximately 9 billion people. This requires an increase in agricultural production of 60% (FAO, 2019). If people do not change the way of production, according to climate change scenarios up to 2099, CO2 concentration will increase from 380 ppm to 730 ppm. This will destruct the ozone layer and increase the atmospheric temperature by 1.8–4.0 °C. The glaciers in poles will further melt, and the sea level will increase by 26–59 cm. As a result, people will have to migrate, and the likelihood of armed conflict will increase (Cicekli and Barlas, 2014).
To ensure future generations live in a better and sustainable world, it is essential that we change our behavior and the way we use and manage our resources today. There is much knowledge about how to grow our food sustainably. However, this knowledge is not used by most agricultural producers, consumers, entrepreneurs, policy-makers, researchers and other stakeholders in most countries in the world.
The Global Green Growth Institute (GGGI) has the ambition to address the imbalance between knowledge and agricultural productivity and bridge the gap between these two areas. This initiative carries broad significance. First, GGGI will be starting a number of climate-smart agriculture and solar irrigation projects around the globe in 2021. Second, this publication serves as a practical guide and useful resource for practitioners, farmers, scientists, and technicians to better understand the initiative undertaken by GGGI. In this compendium, GGGI provides the latest knowledge and capacity building materials on these topics and offers information
on the most relevant topics on technologies related to climate-smart agriculture and solar irrigation – both of which can be used as training materials. The presented information in this compendium is based on the training materials used for capacity building purposes of ICRAF-CGIAR partners between 2014 and 2020.
Overall, the technologies discussed in this compendium explain the general practices and are supported by case studies. Because each context is specific, these technologies need to be adopted within a context, considering its institutional, economic, social and environmental aspects.
The compendium comprises ten modules. Module One provides the key definitions, explains why climate-smart agriculture is important and introduces its main concepts. Module Two provides the review of climate-smart agriculture technologies. Module Three focuses on solar-powered irrigation systems. Thereafter, Module Four introduces modeling solutions. Module Five reviews several low emissions development tools. Module Six covers the gender and youth aspects of climate-smart agriculture. Module Seven provides information on value chains, followed by Module Eight, which focuses on the financial aspects of climate-smart agriculture. Module Nine explains the role of institutions in the adoption of climate-smart agriculture. Module Ten completes the compendium by providing an example of a logical framework (logframe) for climate-smart agriculture. Each module presents a number of case studies that facilitate a discussion on each specific technology or topic.

2
Compendium of Practices in Climate-Smart Agriculture and Solar Irrigation
1.0 What is climate-smart agriculture?
2
Module One provides the key definitions, explains why climate-smart agriculture is important and introduces its main concepts.
Module 1. What is climate-smart agriculture and why do we need it?
The Climate Smart Agriculture (CSA) concept was launched by FAO in 2010 (CSA, FAO, 2010). Climate-smart agriculture, as defined and presented by FAO at the Hague Conference on Agriculture, Food Security and Climate Change in 2010, contributes to the achievement of sustainable development goals. It integrates the three dimensions of sustainable development (economic, social, and environmental) by jointly addressing food security and climate challenges.
How agriculture is done must be changed: from conventional ways to methods that are climate-smart. Currently, agriculture is causing increased conversion of lands and placing greater pressure on biological diversity and natural resource functions than ever before (Intergovernmental Panel on Climate Change (IPCC), 2014). Agriculture contributes:
• 24% of global anthropogenic GHG emissions,
• 50% of global methane emissions from enteric, fermentation and rice paddies,
• 70% of global N20 emissions from artificial fertilizers,
• 5% of global CO2 emissions from fossil fuel consumption and biomass burning.
In total, non-CO2 agricultural emissions are about 6.1 million metric tons of carbon dioxide equivalent per year, which makes about 11% of total global greenhouse gas emissions and 56% of global non-CO2 greenhouse gas emissions.
CSA is an approach that guides the actions needed to transform agricultural systems to effectively support development and ensure food security in a changing climate.
CSA provides the means to help stakeholders at local, national and international levels identify agricultural strategies suitable to their conditions. CSA is one of the 11 Corporate Areas for Resource Mobilization under the FAO’s Strategic Objectives. It is in line with FAO’s vision for Sustainable Food and Agriculture and supports FAO’s goal to make agriculture, forestry and fisheries more productive and more sustainable.
In order to be as effective as possible, a CSA approach should be developed in a context-specific manner, taking into account local climate, environmental, market, economic and cultural conditions (Celeridad, 2018 in FAO, 2019).
Climate-smart agriculture is about mitigation and adaptation strategies. Mitigation strategies refer to the potential for agriculture to mitigate emissions. Adaptation strategies focus on the vulnerability and resilience of agriculture to climate change, with a particular emphasis on productivity as a priority to sustainably produce more food, feed, and fiber to meet the needs of a growing world population. In the absence of adaptation measures, landscape sustainability is more susceptible to the

3
Compendium of Practices in Climate-Smart Agriculture and Solar Irrigation
impacts of climate change. In the presence of adaptation measures, the coping and resilience ranges increase, and the failure range decreases.
Climate-smart agriculture is a way forward for food security in a changing climate. It is an approach that integrates the three dimensions of sustainable development (namely economic, social and environmental) by jointly addressing food security and climate challenges. Food systems have to become more efficient in resource use and more resilient to changes and shocks at every scale from the farm level to the global level (FAO, 2013).
CSA addresses the following issues:
1. Ensuring food security for a growing world population: To feed the growing population, FAO states there is a need to increase agricultural production. Agriculture must therefore transform itself to meet the food demands of population growth. Climate change will make this task more difficult under a business-as-usual scenario because of adverse impacts on agriculture. CSA is takes into account the four dimensions of food security: availability, accessibility, utilization and stability.
2. Climate-change impacts on agriculture and the need for adaptation: To achieve food security, adaptation to climate change and lower emission intensities per output will be necessary. Climate change is already having an impact on agriculture and food production. For example, there has been an increase in the mean temperature, changes in rain patterns, changes in water availability, increases in the frequency and intensity of “extreme events,” a sea level rise, droughts and salinization. The extent of these impacts will depend on their combinations, local conditions and the ability to adapt to a changed environment (e.g., new agricultural varieties and innovative methods for growing food).
3. Deforestation: Agriculture is a major driver of deforestation. This must be changed. New ways of growing food are necessary, such as vertical farming and growing varieties that have greater productivity.
4. Capturing carbon: Agriculture is a key sector that, along with the forestry sector and climate-smart agricultural practices, can lead to biological carbon capture and storage in biomass and soil.
1.1 What happens if our agriculture is not climate-smart?
The way we produce food nowadays is not sustainable. The major climatic changes directly affecting landscape sustainability can be summarized as follows:
1. A rising sea level decreases coastal land. Global mean sea level has risen about 8–9 inches (21–24 centimeters) since 1880, with about a third of the increase occurring in the last two and a half decades. The rising water level is mostly due to a combination of meltwater from glaciers and ice sheets and thermal expansion of seawater as it warms. In 2019, global mean sea level was 3.4 inches (87.61 millimeters) above the 1993 average—the highest annual average in the satellite record (1993–present). From 2018 to 2019, global mean sea level rose 0.24 inches (6.1 millimeters) (Lindsey, 2021).
2. Shifting rainfall patterns will change the growing locations of various crops. Some regions will be better suited for agriculture, while others will experience decreased yields.
3. Shifting temperature ranges will affect changes in the lengths of growing seasons.
Figure 1.1 Effects of global warming on agriculture
Source: CTCN, 2014.

4
Compendium of Practices in Climate-Smart Agriculture and Solar Irrigation
The economic consequences of any yield changes will be influenced by adaptations made by farmers, consumers, government agencies, and other institutions. Farmers may adapt by changing planting dates; substituting cultivars or crops; changing irrigation practices; and changing land allocations to crop production, pasture and other uses. Consumers may adapt by substituting relatively low-priced products for those that become relatively high priced as a result of the effects of climate change. Inclusion of such adaptive responses is critical to a valid assessment, given that these responses result in less adverse effects than if such responses are excluded, and in some studies even reverse the direction of the net economic effect (from negative to positive).
There is a need for new agricultural production systems that enhance food security, on the one hand, as well as mitigate climate change and preserve the natural resource base and vital ecosystem services, on the other hand. More productive and more resilient agriculture requires a major shift in the way land, water, soil nutrients and genetic resources are managed to ensure that these resources are used more efficiently.
Resilience is the capacity of systems, communities, households or individuals to prevent, mitigate or cope with risk and recover from shocks. A system is resilient when it is less vulnerable to shocks across time and can recover from them. Essential to resilience is adaptive capacity. Adaptive capacity encompasses two dimensions: recovery from shocks and response to changes in order to ensure the flexibility of the system.
1.2 Climate-smart agriculture is about scale
Climate-smart agriculture can have very different meanings depending upon the scale at which it is being applied. For example, at the local scale, it may provide opportunities for higher production through improved management techniques, such as more targeted use of fertilizers. At the national scale, it could mean providing a framework that incentivizes sustainable management practices. And at the global scale, it could equate to setting rules for the global trade of biofuels.
It is not clear how actions at one scale may affect the others. For smallholder farmers in developing countries, the opportunities for greater food security and increased income, together with greater resilience, will be more important to adopting climate-smart agriculture than mitigation opportunities. For intensive mechanized agricultural operations, the opportunities to reduce emissions will be of greater interest.
CSA scaling up: bottom line
• Scaling up of climate-smart agriculture needs a well-structured deliberate effort, covering bio-physical, socio-economic, cultural, and institutional aspects of each specific context.
• Scaling up protocol cannot be prescriptive and shall have enough room to suit specifications.
• Scaling up needs robust “technologies” (concepts, frameworks, techniques, models, technologies) and stakeholder participation.
The main effects of global warming on landscape sustainability are:
• Loss of biodiversity in fragile environments,
• Loss of fertile coastal lands caused by rising sea levels,
• Increased frequency of weather extremes,
• Longer growing seasons in cool areas,
• Increase in incidence of pests and vector-borne diseases,
• More unpredictable farming conditions in tropical areas,
• Dramatic changes in distribution and quantities of fish and sea foods,
• Certain changes in agricultural yields.
Overall, climate-smart agriculture is inclusive, productive and resilient and has low carbon emissions (Neufeldt et al., 2011).

5
Compendium of Practices in Climate-Smart Agriculture and Solar Irrigation
This module introduces the key techniques, practices, and technologies of climate-smart agriculture.
Module 2. Climate-smart agriculture techniques, practices and technologies
A landscape approach “refers to a set of concepts, tools, methods and approaches deployed in landscapes to achieve multiple economic, social, environmental objectives (multifunctionality) through processes that recognize, reconcile and synergize interests, attitudes and actions of multiple actors” (Minang et al., 2015, p.8).
A landscape approach means taking both a geographical and socio-economic approach to managing the land, water, and forest resources for meeting the goals of food security and sustainable inclusive green growth.
The landscape approach is a participatory and people-centered approach (FAO, 2013). It builds on the principles of natural resource management systems that recognize the value of ecosystem services to multiple stakeholders. The approach includes societal concerns related to conservation and development trade-offs. It also focuses on poverty alleviation, agricultural production, and food security. Overall, the approach places emphasis on adaptive management, stakeholder involvement, and
2.0 Landscape approach
the simultaneous achievement of multiple objectives (Sunderland, 2012 in FAO, 2013).
The principles that underpin the landscape approach provide guidance on how to pursue different land-use objectives and livelihood strategies (MEA, 2005 in FAO, 2013). More specifically, the integrated landscape management is based on (FAO, 2013):
• Alignment of sectoral policies and their coordinated implementation,
• Adoption of participatory and people-centered approaches and management structures,
• Adequate governance structures and market environment,
• Improved knowledge management,
• Context specificity.
The landscape approach plays an important role in transitioning to CSA. It is an integrated approach that aims for the sustainable management of natural and human-maintained processes in the landscape. Instead of separate and often counterproductive management of various sectors, it calls for the alignment of sectoral policies and their coordinated implementation. Adoption of participatory and people-centered approaches and management structures contributes to improving the resilience of the agro-ecosystem and the livelihoods of the people who depend on it.
Scaling up the landscape approach requires an enabling policy and market environment, adequate governance structures, improved knowledge management and adequate institutional capacity. Different landscapes require different approaches that will depend on the state and nature of the resources, current land-use dynamics, and social and economic conditions (FAO, 2013).

6
Compendium of Practices in Climate-Smart Agriculture and Solar Irrigation
In Ethiopia, in Great Rift Valley, the landscape approach has included establishing forest cooperatives that sustainably manage and reforest the surrounding land using the Farmer-Managed Natural Forest Regeneration technique, thus addressing deforestation that threatens groundwater reserves that provide 65,000 people with potable water (FAO, 2013).
Case study 2.0.1 Landscape approach in Ethiopia
On Colombian hillsides, the landscape approach involved integrating livestock, trees, and a range of crops, depending on the slope of the land and the direction of the streams, to increase incomes while conserving the landscape (FAO, 2013).
Case study 2.0.2 Colombian hillsides
In Rwanda, a landscape approach included providing infrastructure for land husbandry (e.g., terracing,), water harvesting (e.g., valley dams and reservoirs) and hillside irrigation (e.g., piping water distribution and furrow irrigation). In addition, the project provided training for farmers, supported farmer organizations, and enhanced marketing and financing (FAO, 2013).
Case study 2.0.3 Landscape approach in Rwanda

7
Compendium of Practices in Climate-Smart Agriculture and Solar Irrigation
2.1 Agroforestry FAO defines agroforestry (AF) as “a collective name for land-use systems and technologies where woody perennials (e.g., trees, shrubs, palms and bamboos) are deliberately used on the same land-management units as agricultural crops and/or animals, in some form of spatial arrangement or temporal sequence” (FAO, 2017).
World Agroforestry (ICRAF) defines agroforestry as “a farming system that integrates crops and livestock with trees and shrubs.” The resulting biological interactions provide multiple benefits, including diversified income sources, increased biological production, better water quality, and improved habitat for both humans and wildlife. Farmers adopt agroforestry practices for two main reasons. First, they want to increase their economic stability; second, they want to improve the management
Table 2.1.1 Multiple benefits of agroforestry
Environmental Economic Agricultural Social Other
Increased carbon stock
Higher income due to provision of non-wood products and timber
Soil fertility; controlling soil erosion,
Gender equality, e.g. due to income opportunity for women to sell fruits
Air quality
Climate adaptation Reduced vulnerability
Trees in agroforestry practices catch, store and release water
Food security Shade
Climate change mitigation
Increased productivity
Increased nitrogen inputs due to nitrogen fixing trees
Aesthetic value
Source: Kiptot and Franzel, 2011; Murthy et al., 2013; FAO, 2017.
of natural resources under their care” (Mutua et al., 2014).
Agroforestry brings a number of benefits in terms of soil carbon. There are wide variations in CO2 storage from agroforestry depending on tree species, their age and climate. In general, the average carbon sequestered by AF practices has been 9, 21, 50 and 63 MgCha-1 in semiarid, sub-humid, humid, and temperate regions, respectively. In tropics, for small agroforestry systems, it has ranged from 1.5 to 3.5 MgCha-1yr-1. In degraded soils of the sub-humid tropics, agroforestry practices have been found to increase top soil carbon stocks up to 1.6MgCha-1yr-1 (Murthy et al., 2013). On average, the estimated potential of agroforestry to sequester carbon is 1-14 Gt CO2 per year (Hoff, 2017).
Overall, agroforestry systems have a number of environmental, economic, agricultural, social, and other benefits (table 2.1.1, picture 2.1).
Picture 2.1 Major ways in which trees and forest resources impact smallholder livelihoods
Source: Presentation on Fergus Sinclair (ICRAF), December 2018.

8
Compendium of Practices in Climate-Smart Agriculture and Solar Irrigation
Various agroforestry systems can be practiced in diverse ecological conditions, especially in humid tropics (Murthy et al., 2013). Millions of farmers practice agroforestry in East Africa. Globally, agroforestry is practiced in over 1 billion hectares in developing countries, and to a lesser extent in industrialized countries (Nair et al., 2010; Cole, 2018; figure 2.1). The main incentive for farmers to practice agroforestry is the increased income and improved nutrition. For example, agroforestry approaches in Niger, implemented on 5 million ha of land, resulted in a 15–30% crop yield increase as well as improved nutrition and income.
Agroforestry systems are diverse. There are three main types of agroforestry systems (FAO, 2017):
• Agrisilvicultural systems are a combination of crops and trees, such as alley cropping or home gardens.
Figure 2.1 The extent of agroforestry
• Silvopastoral systems combine forestry and grazing of domesticated animals on pastures, rangelands or on-farm.
• The three elements, namely trees, animals and crops, can be integrated in what are called agrosylvopastoral systems and are illustrated by home gardens involving animals as well as scattered trees on croplands used for grazing after harvests.
According to Current et al. (1995), to promote agroforestry, there is a need for:
• Knowledge dissemination (e.g., which trees, how to grow them),
• Access to resources and financial incentives,
• Economic profitability (short-term and long-term).
Source: Zomer et al., 2016, presentation by Fergus Sinclair (ICRAF), December 2018.

9
Compendium of Practices in Climate-Smart Agriculture and Solar Irrigation
Table 2.1.2 Common agroforestry (AF) practices
Practice Description
Home/kitchen gardens These are trees planted on home compound or near homesteads. They pro-vide shade, shelter, fruits, fodder, beauty and other products. These include ornamentals (Ficus benjamina, Terminalia mentally, Araucaria angustifolia, Cupressus pyramindansis, Ashok), fruit trees (mangoes (Mangifera indica), avocado (Persea americana), cashewnuts (Anacardium occidentale), citrus (Citrus spp), macadamia (Macadamia tetraphylla), jackfruit, mulberry, paw-paws) and high value medicinal trees (Neem, Albizia coriara, Moringa oleif-era).
Woodlots These are trees often planted on the less fertile portion of the farm for fire-wood and timber production: Grevillea robusta, Markhamia lutea, Casuari-na equissetifolia, Melia volkensii, Prunus africana, Gmelina alborea and Ter-minalia brownie.
Improved fallows and rota-tional fallows
Tree species for improved fallows include Gliricidia sepium, Tephrosia vo-gelii, Tephrosia candida, Calliandra calothyrsus, Leucaena trichandria, Ses-bania sesban.
Trees dispersed on cropland In this case, multipurpose trees are scattered haphazardly or according to some systematic patterns in the field. Some of the tree species for this technology include Faidherbia albida, Tamarindus indica, Melia volkensii and Acacia spp.
Boundary planting, shelter belts and life fences
These comprise trees and shrubs planted along and around the farm for protective purposes or boundary marking. Some of the tree species for this technology include Hekea saligna, Markhamia lutea, Melia azadirach, Acacia sps, Jatropha curcas, Croton megalocarpus and Pithlobium dulce.
Hedgerow planting This entails growing of food crops between hedgerows of planted shrubs and trees preferably leguminous or fertilizer and fodder trees to fix nitrogen. Some of the species for this technology include Gliricidia sepium, Calliandra calothyrsus and Leucaena spp.
Source: see more in Mutua et al., 2014.
on trees and tree-based development activities, such as agroforestry planting and wider restoration initiatives. Version 1.4 of the switchboard documents the presence of a total of 30,542 plant species (38,466 species including synonyms) across 30 web-based information sources. When available, hyperlinks to selected species in particular information sources are provided. In total, Version 1.4 of the switchboard provides 240,157 hyperlinks at the species level. The switchboard also provides links to check on the correct spelling of particular species and on
The Agroforestry Species Switchboard is a “one-stop-shop” to retrieve data about a particular plant species across a wide range of information sources. The tool was developed by World Agroforestry in 2013. Its particular objective is to provide information that supports research
Tool 2.1 Agroforestry Species Switchboard (Agroforestry Switchboard)

10
Compendium of Practices in Climate-Smart Agriculture and Solar Irrigation
synonyms and current names (see databases listed below). Within ICRAF, the switchboard cross-links our various databases by establishing a centralized naming system. A list and brief description of the 30 associated information sources that can be accessed through the switchboard is given below (in order of listing in the Switchboard).
The switchboard includes various databases developed by ICRAF that can also qualify as restoration tools: see http://www.worldagroforestry.org/output/agroforestry-species-switchboard-14 under the heading of “ICRAF databases, with links to individual species.” Particularly relevant are the Agroforestree database and the RELMA-ICRAF Useful Tree Species manuals.
The objective of the tool is to address biophysical and economic aspects of land restoration as the toolkit provides ecosystem services, including provisioning.
The particular strength of the switchboard is that rather than updating hyperlinks for further information about a particular species in the various species selection tools, the switchboard is a centralized system to provide users with information from a wide range of species. The tool can be used at each step of land restoration, including forested landscape, agriculture and agroforestry (various tools provide assemblages of suitable useful tree species). Furthermore, the tool can be used at a global scale. The switchboard includes all plant species listed in web-based databases, whereas no species are filtered out based on functional type or native ranges.
ICRAF databases referred to by the switchboard, with links to individual species
• African Orphan Crops Consortium (AOCC; http://africanorphancrops.org; August 2018). AOCC’s goal is to sequence, assemble, annotate and publish in open-access databases the genomes of 101 traditional African food crops to support improvements in their production, through linking with plant breeders. This will help provide long-lasting solutions for Africa’s nutritional security.
• African Wood Density Database (http://worldagroforestry.org/treesnmarkets/wood/data.php?id=1). This database provides air-dry wood density data for over 900 indigenous and exotic tree species found in Africa. It was developed in parallel with the Global Wood Density Database (see below).
• Agroforestree Database (http://www.worldagroforestry.org/output/agroforestree-database). This database provides information on the management, use and ecology of over 600 tree species which can be used in agroforestry systems globally. It is a good starting point for understanding more about many cultivated trees in smallholders’ farms.
• Árboles de Centroamérica (OFI-CATIE; https://www.catie.ac.cr/catie-noticias/759-libro-arboles-de-centroamerica-ahora-en-version-digital.html; July 2018; in Spanish). This sourcebook provides factsheets for 204 indigenous Mesoamerican tree species. It describes species’ biologies and uses across the full spectrum of on-farm planting, ecological restoration and natural regeneration situations.
• CABI Invasive Species Compendium (CABI; http://www.cabi.org/isc; August 2018). This compendium provides information on invasive organisms globally, including uses, means of dispersal, risks, invasiveness impacts and means of control.
• Ecocrop (FAO; http://ecocrop.fao.org/ecocrop/srv/en/home; August 2018). This database provides descriptions, including climate and soil requirements and uses, for more than 2,500 plant species.
• eHALOPH (University of Sussex; https://www.sussex.ac.uk/affiliates/halophytes;July 2018; new database for Switchboard Version 2.0). This database provides descriptions of halophytes (salt tolerant plants), including the 1,554 species that were included in James Aronson’s 1989 publication HALOPH: a data base of salt tolerant plants of the world.
• Especies para restauración (IUCN; https://www.forestalmaderero.com/articulos/item/especies-para-restauracion-uicn.html; August

11
Compendium of Practices in Climate-Smart Agriculture and Solar Irrigation
2018). This database provides factsheets on mostly Mesoamerican plant species with information including botanical and local names, distributions, habitats, and propagation and silvicultural methods, with a view to supporting restoration initiatives.
• EUFORGEN (European Forest Genetic Resources Programme; http://www.euforgen.org/species/; August 2018). For 107 species, the website provides short species descriptions, distribution maps and technical guidelines for genetic conservation and use.
• Feedipedia (INRA, CIRAD, AFZ and FAO; https://www.feedipedia.org/; July 2018; new database for Switchboard Version 2.0). This is an open-access information system on animal feed resources. It provides information on the nature, occurrence, chemical composition, nutritional value and safe use of nearly 1,400 livestock feeds globally.
• Genetic Resources Unit (http://www.worldagroforestry.org/products/grunew/index.php/seeds/searchbyname). This database indicates accessions of trees and shrubs that are conserved and/or supplied for research purposes by ICRAF’s Genetic Resources Unit.
• Global Invasive Species Database (IUCN; http://www.iucngisd.org/gisd/; August 2018). This database was developed and is managed by the Invasive Species Specialist Group of the IUCN Species Survival Commission. It provides information about alien and invasive species, including plants, which negatively impact native biodiversity and natural areas.
• Global Register of Introduced and Invasive Species (IUCN; http://www.griis.org/; March 2019). GRIIS, hosted by the Invasive Species Specialist Group (ISSG), compiles annotated and verified country-wise inventories of introduced and invasive species. Development and population of the GRIIS was undertaken by the ISSG within the framework of activities of the Information Synthesis and Assessment Working Group of the Global Invasive Alien Species Information Partnership. Note that links included in the current version of the
Switchboard only document the presence in the GRIIS of species listed in the other 35 information sources.
• Query World Economic Plants in GRIN-Global (USDA; https://npgsweb.ars-grin.gov/gringlobal/taxon/taxonomysearcheco.aspx; July 2018; new database for Switchboard Version 2.0). Species listed are those that were retrieved by a specialized query on World Economic Plants among the GRIN-Global Taxonomy for Plants.
• NewCROP Database (Purdue University; https://www.hort.purdue.edu/newcrop/; August 2018). The NewCROP (New Crops Resource Online Program) database is an information-rich site related to crop plants that was developed by the Purdue University Center for New Crops and Plant Products.
• New World Fruits Database (Bioversity International; http://nwfdb.bioversityinternational.org/list/; August 2018). This database provides information on fruit and plant uses and distributions and origins for over 1,200 fruit species from North and South America.
• OPTIONs pesticidal plants database (OPTIONs; http://projects.nri.org/options/background/plants-database; August 2018). This database, constructed to optimize the application of predominantly indigenous plants as pesticides in Africa, provides factsheets on use.
• Pacific island agroforestry species (AGROFORESTRY.NET; http://www.agroforestry.net/2014-03-04-10-18-01; August 2018). Species-specific chapters, which can be downloaded individually, of a 2006 publication covering the ecology, economics and culture of Pacific Island agroforestry.
• PROTA4U (PROTA; http://www.prota4u.org/; August 2018) The Plant Resources of the World (PROW) online database provides information on the plant resources of tropical Africa, including uses, botany, ecology, genetic resources and available literature.
• RELMA-ICRAF Useful Trees (http://www.

12
Compendium of Practices in Climate-Smart Agriculture and Solar Irrigation
worldagroforestry.org/usefultrees/index.php). These species-based factsheets provide information on the useful trees and shrubs of Eritrea, Ethiopia, Kenya, Tanzania, Uganda and Zambia, assembled as part of a series of Regional Land Management Unit (RELMA)-ICRAF publications (published first in the 1990s and 2000s). Information on ecology, uses, propagation, management, local names and botanical names is included.
• Seed Leaflets (University of Copenhagen [Forest and Landscape Denmark, formerly the Danida Forest Seed Centre]; http://www.sl.ku.dk/rapporter/seed-leaflets; August 2018). These species-specific leaflets provide short descriptions of tropical trees, with particular emphasis on seed issues, including appropriate methods for seed harvest, treatment, storage and sowing.
• SoFT (CSIRO, CIAT and ILRI; https://blog.ciat.cgiar.org/selection-of-forages-for-the-tropics-the-soft-tool/; August 2018). The Selection of Forages for the Tropics (SoFT) tool provides information on 180 forage species, including plants’ agronomy, feed value, production potential and seed production.
• Tree Functional Attributes and Ecological Database (http://db.worldagroforestry.org). This database provides information on the properties and attributes of trees. It includes information on geographic distributions, ecological requirements, growth rates, uses and product value chains.
• Tree Seed Suppliers Directory (http://www.worldagroforestry.org/output/tree-seed-suppliers-directory). This directory provides the most extensively compiled information on global suppliers of seed and microsymbionts for over 5,000 tree and shrub species.
• The tropiTree Database (JHI and ICRAF; http://ics.hutton.ac.uk/tropiTree; August 2018). The Tropical Tree Expressed Transcripts, SSR Markers and Primer Pairs (tropiTree) Database provides assembled expressed transcripts from an RNA-seq study of a set of 24 important tropical trees, along with markers designed to amplify
microsatellites discovered within sequences.
• USDA Food Composition Databases (USDA; https://ndb.nal.usda.gov; August 2018). These databases provide information on nutrient content (minerals, vitamins, etc.) for more than 8,000 different food items.
• Useful Tree Species for Africa map (produced with the University of Copenhagen [Forest and Landscape Denmark]; http://www.worldagroforestry.org/output/useful-tree-species-africa). This interactive vegetation map tool enables the selection of useful tree species for planting at given locations anywhere in Africa using Google Earth for visualization purposes. The switchboard indicates which species are listed in this tool.
• Useful Tropical Plants Database (http://tropical.theferns.info/; August 2018). This database contains information on edible, medicinal and many other uses of more than 10,000 plants that can be grown in tropical regions.
• Vegetationmap4africa (produced with the University of Copenhagen; http://www.vegetationmap4africa.org/). This map tool shows the distribution of 1,022 plant species across Burundi, Ethiopia, Kenya, Uganda, Rwanda, Tanzania and Zambia using Google Earth, based on a high-resolution potential natural vegetation map of eastern and southern Africa. It can be used to help select tree species for planting at given locations in mapped countries.
• The Wood Database (Eric Meier; http://www.wood-database.com; August 2018). The database provides profiles for a range of several hundred woods used globally, including information on specific gravity, modulus of rupture, shrinkage, grain and workability.

13
Compendium of Practices in Climate-Smart Agriculture and Solar Irrigation
2.2 Water management
2.2.1 Alternate wet and dry irrigation of rice
The Alternate Wet and Dry Irrigation of Rice (AWDI) method of cultivating rice implies that rice fields are not kept continuously submerged but are intermittently dried during the rice growing stage (van der Hoek et al., 2001).
AWDI is very relevant for climate change adaptation and mitigation. Flooded soils such as those for irrigated rice produce methane, a greenhouse gas that plays a significant role in global climate change (Lindau et al., 1993 in van der Hoek et al., 2001). The research done by the International Rice Research Institute (IRRI) and national rice research institutes in China, India, Indonesia, the Philippines, and Thailand concluded that when rice fields are dried, oxygen becomes available in the root zone, and this reduces methane emissions. AWDI is therefore a potential method to reduce methane emissions (Nugroho et al., 1994 in van der Hoek et al., 2001).
For nearly half of the world’s population, rice is the staple food, providing 35–60% of the calories consumed (Guerra et al., 1998 in van der Hoek et al., 2001). Up to 75% of rice is grown in Asia. The problem is that by 2025, the per capita available water resources in Asia are expected to decline by 15–54% compared with 1990. Agriculture’s share of water will decline at an even faster rate because of the increasing competition for available water from urban and industrial sectors. Because these urban and industrial demands are likely to receive priority over irrigation, it becomes essential to develop and adopt strategies and practices that will use water efficiently in irrigation schemes, particularly in parts of Africa, where demand for rice is increasing and water is less abundant than in Asia. AWDI can be a viable solution to this problem.
Producing more rice with less water from irrigated systems could provide opportunities to improve human health as well because drying of rice fields is a good measure against malaria and Japanese encephalitis (Service, 1989 in van der Hoek et al., 2001; WHO, 1983
in van der Hoek et al., 2001; Ault, 1994 in van der Hoek et al., 2001).
There is a great need to increase the productivity of water in rice irrigation systems in a sustainable way. A number of case studies are now being implemented in India, Sri Lanka, China, and Kenya, questioning whether AWDI is a potential method to save water and whether it can contribute to the control of vector-borne diseases. Such dual benefits could be an important reason to recommend AWDI in rice cultivation.
Preconditions
Application
The challenge of using AWDI or any other means of environmental control is to determine if such modified cultural practices can be introduced and accepted by farmers on a large scale, whilst preserving crop yields and maintaining the workload at previous levels. Five criteria have been identified for the effective use of environmental management for vector control. The measures used must be:
• Socially acceptable,
• Cost-effective compared with other feasible methods,
• Economically sustainable by the local community,
• Compatible with local agricultural practices.
In addition to the above general requirements for environmental management, a number of requirements specific to AWDI have also been identified (Amerasinghe, 1987 in van der Hoek et al., 2001): a well-designed irrigation and drainage system that allows for rapid flooding and drying and which is efficient enough to allow for synchronous irrigation and drainage of all fields within the system.
Often, concerns are expressed about the possibility of implementing AWDI because of farmers’ reluctance. However, in China, it has been possible to implement AWDI on a large scale. Volumetric charges for water provided an important incentive for farmers to use less water.

14
Compendium of Practices in Climate-Smart Agriculture and Solar Irrigation
Conclusions
Experiments and field testing of the AWDI method of cultivating rice from different parts of the globe have demonstrated the utility of AWDI for water saving in rice irrigated agriculture. Almost all the experiments indicate that water productivity increases, and that land productivity (yield per unit of land) does not materially differ from continuous flooded irrigation. However, the extent to which these gains can be achieved differ over a wide range. These are mainly due to the method by which these field experiments were conducted, in addition to variables that are critical but that cannot be influenced, such as the rainfall pattern and the soil conditions. Also, experiments and field testing have demonstrated the infrastructural requirements, improved skills and management efforts in effecting water control to achieve the maximum benefits in terms of water saving and increased water productivity. A serious limitation of nearly all studies done to date is that water savings have only been documented at the field level, and not at the irrigation system or river basin levels.
2.2.2 Drip irrigation
Drip irrigation, also known as trickle irrigation, micro irrigation or localized irrigation, is an irrigation method that saves water and fertilizer by allowing water to drip slowly to the roots of plants, either onto the soil surface or directly onto the root zone. It is done through narrow tubes that deliver water directly to the base of the plant. The technology is quite expensive but can be adopted with low-cost technology.
Case study 2.2.1 Simple and low-cost drip irrigation system
It is estimated that more than 90% of the food supply in Ethiopia (Ayana et al., 2005) comes from low productivity rainfed smallholder agriculture. Hence, rainfall or access to irrigation water is the most determinant factor affecting food self-sufficiency at the household level and the national food supply. Not only has limited access to water impeded the productivity of farming systems but an inability to utilize the available water more productively.
In the history of irrigation, the drip irrigation method has proven to be the most efficient technology to help irrigate the plants and not the “soil.” However, the technology in its conventional design is expensive and not affordable for the poor. Raising the productivity of smallholders under Ethiopian conditions requires a new approach to the design of simple and affordable irrigation systems. There is an alternative way to practice drip irrigation using a low-cost bucket or a plastic bottle. It was developed at Arba Minch University and successfully used by farmers. The simplicity and availability of the accessories of the system on the local market with reasonable prices and easy assembly makes it appropriate and affordable for poor farmers. It is also proposed to spread the technology to other parts of the country with the aim to increase smallholder farm productivity and ensure food self-sufficiency at the household level.
Picture 2.2 Cheap and expensive drip irrigation
Cheap drip irrigation Expensive drip irrigation
Source: CTCN, 2014.

15
Compendium of Practices in Climate-Smart Agriculture and Solar Irrigation
2.3 Ecosystem approach to fisheries and aquaculture
The ecosystem approach is an approach that aims at preserving the Earth and its inhabitants from potential harm or permanent damage to the planet itself (FAO, 2013).
• An ecosystem approach to watershed management is needed to address landscape issues, such as sedimentation and pollution from tributaries. This approach must include and integrate fisheries, aquaculture, agriculture and forestry. Fragmentation of institutions has so far been an obstacle. The implementation of an EAFA often opens an opportunity for wider ecosystem approach management in coastal zones and watersheds.
• The social role of fisheries and aquaculture must be recognized, especially considering their role in poverty alleviation and food security. This will become particularly important as the impacts of climate change (e.g., droughts) become more pronounced.
• The involvement of national and local authorities and stakeholders from the beginning is fundamental. Establishing ownership of the process among the stakeholders, building trust among all parties and
Case study 2.3.1 Ecosystem approach to fisheries and aquaculture (EAFA) in Nicaragua: lessons learned
promoting relevant decision-making power at different levels is the best way to move forward in implementing an ecosystem approach to fisheries and aquaculture.
• Better integration is needed between fisheries, environment, agriculture and resource management institutions (FAO, 2013).
• Better integration is needed between fisheries, environment, agriculture and resource management institutions (FAO, 2013).
2.4 Soil management practices
2.4.0 Intercropping
Intercropping is the practice of growing two or more crops on a piece of land. Careful planning is required, taking into account the soil, climate crops and varieties to ensure that crops do not compete with each other for physical space, nutrients, water and sunlight. Examples of intercropping strategies are planting a deep-rooted crop with a shallow-rooted crop or planting a tall crop with a shorter crop that requires partial shade.
Intercropping produces a greater yield on a given piece of land by making use of resources that would otherwise not be utilized by a single crop. Apart from economic benefits, intercropping also brings agronomic benefits.
Moreover, intercropping of compatible plants encourages biodiversity, by providing a habitat for a variety of insects and soil organisms that would not be present in a single-crop environment.
The degree of spatial and temporal overlap in the two crops can vary somewhat, but both types of overlap must be met for a cropping system to be an intercrop. Numerous types of intercropping, all of which vary in temporal and spatial mixture to some degree, have been identified. Some of the more significant types are mixed intercropping, row cropping and relay cropping.
Mixed intercropping, as the name implies, is the most basic form in which the component crops are totally mixed in the available space.
Row cropping involves the component crops arranged in alternate rows. Variations include alley cropping, where crops are grown between rows of trees, and strip cropping, where multiple rows, or a strip, of one crop are alternated with multiple rows of another crop.
Figure 2.2 Ecological Aquaculture
Source: CTCN, 2014.

16
Compendium of Practices in Climate-Smart Agriculture and Solar Irrigation
Intercropping also uses the practice of sowing a fast-growing crop with a slow-growing crop, so that the fast-growing crop is harvested before the slow-growing crop starts to mature. This obviously involves some temporal separation of the two crops.
Further temporal separation is found in relay cropping, where the second crop is sown during the growth of the first crop, often near the onset of reproductive development or fruiting, so that the first crop is harvested to make room for the full development of the second.
Intercropping under scattered trees is is the simplest and most popular form of agroforestry (CTCN, 2014). Among the several types of tropical intercropping systems, some have received more attention than others; examples include intercropping under coconuts and Faidherbia (Acacia) albida. The traditional intercropping systems consist of growing agricultural crops under scattered or systematically planted trees on farmlands; the former being far more extensive and common under smallholder farming conditions. The species diversity in these systems is very much related to ecological conditions: as the rainfall in a given region increases, the species diversity and system complexity increase. Thus, there are more diverse multistoried home gardens in humid areas and less diverse, two-tiered canopy configurations (trees + crop) in drier areas.
Intercropping can be under coconuts or Faidherbia (Acacia) albida. The choice depends on rainfall; for example, in the Sahelian and Sudanian savanna zones of Africa, approximately 20 different tree species are common and well known for their multiple products, such as wood, fodder, fruits and medicine (CTCN, 2014).
The benefits of intercropping (Valle, 2017):
• Greater income, greater yield,
• Insurance against crop damage,
• Optimum use of soil,
• Good for primary crops.
2.4.1 Crop rotation
Crop rotation is the practice of growing a series of different types of crops in the same area in sequential seasons (Mutua et al., 2014; CTCN, 2014).
Using some forms of crop rotation, farmers can reduce the need for artificial fertilizers as well as keep their fields under continuous production instead of letting them lie fallow, both of which can be expensive.
A general effect of crop rotation is that there is a geographic mixing of crops, which can slow the spread of pests and diseases during the growing season. Crop rotation gives various benefits to the soil. A traditional element of crop rotation is the replenishment of nitrogen through the use of green manure in sequence with cereals and other crops. Crop rotation also mitigates the build-up of pathogens and pests that often occurs when one species is continuously cropped and can also improve soil structure and fertility by alternating deep-rooted and shallow-rooted plants. Crop rotation is one component of polyculture.
The different crops can also reduce the effects of adverse weather for the individual farmer and, by requiring planting and harvesting at different times, allow more land to be farmed with the same amount of machinery and labor.
Agronomists describe the benefits to yield in rotated crops as "the rotation effect." Crop rotation has a number of benefits:
• It slows the spread of pests and diseases during the growing season,
• It allows more land to be farmed with the same amount of machinery and labor,
• Financial risks are more widely distributed over more diverse production of crops and /or livestock.
LegumeLegume
FruitLeaf
Root
Beans, peas, lima beans, potatoes
Lettuce, greens, herbs, spinach, brassicas, corn
Tomatoes, cucumbers, peppers, eggplant,
squash, melons
Onions, garlic, turnips, beets,
carrots, radishes
Figure 2.3 Benefits of crop rotation
Source: CTCN, 2014.

17
Compendium of Practices in Climate-Smart Agriculture and Solar Irrigation
Choice and sequence of rotation crops depends on:
• The nature of the soil,
• The climate and precipitation,
• Crop marketing and economic variables.
2.4.2 Fallow management
Rotation of cropping and fallow periods is commonly practiced in many upland farming systems in Southeast Asia.
Case study 2.4.1 Fallow management in Southeast Asia The approaches that farmers use to change their fallow management in response to intensification pressures may generally be classified as innovations to achieve:
• More “effective” fallows—where the biological efficiency of fallow function is improved, and the same or greater production benefits can be achieved in a shorter time frame (e.g., weed suppression or soil fertility replenishment),
• More “productive” fallows—in which fallow length remains the same or is actually lengthened as the farmer adds value to the fallow by introducing more economic species, or
• Combination of the two—where both biophysical and economic benefits may be obtained.
Fallow periods have a number of benefits:
• Soil fertility restoration,
• Suppression of weeds,
• Protection of the soil against erosion,
• A source of cash income for the farmers through the existence or planting of specific economic valuable species.
Fallow management strategies
Indigenous forest farming communities have developed fallow management strategies to adapt to changing environmental, economic, social and political conditions (Burgers et al., 2000). Three types of adaptive strategies have been identified:
1. Improved fallows focusing on increasing the rate of restoration of soil fertility and other ecosystem properties following cropping such as reduction in pernicious weed populations.
2. Enriched fallows focusing on increasing the direct economic benefits of the natural fallow vegetation.
3. A focus on integrating soil fertility and economic benefits through integration of livestock.
The key to success in the introduction of livestock as a means of improving fallow-based farming systems depends on how well they can be integrated into the system or segregated from crops. The communities in northern Thailand have successfully integrated cattle into their farming system. They allow the cattle to graze freely in the young fallow vegetation during the fallow period and herd the animals during the cropping season of rice (CTCN, 2014).
In other cases, where the livestock component can be the major source of household cash income, as in the remote villages of northern Laos, households may decide to invest more seriously in the integration and segregation of livestock in their farming system. In villages in Laos, households enrich fallow vegetation with forages to ensure availability of feed, and they establish fences around temporary rice fields to reduce crop damage by grazing animals (CTCN, 2014).
Benefits:
• Source of cash,
• Food security,
• Power in land preparation and transporting,
• Soil fertility.
Source: CTCN, 2014.

18
Compendium of Practices in Climate-Smart Agriculture and Solar Irrigation
Case Study 2.4.2 Solutions in fallow management, Vietnam Swidden farming (“or slash-and-burn” or “shifting cultivation”) was an excellent form of agriculture for Vietnam’s uplands. Today it is clearly unsustainable. Growing population pressure in the uplands, along with the reduction of forest cover, has gradually reduced fallow periods from 15–20 years to only 4–5 years. Loss of forest and soil fertility, along with erosion-factors that rapidly reduce crop productivity, is an inevitable consequence of swidden agriculture when the fallow period is so reduced.
Better fallow management techniques include planting forest trees and plants that restore soil fertility and stimulate the soil restoration process. Legumes are used in many localities for this purpose. They are intercropped or planted in alternate rows with traditional food staples in swidden fields, enriching soil nutrients so the cultivation period can be extended.
Some ethnic minority groups use methods to accelerate the establishment of vegetation cover (such as leaving high stumps and burning bamboo before planting). In addition to fallow management advances, farmers practice other better and more sustainable techniques of growing crops on sloping land. These include SALT models, integrated agroforestry systems, strip farming, planting hedgerows to restore the soil and prevent erosion, and the cultivation of wet rice in terraces (Tran Duc Vien, 2007).
2.4.3 Conservation, zero and minimum tillage
Tillage may be defined as the practice of modifying the state of soil in order to provide conditions favorable for plant growth. Tillage can also be defined as the mechanical manipulation of soil with certain implements or tools to provide a suitable environment for seed germination root growth, weed control, soil erosion control and moisture conservation. The minimum tillage concept reduces time, labor and machine operations as well as conserving moisture and reducing erosion. The modern technology of herbicides and insecticides made it possible to achieve some tillage requirements without using implements. Any tillage practice in dry lands which does not return more than its cost by increasing yield and improving soil conditions should be eliminated. Soil needs to be worked only enough to assure optimum crop production and weed control.
Furthermore, tillage of the soil stimulates microbial decomposition of soil organic matter, which results in emissions of CO2 to the atmosphere. Therefore, minimizing the amount of tillage promotes sequestration of carbon in the soil. In the last decades, advancements in weed control methods and farm machinery have allowed many crops to be grown with minimum tillage.
There are three types of reduced tillage: conservation, zero and minimum tillage.
Conservation tillage
• Conventional tillage is the traditional method of farming in which soil is prepared for planting by completely inverting it with a tractor-pulled plough, followed by subsequent additional tillage to smooth the soil surface for crop cultivation. In contrast, conservation tillage is a tillage system that conserves soil, water and energy resources through the
Hindering factors:
• Investment to feed and grazing areas,
• Additional labor,
• Overgrazing.

19
Compendium of Practices in Climate-Smart Agriculture and Solar Irrigation
reduction of tillage intensity and retention of crop residue. Conservation tillage involves the planting, growing and harvesting of crops with limited disturbance to the soil surface.
• Conservation tillage is any method of soil cultivation that leaves the previous year’s crop residue (such as corn stalks or wheat stubble) on fields before and after planting the next
Advantages
- Increases the ability of soil to store or sequester carbon while simultaneously enriching the soil.- Improves soil water infiltration, thereby reducing erosion and water and nitrate runoff.- Improves the stabilization of soil surface to wind erosion and the release of dust and other air-
borne particulates.- Reduces leaching of nutrients due to greater amounts of soil organic matter to provide binding
sites.- Decreases evaporation and increases soil moisture retention, which can increase yields in drought
years (Suddick et al., 2010).- Reduces the number of passages of equipment across the field, thereby reducing the cost of fossil
fuel and the associated carbon emissions to the atmosphere.- Reduces the loss of pesticides and other applied chemicals. This is because higher infiltration rates
with more surface residue results in less runoff moisture holding capacity due to higher soil organic matter that results in less leaching.
Disadvantages
- Specialized, expensive equipment is required, or much hand labor in the case of very small-scale growers.
- Requires more herbicides and pesticides than standard conventional practices to control weeds and other pests.
- Sizable amounts of non- CO2 greenhouse gases (N2O and CH4) can be emitted under conserva-tion tillage compared to the amount of carbon stored, so that the benefits of conservation tillage in storing carbon can be outweighed by disadvantages from other GHG emissions.
Source: Abrol et al., 2005.
crop to reduce soil erosion and runoff as well as other benefits such as carbon sequestration (MDA, 2011). With this technique, at least 30% of the soil surface is covered with crop residue/organic residue following planting (Dinnes, 2004). Conservation tillage methods include zero-till, strip-till, ridge-till and mulch-till.

20
Compendium of Practices in Climate-Smart Agriculture and Solar Irrigation
Zero tillage
• Zero tillage (also called no-till farming or direct drilling) is a way of growing crops or pasture from year to year without disturbing the soil through tillage. No-till is an agricultural technique which increases the amount of water that infiltrates the soil and increases organic matter retention and cycling of nutrients in the soil. In many agricultural regions, it can eliminate soil erosion. It increases the amount and variety of life in and on the soil, including disease-causing organisms and disease suppression organisms. The most powerful benefit of no-tillage is improvement in soil biological fertility, making soils more resilient. Farm operations are made much more efficient; in particular, improved time of sowing and better trafficability of farm operations.
• Zero tillage is the extreme form of conservation tillage resulting in minimal disturbance to the soil surface.
• Zero tillage involves planting crops directly into residue that hasn’t been tilled at all (MDA, 2011). Zero tillage technology is generally used in large-scale agricultural crop cultivation systems because large machines are required for planting. For smaller-scale farms, no adequate machines are available for sowing, although small-scale farmers may do so by hand. In zero tillage, crops are planted with minimum disturbance to the soil by planting the seeds in an un-ploughed field with no other land preparation. A typical zero-tillage machine is a heavy implement that can sow seed in slits 2–3 cm wide and 4–7 cm deep and also apply fertilizer in one operation (CIMMYT, 2010). The machine contains an inverted T-type furrow opener to open the slits. The seed and fertilizer are placed in corresponding boxes and dropped into the slits automatically. The depth of the slits may be controlled by a hydraulic mechanism from the tractor.
Features of zero tillage include the following:
• Crop residues are distributed evenly and left on the soil surface.
• No implements are used (a) to turn the soil over, (b) to cultivate the crops or (c) to incorporate the crop residues into the soil.
• Weeds and cover crops are controlled by a pre-planting application of non-pollutant desiccant herbicides.
• A specialized planter is used to cut crop residues on the soil surface and insert the seeds and fertilizers into the soil with minimum disturbance. Generally, seed sowing is done when soil moisture content is adequate for seed germination but not so high that the large tractor and planter would compact the soil.
• Weed control is also accomplished with pre- and post-emergence herbicides.
• Crop rotation is fundamental to zero tillage because it helps to minimize weed, insect and disease populations that increase when the same crop is grown year after year on the same ground.
• Most experiments with zero tillage have had increased yields, but in wetter areas, it took many years to see the crop yields stabilize or increase. However, in drier areas where moisture is the major limiting factor, the effects on yield were seen even in the first year (Kimble et al., 2007).
• Zero tillage causes stratification of soil organic carbon content with relatively higher concentration in the surface and lower concentration in the subsoil compared to plow-based methods of seedbed preparation.
• In the case of zero tillage, the largest barrier is the weight and cost of the specialized planters required to penetrate the soil covered with the previous crop. The use of these planters is mainly restricted to richer countries where the fields are relatively large. For growers with small farms in poor countries, the large amount of required hand labor is a barrier.

21
Compendium of Practices in Climate-Smart Agriculture and Solar Irrigation
Advantages of zero tillage:
• Less labor time and expenses are required under a reduced tillage system due to fewer tillage trips and cultivation operations for seedbed preparation (Kimble et al., 2007).
• A large number of studies have estimated the potential fuel cost savings as a result of reducing tillage (Kimble et al., 2007).
• Generally, reduced tillage systems have lower machinery repair and maintenance costs due to less use of tillage implements (Kimble et al., 2007).
• Zero tillage technology reduces the costs of field preparation.
• Zero tillage can save farmers around 1 million liters of water per hectare (100 mm) compared with conventional practices due to the mulch on the soil surface which reduces evapotranspiration (Rehman, 2007).
• Zero tillage increases soil carbon from 0.1 to 0.7 metric tons ha-1yr-1 (Paustion et al., 1995) under sub-tropical conditions.
The benefits of zero tillage in rainfed farming can be summarized as follows (CTCN, 2014):
1. Moisture management: soil configuration for in situ moisture conservation to increase infiltration rate and the moisture storage capacity of the soil profile as well as increase aeration to reduce evaporation losses through inter-tillage operations and provide drainage to remove excess water,
2. Erosion control: contour cultivation tillage across the slope,
3. Weed control: check weed growth and avoid moisture competition,
4. Management of crop residues: mixing of trash and decomposition of crop residues and retention of trash on top layers to reduce erosion,
5. Improvement of tilth: minimize the resistance to root penetration and improve soil texture and structure,
6. Improvement of soil aeration for good growth of crop,
7. Preparing fine surface for seeding operation,
8. Incorporation of manures, fertilizers and agro-chemicals (weedicide and soil amendments) into the soil,
9. Insect control,
10. Temperature control for seed germination.
Minimum tillage
• Strip-tillage involves tilling the soil only in narrow strips with the rest of the field left untilled (strip-till) (MDA, 2011).
• Ridge-till involves planting seeds in the valleys between carefully molded ridges of soil. The
Case Study 2.4.3 Benefits of zero tillage in rainfed farming
Figure 2.4 Soil loss and water run-off: conven-tional, no-till and double-crop no-till compared
Source: CTCN, 2014.

22
Compendium of Practices in Climate-Smart Agriculture and Solar Irrigation
previous crop’s residue is cleared off ridge-tops into adjacent furrows to make way for the new crop being planted on ridges. Maintaining the ridges is essential and requires modified or specialized equipment (MDA, 2011).
• Mulch-till is another reduced tillage system in which residue is partially incorporated using chisels, sweeps, field cultivators or similar farming implements that leaves at least one third of the soil surface covered with crop residue (MDA, 2011).
• Each conservation tillage method requires its own type of specialized or modified equipment and adaptations in management.
2.5 Contour farming and terrace farming
Contour farming is a type of farming that uses ridges and furrows formed by tillage, planting and other farming operations to change the direction of runoff from directly downslope to around the hillslope. This practice applies on sloping land where annual crops are grown. Orchards, vineyards and nut crops use this practice.
The benefits of contour farming are as follows:
• It reduces sheet and rill erosion.
• It reduces transport of sediment, other solids and the contaminants attached to them.
• It increases water infiltration.
Picture 2.3 Contour farming
Terrace farming is a type of farming that is used in hilly areas to create patches of land for farming. The terraces keep the soil in place while allowing excess water to drain through natural gravity.
The benefits of terrace farming are as follows:
• It reduces sheet and rill erosion.
• It reduces transport of sediment, other solids and the contaminants attached to them.
• It increases water infiltration.
The difference between contour plowing and terrace farming is that the former follows the natural shape of the slope without altering it, whereas the latter alters the shape of the slope to produce flat areas that provide a catchment for water and a solid area for crop growth.
Case Study 2.5.1 Contour plowing and terraces (CTCN, 2014)
The Soil Erosion Service was one of the federal programs started in the 1930s to save land that had been destroyed by years of wind erosion, over plowing, and overgrazing. The commission taught farmers how to use terracing and contour plowing techniques to preserve the soil. The federal and state governments teamed up with universities that had strong agricultural programs, like the University of Nebraska, to set up demonstration plots and show farmers how to use these soil conservation methods.
Contour plowing is a method of plowing furrows that follow the curves of the land rather than straight up and down slopes. Furrows that run up and down a slope form a channel that can quickly carry away seeds and topsoil. Contour plowing forms ridges, slows the water flow and helps save precious topsoil. Going back and forth over the field fewer times saves fuel costs for the farmer and conserves the soil.
2.6 Cross-slope barriers
Cross-slope barriers are measures on sloping lands in the form of earth or soil bunds, stone lines, and/or Source: CTCN, 2014.

23
Compendium of Practices in Climate-Smart Agriculture and Solar Irrigation
Table 2.6.1 Benefits of cross-slope barriers
Benefit Land users/community level Watershed/landscape level National/Global level
Production Increased crop yield (long term)
Increased grass/fodder production
Reduced risk and loss of production
Access to clean drinking water
Improved food and water security
Economic Increased farm income (long term)
Less damage to off-site infrastructure
Stimulation of economic growth
Improved livelihood and well-being
Ecological Reduced soil loss (mainly in sub humid areas)
Increased soil moisture (mainly in semi-arid areas) Reduced soil erosion (by wind/water)
Increased infiltration rates
Decrease in runoff velocity and control of dispersed runoff
Improved soil cover
Increase in soil fertility (long term)
Biodiversity enhancement
Improved micro-climate
Reduced degradation and sedimentation
Improved water quality
Increased water availability
Intact ecosystem
Increased resilience to climate change
Reduced degradation and desertification incidence and intensity
Enhanced biodiversity
Socio-cultural Improved conservation/erosion knowledge
Community institution strengthening
Increased awareness of environmental “health”
Attractive landscape
Protection of national heritage
Source: FAO, 2011.
vegetative strips for reducing runoff velocity and soil loss, thereby contributing to soil, water and nutrient conservation. This is achieved by reducing steepness and/or length of slope (FAO, 2011).
What are the benefits of cross-slope barriers?
Cross-slope barriers have production, economic,
ecological, and socio-cultural benefits (table 2.6.1).
Cross-slope barriers have a high climate-change mitigation potential, due to their capacity to sequester carbon (FAO, 2011; figure 2.5, table 2.6.2).

24
Compendium of Practices in Climate-Smart Agriculture and Solar Irrigation
Figure 2.5 Cross-slope barriers benefits in carbon and yield
Source: Climate-smart Agriculture Compendium, Rosenstock, Lamanna et al., in presentation by Dr. Christine Lamanna, ICRAF, Nairobi, December 2018.
Table 2.6.2 Cross-slope barriers: climate-change mitigation potential
Climate change mitigation Potential
Potential for C sequestration (tons/ha/year) 0.5-1.0 tons/ha/year
C Sequestration: above ground +
C Sequestration: below ground +
Source: FAO, 2011.

25
Compendium of Practices in Climate-Smart Agriculture and Solar Irrigation
Cross-slope barriers also have a high climate-change adaptation potential (table 2.7.3).
Table 2.6.3 Cross-slope barriers: climate-change adaptation potential
Climate change adaptation Potential
Resilience to extreme dry conditions ++
Resilience to variable rainfall +
Resilience to extreme rain and windstorms +
Resilience to rising temperature and evaporation rates +
Reduction risk and production failure +
Source: FAO, 2011.
Table 2.6.4 Practice of cross-slope barriers
Type Where Common Suitable slopes
Terracing Steep areas Moderate to very steep
Stone lines West Africa, stony areas Gentle to steep slope
Earth bunds/ridges Semi-arid areas Gentle to moderate slope
Fanya juu/Fanya chini East Africa Moderate to steep slope
Vegetative strips Humid areas Gentle to steep slope
Source: Presentation of Mary Njenga et al, ICRAF, Nairobi, December 2018.

26
Compendium of Practices in Climate-Smart Agriculture and Solar Irrigation
Where do farmers practice cross-slope barriers?
Terracing steep lands in Africa is an indigenous technology. Under colonial regimes, large areas of communal lands were compulsorily terraced in the 1950s (e.g., in Kenya, Malawi and Zambia) through the construction of ridges or bunds. Rejected after independence, the techniques made a comeback in the 1970s (FAO, 2011; table 2.6.4).
Fanya juu terraces, first developed in the 1950s have spread throughout East Africa. The period of rapid spread occurred during the 1970s to 1980s with the advent of the national SWC (soil and water conservation)
Table 2.6.5 Considerations for establishment of cross-slope barriers
Consideration Detail
Terrain and land-scape
Cross-slope barriers are applicable from gentle to steep slopes.
· Bench terraces: moderate to very steep slopes; · Earth bunds: gentle to moderate slopes; · Stone bunds: gentle to steep slopes; · Fanya juu terraces: moderate to steep slopes (up to 50%); · Fanya chini terraces: moderate to hilly slopes (up to 35%); · Vegetative strips: gentle to steep slopes.
Climate Cross-slope barriers are suitable for the whole range of arid to humid areas. They are mainly located in sub-humid and semi-arid areas and partly in humid and arid areas.
In sub-humid to humid areas, cross-slope barriers are mainly used for protection against soil erosion, whereas in semi-arid areas, these are mainly used for water conservation purposes;
Terraces and vegetative strips can, to a certain extent, cope with extreme rainfall events.
Earth bunds are not suitable for very wet areas unless graded;
Vegetative strips are most effective in moist areas and least effective in dry areas;
Fanya juu terraces are not suitable in dry areas unless used for rainwater harvesting
Soils Not suitable for very shallow and sandy soils – bench terraces must not be built on shallow soils (to avoid risk of landslides).
Land use Mainly on annual cropland and / or partly on mixed land with tree and shrub cropping. Partly on intensive grazing fodder production: rarely on grazing land.
Source: FAO, 2011.
program in Kenya. In the West African Sahel, contour stone lines (and vegetative barriers) have been promoted successfully since the 1980s as water harvesting structures.
Cross-slope barriers are also practiced in Thailand and Vietnam to reduce soil erosion on sloping land.
How are cross-barriers implemented? AO (2011) identifies four considerations for assessing the suitability of establishment of cross-slope barriers (table 2.6.5).

27
Compendium of Practices in Climate-Smart Agriculture and Solar Irrigation
Table 2.6.6 Specifics of cross-slope barriers
Type of cross-slope barrier
Description
Bench terraces Bench terraces are commonly developed on steep slopes as a result of con-structing cross-slope barriers, and then erosion (water and tillage) progressively causing the bed to level. A bench terrace is defined by a flat or slightly backward or forward-sloping bed. Stone-faced terrace risers are characteristic of areas where stone is available (e.g. the Konso terraces in Ethiopia); otherwise the earth risers are protected by grass. Due to the heavy labor input, they are usually constructed to support production of high-value crops, such as irrigated vegetables and coffee. The design of the benches is usually calculated by a formula that relates their size and spacing to the slope. Bench terraces are rarely excavated and constructed directly, as this is very expensive.
Earth bunds Earth bunds (or "ridges") are soil conservation structures that involve construc-tion of an earthen bund along the contour by excavating a channel and creating a small ridge on the downhill side. Usually the earth used to build the bund is taken from both above and below the structure. They are often reinforced by vegetative cover to stabilize the construction. Bunds are gradually built up by annual mainte-nance and adding soil to the bund.
Fanya juu Fanya juu ("do upwards" in Kiswahili) terraces are made by digging ditches and trenches along the contour and throwing the soil uphill to form an embankment. A small ledge or "berm" is left between the ditch and the bund to prevent soil from sliding back. In semi-arid areas they are normally constructed to harvest and conserve rainfall, whereas in sub-humid zones they may be laterally graded to safely discharge excess runoff. The embankments (risers) are often stabilized with fodder grasses.
Fanya chini In a Fanya chini system ("do downwards" in Kiswahili) soil is piled below a contour trench. These are used to conserve soil and divert water and can be used up to a slope of 35%.
Fanya chini involve less labor than Fanya juu, but they do not lead to the formation of a bench terrace over time as quickly as the former.
Stone lines and bunds In areas where stones are plentiful, stone lines are used to create bunds either as a soil conservation measure (on slopes) or for rainwater harvesting (on plains in semi-arid regions). Stones are arranged in lines across the slope to form walls. Where these are used for rainwater harvesting, the permeable walls slow down the runoff, filter it, and spread the water over the field, thus enhancing water infil-tration and reducing soil erosion. Furthermore, the lines trap fertile soil sediment from the external catchment.
Vegetative strips Vegetative strips are the least costly or labor-demanding type of cross-slope barriers. Such strips are a popular and easy way to terrace land, especially in areas with relatively good rainfall. The spacing of the strips depends on the slope of the land. On gentle sloping land, the strips are given a wide spacing (20-30 m), while on steep land the spacing may be as little as 10-15 m. Vegetative strips can also provide fodder for livestock if palatable varieties of grass (or densely spaced bushes) are used.
Source: FAO, 2011.

28
Compendium of Practices in Climate-Smart Agriculture and Solar Irrigation
Table 2.6.7 summarizes the constraints and solutions to adopting cross-slope barriers.
Table 2.6.7 Cross-slope barriers: constraints and solutions
Constraints Solutions
Production constraint
Loss of land for production due to risers of terraces, ditches for Fanya juu/chini, vegetative strips.
The construction can easily be damaged by cattle interference.
Planting vegetative strips fails in the period with highest agricultural activity.
If not adequately managed, soil and water conservation function can be lost or can even be accelerated.
Competition for water and nutrients in the case of vegetative barriers.
Integration and incorporation of vegetative measures in the system, widening of spacing between bunds, making bund area productive (e.g., grass on terraces for livestock), increased productivity of fodder trees on bunds.
Controlled grazing, management of the terraces.
Need for capacity building and training for appropriate management.
Economic Constraint
High investment costs, usually exceeding short-term benefits.
Shortage of labor, especially for the construction; very high labor input is needed. Some cross-slope barriers can also lead to high maintenance requirements (e.g., soil bunds).
Shortage of construction materials and hand tools.
Lack of market infrastructure.
Credits and financial incentives for initial investments should be easily accessible to land users.
Establishment with labor-sharing groups, financial incentives to credit facilities or phasing the establishment over several years to overcome. For maintenance, less support is needed but land users should be organized (individually or in groups) to undertake maintenance and repairs.
Ecological Constraint
Possible water-logging before bund/embankment.
Uneven flood water distribution and breakages of terraces.
Rodents and other pests hiding in the vegetation.
Competition of vegetation strips and bunds with crop.
Unprotected bunds which have not been planted with grass are prone to erosion.
Addition measures such as vegetation/mulch cover.
Maintenance and adjustments of the barriers.
Provision of appropriate measures and provision of rodent and pest controlling mechanisms.
Trimming of vegetation during crop growing period.
Socio-cultural constraint
The traditional system is often used, but it is not properly maintained, especially when populations move away from rural areas.
Incentives for “renovation” of traditional structures (e.g., Konso terraces in Ethiopia).
Source: FAO, 2011.

29
Compendium of Practices in Climate-Smart Agriculture and Solar Irrigation
Economics of cross-slope barriers Table 2.6.8 presents the establishment and maintenance costs of three types of cross-slope barriers, such as terraces, fanya juu, and vegetative strips; and table 2.7.9 illustrates the production benefits.
Table 2.6.8 Establishment and maintenance costs
Item Establishment costs (USD/ha) Maintenance costs (USD/ha)
Costs Terraces Fanya Juu Veg.strips Terraces Fanya Juu
Veg.strips
Labor Cost (per day)
High High Medium-high
Medium Low Low
150-1200
150-600
40-600
40-300
7-80
7-40
10-300
10-150
10-60
10-30
0-30
0-15
Equipment Low-medium Low-medium Low Low low Low
10-50 20-60 10-50 0-20 0-10 0-10
Material inputs Medium-high Low-medium Medium Low Low Low
50-300 10-80 20-100 0-50 0-15 0-10
Total 210-1350 70-740 37-230 10-370 10-85 0-50
Source: FAO, 2011, *USD 1-2 per day.
Table 2.6.9 Production benefits
Crop, location Yield without SLM (t/ha) Yield with SLM (t/ha) Yield gain
Maize, Kenya 2.1-3.4 2.3-3.7 (grass strips)
3.1 – 4.5 (Fanya juu)
10-45%
Beans, Tanzania 1.5-1.8 2 (grass strips)
2.8 (Fanya juu)
2.1 – 2.7 (bench terraces)
10-85%
Sorghum, Ethi-opia
15% slope
25% slope
35% slope
Non-terraced
0.96
0.67
0,43
Terraced (stone bunds)
2.18
1.83
1.7
127%
173%
197%
Source: Mwangi et al, 2001; Tenge et al, 2005 ; Alemayehu et al , 2006, cited in FAO, 2011.

30
Compendium of Practices in Climate-Smart Agriculture and Solar Irrigation
What needs to be considered?
There are five factors that need to be considered for the establishment of cross-slope barriers (FAO, 2011).
1. Farming system and level of mechanization: Mainly animal traction (oxen, with plough) and manual labor (hand tools, on steeper slopes where oxen cannot be used) are used; very often a combination of animal traction and manual labor; only partly mechanized (e.g., for transportation of stones).
2. Land tenure and land use/water rights: Secure individual land use rights are needed; otherwise, the land users are not willing to invest in structural conservation measures. Land tenure is often formally state or communal (village) property and individually not-titled.
3. Skill/knowledge requirements: A high level of know-how is required for the establishment and the maintenance of terraces and bunds.
4. Market orientation: Mainly subsistence (self-supply), partly mixed and partly commercial/market.
5. Labor requirements: The establishment of terraces and bunds requires high input; sometimes outside labor needs to be hired for the construction of the terraces or the bunds.
• Fanya juu terraces are associated with hand construction and are well suited for small-scale farms. In Kenya, they are often established through self-help groups.
• Maintenance can usually be done by individuals and is very important for all kinds of terraces and bunds.
2.7 Vertical farmingVertical farming (VF) is the nascent sector, in which crops are grown in stacked indoor systems under artificial light and without soil. Vertical farming has become a hot topic during the coronavirus pandemic, as supply chain disruptions and labour shortages feed perennial fears over global food security. The most recent developments have included the construction of Europe’s largest vertical farm, plans to build the world’s biggest indoor farm in the Abu Dhabi desert, and a $140m fundraising round by a SoftBank-backed
start-up Plenty. Norway’s Kalera this week announced a $100m private placement ahead of its listing on the Oslo Stock Exchange’s Merkur Market (Terazono, 2020).
Proponents believe that the technology represents the future of agriculture, hailing huge efficiency and environmental gains for the food industry, and about $1.8bn has flowed into the sector since 2014, according to data group Dealroom. However, agritech entrepreneurs and analysts warn that lofty promises could undermine the sector’s credibility, putting off consumers and investors.
The sector remains largely tiny. Vertical farming occupies the equivalent of 30 hectares of land worldwide, according to Rabobank analyst Cindy Rijswick, compared with outdoor cultivation of about 50m ha and 500,000 ha for greenhouses.
High initial capital investment and running costs mean it is hard to make a profit. Businesses must pay for specialised labour and face huge electricity bills for lighting and ventilation, while having to offer competitive prices to attract consumers.
Some operators in Japan are profitable while Nordic Harvest, the Danish start-up that has teamed up with Taiwan’s YesHealth Group to build
Europe’s biggest vertical farm in Copenhagen, claims it will be profitable in its first year in 2021. The industry is expected to grow over the next decade, with research group IDTechEx forecasting that annual sales of $700m will more than double to $1.5bn by 2030.
By 2021, Plenty Unlimited Inc secured US$140million in its series D financing by Softbank Vision Fund. Taiwanese YesHealth Group and Danish Nordic Harvest complete first phase of construction on Europe's largest vertical farm.
Furthermore, stacked production systems allow the cultivation of produce in constrained spaces, including urban areas. That means food can be produced closer to its consumers, reducing transportation time and improving freshness at the point of sale.
However, new entrants can face problems with automation and watering processes, leading to costs spiralling out of control. There have also been cases of black mould and pest infestations hitting the farms, which typically do not use pesticides.

31
Compendium of Practices in Climate-Smart Agriculture and Solar Irrigation
Case Study 2.7.1 How is it implemented?
In an Engineering Study initiated by DLR Bremen, a farm was designed and simulated in Berlin to estimate the cost of production and market potential of this technology. It yields about 3,500 tons of fruits and vegetables and ca. 140 tons of tilapia fillets, 516 times more than expected from a footprint area of 0.25 ha due to stacking and multiple harvests. The investment costs add up to € 200 million, and it requires 80 million litres of water and 3.5 GWh of power per year. The produced food costs between € 3.50 and € 4.00 per kilogram. In view of its feasibility, we estimate a market for about 50 farms in the short term and almost 3000 farms in the long term.
General structure of a vertical farm
In order to support 15,000 people with enough food, a vertical farm of 0.93 ha1 (roughly the size of a city block) with a total of 37 floors, 25 of them solely for the purpose of crop production and 3 for aquaculture. Further, there are three uniformly distributed floors for environmental regulation and two in the basement for waste management. In addition, there is one floor for cleaning of the growth trays, sowing and germination; one for packing and processing the plants and fish; and one for sales and delivery at the basement. This configuration results in a total building height of 167.5 meters, with a length (and width) of 44 meters, giving an aspect ratio2 of 3.81. A freight elevator big enough to fit a forklift truck was planned in the center of the building, allowing for harvest and waste to be transported down to the respective floors.LED (light-emitting diode) technology is chosen for the artificial lighting as it emits a low level of thermal radiation, has no hot electrodes and has no high-voltage ballasts. With LED, it is possible to modify the irradiation output to approximate the peak absorption zone of chlorophyll. The selected plant species have different illumination requirements in terms of PPF (photosynthetic photon flux). Therefore, the panels are not operated at maximum power but on different
power levels, depending on the PPF requirements of the plant species. Furthermore, the desired duration of illumination is adapted to the needs of the plants, leading to 12– to 16–hour periods depending on the plant species.
Agricultural subsystem
The vertical farm has to provide the optimal conditions for the crops to transition from seeds through the germination, vegetative, reproductive and harvesting phases. As it is a closed system, a major prerequisite is controlled temperature and relative humidity in the growth chambers. Additionally, controlled and elevated CO2 levels have been simulated to obtain maximum biomass yield. Since the plants grow in aeroponic systems, it is further possible to recycle the excess nutrients from mist in the air. Another major task in such a closed system is filtering out contaminations and trace gases, such as ethylene, which are released into the air by plant. For these matters, three environmental control floors are required, controlling the air quality and recycling the excess nutrients of eight to nine plant cultivation floors each.
The seeds germinate on a specialized germination floor, while the later stages take place on the plant cultivation floors. On the cultivation floors, a plant growth area is segregated into eight zones which can be harvested at different times. These eight zones are sown with a time lag (seven-day interval) to facilitate a uniform harvesting pattern in order to ensure a steady supply of the products to the centers of demand, decreasing the necessity for storing and refrigeration.
The aforementioned cropping cycle creates a continuous sowing and harvesting loop. The total number of sowing and harvest events is 215 in 365 days, in which a total of 68 ha is sown and harvested every year.
Due to the closed environment and controlled lightning, the land productivity of vertical farming is twice as high as that of traditional agriculture. Moreover, taking into account that only 0.25 ha are needed on which the farm is built, the total yield increases 516 fold compared to traditional agriculture, through stacking the production.

32
Compendium of Practices in Climate-Smart Agriculture and Solar Irrigation
Aqua-cultural subsystem
The fish farm serves the functions of waste disposal, plant nutrient source and food (fish fillet) production within the VF. It will add to the efficiency of the farm by utilizing irrigated water from plants, as well as plant waste, to create food in the form of edible fish biomass. This process is often called aquaponics. The design is based on a balanced production cycle, which aims to optimize the production by allocating the different maturity stages in different tanks. To balance production and decrease handling costs, five different tank sizes are chosen which are optimized to the desired production volume of close to 700 fish per day per floor. This leads to a total estimated production of 341 tons of fish per year, with 137 tons of edible fish fillet. In total, three workers are needed.
Food processing subsystem
When plants and fish are full-grown, they need to be harvested and readied for delivery to grocery stores and restaurants. This is done on the food processing floor. For processing the food, the necessity of 15 workers is estimated.
Waste management subsystem
In the process of producing edible biomass, the vertical farm generates biowaste as by-products (e.g., leaves, stems, fibrous roots, damaged fruit and vegetables) from the crops as well as waste from the aquaculture system. The annual biowaste from the plant growth chambers is estimated to be roughly 2,443 metric tons. That from the aquaculture systems is estimated to be about 517 tons. Going by the assumption that 1 ton of plant waste is fed to fish (tilapia) per day, the remainder is roughly 7.11 tons per day on average. Since the vertical farm is envisaged to have a closed functional loop, this waste is converted into useful resources, such as liquid fertilizer or biofuel. Wastewater is recycled through a nutrient extraction process by pumping it into tubes filled with volcanic rock particles.
Cost Analysis
The building costs add up to EUR 111.5 million with an additional EUR 90 million for equipment. It requires
80 million liters of water per year, most of which is recycled, requiring only a fraction of that from external sources (since about 4,000 liters leave the system as solid plant and animal matter). The VF takes in 10,000 liters of nutrients, sequesters around 868 tons of CO2. However, it also needs roughly 3.5 GWh of power at EUR 5.3 million and produces 3,573 tons of fruit and vegetables and 137 tons of tilapia fillets per year. The crop production alone is roughly 500 times the yield expected from growing these vegetables in an area of 0.25 ha with the given proportion. By-products are mainly 2,443 tons of biological waste, yielding around 3 million liters of biogas and recycled nutrients, in addition to slurry, which can be used as farm manure. Such a system can produce fruit, vegetables and fish at an average cost lying between EUR 3.50 and EUR 4.00.
Markets for such a technology are found mainly in resource-constrained nations and mega-cities with a substantially high purchasing power. For fostering vertical farms in the future, further research areas can focus on the optimization of production process for edible biomass (a combination of crop cultivation and fish farming) as well as the optimization of animal farming.
2.8 Integrated food-energy systems (IFES)
Integrated Food Energy Systems (IFES) (Sachs and Silk, 1991) refer to farming systems designed to integrate, intensify and thus increase the simultaneous production of food and energy in two ways:
Type 1 IFES
…are characterized through the production of feedstock for food and for energy on the same land, through multiple cropping patterns or agroforestry systems.
Type 2 IFES
…seek to maximize synergies between food crops, livestock, fish production and sources of renewable energy. This is achieved by the adoption of agro-industrial technology (such as gasification or anaerobic digestion) that allows maximum utilization of all by-products and encourages recycling and economic utilization of residues.

33
Compendium of Practices in Climate-Smart Agriculture and Solar Irrigation
IFES scales and configurations
IFES can function at various scales and configurations, from small-scale systems that operate on the village or household level to large-scale systems adjusted for industrial operations:
• Small- or community-scale systems are mainly for the purpose of self-sufficiency of a rural population.
• Large-scale systems are mostly owned by large-scale farmers or the corporate sector.
It is important to know that large-scale IFES can benefit small-scale farmers when they fulfill two characteristics:
1. Adequate involvement of small-scale farmers in decisions,
2. Benefits along the value chain and positive impacts on rural communities.
Be it small- or large-scale, the fundamental distinction lies in the ultimate purpose of the system (Sachs and Silk, 1991):
• One is “farm-centered” or enterprise-centered, where the production of energy is a spin-off of agricultural production.
• Another system is the “energy farm” unit designed for the production of energy, usually for distribution via conventional means to distant urban markets. One example of this is the Itaipu biogas project in Brazil (FAO, 2009), where biogas produced in small to medium farms is transformed into electricity, and part of this electricity is fed into the local grid. This type of system could be expanded into a kind of “public utility” system that provides a social service other than food production; for example, wastewater treatment in a manner that simultaneously produces food and energy and reduces the environmental load. Examples of this include urban latrine systems in India, which, coupled with a biogas generator, produce both hot water and street lighting while reducing the sewage treatment problem.
• A third type of IFES is the “community focused” system. It seeks to energize daily life in a variety of ways that answer domestic and community needs, such as cooking and sanitation as well as individual and community productive needs in agriculture and industry.
Potential IFES Benefits
• Food and energy security,
• Maximizing resource efficiency,
• Addressing climate change (mitigation through reduction of GHG emissions, carbon sequestration, and avoidance or displacement of fossil fuel use).
IFES have the potential to contribute to local adaptation to climate change through:
1. Soil conservation when IFES systems include the incorporation of organic matter in the soil (e.g., compost from crop residues or slurry from biogas production). Climate change adaptation for agricultural cropping systems requires a higher resilience against both excess of water (due to high intensity rainfall) and lack of water (due to extended drought periods). A key element to respond to both problems is soil organic matter, which relies primarily on the incorporation of crop, forest and livestock residues in the soil. In addition, residues deliver essential minerals and constitute an important source for soil carbon and a medium for soil’s micro- and macro-organisms.
2. Increase of biodiversity when IFES are based on diversified land use and production. Biodiversity increases resilience to changing environmental conditions and stresses. Genetically diverse populations and species-rich ecosystems have greater potential to adapt to climate change. Through the use of different types of crops in multiple cropping patterns or agroforestry systems in Type 1 IFES, the risk of biodiversity loss decreases, and sometimes local biodiversity even increases.
3. Financial resilience due to IFES, especially those relying on the use of by-products Type 2 IFES, can lead to more self-sufficiency in some inputs, such as organic fertilizer and/or animal feed and energy; hence reduced debt and easier access to inputs which become more important under uncertain production conditions.
Benefits to poor rural communities
Farming systems that combine food and energy crops present numerous benefits to poor rural communities. For example, poor farmers can use the leftovers from rice crops to produce bioenergy, or in an agroforestry

34
Compendium of Practices in Climate-Smart Agriculture and Solar Irrigation
2.9 Adjustment of crop variety
Climate models predict increased atmospheric CO2 concentrations, increasing global temperatures, modified rainfall patterns and increased frequency of extreme weather events over the next 100 years.
Greater variability in climate is predicted for both East Africa and Southeast Asia. In Vietnam, this is expected to bring more frequent and more severe droughts and floods—conditions already being experienced in many parts of the country. In Kenya, an increase in temperature over the last 40 years, together with irregular and unpredictable rainfall, has increased water scarcity and contributed to the degradation of catchment areas and lakes.
In dealing with unpredictable weather, many farmers in Vietnam have resorted to adjusting the seasonal calendar, building irrigation systems and digging pump wells. Diversification through growing crops such as banana, cassava and sweet potato help to supplement family food and provide animal fodder. Other farmers have turned to trading in commodities or have moved away from the farm to find work.
In Kenya, the adaptation strategies to cope with drought conditions include diversifying regular tea and coffee farming to grow banana, cassava and beans and raising cattle.
Many of the Kenyan farmers were using drought-resistant or early maturing crop varieties, practicing mixed cropping and planting trees (mostly exotic species) to provide for fodder and shade/shelter for their crops. Some had installed water tanks and drip-irrigation systems and others resorted to selling cattle or tree products, using their savings or engaging in off-farm employment.
The negative effects of climate change on cool season grain legume (dry pea, chickpea, broad bean, lentil, lupines, and grass pea) production in developing countries can be mediated by adaptation strategies, such as crop relocation, changes in sowing date, development of stress-tolerant varieties and increased nutrient and plant protection inputs. For any remaining production deficit, developed countries such as Canada, the US, and France, have established growing and export infrastructures for these crops and could increase outputs in response to increased demand.
2.10 Nutrient management
There are two ways to manage nutrients: micro-dosing and fertilizer application strategies.
Micro-dosing
Micro-dosing consistently increases yields. The practice includes seed coating and small packets. However, micro-dosing is time-consuming, laborious and expensive (CTCN, 2014).
system they can use the debris of trees used to grow crops like fruits, coconuts or coffee beans for cooking. Other types of food and energy systems use by-products from livestock for biogas and compost production. Yet others combine biofuel crops and livestock on the same land.
With these integrated systems, farmers can save money because they don’t have to buy costly fossil fuel for their energy needs or chemical fertilizer if they use the slurry from biogas production. They can then use the savings to buy necessary inputs to increase agricultural productivity such as improved seeds—an important factor given that a significant increase in food production in the next decades must mainly come from yield increases. Integrated systems increase their resilience, hence their capacity to adapt to climate change.
At the same time, integrating food and energy production, particularly through the use of by-products, can also be an effective approach to mitigate climate change, especially indirect land use change (iLUC). Implementing IFES leads to increased land and water productivity, therefore reducing greenhouse gas emissions and increasing food security. Moreover, by combining food and energy production, IFES reduce the need to convert land to produce energy, in addition to land already used for agriculture. This further reduces the risks associated with land conversion—and that of additional GHG emissions.

35
Compendium of Practices in Climate-Smart Agriculture and Solar Irrigation
Case Study 2.10.1 Micro-dosing as a pathway to Africa’s Green Revolution
Next to drought, poor soil fertility is the single biggest cause of hunger in Africa. ICRISAT-Zimbabwe (Twomlow et al., 2010) has been working for the past 10 years to encourage small-scale farmers to increase inorganic fertilizer use as the first step towards Africa’s own Green Revolution. The program of work was founded on promoting small quantities of inorganic nitrogen (N) fertilizer (micro-dosing) in drought-prone cropping regions. Results from initial on-farm trials showed that smallholder farmers could increase their yields by 30–100% through application of micro-doses of as little as 10 kg N ha-1. The question remained whether these results could be replicated across much larger numbers of farmers. Wide-scale testing of the micro-dosing (17 kg N ha-1) concept was initiated in 2003–2004, across multiple locations in southern Zimbabwe through relief and recovery programs. Each year, more than 160,000 low-resourced households received at least 25 kg of nitrogen fertilizer and a simple flyer in the vernacular explaining how to apply the fertilizer to a cereal crop.
This distribution was accompanied by a series of simple paired-plot demonstrations with or without fertilizer, hosted by farmers selected by the community, where trainings were carried out and detailed labor and crop records were kept. Over a three-year period, more than 2,000 paired-plot trials were established and quality data collected from more than 1,200. In addition, experimentation to derive N response curves of maize (Zea mays (L.)), sorghum (Sorghum bicolor (L.) Moench) and pearl millet (Pennisetum glaucum (L.) R.Br.) in these environments under farmer management was conducted. The results consistently showed that micro-dosing (17 kg N ha-1) with nitrogen fertilizer increased grain yields by 30–50% across a broad spectrum of soil, farmer management and seasonal climate conditions. To make a profit, farmers needed to obtain between 4 and 7 kg of grain for every kg of N applied, depending on season. In fact, farmers commonly obtained 15–45 kg of grain per kg of N input.
This result provides strong evidence that lack of N, rather than lack of rainfall, is the primary constraint to cereal crop yields, and that micro-dosing has the
potential for broad-scale impact on improving food security in these drought-prone regions.
This research set out to establish the efficacy of cereal crop responses to low doses of N fertilizer across dry regions of southern Zimbabwe. The results have provided strong evidence that N micro-dosing has the potential for broad-scale impact on food security for a large section of the rural poor. For example, Rohrbach et al. (2005) estimated DFID’s support for the distribution of 25 kg of ammonium nitrate fertilizer to each of 160,000 farm households contributed 40,000 additional tons of maize production, valued by the World Food Program at USD 5–7 million.
Fertilizer application strategies
Timing and placement of fertilizer applications can influence fertilizer use efficiency and ultimately crop production. An important objective underlying any fertilizer application is to ensure that nutrients are used efficiently by the target crop in order to achieve optimum yield and avoid detrimental effects to the environment. Appropriate crop nutrition management decisions include avoiding over-fertilization to target fields and/or misapplication of fertilizer sources to non-target areas. With respect to phosphorus (P) fertilizers, over-fertilization and/or misapplication can negatively impact the P concentration of water drained from agricultural fields. Controlled P fertilizer application is an identified Best Management Practice (BMP) approved by the South Florida Water Management District (SFWMD), one designed to reduce drainage water P loads in the Everglades Agricultural Area (EAA). The controlled P fertilizer application BMP is widely implemented by growers throughout the EAA, since this BMP is readily implemented, reduces P fertilizer costs, and normally results in improved crop production (CTCN, 2014).
Provided that a soil test indicates a particular nutrient deficiency, considerations of nutrient placement involve:
• The type of fertilizer being applied,
• Tillage and crop rotation practices,
• Choice of crop,
• Access to necessary equipment,
• Nutrient mobility in the soil,
• Soil characteristics.

36
Compendium of Practices in Climate-Smart Agriculture and Solar Irrigation
Good management practices for nitrogen fertilization are as follows:
• Base nitrogen fertilizer rates on results from soil analysis as well as irrigation water and plant analysis.
• When appropriate, use environmentally and economically sound guidelines.
• Analyze soil samples for each field. As a guideline, sample depth should be at least 2 to 3 feet, preferably to the depth of the effective root zone.
• Establish realistic crop yield expectations for each crop and field based upon soil properties, available moisture, yield history and management level. Yield expectations should be based upon established crop yields for each field, plus a reasonable increase (5% suggested) for good management and growing conditions.
• Manage irrigation water to maximize efficiency and minimize leaching by meeting the Irrigation BMPs or the SCS-approved Irrigation Water Management practice standard and specification.
• Identify fields with severe leaching potential or severe surface loss potential. Employ all appropriate BMPs on these fields to reduce nutrient movement to water.
Apply N fertilizers where they can be most efficiently taken up by the crop:
• Ridge banded fertilizer used in conjunction with alternate row furrow irrigation can reduce downward movement of N.
• Multiple small applications of N through sprinkler irrigation systems can increase fertilizer efficiency and reduce the total N fertilizer application.
• Fertilizers applied on irrigated fields with high surface loss potential should be subsurface banded or incorporated immediately after application.
• Nitrogen applied in irrigation water should be metered with an appropriate device that is properly calibrated. Due to the increased possibility of leaching or runoff, N fertilization
through conventional flood or furrow irrigation systems is strongly discouraged.
Good management practices for phosphorous fertilization.
Timing and placement of fertilizer applications can influence fertilizer use efficiency and, ultimately, crop production. An important objective underlying any fertilizer application is to ensure that nutrients are used efficiently by the target crop in order to achieve optimum yield and avoid detrimental effects to the environment. Appropriate crop nutrition management decisions include avoiding over-fertilization to target fields and/or misapplication of fertilizer sources to non-target areas. With respect to phosphorus (P) fertilizers, over-fertilization and/or misapplication can negatively impact the P concentration of water drained from agricultural fields.
Reasons supporting the banding of P fertilizers includes:
• Banding P fertilizer has shown a marked positive effect on crop yield response, depending on soil test levels. In soils with low levels of available P, placement of P fertilizer close to the root system results in greater P plant uptake and use efficiency by the crop.
• At low fertilization rates, the efficiency of P uptake by the crop is greater for banding than broadcast application, especially for P applications on soils with a high P-fixation capacity, such as organic soils.
• Band application of P fertilizer reduces the soil–fertilizer surface contact area, resulting in slowed P fixation (i.e., P that is chemically transformed and rendered unavailable to plants) rates by the organic soils of the EAA, resulting in increased quantities of P that is available for crop uptake. Banding of P fertilizer often decreases soil pH within the narrow application zone, which encourages improved P availability over a longer period of crop growth. This phenomenon is particularly important for soils with naturally high P-fixation capacities.

37
Compendium of Practices in Climate-Smart Agriculture and Solar Irrigation
• Banding greatly reduces the likelihood of overlapping fertilizer applications, since fertilizer placement is readily visible to the fertilizer rig operator.
• The most important advantage of banding is the significant reduction of the overall amount of P applied to a particular crop. Banding can reduce the amount of P fertilizer applied to lettuce by 66%, compared to broadcast application. Banding is also a viable strategy to reduce the amount of P used in sweet corn production on organic soils, since it provides a method to achieve profitable sweet corn production while minimizing environmental risks.
Prevention of P fertilizer misapplication:
• Establish a well-documented, highly visible P fertilization management decision program that is based on a consistent soil-testing program designed to deliver agronomically and economically sensible P fertilizer recommendations for all field/crop combinations on the farm,
• Properly fine-tune and calibrate fertilizer application spreaders several weeks before the planting season starts and then at least one day before any given application date. The goal is to avoid procrastination that might lead to a rushed, incomplete calibration effort,
• Never broadcast fertilizers near open waterways such as canals and ditches. If these field scenarios are anticipated, use pneumatic-controlled edge or band applicators,
• When turning fertilizer application rigs, use reduced ground speeds to avoid flinging fertilizer onto roadways and into ditches and canals,
• Use row-marking strategies such as foams or soil markers to avoid overlapping fertilizer applications (i.e., an excessive application rate).
Figure 2.6 Phosphate management
Source: TNAU AGRITECH PORTAL.
2.11 Livestock and grasslands management
Approximately 50% of the earth’s terrestrial surface is classified as rangeland and grassland. Rangeland and grassland ecosystems provide forage for livestock and native herbivores, habitat for native flora and fauna, watersheds for rural and urban uses, ecosystem goods and services, areas for recreation, and renewable and nonrenewable energy sources (CTCN, 2014).
Livestock and grasslands management includes the following practices:
• Integration of fodder shrubs and cactus in the feeding of small ruminants,
• Feeding strategies for sustainable cattle production,
• Ruminants and greenhouse gases: sustainable feeding strategies,
• Cut-and-carry forage systems.

38
Compendium of Practices in Climate-Smart Agriculture and Solar Irrigation
Case study 2.11.1 Integration of fodder shrubs and cactus in the feeding of small ruminants in the arid zones of North Africa
In the arid and semi-arid zones of North Africa, animal feed resources are fluctuating and insufficient. Small ruminants are basically fed on rangelands. During the last three decades, the contribution of rangelands to the needs of livestock decreased from 80 to 30%. Therefore, to reduce the increasing deficit of feed resources and to preserve the rangelands, large-scale plantations of spineless cactus (Opuntia ficus indica, varinermis), acacia (Acacia cyanophylla, Lindl.), and Atriplex (Atriplex nummularia and A. halimus) were established (400,000 hectares in Tunisia).
The benefits of these species include high biomass yield, evergreen character, drought resistance, tolerance to salinity and soil adaptability. These
plantations were first established mainly on communal lands, but recently more and more have been established on mixed crop/livestock farms and private land.
Opuntia and shrubs are planted in wide rows, allowing cereal cropping (mainly barley) in between. Animals may therefore graze on the increased herbaceous biomass between the rows during spring and stubbles during the summertime. The seasonal supply of feed is then better adjusted to the animals' needs, and livestock feeding is based more on farm resources than on commercial feeds.
Nutritionally, the above-mentioned species complement each other. Opuntia, rich in water and carbohydrates, gives sufficient energy, Atriplex provides protein and acacia is a fiber source. Cactus helps to meet the animals' water requirement. In addition, cactus pads are rich in vitamin A (almost the only source under harsh conditions) and in readily available carbohydrates (Nefzaoui, 1996).
Case study 2.11.2 Feeding strategies for sustainable cattle production, Swaziland
Cattle play a pivotal role in the social and economic welfare of the Swazi people. The major challenge however, is how to ensure that cattle production continues to meet the needs of the present Swazi generation without compromising the ability of future generations to meet their own needs. This section describes the characteristics of the cattle production environment on Swazi Nation Land (SNL), highlighting the linkage between the production environment and cattle productivity. The section singles out nutrition as the most important factor limiting cattle productivity on SNL, and yet in Swaziland, it argues, there exist vast feed resources that are unused or poorly utilized and could make a major impact on cattle production.
Picture 2.4 Cut-and-carry forage systems
Source: CTCN, 2014.

39
Compendium of Practices in Climate-Smart Agriculture and Solar Irrigation
There is a need to develop low-cost feeding packages utilizing crop residues and agro-industrial by-products especially for winter-feeding, and to adopt integrated farming systems in which livestock production complements crop production for efficient and sustainable use of resources and environmental protection (Ocen, 1999).
Ruminants and greenhouse gases: sustainable feeding strategies to balancing the issues.
Domestic ruminants contribute 16.5% of total methane emissions to the environment and 3.5% to the global warming effect. Methane emissions need to be reduced by 10–20% to stabilize the methane concentration in the atmosphere. Emissions of methane from ruminants can be reduced in two ways: reducing per animal emission by efficient fiber digestion and reducing the number of ruminants by efficient nutrient utilization. Feeding strategies based on fossil fuel-demanding concentrated diets produce more C02 and consume valuable natural resources while reducing methane. The second most-used feeding strategy uses low-quality forages and agro-industrial by-products. Even though this practice reduces the problems associated with the first one, it emits more CH4 due to the deficiencies of many critical nutrients required for efficient microbial activity in the rumen. These critical nutrients are N, minerals such as P and S, readily available carbohydrates, true proteins and rumen undegradable proteins. Protozoal activity and low undegradable protein levels reduce both the quality and quantity of the amino acids and other nutrients absorbed in the small intestine. The composite result of the second feeding practice is increased total CH4 emissions. Among the solutions, tree legumes could play a pivotal role. Feeding strategies for ruminants should be based on materials such as forages and agro-industrial by-products that consume fewer fossil fuels and natural resources. However, unless the problems associated with these resources are not properly corrected, this strategy will not be productive (National School of Business Management (NSBM), 2006).
Cut-and-carry forage systems based on nitrogen-fixing plants.
Increasing population growth and limited resources present a challenge to the development of Asia, especially in the impoverished uplands. The people living in the slope lands of Asia are generally plagued by poverty and constant soil erosion, both of which hasten the downward spiral in their quality of life. Livestock systems show a great potential for improving the Asian uplander’s quality of life and helping to break this poverty cycle. However, as more and more animals are introduced into these fragile areas, good-quality management schemes for raising the livestock are needed to ensure sustainability. Cut-and-carry forage systems show promise as a way of meeting these requirements (Palmer, 1998).
The cut-and-carry production system for animals is not a new concept. Asian farmers have been using a similar system for hundreds of years. The idea is to pen the animal, preferably off the ground with some type of slatted flooring for ease of waste collection and to prevent disease.
Adequate space is given for the animal in the pen to move about, but not so much that it wastes energy in exercise. The feed, primarily forage, is then brought to the animal in appropriate amounts and intervals to effect maximum growth.
This system works best with the ruminants who depend upon a high forage intake. Thus cattle, goats and sheep show the greatest potential for cut-and-carry systems based on nitrogen-fixing legumes.
Some smaller exotic animals, such as rabbits and guinea pigs, also seem to be highly suitable for cut-and-carry systems. A general rule of thumb is to give freshly cut forage to an animal equivalent to about 10% of its body weight each day. Ideally, half should be given in the morning and the remaining half in the evening, so the animal can make more efficient use of the forage.
Advantages:
• Land utilized more efficiently for production,
• Better per unit production,
• Better control of animals,
• Centralization of animal waste production.

40
Compendium of Practices in Climate-Smart Agriculture and Solar Irrigation
• Addition of “free” N into system (The highest cost in an animal production system is the feed, while the most expensive feed ingredient is protein. The utilization of nitrogen-fixing plants such as rensonii, leucaena, "Madre de Cacao" and indigofera as high-protein forages can help supply a great deal of this needed protein. Moreover, the N utilized to build the proteins in the forage comes largely from atmospheric nitrogen, fixed by the roots of the plants through a symbiotic relationship between their roots and soil organisms).
• Good community relations. Traditional farming systems allow certain animals to roam at will and browse for their food. This system is seen as economical as well as labor-saving. However, with increasing population pressure, free-grazing animals are often a nuisance and a source of conflict in many villages across Asia, destroying gardens, crops and forests.
Disadvantages:
• Labor demand,
• Possible adverse effects of feeding,
• High levels of legumes. Problems of this type can be easily overcome by introducing these forages slowly into the livestock feed, combined with a good testing program for capability,
• Possible infectious disease outbreaks. (Animals raised in close proximity to each other do have a higher risk of disease spread. Good sanitation and good management practices will do much to correct this problem.),
• Cost of housing. (One of the biggest deterrents to adopting a cut-and-carry system is the cost of the pens to house the animals. This can partially be overcome by using local materials which are low-cost and grown on the farmer’s own farm.),
• Management skills required. Breeding habits and signs for each animal must be learned by the farmer, in order to ensure timely breeding of penned animals.
To summarize, cut-and-carry animal production systems are the future for most of Asia. Increasing population pressures make the confinement of animals
necessary. Free-grazing animal systems compete with food production and contribute significantly to the destruction of Asia’s remaining forests. Forage systems based on nitrogen-fixing crops for cut-and-carry production show great potential for increasing productivity and promoting more sustainable systems. There are both advantages and disadvantages to this type of production system, but the advantages tend to outweigh the disadvantages.
In Asian agriculture in the future, there will be an ever-increasing need to maximize production from limited land resources. Cut-and-carry animal production systems show great potential, while the use of nitrogen-fixing forage crops will make those systems more productive and sustainable.
systems show great potential, while the use of nitrogen-fixing forage crops will make those systems more productive and sustainable.
2.12 Breeding for climate change
Breeding for drought and heat
Drought-tolerant plants typically make use of either C4 carbon fixation or crassulacean acid metabolism (CAM) to fix carbon during photosynthesis. CAM is particularly good for arid conditions because carbon dioxide can be taken up at night, allowing the stomata to stay closed during the heat of day and thus reducing water loss (CTCN, 2014).
Many adaptations for dry conditions are structural, including the following:
• Adaptations of the stomata to reduce water loss, such as reduced numbers or waxy surfaces.
• Water storage in succulent above-ground parts or water-filled tubers.
• Adaptations in the root system to increase water absorption.
• Trichomes (small hairs) on the leaves to absorb atmospheric water.

41
Compendium of Practices in Climate-Smart Agriculture and Solar Irrigation
Case study 2.13.1 Breeding for adaptation to drought and heat in cowpea
Accomplishments in breeding for adaptation to drought and heat are reviewed based upon work with the indeterminate grain legume species cowpea. Plant traits and some crop management methods are examined that influence adaptation to rainfed production in the drought-prone, semiarid tropical Sahelian zone of Africa. Drought escape, drought resistance, delayed leaf senescence, and varietal intercrops are examined. In addition, adaptation to heat that can detrimentally impact irrigated production in the hot, subtropical arid zone of California is evaluated. Heat tolerance during reproductive development, electrolyte leakage, membrane thermostability, some aspects of crop management including date of sowing, and chilling tolerance during emergence including the beneficial effects of a dehydrin protein are considered. Methods for breeding cowpeas with adaptation to drought and heat that have been effective are described (Hall, 2004 in CTCN, 2014).
Scuba and aerobic rice
New rice varieties—dubbed “scuba rice” because they can withstand complete water submergence for up to 17 days and then yield well—are saving vulnerable crops and livelihoods. This rice is especially needed in flood-prone South Asia.
Aerobic rice is a production system where rice is grown in well-drained, non-puddled and non-saturated soils. The highest yields under aerobic conditions were realized in the dry season with the improved upland variety Apo (5.7 t ha−1) and the lowland hybrid rice Magat (6 t ha−1). On average, the mean yield of all varieties under aerobic conditions was 32% lower under aerobic conditions than under flooded conditions in the dry season and 22% lower in the wet season (CTCN, 2014).
Case study 2.12.2 Yield and water use of irrigated tropical aerobic rice systems in the Philippines
Increasing water scarcity necessitates the development of irrigated rice systems that require less water than traditional flooded rice. In irrigated aerobic rice systems, rice grows in non-flooded and non-saturated soil under supplemental irrigation. The development of such systems should start with the identification of promising varieties and the quantification of yield potential, water use, field water outflows and water productivity.
The report is about the results of growing different tropical upland and lowland rice varieties under irrigated aerobic conditions during six seasons in 2001–2003 at the International Rice Research Institute
The high yields were obtained in relatively wet soil with seasonal average soil moisture tensions in the root zone of 10–12 kPa and with maximum values of around 40 kPa. Total water input was 1,240–1,880 mm in flooded fields and 790–1,430 mm in aerobic fields. On average, aerobic fields used 190 mm less water in land preparation and had 250–300 mm less seepage and percolation, 80 mm less evaporation, and 25 mm less transpiration than flooded fields. Without plastic sheets to prevent seepage in flooded fields, the water productivity of rice (with respect to rainfall and irrigation water input) under aerobic conditions was 32–88% higher than under flooded conditions. It is concluded that the concept of aerobic rice holds promise for farmers that do not have access to enough water to grow flooded lowland rice. More research is needed into the development of improved varieties, the optimization of crop and water management, and the sustainability of aerobic rice under continuous cropping (Bouman et al., 2005 in CTCN, 2014).

42
Compendium of Practices in Climate-Smart Agriculture and Solar Irrigation
Case study 2.12.3 Participatory on-farm evaluation of the performance of drought-tolerant maize varieties in the guinea savannas of Nigeria
Maize is an important food crop in the Guinea savannas of Nigeria where it is gradually replacing the traditional cereal crops, such as sorghum and millet, because of its high productivity. Despite its high yield potential, maize production is faced with numerous constraints. One of these is drought both at the beginning and during the growing season, which significantly reduces grain yield. Therefore, early maturing varieties that are tolerant to drought or extra-early maturing varieties that escape drought are desirable in these communities. Efforts are being made at IITA to develop or identify drought-tolerant maize varieties that are adapted to the Guinea savannas of West Africa. This study evaluated three maize varieties that have been identified either to tolerate or escape drought. The drought-tolerant maize varieties were evaluated on farmers' fields for two years in two federal states of northern Nigeria. Generally, the on-farm yield of the maize varieties evaluated was higher than the average grain yield reported for northern Nigeria. Farmers differed in their preferred choice of varieties. In the relatively market-driven production systems in the communities in Borno State, the early-maturing and high-yielding drought-tolerant variety (TZE-COMP 3
DT) was popular. Since this variety attains physiological maturity in late September when rainfall is less, it can be harvested and processed for sale. It therefore has high potential for adoption in these communities. On the contrary, in the relatively resource-poor sorghum-based production systems in Kano State, extra-early maturing varieties (95TZEE-W and 95TZEE-Y) were preferred to provide food security during the period of food scarcity in August and September. The emphasis was therefore more on earliness of crop maturity than on high yields (Kamara et al., 2006 in CTCN, 2014)..

43
Compendium of Practices in Climate-Smart Agriculture and Solar Irrigation
Module 3 Solar-powered irrigation system (SPIS) This module focuses on solar-powered irrigation systems.
The first solar pumps were installed in the late 1970s. Since then, PV water pumping systems have shown significant advancements. Global interest in solar irrigation emerged in 2015 when the Food and Agriculture Organization of the United States Agency for International Development (USAID), the Government of Sweden (SIDA), the Government of Germany (BMZ), Duke Energy Corporation and the United States Overseas Private Investment Corporation (OPIC) (collectively, the “Founding Partners”) combined resources to create the initiative Powering Agriculture: An Energy Grand Challenge for Development (PAEGC). The objective of PAEGC is to support new and sustainable approaches to accelerate the development and deployment of clean energy solutions to increase agriculture productivity and/or value for farmers and agribusinesses in developing countries and emerging regions that lack access to reliable, affordable clean energy.
There is an increasing demand for irrigation due to the need for higher food production for a rising world population and decreasing supplies of freshwater in the
3.0. Brief Overview
context of a changing climate. High diesel and electricity costs and often unreliable energy services affect the pumping requirements for irrigation for small and large farmers. In many rural areas, grid electricity is not, or is only sporadically, available. Using solar energy for irrigation water pumping is a promising alternative to conventional electricity and diesel-based pumping systems. Solar water pumping is based on photovoltaic (PV) technology, which converts solar energy into electrical energy to run a direct current (DC) or alternating current (AC) motor-based water pump.
Solar water pumping is found to be economically viable in comparison to electricity or diesel-based systems for irrigation and water supplies in rural, urban and remote regions. The investment payback for some PV water pumping systems is found to be 4–6 years (e.g., in India). However, while solar irrigation is a particularly attractive technology that can combine both access to low-carbon energy and increased climate resilience and food security, it is not appropriate in all contexts and has inherent risks (such as groundwater overuse). Thus, a focus on when and where solar irrigation is and isn’t an attractive option is a key issue for consideration.
Solar-powered irrigation systems need to be adequately managed and regulated to avoid the risk of unsustainable water use. Two tables below present the advantages and disadvantages of solar-powered irrigation.

44
Compendium of Practices in Climate-Smart Agriculture and Solar Irrigation
Table 3.1 Advantages of solar-powered irrigation
Socio-economic advantages Environmental advantagesFarm level National level
Financing and the cost of solar panels continue to drop, making SPIS economically viable and competi-tive with other sources of energy.
Potential for job creation in the renewable energy sector (pro-ducers, suppliers, services).
No greenhouse gas emissions = climate mitigation.
Rural electrification and access to renewable energy, especially in remote areas and in humanitarian crisis situations.
Contribution to rural electrifi-cation and renewable energy targets.
Potential for adaptation to climate change by mobilizing groundwater resources when rains fail or rainfall patterns are erratic.
Independence from volatile fuel prices and unreliable and costly fuel supplies.
Reduced dependence on energy exports. Energy subsidies for fossil fuels can be reduced while offering an alternative to farmers and rural communities whose livelihoods would other-wise be negatively affected.
Potential for improving water quality through filtration and fertigation systems (more efficient application of less fertilizer overall). Less pollution resulting from inadequate fuel han-dling (diesel pump.
Reduced cost for water pumping in the long run. If system is being modernized for pressurized irrigation, increases in energy costs are offset through the use of solar energy
Potential for increasing agricultural productivity and income due to improved access to water (additional cropping season, diversification of cropping pattern, higher value crops). Potentially more efficient use of water if combined with drip or other water- efficient irrigation technologies
Food security may be improved
Potential for income diversification due to multiple uses of energy (e.g. feed-into grid, lighting, cooling) and water
Rural development through improved access to water and energy.
Potential for new and innovative forms of financing and service models as well as organizational struc-tures to finance and use SPIS (shared economy)
Lower hourly yields, over more hours per day, which allow for gentler abstraction of sensitive ground water resources, reducing risk of borehole collapse.
Potential time saving due to replacement of laborin-tensive manual irrigation, which can lead to other income-generating activities. Women and/or children might profit from time not spent on watering anymore.
Source: Bureau, 2018.

45
Compendium of Practices in Climate-Smart Agriculture and Solar Irrigation
Table 3.2 Disadvantages of solar-powered irrigation
Socio-economic disadvantages/disabling framework conditions Environmental disadvantages
Farm level National level
Still relatively high initial investment costs that smallholder farmers, especially, cannot afford or cannot tolerate the risk aligned with the investment.
Existing energy subsidies for fossil fuels and electricity that distort the market; legislation and regulation of energy and agricultural market may hinder the uptake and up-scaling of solar energy systems. Taxes on imported equipment that may distort (and artificially keep up) prices.
Production of PV panels requires some toxins and rare minerals; mining and production of these tends to produce environmentally harmful waste; panels need to be correctly disposed of to avoid environmental harm.
Finance is not accessible or affordable for all, especially for smallholder and tenant farmers
High risk investment, especially if SPIS roll-out programs do not adequately address on-site ownership
Decentralized systems are difficult to regulate (however, SPIS often replace already decentralized systems)
Lack of groundwater management/institutional framework for abstraction.
Risk of groundwater over abstraction, leading to depletion and degradation of groundwater resources.
Design needs to be fit-for-purpose and requires services (typically private sector) to advise farmers on the best system; however, these are often not in place.
Lack of standards for the quality of SPIS.
Optimal operation and maintenance of SPIS requires a certain degree of technical knowledge and skill, so farmers need to be trained and services (extension services or private service suppliers) need to be available.
Lack of systematic training schemes.
SPIS are vulnerable to theft and hence often not covered by insurance as a prerequisite for loan finance.
There is a lack of trust between farmers, utilities, service providers and the government to try innovative forms of finance and of FITs; banks often perceive that SPIS have high risk, due to unfamiliarity with technology.
Source: Bureau, 2018.

46
Compendium of Practices in Climate-Smart Agriculture and Solar Irrigation
3.1. Economic viability of solar-powered irrigation
Although costs have decreased significantly in recent years, the economic viability of PV systems varies. Payback periods differ widely from country to country, depending on site conditions, crops and markets, as well as on energy sources, such as fuel (diesel, petrol or liquefied petroleum gas) and prices, which may be subsidized. Numerous site- or country-specific economic feasibility studies exist (Prieseman, 2015 in FAO, 2018), though they are often not relevant for general use as they look at specific configurations and socio-economic contexts (e.g., community-owned system vs. single farm use).
Improving financial conditions for the user
1. It is possible to support financing institutions (such as microfinance institutions) that are already familiar to farmers. This can be done by:
• Using social group guarantees and collateralizing the financed asset, providing additional insurance and technical assistance.
• Involving an intermediary. An example is provided by CoolCap in Kenya, a social capital organization designed to support smallholder farmers in Africa. It buys equipment from the vendors in bulk and sells it to the farmers at 10% interest, repayable at harvest. Farmers deliver their harvest to their buyers, who deduct the farmers’ payment from a portion of harvest proceeds and remit to CoolCap.
• Introducing an interest buy-down subsidy, which reduces monthly payments for the farmer. A similar program for solar water heating equipment was tested in Tunisia (UNEP – Prosol, 2017 in FAO, 2018) with much success. In this case, the customer pays the monthly payments to the electricity company.
2. Local banks could augment their lines of credit to farmers so as to enable the adoption of new machinery (e.g., SPIS, mills, small stationary threshers). In many cases at present, lines of credit are only for seed and other supplies provided at the beginning of the growing season (Banerjee, 2017 in FAO, 2018).
3. To upscale solar-powered irrigation, increasing access to credit is necessary not only for farmers,
Table 3.3 Advantages and disadvantages of solar-powered and diesel-driven systems
Type Advantages Disadvantages
PV pump Unattended operation High investment costs
Low maintenance costs Water storage may be required as pump operates at sub-optimal levels when it is cloudy/rainy, and not at all during the night
Long lifetime, approx. 25 years (low average yearly costs)
Repair often requires skilled technicians
Diesel pump Fast and easy installation Fuel supplies erratic and expensive/High operational costs
Low investment costs High maintenance costs
Short life expectancy
Noise and air pollution
Source: FAO, 2018.

47
Compendium of Practices in Climate-Smart Agriculture and Solar Irrigation
but also for local entrepreneurs. Multinational companies dominate the off-grid industry (Schuetzeichel, 2017 in FAO, 2018); local and regional small and medium-sized enterprises need support. Small and medium enterprises are the main drivers for innovation, poverty reduction, employment generation and social integration. The lack of small and medium enterprises in developing countries is a significant obstacle.
4. Duty waiver for solar products (PV panels, controllers, pumps, etc.) can reduce the purchase price for the farmer.
5. Contractor models are another option, whereby payments are made to the contractor depending on the amount of water delivered from the pumps (WEF, 2015 in FAO, 2018), using solar portable pumps to provide pay-as-you-go services (Energypedia Pay-Per-Use, 2017 in FAO, 2018).
6. The company selling the equipment can also use pay-as-you-go models. Matching repayments with the cash flow of the farmer (paying small monthly installments during the growing season and more after the harvest) will help the farmer to afford the equipment. Rent-to-own is a similar model.
7. Non-formal credit can be provided by relatives, employers or the non-formal sector.
Designing subsidies strategically
1. Subsidies can be strategically designed to support change in water management agricultural practices and even gender equity. The country case study of Nepal is a good example. The government in Nepal offers a grant model, whereby 60 percent (for women farmers, it is 70%) of the purchase price of the solar irrigation system is paid for. Such grants can be tied to conditions designed to avoid over-pumping or market distortion.
2. Further studies are needed to understand the distorting impact of direct subsidies for equipment, as this may affect market development and inflate prices. This has been experienced in India and led to a revision of the central government subsidy scheme in 2017.
3. It is important to make users—such as farmers, agricultural extension support services and other public and private actors—aware of opportunities for financial support (and subsidies).
Supporting the development of financial tools
REFINe is an interactive Web tool that helps users better understand experiences with financial instruments to scale up renewable energy technologies. The tool can be used to identify financial instruments that can be used to overcome project risks and barriers. REFINe is intended to assist policy-makers in low-income countries in identifying how to apply financial instruments funded from public and concessionary sources to support the scaling up of commercially proven renewable energy technologies.
3.2 Challenges with solar irrigation
a) Installation of the system, operation and maintenance
• Lack of awareness regarding SPIS potentials, risks and options.
• Lack of advisory services for farmers and other end users.
• Lack of technical skills, from planning to installation, operation and maintenance, at the supplier and agricultural extension levels.
• Initial teething issues during first months of operation.
• Lack of tailored solutions for farmers.
• Unavailability of spare parts.

48
Compendium of Practices in Climate-Smart Agriculture and Solar Irrigation
• Service deficiencies, as services are often concentrated in the country’s capital.
• Sand and dirt, rodents and/or insects in the borehole or well.
• Termites and/or rats destroying the plastic of electrical cables and PVC pipes.
• Water quality (e.g., iron content).
• Theft and/or vandalism of panels and/or pump.
• Poor siting, with shading part of the day or wrong orientation of the PV panels.
b) Quality control of solar equipment
The development and use of existing technical specifications and standards can support government authorities in the preparation of tender documents and help manufacturers to work towards common goals. When widely accepted, technical standards can contribute to lower production costs, reduce installation time and facilitate repair. Standards also foster fair and transparent competition, as all actors in the market must play by the same rules.
Government-funded programs should ensure quality control of end consumer installations and training. Tenders should look at the water output for a defined solar irradiation and pumping head—not the power rating of the pump. Built-in water metering should be a standard requirement for tenders. Independent research and advisory bodies test pumps and related equipment and can provide advice on quality standards and checks (Nassem, 2016 in FAO, 2018).
c) Certification of suppliers in-country
A certification scheme could help to guide end users in choosing the most reliable product and service provider for their situation. Planning, design and installation should follow acceptable standards, and after-sales service should be guaranteed. A certification scheme of suppliers could be a first step to create confidence and trust and weed out non-qualified suppliers. Mexico is one of the countries with such a certification scheme for SPIS suppliers and installers (Fillad, 2017 in FAO, 2018).
d) Standardization in the field of renewable energy
Sound standardization processes can support innovation
in renewable energy technologies by documenting and spreading information on state-of-the-art technologies, leveling the playing field for innovative products, allowing more focused research and development and closing the gap between research and development and marketable products. When well designed, standardization also provides an effective framework for the commercialization and diffusion of technologies by harmonizing information flow, understanding technical product design for interoperability of components and manufacturing and service requirements, and establishing common rules and quality requirements.
Benefits of standardization include decreasing product costs, reduced transaction costs through simplified contractual agreements and use of standardized components—a common language and understanding regarding what a product or service is or is not and increased levels of quality and safety for consumers (IRENA, 2013 in FAO, 2013).
As a young industry, solar pump manufacturers and intergovernmental agencies have yet to make an effort to establish common rules or quality requirements or even a common language for components, parts and services.
e) Water management using solar-powered irrigation
One of the main risks of SPIS is the indiscriminate use of water resources. The risk is that farmers will consume more water than they did before the introduction of SPIS, by (i) applying more water in the field overall (for example, when shifting from deficit to optimal irrigation, or simply over-irrigating); (ii) expanding the area of land under irrigation; (iii) growing higher-value, but often more water-intensive, crops; or (iv) selling water to neighboring farmers and communities, which is an issue in India.
Water efficiency at the field or farm level can also have implications at the basin level. Changes in water use in one domain may lead to unintended or undesirable consequences locally or downstream. It is therefore important to systematically study the current status of and trends in the water supply, demand, accessibility and use (FAO, 2018). This is called water accounting. When assessing the impacts of solar-powered irrigation on water use efficiency, it is important to distinguish

49
Compendium of Practices in Climate-Smart Agriculture and Solar Irrigation
between these different levels of analysis (field, farm, scheme, and basin) and to carry out systematic water accounting to understand what options exist for optimizing water use overall.
These efforts need to be complemented by appropriate regulation and policies. Investment and incentive programs may follow specific criteria (e.g., installations only in areas where groundwater is not overexploited) or encourage water savings. Tenders may set standards (e.g., groundwater metering and apps for monitoring as part of SPIS); regulations may restrict SPIS use at certain times or places. Water governance in general—and groundwater governance in particular—is a complex issue that requires context-specific interventions.
f) Improving system viability at the farm level
• In many cases, the introduction of solar pumps is coupled with measures to improve the efficiency of irrigation and on-farm water management methods (e.g., drip or sprinkler irrigation, rainwater harvesting) (Salman, 2016 in FAO, 2018) or agricultural practices (e.g., change of crops, organic fertilizer, polyhouses) to increase the viability of the system overall.
• The option exists to use the solar energy produced on-farm for uses other than water pumping. The farmer then has a choice about whether to run the solar pump or to use the energy for other purposes.
• While further innovation and development are needed, possible on-farm applications powered by solar energy include solar-run pivot systems, harvesters, rice huskers, grinders and mills, cold storage and water purifiers. Such systems need to be designed to purpose in order to ensure optimal performance and cost-effectiveness.
g) Rules for groundwater abstraction
Legal and regulatory frameworks for groundwater abstraction have often been inadequate, and their application has proven problematic. Modern legislation on groundwater—and other laws affecting groundwater—are found in almost all countries. Laws typically cover ownership and use rights, protection from pollution, and institutional arrangements for
management and regulation. The explosive growth of
unregulated groundwater use and the resulting problems have prompted many countries to try to redefine groundwater ownership and use rights. Some options and considerations are as follows:
• Thorough water accounting is needed to make informed, evidence-based decisions about water allocation and management.
• Drilling permits for new boreholes should be given out and registered with a designated institution or government agency.
• Some countries consider thresholds for water abstraction beyond which water users have to pay a set fee. However, this is difficult to enforce unless new methods for monitoring, such as satellite imagery or drones, as well as flow meters in tubes like in municipal distribution systems, are used.
• In some countries, electric power supply to wells is rationed and restricted to certain hours per day to limit pumping.
• Practicing sustainable groundwater use is in the self-interest of farmers and stakeholders of solar-powered agricultural development (FAO & GIZ, 2017 in FAO, 2018). In Mexico, it is done in a participatory way.
h) Cross-sectional policies, programs and plans
Different options exist for coupling subsidy and investment programs with water management practices. These may include:
• Mandatory installation of groundwater metering along with solar pumps;
• Support for rainwater harvesting and conjunctive use of different water sources;
• Coupling of solar pumps with drip irrigation or other potentially water-efficient irrigation methods;
• Capacity building for farmers.
i) Gender equity
Another challenge is inclusion of women in SPIS. Past experiences show that there are significant benefits of solar pumping solutions for women. SPIS are often used

50
Compendium of Practices in Climate-Smart Agriculture and Solar Irrigation
for crops traditionally grown by women, such as fruits and vegetables. For example, in the Sudano-Sahel area of northern Benin, SPIS (with low-pressure drip irrigation) were installed in vegetable gardens that were formerly watered with cans and hauled water. This allowed the women farmers to become net producers of vegetables, generate income from market sales and substantially increase their household nutrition intake and food security (Burney et al., 2009 in FAO, 2018).
As has been the case in the deployment of many rural energy solutions, gender characteristics play an important role in terms of energy decision-making (IRENA, 2016 in FAO, 2018). There have been other examples in which SPIS projects were catalysts for the empowerment of women. In Nepal, for instance, financial support for SPIS by the government was linked to the gender of the beneficiary. Women farmers were given a 10% additional discount, on the condition that the land on which the SPIS were installed was transferred to the woman beneficiary. This experiment generated encouraging results in that 77% of the demand (out of 65 SPIS that were demanded) came from women farmers, and in all these cases, land was transferred to them (Mukherji et al., 2017 in FAO, 2018).
It is important to understand the potential for small-scale technologies to empower women farmers and the best pathways to achieve that. Projects must make a greater effort to reach women with information, especially when it comes to financing and design options (e.g., identifying a convenient irrigation schedule and location of the SPIS system).
3.3. Current Trends
Solar-powered drip irrigation systems
When appropriately sized, solar pumps can support drip, sprinkler, pivot or flood irrigation methods. Depending on the local conditions, a system can also include filtration or fertigation equipment. Solar pumps are often combined with low-pressure drip. The required pressure is typically achieved by pumping water into an elevated water tank and then releasing it through gravity. However, the tank presents an additional expense and is often more expensive than the pump itself. As pressure and flow rate of a solar pump vary with insolation, the direct connection of the drip system to the pump is problematic.
Floating solar systems
Floating solar systems allow standard PV panels to be installed on large bodies of water, such as drinking water reservoirs, quarry lakes, irrigation canals or remediation and tailing ponds. No land resources are used for the PV panels in this case. Reduction of water evaporation, slower algae growth and higher efficiency of the solar panels due to the cooling effect of water on the panels are further benefits. Eco-friendly and easy-to-install systems are already tested and on the market (Hydrelio, 2017 in FAO, 2018).
Solar-driven center pivot or lateral move irrigation machines
Up to now, center pivots were (mainly) associated with large-scale irrigation. In a new development, solar pumps supply water to center pivots. Nevertheless, most existing systems still need an external energy source for their operation, control and drive units, even if the water used is being delivered using solar energy. Developments are underway to run the entire operation on solar energy—preferably without using batteries. Smaller center pivots (2 to 4 spans = 10–15 ha) are being tested at the moment. Larger systems will certainly follow. Solar-powered center pivots (with batteries) are running in field tests along the Nile. This technology is driven by the irrigation and solar industry, satisfying a demand from large-scale farmers. Smallholder farmers could organize and share a center pivot to irrigate nearby land (Hollemann, 2017 in FAO, 2018).
IoT platforms
IoT (Internet of Things) platforms will give SPIS (connected to the Internet, as described previously) the opportunity to receive additional services through this platform based on tracked sensors, flow meters and camera technology. For example, farmers can get a daily pump usage and weather report, along with crop management recommendations. This will no longer be limited to bigger systems. Solar energy will provide the power for data collection and transmission. For all the new technologies, however, intensive education and training will be required.

51
Compendium of Practices in Climate-Smart Agriculture and Solar Irrigation
Electricity feed-in
If an electrical grid is available, the logical step will be to feed in electricity at times when irrigation is not needed. For single crops, irrigation for 70 to 120 days is necessary. For two cropping seasons per year, approximately 200 days are necessary. This means that there are times when energy is produced but not needed for irrigation. It makes sense to sell the generated electricity and feed it into the grid when the pumps are not used. Prerequisites for this strategy are sound institutional framework conditions, such as technical standards for electrical and measuring equipment for connecting with the electricity grid as well as contracts with the relevant electricity company specifying conditions and the feed-in tariff. This may lead to bigger solar pump systems supplying more than one farm, as only bigger systems (i.e., solar generators) fulfill the conditions for double use and are accepted for feed-in by the power companies. Examples in the United States (e.g., California and Nebraska) clearly display this trend. However, smaller systems can also be pooled through a micro-grid and supplied to the power company through a common evacuation point (Verma, 2017 in FAO, 2018). Another approach for using the otherwise unused electricity (when pumping is not required) consists of productive applications that provide additional income; for example, the TAWS model in India, which is currently being tested by the GIZ Indo-German Energy Programme (Ghose, 2017 in FAO, 2018). However, many technical details have to be solved to enable these productive applications (usually for on-farm equipment, such as threshing, harvesting, grading or grinding machines). SPIS suppliers may cancel their guarantees if their systems are used for applications other than pumping for irrigation.
3.4. Future Trends
Planning software
Well-designed and easy-to-use software is available for solar pumping systems as well as for certain irrigation technologies. However, the integration of technology for solar pumps and irrigation is needed and is expected to be available in the future.
Irrigation monitoring
The amount of irrigation water on the field will have to be monitored more precisely and regularly. As water becomes less available, this aspect will play an ever more important role. For this purpose, a differentiation should be made between monitoring water applied, which can be easily measured in pressurized systems with flow meters, and water transpired, which can be assessed through remote sensing technologies measuring evapotranspiration and biomass production. Modern technologies will become increasingly common; for example, monitoring of irrigated fields with drones and thermal imaging cameras. Satellite and thermal imagery is already used to calculate irrigation water demand (and to measure actual supply) for defined areas (e.g., fields, irrigation schemes, and watersheds) and to charge farmers accordingly. An example of a global database is the FAO Water Productivity Open-access Portal (WaPOR) at 200 m, 100 m and 30 m resolution for certain countries.
Solar pump manufacturers’ association
It is expected that solar pump companies will create their own platform; that is, a solar pump manufacturers’ association. This will help to establish standards for the equipment and will allow a comparison of data and information. When successful, smaller companies will probably join in order to benefit from the data-sharing and innovation potential of such an association. Many different industries have moved in this direction, and their stakeholders have profited. A good example is Fachvereinigung Betriebs- und Regenwassernutzung (fbr), the Association for Rainwater Harvesting and Industrial Water Use in Germany, established in 1995. Rainwater harvesting equipment for housing and industrial buildings was not standardized in the 1980s, and systems were not compatible. Bringing manufacturers, planners and users together in an association helped to promote the sector, to develop it further and to standardize and control the quality of equipment.
Weather stations
Weather stations are becoming more important for an optimized irrigation regime and schedule. These

52
Compendium of Practices in Climate-Smart Agriculture and Solar Irrigation
stations can be expanded to become service centers for agricultural crop production as well. This will be possible if their databases are expanded to provide not only weather data but also soil data, such as soil moisture, for the most important crops of the region. Forecasting for the upcoming few days could be made available so that farmers know how much irrigation water has to be provided for each field and crop. This will require a closely linked network of extended weather stations.
3.5. Conclusion
Solar pumps have been around for several decades. However, they were typically used in small-scale systems, as PV modules for large-scale systems were too costly. Prices have gone down significantly, and solar-powered irrigation technologies have become a reliable and viable option for many farmers, providing affordable energy and thus reducing energy costs for irrigation.
Nevertheless, SPIS are relatively complex systems. Their design requires not only a fit-for-purpose PV pump system and irrigation infrastructure (supply side) but also an assessment of water requirements and an irrigation calendar (demand side) as well as skills and knowledge of the end user.
Solar pumping systems are continuously evolving and improving, including configurations with drip irrigation, floating solar panels or purely solar-driven center-pivot irrigation machines. Suppliers of SPIS are increasingly optimizing the whole system, including the solar generator, pump, controller and accessories, plus the irrigation system. Additionally, suppliers now often provide technical support services to satisfy the needs of end users. Another trend is headed in the opposite direction: individual components—PV panels, standard irrigation pumps and available controllers—are offered on the market, and integrators provide services to connect these components into one irrigation system.
Moreover, online technologies will further improve SPIS and make them more versatile. Monitoring
(e.g., groundwater), remote control and extended communication platforms can be expected to be part of even small-scale applications at minimal extra cost.
Possibilities exist for unused electricity (when pumping is not required) to be fed into the electricity grid or to be used for other on-farm productive applications, further increasing the economic viability of SPIS. However, this requires more research and development, as well as specific policy and governance decisions, to support such multiple-use applications.
Case study 3.1 Solar irrigation in Morocco for mitigating climate change
As a climate mitigation measure, the Government of Morocco introduced a two-step reform. First, it has lifted all subsidies on diesel, gasoline and heavy fuel oil. Second, it has introduced Plan Vert to incentivize to use water more efficiently though modern irrigation techniques. Solar-powered irrigation in Morocco represents a confluence of these efforts.
The transition to solar energy is subsidized. The subsidy provides 50% of the capital cost of the solar panels and 80–100% for drip irrigation installation (AgriMaroc, 2017). Investments in solar projects, such as NOOR, also stimulate local manufacturing, as sourcing is focused on local products (IRENA, 2016b). These developments make the uptake of solar technologies in Morocco more likely.
In Morocco, SPIS are economically viable. UNDP-GEF compared the costs of solar, butane, diesel and electricity pumps and concluded that the PV pumps were comparatively cheaper, even when considering different plot sizes and the depth of aquifers from which water is withdrawn. While the government-supported subsidy program is not yet in place, there are a number of other private financing schemes available for SPIS in

53
Compendium of Practices in Climate-Smart Agriculture and Solar Irrigation
Morocco. Nevertheless, not all farmers can make use of such schemes as they require that farms are registered as enterprises, land ownership is certified and collateral is available. Access to finance remains a significant issue for small-scale farmers.
There are a few examples of Energy Services Companies (ESCOs) in Morocco that provide an alternative business model for solar-powered irrigation. Essentially, the ESCO signs a performance contract with the farmer, taking over engineering, supply, financing, installation and maintenance of the solar-powered irrigation equipment. The farmer pays for the energy delivered (or the irrigation water). Another business model that has been considered in Morocco is micro-leasing (Microfinance Gateway, 2017). This is a mechanism whereby solar-powered irrigation equipment is rented to the small farmer by a financial institution (e.g., credit and savings cooperative, microfinance institution or commercial bank).
Another challenge is ground water depletion in Morocco. From a technical viewpoint, the coupling of solar pumps and drip irrigation is an optimal solution, potentially resulting in increased field application efficiency. Nevertheless, to address the risks (or actual problems) of groundwater depletion, drip irrigation is not enough.
Case study 3.2 Women farmers benefit from SPIS
Nepal aims to install 600,000 solar home systems. The Ministry of Population and Environment’s Alternative Energy Promotion Centre seeks to make renewable energy a mainstream resource. With a wide range of prices and no performance or safety standards, solar energy has become a risky investment. Current commercialization barriers are overcome through public-private partnerships that emphasize quality systems, education and demonstrations, linkages with innovative microfinance institutions and partnerships with technology providers (Foster, 2015).
The International Centre for Integrated Mountain Development (ICIMOD) has offered farmers three financial models for SPIS support:
• A grant model, covering around 60% of total investment costs,
• A grant-loan model with a grant component as well as an additional 20% loan at a 5% interest rate per annum,
• A grant pay-as-you-go model, where farmers pay a monthly rental fee for use.
Of the 65 applications received for SPIS finance, 20% were for a grant model, 46% for the grant-loan model and 34% for the grant pay-as-you-go model.
An additional 10% subsidy was offered to female farmers, provided they owned the land on which the SPIS were installed. This was done in consideration of low land ownership of women, who own only 3% of land in Saptari, the district in which the project was implemented.
Social JusticeIn Nepal, women cultivate most of the land, as men migrate in search of jobs in cities and other countries. Nevertheless, female land ownership is very low. In the Saptari district, only 3% of land is owned by women. ICIMOD sought to address this issue by offering an additional 10% for SPIS grants if the application was submitted by a woman and provided she owned the land on which the SPIS would be used. The results were significant. Out of 65 applications, 77% were from women. In most cases, land had already been transferred to them. This shows that the need to transfer legal ownership of land to women was not seen as an impediment to availing the additional discount. It also demonstrates that structural inequities can be reduced through innovative public policy interventions (Mukherji, 2017).
GroundwaterGovernance in Nepal’s Terai plains, abundant groundwater resources close to the surface and high replenishment rates are juxtaposed with the high costs of groundwater extraction due to low electrification rates and high diesel costs. This leads to low agricultural growth rates and high rural poverty (Mukherji, 2012). Regarding irrigation, there is still no strong institution that handles the planning, investment, oversight, monitoring and evaluation of the irrigation sector (Pradhan, 2012). Groundwater regulation is needed. A plan exists but has not yet been approved.

54
Compendium of Practices in Climate-Smart Agriculture and Solar Irrigation
Case study 3.3 Solar panel arrays to offer solution to volatile energy prices in California
Farmers in California (the U.S.) are faced with rising, volatile retail energy prices. Though prices have adjusted somewhat, the installation of solar panel arrays offers a solution to the dilemma of rising electricity bills for many producers.
Green Economy In 1998, California established a program to fund the incremental cost of cleaner-than-required heavy-duty engines (the average power rating of irrigation pumps in California was 184 hp, or 137 kW, in 2003 [California Environmental Protection Agency, 2006]). The California Environmental Protection Agency is closely monitoring emissions of irrigation pumps. In 2015, Governor Jerry Brown introduced a law that called for half of California’s energy to be generated by renewable sources by 2030. The solar energy sector is also an important part of the state’s economy; there are more than 2,300 solar companies in California, and the industry employs over 75,000 residents (Notaro, 2016). An estimated 70–75% of water resources in California and about 8–10% of its primary energy are used for irrigation. Pumps consume about 98% of the total energy use on farms. In addition to improvements in pumping efficiency, renewable energy can offer a more economic, emission-free alternative for farmers.
Finance, investment and business modelsA number of policies and programs promoting the adoption of solar energy technologies are available to farmers and ranchers. For example, the Rural Energy for America Program (REAP) is an ongoing comprehensive program supporting:
• Renewable energy system and energy efficiency improvement, on a continuing basis.
• Renewable energy system feasibility studies, energy audits and renewable energy development (SunPower, 2016).
Groundwater governanceGroundwater management is passive in all other basins and essentially involves the use of federal government grants for building infrastructure to import surface water and supply it to groundwater users in lieu of pumping. In 412 basins, there are no regulations to limit groundwater abstractions.
With the Sustainable Groundwater Management Act (SGMA), established in 2014, the California state government created a framework for sustainable, local groundwater management.
Projects on adapting agricultural water management to climate change are ongoing and are supported by a platform of stakeholders, called the California Water Action Collaborative (CWAC). It focuses on three areas: returning water to the system, building social capital to improve trust across sectors, and driving corporate water stewardship to align with the California Water Action Plan (http://cawateraction.org). The impacts of these extensive groundwater policies and regulations are yet to be determined.
Case study 3.4 Smallholders in Kenya
In Kenya, the agriculture sector contributes about 30% of the county’s GDP and accounts for 80% of national employment, mainly in rural areas. Small-scale farming is largely rain-fed and thus highly vulnerable to climate change impacts, such as unreliable rainfall and frequent episodes of drought. This results in lower and highly unpredictable income streams for the typical small-scale farmer in rural Kenya.
Green economySolar-powered irrigation is becoming a niche in Kenya’s economy, with many small and medium-sized companies developing supply chains and services around SPIS. There are now several companies in Kenya that will

55
Compendium of Practices in Climate-Smart Agriculture and Solar Irrigation
(1) provide or arrange for an appropriate financial payment system; (2) give advice, surveying the site to make a reliable offer; (3) and install, train on-site and provide after-sales support through phone or a visit. It is estimated that there are around 2,000 solar borehole pumps and around 1,000 solar surface pumps (under 2.5 kW) in operation in Kenya. A growing number of technicians and engineers are being employed by the types of companies cited above.
The government is also focused on supporting smallholder farmers. Several support programs, including the Agricultural Sector Development Support Programme, have been set up by the Government of Kenya and six development partners. These programs aim to strengthen the role of smallholder farmers in Kenya’s agriculture sector.
The Kenyan government is refraining from charging value-added tax on solar kits in order to make these kits more affordable. The country’s draft National Irrigation Policy proposes more incentives for farmers to buy such devices, including lower import taxes. Nevertheless, the government has also been criticized for hampering the drive for more renewable energy and mini-grid solutions through unrealistic target-setting, legal barriers, complicated procurement procedures and lack of standards.
Finance, investment and business modelsEquity Bank and microfinance institutions, such as Juhudi Kilimo (owned by farmers), offer credit lines for solar-powered irrigation. Different options for loan prerequisites and repayments are offered—for example, harvest cycle repayments. There are also equipment suppliers for solar-powered irrigation that offer credit lines for their customers.
Groundwater governanceKenya has a well-designed water management framework as well as a draft National Irrigation Policy (Republic of Kenya, 2015). Accordingly, water use is regulated through permits defining water use, volume authorized for abstraction and the duration of the permit.
Nevertheless, the implementation of these laws, policies and regulations is ad hoc at best. Water is commonly perceived as a private resource belonging to the owner
of the land and is typically exploited for short-term gain, ignoring the long-term consequences of unregulated use. Groundwater management decision-making is sector-based and, on the whole, ad hoc; there is no mechanism for coordination or for fostering cross-sector linkages. Consequently, the management of groundwater resources has continued to be carried out in isolation from the management of land and other land-based resources, with the inevitable consequence that the implications of management decisions in critical areas—such as physical planning, land use planning and agricultural activities—have often been overlooked.
Case study 3.5 Groundwater governance in Mexico
Mexico’s agriculture sector is divided into two groups: (1) modern farms that are highly technological and integrated in world markets and (2) small-scale and subsistence farmers, which constitute the majority and are mostly marginalized and food-insecure (FAO Mexico, 2016). At the same time, groundwater depletion due to over-abstraction is a critical issue; the main user being the agriculture sector.
The government subsidizes electricity for pump systems for agriculture, which is one reason for over-pumping. The real challenge is registering the water rights of the many dispersed agricultural users—who together account for at least 80% of the total volume pumped—and monitoring their withdrawals (Shah, 2014).
Green economyMexico is blessed with sunshine, particularly in the northern and western areas of the country. In 2005, the federal tax law was amended to allow for 100% depreciation of the capital expenses for renewable energy investments in its first year. Two years later, in 2007, a model interconnection agreement was developed for renewable energy projects to facilitate their connection to the electricity grid.
A renewable energy law (LAERFTE) and the Law on the Sustainable Use of Energy followed. These new laws help pave the way to eliminate barriers for new projects and technologies and encourage growth in the installation

56
Compendium of Practices in Climate-Smart Agriculture and Solar Irrigation
and development of new projects. Large-scale solar pump systems for irrigation in Mexico are few, as grid power is reliable and heavily subsidized (tariff 9CU: 0.033 USD/kWh and tariff 9N: 0.016 USD/KWh),
Finance, investment and business modelsTwo different schemes are supporting solar-powered irrigation at present, both administered through the Secretaría de Agricultura, Ganadería, Desarrollo Rural, Pesca y Alimentación (SAGARPA), Mexico’s Ministry of Agriculture:
• The support program for renewable energies in the agriculture sector is designed for highly productive provinces and subsidizes SPIS at 50%.
• Through the support progra for rural arid areas, farmers can get up to a 70% subsidy for solar-powered irrigation.
Both programs are restricted to specific areas. These areas and attached conditionalities change every year.
The conditions for the programs are rather complicated. Farmers have to apply and produce a business plan, which needs to be validated by SAGARPA. A specific emphasis is placed on assessing water sources to be used for the irrigation system. The decentralized offices of SAGARPA are often not aware of all the different support programs, and farmers generally do not know about them either. The best channel for communication seems to be that solar equipment suppliers inform farmers and help them to apply and fill out the forms. Banks are currently not providing loans for solar irrigation projects. The bank credit available for solar panels is “CIBanco,” but it applies only for on-grid installations for consumers with high electricity tariffs (Fillad, 2017).
Social JusticeThe support program for rural arid areas by SAGARPA focuses on areas with high poverty rates and a strong degree of marginalization. Subsidies can be as high as 70% of the total cost of the irrigation system, as described above. However, SPIS technology is unknown to most of the farmers, due to the very low number
of installed solar pump systems relative to the size of the country. Small farmers are not used to applying for subsidies and often do not fulfill the criteria for approval. Getting permission for a new well is nearly impossible for a small farmer.
Groundwater governance’Even with an ambitious water law, Mexico is grappling with basic groundwater management issues, such as registering wells and issuing water use permits (Shah, 2014). CONAGUA helped establish technical committees for groundwater (COTAs) as user-based groundwater management organizations. The idea was to transfer responsibility for managing aquifers to the users. Nevertheless, there were no further rights or budgets allocated to the COTAs, making them financially dependent on support from the federal or state governments and in dire need of technical support.
Summary• The challenges with solar irrigation vary from country
to country. The main challenges relate to policies and regulations for promotion of green economy, financing, and ground water depletion;
• Ground water is generally poorly regulated. The severity of this problem varies from country to country and appears to be more drastic in India;
• There are differences in opportunities for solar irrigation within a country;
• The issue of social justice: there are differences in challenges among farmers as they are not a homogeneous group: there are women, men and youth; large-scale farmers and small holders. Women and youth can particularly benefit from solar irrigation due to subsidies based on the change in land tenue in their favor.

57
Compendium of Practices in Climate-Smart Agriculture and Solar Irrigation
Module 4. Modeling solutions
This module is about modeling solutions. Modeling tools are useful technologies to assess climate change impacts on crop production and assist making decisions of which crops to grow, where, when and under what climatic conditions. This section reviews several models applied at World Agroforestry.
4.0. Agricultural Production Systems sIMulator (APSIM) and Crop Ecological Requirements Database (ECOCROP)
The Agricultural Production Systems sIMulator (APSIM) is a comprehensive model developed to simulate biophysical processes in agricultural systems, particularly as they relate to the economic and ecological outcomes of management practices in the face of climate risk. It is also being used to explore options and solutions for the food security, climate change adaptation and mitigation and carbon trading problem domains. From its inception twenty years ago, APSIM has evolved into a framework containing many of the key models required to explore changes in agricultural landscapes, with capabilities ranging from simulation of gene expression to multi-field farms and beyond (APSIM, 2020).
APSIM resulted from a need for tools that provided accurate predictions of crop production in relation to climate, genotype, soil and management factors while addressing long-term resource management issues. APSIM is structured around plant, soil and management modules. These modules include a diverse range of crops, pastures and trees, soil processes—including water balance, N and P transformations, soil pH, and erosion—and a full range of management controls.
The APSIM modeling framework is made up of the following components:
• A set of biophysical modules that simulate biological and physical processes in farming systems,
• A set of management modules that allow the user to specify the intended management rules that characterize the scenario being simulated and that control the simulation,
• Various modules to facilitate data input and output to and from the simulation,
• A simulation engine that drives the simulation process and facilitates communication between the independent modules.
In addition to the science and infrastructure elements of the APSIM simulator, the framework also includes:
• Various user interfaces for model construction, testing and application,
• Various interfaces and association database tools for

58
Compendium of Practices in Climate-Smart Agriculture and Solar Irrigation
visualization and further analysis of output,
• Various model development, testing and documentation tools,
• A web-based user and developer support facility that provides documentation, distribution and defect/change request tracking.
World Agroforestry, together with Adaptation to ClimatWorld Agroforestry, together with Adaptation to Climate Change and Insurance, Deutsche Gesellschaft für Internationale Zusammenarbeit (GIZ) and the Ministry of Agriculture (MoA), applied the APSIM crop model to assess climate change impacts on crop production in Busia and Homa Bay Counties in Kenya (Keating et al., 2003).
Because not all required data were available, modeling was based on proxy. It was identified that climate responses quantified by APSIM only include the direct effects of weather on crop yield. Yet much of the yield variability likely stems from indirect effects, or from phenomena that are unrelated to weather. Pests and diseases are a major factor that is influenced by weather. This effect can amplify or compensate the direct weather effects and thus shall be considered.
APSIM is adequate for modeling the production of annual crops. Unlike more empirically based models, a process-based model of APSIM can differentiate between various phases of crop development, which may be impacted by weather in different ways. It thus produces a good estimate of how and when crops are susceptible to adverse weather.
While developed initially for modeling Australian crop production systems, APSIM has been applied successfully in many countries, across diverse climatic zones. An important feature of APSIM is that it not only has an easy-to-use user interface but also provides the option of running models in “command line” mode (directly from the operating system).
For preparing APSIM simulations in Kenya, the user interface was used to design appropriate crop management systems, and the instructions for running the simulation were then modified to accommodate different sets of weather records and soil types (Keating et al., 2003).
However, with few exceptions, perennial crops cannot be modeled with APSIM, and for most crops, no process-based models exist. Modeling yields of perennial crops could only be achieved via empirical correlations of yields with certain environmental factors. Since empirical models are not based on a thorough understanding of climate responses of all the processes that lead to crop yields, model validity under different climate regimes or in a different location is questionable. The physiological processes of most annual crops are much better understood, allowing process-based modeling. As another important difference between annual and perennial crops, productivity of a tree crop is determined not only by environmental conditions and management decisions in the current year but also by conditions and decisions in all years leading up to the current year. A range of factors—such as the pruning regime, alternate bearing or previous exposure to drought or heat stress—can have strong effects on yield. For perennial crops, as well as for sweet potato and cassava, for which no APSIM modules were available, climate change impact projection was based on climatic crop requirements published in FAO’s ECOCROP database (ECOCROP, 2020).
ECOCROP is a software tool that identifies 2,568 plant species for given environments and uses (food, fodder, energy, erosion control, and industrial purposes). It also contains a library of crop environmental requirements. ECOCROP was designed with relatively basic crop environmental requirements information. This design was chosen because the primary objective of the project was to include many species as well as species lesser known for which it was not possible to obtain detailed information. The drawback of this inclusive approach was that for many species, the requirements are unclear, based on limited available literature. ECOCROP allows a search for plants that meet user-selectable descriptors for particular plants, their environments and their uses. The user-selectable plant descriptors include category (e.g. cereals, vegetables), life form (e.g. shrub, tree), life span (e.g. annual, perennial). The environmental descriptors include minimum and maximum values for temperature, annual precipitation, soil pH, light intensity, climatic zone, photoperiod sensitivity, latitude, altitude and other soil characteristics. Use descriptors include the plant’s main use (e.g. food, fuel) and used part (e.g.

59
Compendium of Practices in Climate-Smart Agriculture and Solar Irrigation
entire plant, fruits). ECOCROP provides for individual plants data sheets with brief descriptions of the plant, common names and yields as well as the ecological and use requirements entered in the database.
4.1. Flood and drought prediction models
Drought is a natural disaster that can lead to widespread impacts, including water and food crises. The Global Integrated Drought Monitoring and Prediction System (GIDMaPS) provides drought information based on multiple drought indicators (Hao et al., 2014). The system provides meteorological and agricultural drought information based on multiple satellite- and model-based precipitation and soil moisture data sets. GIDMaPS includes a near real-time monitoring component and a seasonal probabilistic prediction module. The data sets include historical drought severity
data from the monitoring component and probabilistic seasonal forecasts from the prediction module. The probabilistic forecasts provide essential information for early warning, taking preventive measures, and planning mitigation strategies. GIDMaPS data sets are a significant extension of current capabilities and data sets for global drought assessment and early warning. GIDMaPS data sets reliably capture major droughts from across the globe.
4.2. Africa Soil Information Service (AfSIS)
The Africa Soil Information Service (AfSIS) is developing continent-wide digital soil maps for sub-Saharan Africa using new types of soil analysis and statistical methods and conducting agronomic field trials in selected sentinel sites. These efforts include the compilation and rescue of legacy soil profile data, new data collection and analysis,
Figure 2.7 Flood and drought prediction model
Source: CTCN, 2014.

60
Compendium of Practices in Climate-Smart Agriculture and Solar Irrigation
and system development for large-scale soil mapping using remote sensing imagery and crowdsourced ground observations.
The project area includes ~17.5 million km2 of continental sub-Saharan Africa (SSA), encompassing more than 90% of Africa’s human population living in 42 countries. The project area excludes hot and cold desert regions based on the recently revised Köppen-Geiger climate classification as well as the non-desert areas of Northern Africa.
AfSIS is funded by the Bill and Melinda Gates Foundation and is supported by close scientific, operational and implementation partnerships with the Tropical Agriculture and Rural Environment Program (TropAg), the Center for International Earth Science Information Network (CIESIN) at the Earth Institute of Columbia University, the World Agroforestry and ISRIC-World Soils Information.
The project, in addition, works with a wide range of stakeholders across multiple scales as it seeks to develop demand-driven products and services, support the institutional development of national soil services and build capacity and awareness for the improved management of natural resources. As such, AfSIS has established key partnerships with the governments of Nigeria, Tanzania, Ethiopia and Ghana and continues to work closely with a number of international bodies through the Global Soil Consortium. AfSIS also works with government research and academic institutions in East Asia, Europe, the Middle East, North America, Oceania and South America as well as the CGIAR Research Program on Water, Land and Ecosystems (WLE), which combines the resources of 11 CGIAR Centers, FAO and numerous international, regional and national partners.
Key Goals of the AfSIS project
InnovationAfSIS is pioneering innovative methodologies, products, tools and systems to improve the way that soils are evaluated, mapped and monitored, making it one of the most innovative projects in the field of soil science today.
By using new technologies, AfSIS has increased the speed with which accurate and detailed soil information can be made accessible. These innovations will support high economic, social and environmental returns on investments in agriculture that will improve the lives and livelihoods of farming communities in Africa.
DataOne of AfSIS’s key objectives is developing a soil and landscape information system. This relies on a number of continually updated databases. One of these draws on an innovative monitoring network of 60 sentinel sites covering all the agriculturally important bioclimatic zones of Africa. At these sites, AfSIS is utilizing the Land Degradation Surveillance Framework (LDSF) process to collect data on soil and landscape properties that are measured at georeferenced locations, at specified soil depth intervals and points of time. A second database includes gridded covariates and remote sensing data that are related to factors of soil and ecosystem formation. Already, AfSIS has completed a significant portion of data collection intended for the first database and has gathered most of the necessary covariates to complement this data.
Another important database is the Africa Soil Profiles Database (Africa Soil Profiles Database), which now contains over 12,000 geo-referenced legacy soil profile records for 37 countries. As AfSIS collects and analyzes data and related information, it harmonizes standards and methodologies into one accessible system of knowledge.
EducationA key component of AfSIS is providing training and education to strengthen individual and institutional capacities to produce and use soil information. To do so, the AfSIS teams regularly hold trainings and joint workshops for other scientists and provide technical support for other organizations. AfSIS methodologies are already being adopted by other institutions and projects throughout Africa and beyond.
AnalysisAfSIS scientists use novel analysis methods to transform the data collected into products that will form the basis of the soil information service. These scientists

61
Compendium of Practices in Climate-Smart Agriculture and Solar Irrigation
have developed algorithms and statistical methods to integrate the complex datasets generated by the project and provide quality control for information products. The data interpretation is key to understanding and applying pedo-transfer functions, digital soil mapping methodologies, spectral diagnostics and the decision support tools. Such analysis allows for the development of digital soil maps, land use and agricultural recommendations, and agronomy applications.
ServicesAfSIS is providing services that will address key issues in Africa, such as agricultural productivity, sustainable use of natural resources, and hunger and poverty. By providing training to a number of institutions across Africa in various tools and methodologies, AfSIS has already transformed much of its work into a public good. Moreover, by making data and products publicly accessible, AfSIS is informing the public of soil-related issues in certain areas.
Figure 2.8 AfSIS
Source: CTCN, 2014.

62
Compendium of Practices in Climate-Smart Agriculture and Solar Irrigation
4.3 FAO databases and software for sustainable food production FAO hosts state-of-the-art databases and software (table 4.1) to monitor and manage the many variables required to ensure food security while minimizing environmental impacts. All of FAO’s standalone software models and other tools can be downloaded for free, for use directly in the field or to assist in research projects.
Table 4.1 FAO databases
Name Description Weblink
AQUASTAT AQUASTAT collects, analyzes and disseminates data and information, by country, on water resources, water use and agricultural water management, with emphasis on irrigated agriculture in Africa, Asia, Latin America, and the Caribbean. Its goal is to support agricultural and rural development through sustainable use of water and land by providing the most accurate information presented in a consistent and standard way.
w w w . f a o . o r g /aquastat/en/over-view/
AquaCrop AquaCrop is the crop growth model developed by FAO to address food se-curity and assess the effect of the environment and management on crop production. AquaCrop simulates the yield response of herbaceous crops to water and is particularly well suited to conditions in which water is a key lim-iting factor in crop production.
w w w . f a o . o r g /aquacrop
AQUAMAPS AQUAMAPS is AQUASTAT’s online geospatial database on water and agri-culture. Through a sophisticated web platform, regional and global spatial datasets on water resources and water management, produced by FAO and by external data providers, are made accessible.
AQUAMAPS is complementary to AQUASTAT’s statistical data. AQUAMAPS concentrates on geographical information that for the biggest part has been generated by spatial modeling. AQUASTAT’s statistical information has been used to calibrate and validate the results.
w w w . f a o . o r g /land-water/data-b a s e s - a n d - s o f t -ware/aquamaps/en/
Crop Water Information
Crop Water Information presents information about individual crops, their crop water requirement and yield response to water as well as bibliographic database on crop water productivity.
w w w . f a o . o r g /land-water/data-b a s e s - a n d - s o f t -ware/crop-infor-mation/en/
CropWat CROPWAT is a decision support tool developed by the Land and Water De-velopment Division of FAO.
CROPWAT 8.0 for Windows is a computer program for the calculation of crop water requirements and irrigation requirements based on soil, climate and crop data. In addition, the program allows the development of irriga-tion schedules for different management conditions and the calculation of scheme water supply for varying crop patterns. CROPWAT 8.0 can also be used to evaluate farmers’ irrigation practices and to estimate crop perfor-mance under both rainfed and irrigated conditions.
w w w . f a o . o r g /land-water/data-b a s e s - a n d - s o f t -ware/cropwat/en/
CLIMWAT CLIMWAT is a climatic database to be used in combination with the computer program CROPWAT. It allows the calculation of crop water requirements, irrigation supply and irrigation scheduling for various crops for a range of climatological stations worldwide.
w w w . f a o . o r g /land-water/data-bases-and-soft-w a r e /c l i m w a t -for-cropwat/en/

63
Compendium of Practices in Climate-Smart Agriculture and Solar Irrigation
Name Description Weblink
Diagnostic tools for investments
in water for agriculture and
energy
FAO has developed three diagnostic tools for investments in water for agri-culture and energy. Combined, these constitute an integrated platform for systematically assessing, at the country level, trends in the use of water re-sources, policy and institutional frameworks, investment needs, and the po-tential for boosting the sustainable use of water. The three tools work syner-gistically to provide a clear representation of the three dimensions of water resources in agricultural development and hydropower generation – context; institutions and policy; and financial investment.
1. 1.The Context Tool provides indicators for understanding the need for and potential of investments in water manage-ment, with the aim of developing water resources for food (via crops and aquaculture) and energy production.
2. 2.The Institutional and Policy Tool identifies practical ways in which to reflect institutional, legal and policy realities, there-by providing a solid base for policy and investment design and implementation.
3. 3. The Investment Tool provides reliable and project-based estimates of ongoing and planned investments in the devel-opment of water resources for food and energy production in the short, medium and long terms – within countries and for water resources that span international borders.
w w w . f a o . o r g /land-water/data-b a s e s - a n d - s o f t-w a r e / d i a g n o s -tic-tools-for-in-vestment/en/
FAO Nile With the rising water scarcity concerns within the Nile River Basin, it is be-coming increasingly important to ensure that water resources are used ef-fectively to meet agreed socio-economic goals.
Ten countries share the waters of the Nile. The basin is home to some 180 mil-lion people and the Nile states are characterized by high population growth and considerable development challenges
The project “Information Products for Nile Basin Water Resources Manage-ment” was intended to strengthen the ability of the governments of the ten Nile countries to take informed decisions with regard to water resources policy and management in the Nile basin. A thorough understanding of the state of the Nile resources, and the current use and productivity of its wa-ters, enabled decision makers to better assess trade-offs and implications of shared-vision development scenarios.
w w w . f a o . o r g /land-water/data-b a s e s - a n d - s o f t-ware/faonile/en/
ETo calculator ETo calculator is a software developed by the Land and Water Division of FAO. Its main function is to calculate reference evapotranspiration (ETo) ac-cording to FAO standards.
w w w . f a o . o r g /land-water/data-b a s e s - a n d - s o f t-ware/eto-calcula-tor/en/
Table 4.1 FAO databases (cont.)

64
Compendium of Practices in Climate-Smart Agriculture and Solar Irrigation
Name Description Weblink
GAEZ FAO and the International Institute for Applied Systems Analysis (IIASA) have developed the Agro-Ecological Zones (AEZ) methodology over the past 30 years for assessing agricultural resources and potential. Rapid de-velopments in information technology have produced increasingly detailed and manifold global databases, which made the first global AEZ assessment possible in 2000. Since then global AEZ assessments have been performed every few years. With each update of the system, the issues addressed, the size of the database, and the number of results have multiplied.
www.fao.org/land-water/data-bases-and-soft-ware/gaez/en/
GeoNetwork The FAO GeoNetwork provides Internet access to interactive maps, satellite imagery and related spatial databases maintained by FAO and its partners. It’s purpose is to improve access to and integrated use of spatial data and information. Through this website FAO facilitates multidisciplinary approaches to sustainable development and supports decision making in agriculture, forestry, fisheries and food security.
www.fao.org/land-water/data-bases-and-soft-ware/geonetwork/en/
GLADIS The Global Land Degradation Information System (GLADIS) is a global tool that contains low resolution information on the status of land and ecosys-tem resources and the processes acting on them. The main instrument of GLADIS is the analytical tool that can be used to identify the main ecosys-tem properties in one or more places and make the comparisons between them.
www.fao.org/land-water/data-bases-and-soft-ware/gladis/en/
HWSD The Harmonized World Soil Database v 1.2 is the result of a collaboration between the FAO with IIASA, ISRIC-World Soil Information, the Institute of Soil Science, the Chinese Academy of Sciences (ISSCAS), and the Joint Re-search Centre of the European Commission (JRC). The Harmonized World Soil Database is a 30 arc-second raster database with over 15 000 different soil mapping units that combines existing regional and national updates of soil information worldwide.
http://www.fao.org/land-water/da-tabases-and-soft-ware/hwsd/en/
SoilSTAT FAO and its partners in the Global Soil Partnership (GSP) are designing Soil-STAT, a system for monitoring, forecasting and reporting periodically on the status of global soil resources. The name of the system mirrors the FAOSTAT family of global status databases and monitoring.
http://www.fao.org/land-water/da-tabases-and-soft-ware/soilstat/en/
WaPOR WaPOR is a publicly accessible near real time database using satellite data that allows monitoring of agricultural water productivity.
http://www.fao.org/land-water/da-tabases-and-soft-ware/wapor/en/
WATERLEX WATERLEX is a searchable database established by FAO legal experts. The database represents a great utility to lawmakers, policymakers, researchers, lawyers, water technicians and, in general, government officials around the world who want to know more about the legislative and regulatory frame-work for water. The legislative database contains an analysis of the legal framework governing water resources in a large number of countries.
http://www.fao.org/land-water/da-tabases-and-soft-ware/waterlex/en/
Source: FAO, 2020.
Table 4.1 FAO databases (cont.)

65
Compendium of Practices in Climate-Smart Agriculture and Solar Irrigation
4.4. Agricultural Market Information System (AMIS)
Established at the request of the Agriculture Ministers of the G20, the Agricultural Market Information System (AMIS) is an inter-agency platform to enhance food market transparency and encourage coordination of policy action in response to market uncertainty. The initial focus of AMIS is on four crops that are particularly important in international food markets: wheat, maize, rice and soybeans.
AMIS seeks to strengthen collaboration and dialogue among main producing, exporting and importing countries. Apart from G20 members plus Spain, participants in AMIS include seven major producing, consuming and exporting countries of commodities covered by AMIS. Together, these countries represent a large share of global production, consumption and trade volumes of the targeted crops, typically in the range of 80–90%. In addition, AMIS reaches out to other key stakeholders in international food markets such as commodity associations and institutional investors in commodity markets. AMIS is structured around five main pillars that are interlinked and mutually reinforcing:
1. Market Monitor tracks current and expected future trends in international food markets, including policy developments and other market drivers, and detects conditions that warrant the attention of policy makers.
2. Analyses examine topical issues affecting international food markets, such as futures exchanges, energy markets and stock regimes, and refine methodologies and indicators to support effective analyses.
3. Statistics assemble the latest and most reliable data on production, trade, utilization and stocks for the commodities currently covered by AMIS.
4. Capacity Development provides the foundation
for improved statistical information from AMIS-participating countries by defining best practices and methodologies to be applied as well as by strengthening national capacities through training sessions and technical workshops.
5. Outreach and Policy Dialogue focus on disseminating key market information and analysis to guide policy makers and provide a forum to facilitate policy coordination.

66
Compendium of Practices in Climate-Smart Agriculture and Solar Irrigation
Module 5. Low emissions development tools This module reviews several low emissions development tools.
Tool 5.0 The Agro-Chain Greenhouse Gas Emissions (ACGE)
The Agro-Chain Greenhouse Gas Emissions (ACGE) calculator is a tool for estimating total greenhouse gas emissions associated with a food product. It addresses the most common stages of "linear" agro-food chains (chains for fresh and simple processed products: canned, frozen, packaged and other minimally processed forms). It combines a calculation framework with data sets containing crops, greenhouse gas emission factors and food loss factors along the chain.
Combined with user-definition parameters for the product-chain considered, it generates an estimate for greenhouse gas emissions associated with a product when bought by a consumer. The default data that the calculator derives from the data set may be overruled by the user if more specific data are available; this would make the calculations more case-specific.
Tool 5.1 Global Yield Gap Atlas
The global demand for food is rapidly increasing, and agriculture must become more productive to meet these needs. Measuring crop production performance at local and national scales is difficult because of the large variance in regional biophysical factors (like climate and soil, which have a significant influence on crop yields), organic and inorganic fertilizer inputs, and resilience to a variable climate. The following performance metrics allow for unbiased comparisons across the variables:
1. The yield gap is the difference between current farm yield and potential yield when crops are grown with optimal nutrient supply and protection against pests.
2. Yield stability is quantified by the degree of year-to-year yield variation due to rainfall and temperature variation.
These metrics are evaluated in the Global Yield Gap Atlas (GYGA), which covers local, national and continental scales within an agronomically relevant spatial framework. The GYGA is an international project initiated by researchers from the University

67
Compendium of Practices in Climate-Smart Agriculture and Solar Irrigation
of Nebraska-Lincoln and Wageningen University. The atlas has been developed for 55 countries across five continents and includes major cereal crops. The crop list has recently been extended to include soybean, sugarcane and potatoes, and additional information on water productivity and nutrient requirements will be future additions.
Tool 5.2 Samples: Standard assessment of agricultural mitigation potential and livelihoods
The Standard Assessment of Agricultural Mitigation Potential and Livelihoods (SAMPLES) website is a global research program that supports tropical countries to measure greenhouse gas emissions from agriculture and identify mitigation options compatible with food security. It addresses the dearth of reliable information about greenhouse gas emissions from agriculture in tropical countries. SAMPLES scientists work with developing countries to improve data on agricultural greenhouse gas emissions and mitigation potentials.
With better information, governments, non-governmental organizations and farmers can:
1. Identify high-production, low-emissions development trajectories in the agricultural sector.
2. Participate in the emerging green economy and access climate finance.
3. Strengthen tropical countries’ negotiating positions in global climate discussions.
The SAMPLES website has many resources for researchers, including:
• Agricultural greenhouse gas emission factors
• Measurement methods: guidelines for field measurements of agricultural greenhouse gas sources and sinks
• Various tools for prioritizing action; accounting and methodologies; and for reducing the cost of data collection
• An updated list of related resources, publications and blog posts
Tool 5.3 GHG mitigation in rice information kiosk
Paddy rice is the staple crop for most of the world’s population. In 2012, rice was grown on more than 164 million ha worldwide and in more than 100 countries. Asia, with a total of some 650 million metric tons (MT), accounts for about 90% of rice production, followed by Latin America (25 million MT) and sub-Saharan Africa (21 million MT).
Globally, irrigated lowland rice occurs on about 80 million ha and provides 75% of the world’s rice production. Irrigated rice is the most important rice production system for food security, particularly in Asia. Women’s labor plays a significant role in rice production—anywhere from 50% in Indonesia, Thailand, and the Philippines to as much as 80% in India and Bangladesh.
In 2012, 75% of the area on which rice was grown worldwide was flooded rice systems. These flooded rice systems produce about 10% of anthropogenic emissions in the agriculture sector globally, in the form of methane. But a number of practices involving management of water and organic inputs can decrease emissions, most notably alternate wetting and drying (AWD). The International Rice Research Institute (IRRI) is investigating how and where leading rice-producing countries can implement and scale up AWD to mitigate emissions and support farmers’ livelihoods.
The GHG Mitigation in Rice Information Kiosk serves as an information kiosk for greenhouse gas emissions and mitigation options in rice production systems. It covers rice management practices; data on biophysical and socioeconomic suitability of farming technologies and practices; and policy actions in Bangladesh, Colombia and Vietnam.
Tool 5.4 MRV platform for agriculture
The Measurement, Reporting and Verification (MRV) Platform for Agriculture contains tools, approaches, and case studies for MRV of GHG emissions and mitigation actions in the livestock sector.

68
Compendium of Practices in Climate-Smart Agriculture and Solar Irrigation
Over 100 countries indicated their intention to reduce GHG emissions from the agriculture sector in their Nationally Determined Contributions (NDCs). Credible MRV of emissions and emissions reductions are critical to help national policymakers understand the sources of GHGs, develop mitigation strategies, improve transparency and access climate finance.
The MRV Platform for Agriculture contains tools, approaches and case studies for MRV of GHG emissions and mitigation actions in the agriculture sector. The platform initially focuses on MRV resources specific to livestock but will accommodate MRV for other agricultural sectors and cross-cutting issues over time.
It is intended that this platform provide useful information to guide the technical and institutional design of MRV systems for agricultural mitigation actions, including those outlined in Nationally Appropriate Mitigation Actions (NAMAs) and NDCs.
The MRV Platform for Agriculture is an initiative of the Global Research Alliance for Agricultural Greenhouse Gases (GRA) and the CGIAR Research Program on Climate Change, Agriculture and Food Security (CCAFS), implemented in partnership with UNIQUE forestry and land use GmbH and the New Zealand Agricultural Greenhouse Gas Research Centre (NZAGRC). Web design is by Clutch Creative. Funding was provided by the New Zealand government as an activity of the GRA.
Tool 5.5 CSA guide
The CGIAR Research Program on Climate Change, Agriculture and Food Security (CCAFS) and partners developed a website presenting the climate-smart agriculture (CSA) approach to food security and sustainable development. The website aims to help practitioners, researchers and decision-makers working with or interested in CSA. The site helps users get started and guides them on the ground, connecting them with all the resources needed to dig deeper. For countries following up on their commitments under the Paris Agreement, the CSA guide is a useful tool to set up mitigation and adaptation initiatives in agriculture.
The website is divided into six parts:
1. The basics
The basics section provides users with crucial information about what climate-smart agriculture is, how it helps address important challenges and how it is different from other sustainable agriculture approaches, and it suggests introductory reading materials and videos.
2. Entry points
The next section gives an introduction into the numerous entry points for initiating CSA programs. To help users navigate among them, they are presented under three thematic areas: practices, systems approaches and enabling environments.
3. Develop a CSA plan
The website presents a specific approach to develop a CSA plan. This section was developed to provide a guide for operationalizing CSA planning, implementation and monitoring at scale. It consists of four subsections: situation analysis; targeting and prioritization; program support; and monitoring, evaluation and learning.
4. Finance
The finance section offers an overview of potential sources of funding for CSA activities at national, regional and international levels. It also includes options to search among a range of funding opportunities according to a CSA focus area, sector and financing instrument.
5. Resource library
In the resource library, users have access to all the references, key resources, key terms and frequently asked questions to get a quick overview that can be used as part of or independently of the other sections.
6. Case studies
And finally, the case studies section shows all the specific projects that are detailed in the basics and entry point sections. The interactive map allows users to view all case studies at once or filter the search by entry points.
An extensive portfolio of content, a highly visual design and a user-friendly interface will allow users to find specific points of interest or to follow the flow of information from the basics section to the entry points to CSA, the CSA plan, CSA finance, the resource library and case studies.

69
Compendium of Practices in Climate-Smart Agriculture and Solar Irrigation
Tool 5.6 Smallholder agriculture monitoring and baseline assessment tool
The Small-Holder Agriculture Mitigation Benefits Assessment (SHAMBA) tool and methodology allows Plan Vivo projects, for the first time, to derive carbon credits from soil carbon and other agricultural sources. This increases the volume of carbon credits for which smallholder farmers are eligible and enhances their access to other climate finance.
The SHAMBA model estimates greenhouse gas emissions or removals resulting from a change in land management practices. SHAMBA is designed to model a baseline scenario (where land management activities continue as business as usual) and an intervention scenario consisting of activities that can be described as Climate-Smart Agricultural practices, including conservation agriculture, agroforestry and other tree planting. SHAMBA models the changes in carbon stocks in soils and woody biomass, the greenhouse gas emissions from biomass burning, plant nitrogen inputs to soils, and fertilizer use over the accounting period for baseline and intervention activities. Net emissions and removals are calculated on a yearly basis for the length of the accounting period, in units of tons of carbon dioxide equivalent (CO2e) per hectare.
The University of Edinburgh and the CGIAR Research Program for Climate Change, Agriculture, and Food Security worked together to develop this tool, and the University of Edinburgh, Bioclimate and Plan Vivo are now working together to increase the use of this tool beyond the initial projects in sub-Saharan Africa. The aim is to estimate climate benefits from other geographical regions and land use practices as well as reporting metrics describing impacts on resilience and yields.
Tool 5.7 CCAFS-MOT: a mitigation options tool for agriculture
The CCAFS Mitigation Options Tool estimates greenhouse gas emissions from different land uses
and considers mitigation practices that are compatible with food production to inform agricultural and climate change decisions.
The CCAFS Mitigation Options Tool (CCAFS-MOT) estimates greenhouse gas emissions from multiple crop and livestock management practices in different geographic regions, providing policy-makers across the globe with access to reliable information needed to make science-informed decisions about emissions reductions from agriculture.
Access the guidelines and download the CCAFS-MOT in Excel. The beta version is ready to use. By design, the CCAFS-MOT is occasionally updated to include the most recent information in the sector and to improve functionality based on user feedback.
CCAFS-MOT joins several empirical models to estimate GHG emissions from different land uses and considers mitigation practices that are compatible with food production. Several studies regarding mitigation potentials are used in the tool. Several available GHG calculators can calculate emissions from either single crops or whole farms. Unlike these agricultural calculators, CCAFS-MOT:
• Ranks the most effective mitigation options for 34 different crops according to mitigation potential and in relation to current management practices and spatially linked climate and soil characteristics,
• Has low input data requirements—approximately 10 minutes needed,
• Runs in Excel,
• Is freely downloadable from the CCAFS website.
Tool 5.8 Climate-smart agriculture rapid appraisal (CSA-RA) prioritization tool
The CSA-RA provides an assessment of key barriers and opportunities to climate-smart agriculture adoption across landscapes by collecting gender-disaggregated data, perceptions of climate variability, resource and labor allocation, and economic assessments at the household level. This approach combines participatory workshops, expert interviews, household/farmer interviews and farm transect walks to gather and capture

70
Compendium of Practices in Climate-Smart Agriculture and Solar Irrigation
the realities and challenges facing diverse farming communities.
A Climate Smart Agriculture Rapid Appraisal (CSA-RA) was carried out by the International Center for Tropical Agriculture (CIAT) in collaboration with Sokoine University of Agriculture (SUA) for the Southern Agricultural Growth Corridor of Tanzania (SAGCOT) in September 2014.
The CSA-RA aimed to assess within and between district variations in farming systems, agricultural management practices, challenges for current agricultural practices and climate vulnerability, in order to inform targeting of CSA. The CSA-RA used key-informant interviews, participatory workshops, transect walks and farmer interviews, as well as gender-disaggregated methods, to gather information on important agriculture-related features and constraints faced by farmers. The CSA-RA from the SAGCOT was carried out in four districts: Bagamoyo, Kilosa, Kilolo and Mbarali.
Tool 5.9 Climate-smart agriculture prioritization framework
The CGIAR Research Program on Climate Change, Agriculture and Food Security (CCAFS) and the International Center for Tropical Agriculture (CIAT) have taken on the challenge of developing a framework for prioritizing investment in CSA that is evidence-based yet realistic in that it can move forward in the face of data and resource constraints. The process grounds prioritization in inclusive participatory processes, integrating actors to ensure alignment with stakeholder criteria for prioritization and contextual realities. Flexibility is a key characteristic of the process to ensure users across sectors and levels can modify the process for their planning needs.
Prioritizing CSA practices and programs
The prioritization framework uses a four-phase approach to guide stakeholders through the process of filtering a long list of applicable CSA practices into
portfolios of priority practices. The phases are additive, with each refining the previous outputs. The process generally takes between four and eight months and can be simplified and still provide valuable inputs into investment decision-making.
Phase 1: Assessment of CSA practices
The process begins by identifying the scope of the CSA investment in terms of geographic area, challenges to address and desired outcomes practices for beneficiaries. A list of practices linked with the scope is created and assessed based on indicators of desired outcomes. The framework includes a list of suggested indicators for evaluating practices linked with the CSA goals (productivity, adaptation and mitigation).
Phase 2: Identification of top CSA options (workshop 1)
Stakeholders are gathered to validate objectives and select top practices from the long list of options. The indicator analysis provides the base of discussions on trade-offs between the achievement of the three goals of CSA, stakeholder desired outcomes and barriers to adoption.
Phase 3: Calculate costs and benefits
Cost-benefit analyses are conducted on each of the practices in the short-list, prioritized in phase 2, to identify investment opportunities associated with various productive systems. Analyses are based on scientific literature, expert knowledge and primary data as needed.
Phase 4: CSA portfolio development (workshop 2)
Stakeholders are reunited to select CSA practices for inclusion in investment portfolios. Trade-offs between the ranking of practices associated with the CSA goals, desired outcomes and economic feasibility are visualized and discussed. Aggregate benefits from different portfolios, along with synergies between practices, are explored. Perceived constraints and barriers to adoption and ways to overcome them are included in analyses of portfolios.
Other tools and processes—such as crop modeling, participatory scenario development and frameworks for evaluating sustainable land management—can be integrated with this approach.

71
Compendium of Practices in Climate-Smart Agriculture and Solar Irrigation
Prioritization in actionThe CSA prioritization framework aims to provide a coherent process for increasing technical understanding of CSA options and directing climate change and agriculture investment to assist national and regional planning. With transparency and participation at the heart of the process, local knowledge and scientific evidence unite to establish realistic pathways for increasing CSA adoption (FAO, 2010).
Tool 5.10 The ex-ante carbon-balance tool
The Ex-Ante Carbon-balance Tool (EX-ACT) is an appraisal system developed by FAO that provides estimates of the impact of agriculture and forestry development projects, programs and policies on the carbon-balance. It is a decision-making tool.
The carbon-balance is defined as the net balance from all greenhouse gases expressed in CO2 equivalent that were emitted or sequestered due to project implementation as compared to a business-as-usual scenario.
EX-ACT is a land-based accounting system, estimating C stock changes (i.e., emissions or sinks of CO2) as well as GHG emissions per unit of land, expressed in equivalent tons of CO2 per hectare and year. The tool helps project designers to estimate and prioritize project activities with high benefits in economic and climate change mitigation terms. The amount of GHG mitigation may also be used as part of economic analyses as well as for the application for additional project funds.
EX-ACT can be applied to a wide range of development projects from all AFOLU sub-sectors, including (besides others projects on climate change mitigation) sustainable land management, watershed development, production intensification, food security, livestock, forest management or land use change. Further, it is cost-effective, requires a small amount of data, and has resources (tables and maps) which can help locate the required information. While EX-ACT is mostly used at the project level, it may easily be up-scaled to the program or sector level and can also be used for policy analysis (CSA, FAO, 2010).

72
Compendium of Practices in Climate-Smart Agriculture and Solar Irrigation
Module 6. CSA gender & youth aspects
This module covers the gender and youth aspects of climate-smart agriculture.
Women contribute around 43% of the agricultural labor force in developing countries (FAO, 2011 in Gutierrez-Montes et al., 2020), but their work is often invisible. In particular, women’s work activities in subsistence agriculture are often underestimated for reasons such as gender norms in farming and concepts and definitions adopted in data collection (UN, 2015 in Gutierrez-Montes et al., 2020).
These women are usually responsible for producing grains, vegetables and small animals for household consumption. These activities are often considered “duties” and not “work.” Usually, social and cultural norms limit women’s participation in public spaces, excluding women’s voices from decision-making processes at the community level. Even though they have less access to production resources (seeds, inputs and technical and financial assistance), women play an important role in the transmission of local knowledge about agricultural and conservation practices (Gutiérrez-Montes et al., 2012 in Gutierrez-Montes et al., 2020).
Rural women are particularly vulnerable to the effects of climate variability and change because they have fewer
endowments and entitlements than men, less access to information and services and increasingly heavy agricultural workloads (FAO, 2011 in Gutierrez-Montes et al., 2020). Diversity among women is also overlooked. Women are not a homogenic group, and the effects of climate change are diverse.
Achieving gender equity—primarily through investing in women, their education and their opportunities—may lead to greater reductions in poverty; faster economic growth; and significant improvements in family health, nutrition, education and quality of life. Improvement in women’s education is one of the most important policy strategies to reduce poverty and increase agricultural productivity because increases in women’s capabilities expand their opportunities and empower them to exercise their choices (Quisumbing and Meinzen-Dick, 2001 in Gutierrez-Montes et al., 2020). Furthermore, enhancing women’s decision-making power also results in greater well-being of children and households in general (Kabeer, 2005 in Gutierrez-Montes et al., 2020).
Greater participation of women is very important in CSA technology adoption. Projects centered around the climate-smart agriculture (CSA) approach should involve women as much as possible.

73
Compendium of Practices in Climate-Smart Agriculture and Solar Irrigation
Case study 6.1 Mesoamerican Agro-enviromental Program (MAP) for gender integration into climate-smart agriculture
MAP is a platform that links research, education and technical assistance to support rural sustainable development while reducing rural poverty in Mesoamerica. MAP’s first phase (2008–2013) promoted strategies and practices for sustainable land management (SLM) using the sustainable livelihoods approach and the community capitals framework with a territorial approach (Gutiérrez-Montes and Ramirez, 2016 in Gutierrez-Montes et al., 2020) to improve production and competitiveness and to address environmental issues that affect the most important agricultural and natural resources sectors of the region. MAP’s second phase, called MAP-Norway (2013–2017), promoted the climate-smart territory (CST) approach to address issues such as poverty, food and nutrition insecurity, gender inequality, degradation of ecosystem services and vulnerability to climate change (CATIE, 2013 in Gutierrez-Montes et al., 2020).
MAP-Norway focused its work at three levels: (i) local, with families; (ii) regional, with business organizations and territorial governance platforms; and (iii) national, with governmental organizations. MAP-Norway reached 5,000 smallholder families, 30 business organizations, 8 territorial platforms and 8 governmental organizations.
MAP gender strategy
Both phases of MAP promoted gender equity and social inclusion to contribute to the creation of an enabling environment for human development. This has been captured in the gender strategy. The strategy comprises of four axes which are addressed by the following actions:
1. Promote positive changes in gender roles at the household level; access, use and control over resources; equal participation of household members in decision-making; and balanced distribution of the division of labor and responsibilities from within the household,
2. Promote more equity in decision-making spaces in business organizations,
3. Incorporate concepts of gender and equity in plans and co-management action plans, generated and disseminated tools and methodologies related to gender and equity,
4. Integrate a gender approach in all documents generated and in all program outcomes.
MAP monitoring and evaluation system
MAP-Norway’s monitoring and evaluation system (MAP’s M&ES) is a tool to monitor its actions as well as to measure progress toward expected results. The system is based on the program’s logical framework and provides the option to perform simple or complex information queries (Mercado and Aguilar, 2015 in Gutierrez-Montes et al., 2020).
To monitor progress throughout the period of implementation, MAP-Norway has used a set of quantitative indicators mapping to each of its five outcomes (table 6.1).

74
Compendium of Practices in Climate-Smart Agriculture and Solar Irrigation
Table 6.1 Strengths and weaknesses of MAP-Norway outcome indicators and adjustments proposed
No Indicator Strengths Weaknesses Adjustments or proposed indicators
1 Percentage of households in which adults and youth (males and females) participate in decision-making processes related to household, farm, and home garden activities.
Allows tracking of changes in partic-ipation of women/men and youth If the interviewee is not presented with a list of op-tions, an overview is provided of which are the most important activities for a giv-en household and who participates in them.
Only captures the opinion of the head of the household or his/her spouse on whether someone participates or not. When a closed list is used, some interview-ees tend to simply agree with most of what is being present-ed to them. There is a lack of information about communal activities (who participates, and the roles assumed) It is not easy to get reliable data.
Data for this indicator should be collected separately for men and women.
This indicator should be complemented with qualitative indicators:
(1) Examples of changes reported by the husband and wife regarding women’s deci-sion-making within the household.
(2) Examples of changes in men’s percep-tions of the benefits of women’s participa-tion in decision-making.
(3) Examples of changes in the gender divi-sion of labor (productive, reproductive and communal) reported by women and men.
2 Percentage of members of busi-ness organizations that are women.
It is relatively easy to obtain reliable data.
Membership does not imply influence in the decision-making of the organization. Women could be included just to fulfill an affirmative action, a quota or a mandate.
Evidence that women are consulted and involved in the development of strategies and plans within the organization. Qualitative indicators to show transformative leadership (self-perception).
3 Number of women in administrative and technical roles within the business organizations.
It is relatively easy to obtain the data. Provide an over-view of women’s roles within the organization.
Women could be included just to fulfill an affirmative action, a quota or a mandate.
Should be complemented with a qualitative indicator, such as women’s self-perception of their roles within the organization.
4 Number of women that are part of a board of directors within a business organization.

75
Compendium of Practices in Climate-Smart Agriculture and Solar Irrigation
No Indicator Strengths Weaknesses Adjustments or proposed indicators
5 Number of busi-ness organizations that have recruit-ment processes that address gen-der equity issues.
It is relatively easy to obtain the data. It reflects that the organization is aware of the importance of in-clusion of women.
To have gender con-siderations in official documents does not necessarily translate into more equitable treatment in practice.
Should be coupled with other indicators to ensure that these mechanisms are being applied effectively. Such indicators could assess qualitatively how men and women perceive gender relations within the orga-nization.
6 Number of busi-ness organizations that have gender sensitive statutes.
7 Number of busi-ness organizations that incorporate gender equity in their entrepre-neurial strength-ening plan.
8 Number of terri-torial platforms/governmental or-ganizations that in-corporate gender equity principles in their planning and chores.
It reflects that the organization is aware of the importance of incorporating gender equity principles. Allows for track-ing continuity in the incorporation of the gender equity principle.
To have gender con-siderations in official documents does not necessarily translate into more equitable treatment in practice; Documents are not al-ways readily available.
Should be coupled with data that indicates whether the actor is currently applying gender-related affirmative actions.
Source: Gutierrez-Montes et al., 2020.
Table 6.1 Strengths and weaknesses of MAP-Norway outcome indicators and adjustments proposed (cont.)

76
Compendium of Practices in Climate-Smart Agriculture and Solar Irrigation
Table 6.2 MAP-Norway quantitative gender indicators
Level/scale MAP-Norway expected results
Indicators
Local level (households). Greater equity in the par-ticipation of women, men, and youth in household and productive decision-making processes.
Percentage of households in which adults and youth (male and female) participate in decision-making related to household, farm, and home garden activities.
Territorial (business organizations).
Greater equity in the deci-sion-making processes in producer organizations.
Percentage of members of business organizations that are women.
Number of women in administrative and technical roles within the business organizations.
Number of women that are part of the board of directors in the business organization.
Number of business organizations that have recruitment processes that address gender equity issue.
Number of business organizations that have gender sensi-tive statutes.
Number of business organizations that incorporate gender equity in their entrepreneurial strengthening plan.
Territorial (governance platform or government institutions).
Local governance platforms and governmental organi-zations incorporate gender equity principles into their planning and programming processes.
Number of territorial platforms that incorporate gender equity principles into their planning.
Number of governmental organizations that incorporate gender equity principles into their planning.
Source: Gutierrez-Montes et al, 2020.
Proposed indicators
The program considers three pillars for climate-smart agriculture: productivity, adaptation and mitigation. Regarding the productivity pillar, the indicators are organized into two levels: the local level and the territorial level (table 6.2).
Recommendations
• Mixed-methods approaches (combining surveys, focus groups and semi-structured interviews) have been found useful in assessing gender roles and differences in participation and decision-making.
• Project personnel must consider the gender of their respondents, interviewing both the head of
household and his or her spouse, to minimize gender bias in responses.
• Include indicators on how men and women perceive the changes generated by the program or intervention and if there is greater gender awareness in terms of productivity, adaptation and mitigation to climate change.
• Make sure that the indicators are measuring benefits and outcomes for women and men.
• It is difficult to show transformative changes in people’s behavior or cultural norms because it takes time. Performance indicators must be included when developing a gender evaluation framework, differentiating advances within the impact pathway.

77
Compendium of Practices in Climate-Smart Agriculture and Solar Irrigation
• There is enough evidence supporting the need to have budget allocations that consider the relevance of a qualitative indicators’ assessment.
Case study 6.2 Engaging youth in climate-smart agriculture in Sub-Saharan Africa
About 44% of the population is under the age of 15 in Sub-Saharan Africa, with two out of three inhabitants being under 25 years old. Africans aged 15 to 24 are projected to reach 350 million by 2050.
Agriculture employs 65% of Africa’s labor force, and accounts for 32% of gross domestic product. However, climate change exacerbates the low-performing smallholder agriculture across Africa. Agriculture offers few opportunities for African youth. Many are not able to fulfill their potential because of hunger, poor health and lack of education.
The average age of African farmers is over 50 years old. Youth perceive agriculture as old-fashioned work and instead seek employment in town and cities but often lack the required skills. Therefore, there is a need to encourage youth to work in agriculture, especially in rural areas. Accelerating climate change poses additional challenges.
The reason why the youth are the future of African agriculture is that they are more likely than the older farmers to understand and use new technologies (FANRPAN, 2012). Climate-smart agriculture combines innovative ways of managing land, water and soil for more efficient production and resilient systems.
Climate-smart agriculture (CSA) is based upon existing climate-smart practices that could be scaled out. Various agricultural practices can help to increase climate resilience and productivity for smallholder farmers while reducing emissions. However, the optimum application of these techniques varies across different agro-ecological zones and agro-climatic situations (FAO, 2010 in FANRPAN, 2012).
There are different ways to integrate youth, such as though the Young Professionals Network. However, there is a lack of enabling policy environment for youth engagement in climate-smart agriculture. Regional, national and international policies do not reflect the need for comprehensive approaches for engaging youth in developing the agricultural sector, addressing climate change and safeguarding the food security. There are few, if any, incentives to take advantage of the available opportunities and the potential of new technologies.
Furthermore, research opportunities in CSA are not always well-presented to the youth, and tools and knowledge on CSA are not always well developed and shared. Investment in education, capacity development and communication would go a long way toward engaging the youth in CSA.
Land tenure is another issue. Youth generally do not have access to land and do not own land.
Recommendations
• There is a need to make CSA activities attractive and accessible to the youth. This requires introducing business-oriented approaches to agriculture and making agriculture a more attractive profession.
• Government, private sector, international organizations and development partners need to collaborate to play a central role in the development of CSA technologies. Policies are to be developed, nurturing linkages between education and business and improving access to markets, value chains, financial services and innovation. Knowledge and skills are to be transferred and disseminated. New attractive employment opportunities in agriculture are to be created.
• Existing good practices on CSA are to be well-documented and disseminated for the benefit of youth.
• Regional platforms and other awareness mechanisms are to be created to increase the uptake of CSA initiatives by the youth.

78
Compendium of Practices in Climate-Smart Agriculture and Solar Irrigation
Module 7. Value chains
This module provides information on value chains in climate-smart agriculture.
A value chain in agriculture identifies the set of actors and activities that bring a basic agricultural product from production in the field to final consumption, with value added to the product at each stage.
Case study 7.1 Climate risk profiles approach
Climate change and extreme weather events are causing significant problems for smallholder farmers and others who depend on agricultural value chains in developing countries. Although value-chain analysis can help untangle the complex relationships within agricultural systems, it often has failed to take into account the effects of climate change. Climate change assessments, meanwhile, often focus on production while neglecting other components of the value chain. In response to these shortcomings, the International Center for Tropical Agriculture (CIAT), in collaboration with the Government of Kenya, developed the climate risk profiles (CRP) approach (Mwongera et al., 2019).
The climate risk profiles approach:
1. Supports identification of major climate risks and their impacts on the value chain,
2. Identifies adaptation interventions,
3. Promotes the mainstreaming of climate change considerations into development planning at the subnational level.
The results show that the magnitude of a climate risk varies across value chains. At the input and production stage, strategies for supporting climate-smart value chains include the following:
• Improving access to input markets,
• Supporting diversification and value addition,
• Providing climate-smart production technologies,
• Disseminating climate information services,
• Making financial and insurance services available.
At the harvesting, processing and marketing stages, useful interventions would include:
• Strengthening farmer organization,
• Investing in climate-proofed infrastructure, including roads and facilities for storage,
• Processing and improving access to output markets.
Finally, climate-change adaptation along the value chain would be improved by strengthening existing institutions, exploring public-private partnerships and adopting coherent local policies.

79
Compendium of Practices in Climate-Smart Agriculture and Solar Irrigation
Case study 7.2 Climate-resilient coffee value chains in Uganda
In 2013, the Ministry of Trade, Industry and Cooperatives (MoTIC), Makerere University (MAK) and the International Institute for Sustainable Development (IISD) initiated a six-month pilot initiative to support the integration of climate risks into agro-value chains in Uganda. Specifically, the partners developed a participatory process for exploring the links between climate and the coffee value chain within Uganda as a way of showcasing the range of climate impacts and responses related to a particular agro-commodity.
The climate risk analysis was conducted using multi-stakeholder dialogues along the coffee value chain. The use of a participatory qualitative approach to climate risk analysis is based on the recognition that perceptions and interpersonal dynamics, including trust relationships, influence the way actors adapt (or do not) to a changing climate.
Put simply, if some actors do not perceive climate risk as a major challenge to their activities, it is unlikely that they will take specific actions to address those risks. Value chain actors may have similar interests, but a lack of trust between those actors is likely to maintain the status quo and prevent the development of innovative win-win solutions.
The approach also acknowledges that all actors along the value chain are interlinked, answering questions such as:
• How do actors at a specific level of the chain (e.g., farmers) influence, or fail to influence, other actors at the same levels (e.g., input suppliers) or other levels (e.g., exporters)?
• How do climate hazards combine with other non-climatic risks to affect all value chain actors?
• Who is affected the most along the chain?
In this case study, the multi-stakeholder dialogues mobilized 80 participants representing farm input suppliers, coffee farmers, traders, processors, exporters and service providers at the production, transformation
and marketing stages of the chain. They shared and learned from each other using “climate dialogue theatres.” Climate dialogue theatres (CDTs) are based on a method that uses drama to promote adult learning on climate adaptation among coffee value chain actors.
Three CDTs were organized at the production, transformation and marketing levels of the coffee value chain between June and July 2013. The first two CDTs were piloted in Rakai district in the southwestern part of Uganda to build upon previous research conducted by IISD and MAK on coffee and climate risk. The CDT at the marketing level took place in Kampala, where most coffee exporters and their service providers reside. CDTs took place in-situ (i.e., a coffee-producing village, a processing factory or an exporter warehouse) so that discussions were as concrete as possible.
7.1 Key Findings
Finding 1: Climate hazards negatively affect all actors along the chain, but in different ways and to different extents.
The impacts of climate hazards are felt across the entire coffee value chain, from production to export. All participating actors expressed concern over the perceived impacts of climate on their activities. Climate hazards are associated with a reduction in coffee yield and quality through physiological disruptions of the coffee trees and increased incidences of pests and diseases, the deterioration of coffee seedlings, the disruption of the bean-drying process and the destruction of inputs and infrastructure for processing and transportation.
Indirectly, climate hazards further contribute to reducing incomes through decreases in business activities and services provision and an increase in costs for business and service delivery costs at three levels: production, transformation (e.g. increased breakdown of processing equipment and machinery due to high moisture content of beans resulting from heavy rainfall) and distribution. Decreasing coffee quality due to climate hazards affects

80
Compendium of Practices in Climate-Smart Agriculture and Solar Irrigation
coffee prices and the margins earned by the various actors with impacts for the country’s competitiveness on the international market.
It is very hard to generalize differences between the value chain actors, in terms of level of exposure and vulnerability to climate hazards, because of the complexity of the chain and the diversity of actors regarding their roles, sizes in relation to their activities and locations. However, coffee farmers and processors generally tend to be more vulnerable to the impacts of climate hazards than traders, middlemen and exporters. The results from the pilot study highlight that farmers and processers tend to have limited diversification capacity, weak organizational capacity (e.g. very limited direct links between farmers and exporters) and face an unfavorable policy environment. Thus, vulnerability tends to be more concentrated at the production end of coffee value chains.
Finding 2: Most actors are already making some efforts to minimize the negative impacts of climate hazards on their activities, but not all responses are sustainable.
Risk management measures may be environmental, technological, financial, economic (e.g. diversification) or organizational (e.g. bringing services closer to the communities). Most responses along the chain are oriented toward loss prevention, sharing or transferring the losses to other actors along the chain, and to a lesser extent on capacity building and awareness raising.
Most responses are done in isolation (e.g. in the form of pilot efforts) and in an uncoordinated manner. Some responses are not sustainable in the long term, including the following examples:
• As a result of the losses in yield and quality, farmers buy cheap, poor-quality and often expired inputs so they can grow and sell their coffee immediately and prematurely to get fast cash.
• Traders compensate for the loss in volume and weight by using inaccurate scales and by adding foreign objects (stone, husks), which affects equipment and raises costs for processors.
• Some processors smuggle coffee from neighboring countries to improve the coffee quality and increase quantity.
• Such malpractices are further reinforced by weak monitoring and enforcement of regulations.
Finding 3: A lack of communication, exchange of information and trust between and among actors along the value chain hampers climate adaptation.
All actors along the coffee value chain are highly interdependent, where actions at one level can influence actions at the other levels. The results from the pilot study show that participating actors at different levels of the chain often know little about each other. In general, actors tend to be poorly connected and do not trust each other, which undermines their capacity to respond in a sustainable way to the negative impacts of climate hazards. This is partly because the chain is fragmented with many intermediaries between farmers and exporters. For example, farmers blame input suppliers for the sale of adulterated chemicals, and input suppliers complain about the fact that the sale of adulterated chemicals is exacerbated by farmers who systematically work with traders who sell at low prices—mainly as a result of lower incomes from coffee resulting from climate hazards. Exporters perceived the main issue of low-quality coffee as mostly due to poor ethics and lack of discipline on the part of other actors in the value chain. At the end of each CDT process, most participants recognized the need to work together to solve their concerns.
Finding 4: Agriculture financing is a cross-cutting gap for all actors along the chain. The limited access to agriculture finance is perceived as a key barrier by all participating coffee value chain actors and exacerbates the adverse impacts of climate hazards.

81
Compendium of Practices in Climate-Smart Agriculture and Solar Irrigation
Despite the decreasing share of the agriculture sector to the country’s GDP, 73% of the population continues to be employed in the agriculture sector—a trend that is projected to remain in the near future. However, agriculture financing—the financing of any agriculture-related activity, ranging from production to marketing through savings, credit, insurance and leasing—remains limited.
7.2 Priority Actions
Based on the results of the pilot initiative in Uganda, three priority actions at organizational, financial and technological levels can be identified for policy and decision-makers to foster climate-resilient and inclusive coffee value chain development.
1. Improve networking and partnership building for climate adaptation along the value chain by strengthening existing platforms at all levels and exploring the role of market incentives in supporting such activities (e.g., standards). Various platforms already exist (i.e., a national coffee platform, district coffee platforms and coffee associations) with the objective to facilitate networking and collaboration among and/or between actors along the chain. However, the results of the pilot initiative show that knowledge and information sharing are often lacking, among similar actors and between different actors along the chain. An action plan for strengthening and streamlining coffee platforms is needed. Of the coffee bought by exporters, 77% is from intermediaries (domestic middlemen or traders); the rest is bought through exporter-farmer associations. Policy and decision-makers should work toward shortening the value chain to support direct linkages between farmers, processors and exporters through measures such as contract farming, strong farmer organizations and cooperatives. Farmer organizations and cooperatives should especially be strengthened to increase farmers’ bargaining power. Strengthening structures and relationships along the entire coffee chain could help lead to more
efficient use of resources, improve the coordination and implementation of regulatory activities and the delivery to trainings, and develop and implement improved information systems between and among actors. These conditions would all support high coffee quality standards for the benefit of all actors. Finally, sustainable standard initiatives have a high potential to support value chain development as testified by the rapid increase of certified coffee market share of global production, from 9% in 2008 to 38% in 2012. Standards that connect all actors to premium or guaranteed sales while supporting climate adaptation along the entire value chain (not just at the production level) could enhance value chain coordination.
2. Develop new, flexible financial products to support climate-resilient and inclusive agro-value chains through capacity building and innovative public-private partnerships. The lack of agricultural finance has already been recognized at the national level, and in 2012 the Ministry of Finance, Planning and Economic Development developed a draft Agricultural Finance Strategy, which could provide the institutional framework for coordination and implementation. Implementation and enforcement of these policies is needed to ease access to credit and start-up capital for farmers to invest in irrigation, to improve coffee handling and storage from production to export and for processors, and to increase exporters’ capacity to handle larger coffee volumes. In addition, facilitating access to agriculture finance for climate adaptation requires the development of weather index insurance (to cover loss and damage caused by climate hazards) and the integration of climate risk into existing financial mechanisms such as the Warehouse Receipt System. This calls for awareness raising and capacity building on climate adaptation among financial service providers (e.g., Bank of Uganda, Uganda Insurers Association, the Insurance Regulatory Authority, and Microfinance Support Center) so that they understand the benefits of integrating climate adaptation into their activities and strategies.

82
Compendium of Practices in Climate-Smart Agriculture and Solar Irrigation
3. Investing in climate-resilient infrastructures such as roads, irrigation systems, storage facilities and telecommunications should remain a top priority to support agro-value chain development and build productive capacities in a changing climate. Improving infrastructures to support all the coffee value chain actors and especially the rural coffee growers has already been identified as a priority action in the national export strategy for the coffee sector 2012–2017. For example, the lack of irrigation makes the coffee supply susceptible to drought; heavy rains affect coffee transportation by destroying roads and bridges and increasing the beans’ moisture content during transportation. These impacts can contribute to reductions in the farmers’ yields and access to markets and service provisions, increases in the prices of inputs and decreases in the prices of outputs, which culminate in reduced incomes. However, any sustainable investment in physical infrastructures should ensure that the location, the composition and the design of the infrastructures, among other characteristics, account for the expected increase in frequency and intensity of climate hazards or any potential new climate hazards due to climate change.

83
Compendium of Practices in Climate-Smart Agriculture and Solar Irrigation
Module 8 Financing CSAThis module focuses on the financial aspects of climate-smart agriculture.
8.0 Access to market
Agriculture is a classic example that illustrates the role of trade to increase global economic efficiency by explanting local comparative advantages. This is being questioned from a GHG emissions perspective, initially triggered by the promoters of the “food miles” concept who advocate the consumption of local products to reduce GHG emissions. In reality, transport is not the determining factor of the carbon footprint (CTCN, 2014). In fact, a more efficient production system can more than compensate for the emissions resulting from transport. Restricting trade and producing locally may both increase GHG emissions per unit of output and reduce economic efficiency.
International trade is and has been an essential factor for the resilience of food systems. Climate change is expected to have different effects in various regions of the world and is likely to lead to important changes in the geographical distribution of agricultural production potential, with increases in mid to high latitudes and a decrease in low latitudes. International trade plays an important role in compensating, albeit partially, for
regional changes in productivity that are induced by climate change. The ability to realize the compensating potential of international trade depends on a well-functioning international trade architecture.
8.1 Financial requirements and costs of adapting CSA technologies
According to CTCN (2014):
• Public-private partnerships will have a central role in generating required investments to sustainable agriculture.
• Currently, there is a gap in funding for investment requirements for agriculture in developing countries. The majority of investments will be made by the private sector, and most of them by the farmers themselves. The public sector can play a key role in building an enabling environment, including policies, institutions and key investments. Reducing risk and improving resilience is key to enabling private actors, especially the financially vulnerable, to invest. The private sector will also need support, particularly during the transition phase toward new systems. Payments for environmental services can play an important role to facilitate this transition.

84
Compendium of Practices in Climate-Smart Agriculture and Solar Irrigation
• Among the needed investments are important land management schemes and infrastructure, such as local roads and irrigation systems, which are an important source of job creation in rural areas. These public works can be supported by social protection schemes.
• There is a need for investments in research. Increased investment in public research is particularly needed in areas where return on investment cannot immediately benefit the private sector. To address systemic issues to be adapted to local specificities and needs, research will have to be linked to extension services and be open to local knowledge and to the demands addressed by all stakeholders, including small-scale food producers. The transfer of technology will also play an important role. It should include the development of the human capacity to accommodate the technology and structure partnerships to ensure that it is adapted and established locally.
8.2 Climate finance for agriculture and livelihoods
The policy brief addresses the major challenges and opportunities to financing climate change mitigation and adaptation pathways for smallholder farmers in developing nations. It underlines the need for an innovative and integrated approach to climate finance which can connect rural farmers to public and private finance at the global level. It provides recommendations for future actions that can meet adaptation, development and mitigation aims (Foster et al., 2013).
Key messages:
• Up-front public sector finance will be necessary to reduce the investment risk associated with smallholder agricultural projects, to overcome the initial investment gap and to leverage private capital toward sustainable agriculture.
• Building upon pre-existing local development institutions, strengthening the capacity of community-based organizations and securing land tenure can ensure that project benefits reach farmers and are distributed equitably, increasing project success.
• Investment in smallholder agriculture should take a holistic approach, focusing on the issues of food security and livelihoods and fostering mitigation as a co-benefit.
• To increase the effectiveness of recent climate change adaptation schemes, focus should be placed on key areas such as the development of pro-poor insurance markets as well as addressing issues of affordability for poor farmers, building human resource capacity and using far-reaching efficient distribution channels.
• Using a networked financing approach that combines many diverse investments in land can overcome the high risk associated with smallholder farmers and drive investment to promote sustainable practices at a large scale.
• Scientifically robust research frameworks are needed to quantify how management practices can reduce climate risk and attract investment in climate change adaptation projects.
8.3 Insurance mechanisms
Investing in sustainable agricultural practices presents a formidable barrier to smallholder farmers who lack access to credit and information, have high personal discount rates and tend to avoid risks. A key component of adaptation is to reduce climate risk sufficiently so that farmers can take a chance on investment. Access to affordable risk mitigation instruments, such as crop or index insurance, can encourage farmers to invest in sustainable agriculture, thus achieving mitigation aims and increasing their resilience.
Weather index insurance, which covers weather risks such as droughts or floods, is one adaptation measure that should protect rural farmers from climate risk, allowing them to use high-risk but higher production crop varieties. Compared to traditional insurance, weather index insurance has low transaction costs, is very simple to administer and is objective. While traditional crop insurance is centered around damage to crops, index insurance is based on weather patterns such as rainfall. This bypasses the cost of assessing farm damage and removes any incentive for farmers to neglect their farms in order to receive payouts.

85
Compendium of Practices in Climate-Smart Agriculture and Solar Irrigation
While index insurance is an important innovation, it is not a comprehensive product and cannot eliminate all risks. It should be considered as one component of a holistic risk management mechanism that covers multiple risk types and should focus on enabling farmers to adopt new practices that can substantially increase their productivity and income. Incorporating a complementary risk reduction mechanism, in combination with the risk transfer (index insurance), has been proven to be a successful strategy in achieving scale. In addition, delivery through existing institutional frameworks and distribution channels has been key to successful implementation.
In general, to withstand shocks, innovation and investment are to be encouraged. There can be several options for insurance, such as:
• Formal crop insurance (state),
• Weather index-based (state),
• Microfinance insurance (private sector, NGOs),
• Social groups,
• Social networks (remittances, access options),
• Assets (self-insurance),
• Public works, safety nets.
Each insurance scheme is to be examined for biases and inclusiveness in a specific context.
Case study 8.1 Climate finance: lessons learned from western Kenya
Launched in September 2010, the Sustainable Agriculture in a Changing Climate (SACC) project in western Kenya focuses on supporting adoption by smallholder farmers of agroforestry practices that increase farm productivity, sequester carbon and build resilience to climate change. Originally framed as a carbon project, SACC is now evolving into an approach that puts primary emphasis on farm production and climate change adaptation, with mitigation regarded as
an additional benefit. The project aims to reach 50,000 farmers within 10 years. Across all elements of the SACC project and its learning agenda, particular emphasis is given to the potential benefits, costs and risks to women and other marginalized and/or vulnerable social groups. While the project is only in its initial stages, several key lessons stand out so far:
• Farmers’ income from tree products alone (fuelwood, poles, timber) during the life of the project is expected to be at least 50 times greater than carbon revenue, which is estimated at only USD 77 over 25 years. In addition, farmers receive indirect benefits from reduced labor to collect firewood, soil improvement, etc.
• Financing the SACC project from carbon credits alone is not viable. Instead, this initiative will require a combination of carbon and other financing. Considering the full range of socio-economic benefits can greatly increase the overall return on investment.
• Carbon accounting methodologies that are poorly suited to the realities of smallholder farming systems—which require flexibility in planting, management and harvesting—can compromise outcomes for farmers, increase drop-out rates and fail to capture substantial volumes of carbon sequestration.
• Cultural norms can constrain women’s participation in decision-making and access to project benefits; measures should be taken to enhance the participation of and benefits to women.

86
Compendium of Practices in Climate-Smart Agriculture and Solar Irrigation
Module 9. CSA InstitutionsThis module explains the role of institutions in the adoption of climate-smart agriculture.
Institutions play an important role in the adoption of climate-smart agriculture. Institutions and institutional arrangements serve important functions in information gathering and dissemination, resource mobilization and allocation, skills development and capacity building, and creating linkages between decision-makers and several other entities, including the farmers’ constituency. The institutional environment—which is broadly defined by prevailing legislation, policies, rules and regulations, programs and organizations providing CSA-related goods and services in a particular country or region—determines whether CSA practices will be implemented effectively or whether technology will be available and accessible to farmers. The institutional environment determines whether CSA practices and/or technologies will bring positive changes to the farmers’ livelihoods as ground implementers.
Farmers’ organizations (FOs) are part of the CSA institutional set-up and have a strong potential to consolidate and disseminate innovations developed by farmers themselves and ensure that farmers’ priorities are represented in the broader agricultural development agenda (http://www.sacau.org/role-institutions-facilitating-adoption-csa/, November 16, 2018).
9.0 Nationally Appropriate Mitigation Actions (NAMA)
Nationally Appropriate Mitigation Action (NAMA) refers to a set of policies and actions that countries undertake as part of a commitment to reduce greenhouse gas emissions. The term recognizes that different countries may take different nationally appropriate action on the basis of equity and in accordance with common but differentiated responsibilities and respective capabilities. It also emphasizes financial assistance from developed countries to developing countries to reduce emissions.
NAMA was first used in the Bali Action Plan as part of the Bali Road Map agreed at the UN Climate Change Conference in Bali in December 2007 and also formed part of the Copenhagen Accord issued following the UN Climate Change Conference in Copenhagen (COP 15) in December 2009. The detailed contents of countries’ submissions vary, ranging from their intention to be associated with the Copenhagen Accord, the target sectors and specific actions to be taken to GHG emissions reduction targets.
At COP 16 in 2010, developed countries agreed in Cancún to establish a Green Climate Fund (GCF) to provide financing for the developing countries. Their intention was to mobilize USD 100 billion per year by 2020. By the end of 2010, around 25 developing countries had announced their NAMAs.

87
Compendium of Practices in Climate-Smart Agriculture and Solar Irrigation
At COP 17 in Durban in 2011, the Green Climate Fund was launched. The fund channels funds for developing countries to reduce their greenhouse gas emissions and adapt to the negative impacts of climate change.
At COP 18 in Doha in 2012, several countries announced financial assistance through the NAMA Facility, among them the UK and Germany. For example, in 2017, those two countries committed to fund up to EUR 60 million for seven NAMA projects.
At COP 19 in Warsaw in 2013, a non-binding deadline for emissions reductions targets, called Intended Nationally Determined Contributions (INDCs), was established.
At COP 20 in Lima in 2014, developing countries shared their experiences in moving toward low carbon development during NAMA day.
At COP 21 in Paris in 2015, NAMAs that were contributing toward moving developing countries along a low-emissions development trajectory and helping to inspire further transformational action on the ground were showcased during the NAMA fair. The NAMA facility also announced to fund projects in Kenya, China and Colombia.
At COP 22 in Marrakesh in 2016, the Marrakech Partnership for Global Climate Action was established.
The number of NAMA proposals and concepts continues to grow steadily.
The priorities of developing countries are economic and social development and poverty eradication. India has argued that NAMA means voluntary reductions by developing countries that require to be supported and enabled by technology transfer from developed countries. By definition, NAMAs vary by country.
There are two different contexts for NAMAs (https://energypedia.info/wiki/Nationally_Appropriate_Mitigation_Actions_(NAMAs)#References):
• At the National Level as a formal submission by parties declaring intent to mitigate greenhouse gas emissions in a manner commensurate with their capacity and in line with their national development goals.
• At the Individual Action Level as detailed actions or groups of actions designed to help a country meet their mitigation objectives within the context of national development goals.
NAMAs are diverse, ranging from project-based mitigation actions to sectoral programs or policies. They
are either in preparation phase or in implementation phase, depending on the individual country (http://unfccc.int/documentation/documents/advanced_search/items/6911.php?priref=600007348).
NAMAs are important tools and building blocks for the implementation of NDCs.
• NAMAs are voluntary and the concept of NAMAs is defined rather by experience and practice than by rules set up by the UNFCCC. INDCs were fed into a legally binding mitigation commitment under the 2015 Paris agreement. After the Paris agreement, the word “intended” was dropped, and INDCs officially become Nationally Determined Contributions (NDCs). NCDs must be transparent, quantifiable, comparable, verifiable and ambitious. Furthermore, NAMAs are developed and implemented pre-2020, while NDCs are developed pre-2020 and implemented starting 2020 with an undefined end year.
• In their INDCs, some countries explicitly referred to NAMAs as tools for NDC implementation (Documents/Mongolia/1/150924_INDCs of Mongolia.pdf Mongolia).
To conclude, NAMAs are one of the most promising tools to mitigate GHG emissions, to implement NDCs, and to receive international support. It is clear that NAMAs will continue to play an important role in delivering transformational change and sustainable development.
9.1 Need for a systemic approach for CSA
To achieve success in climate-smart agriculture, there is a need for a systemic approach that involves certain changes at field, farm and technical levels and development of supporting institutions linking agricultural and food systems (CTCN, 2014). In particular:
1. The changes required in agricultural and food systems require the creation of supporting institutions and enterprises to provide services and inputs to smallholders, fishermen and pastoralists and to transform and commercialize their production more efficiently. These changes also require major investments from both the public and private sectors. These investments will drive economic development and create jobs, especially in rural areas and in countries where agriculture is a major economic sector.

88
Compendium of Practices in Climate-Smart Agriculture and Solar Irrigation
2. Changes in the field require the introduction of new inputs, techniques and services. Making them accessible to smallholders, pastoralists, fishermen and foresters, both physically and financially, is a major challenge.
3. Changes in farming systems should be accompanied by changes all along food chains. Diversification often requires changes along the entire food chain, from input production and distribution to collection, transformation and commercialization of products. For these reasons, diversification is often more easily carried out as a collective project. Several diversified farms can realize the same economies of scale on each of their production systems as a specialized one. This can lead to the creation of services; for example, the sharing of machinery and of collecting and selling production.
4. The introduction of better processing techniques that are more resource efficient not only reduces expenses but also often gives the opportunity to improve quality, exploit new markets and increase incomes. This in turn creates jobs in the agricultural and food sector as well as in other rural-based sectors.
Source: CTCN, 2014.
To improve the efficiency and resilience of food systems at every scale requires comprehensive governance at every level: local, national, regional and international. It shall involve all stakeholders, farmers, the agro-industry, retailers, consumers and public authorities.
At a global scale, there is an urgent necessity to better consider the interrelations between agriculture, food security and climate change.
Food security and climate change policies have to be better integrated at every level. Implementing CSA—and particularly adaptation—to climate change also requires adequate means to promote collective management of natural resources, such as water or landscape.
As pointed out by the High Level Panel of Experts on food security and nutrition in 2012, “Addressing food security and climate change requires concerted and coordinated involvement and action of many actors, farmers, private sector, and public actors national and international, civil society and NGOs. It is especially challenging as they are very different, sometimes have conflicting objectives and there is a need to work on a long-term perspective while most of them have to consider first a short-term outcome. This requires the involvement of all stakeholders.”
Integrating food security and climate change concerns has to be done at every level and pursued at different scales. It also needs to be performed on a day-to-day basis at the farm level. But it must be carried out with a long-term perspective at the landscape level and country level to design locally specific, coherent, inclusive and cohesive policy packages.
Case study 9.1 Conservation agriculture in Indonesia, Ethiopia, Tunisia, Spain and Bolivia between 1960 and 2010
Since the 1930s, there has been worldwide concern about the effects and impacts of land degradation. Much attention was paid to soil and water conservation in both developed and developing countries, initially through top-down regulations.
9.2 Good governance
CSA requires comprehensive governance, from local to international levels (FAO, 2013).
Figure 2.9 Good governance

89
Compendium of Practices in Climate-Smart Agriculture and Solar Irrigation
In the 1960s, governments stimulated the establishment of physical control measures, such as terraces, check dams and reforestation through top-down regulations and later with incentives, such as food aid in developing countries and subsidies in developed countries.
Each case study country has its own history of political regimes, institutions, special climatic events and other events which have shaped their soil and water conservation approaches and practices. But there are also a few common trends that can be distinguished. In the 1960s, Spain and Bolivia had military dictators and Ethiopia a feudal regime, while Indonesia and Tunisia were newly independent and following a more leftish approach with much state control and many production cooperatives. All these regimes acknowledged the need for soil and water conservation, which was in some cases triggered by major floods and droughts, thus a top-down approach was followed, with the ministries of forestry taking the lead in reforestation and terracing of agricultural land. Farmers were not involved and eventually abandoned or destroyed many of the SWC (soil and water conservation) measures. In Spain, some terraced land was abandoned altogether, because of out-migration to urban centers.
After the respective regimes and centralistic policies had changed, more attention was given to decentralization and farmer participation in the 1970s and 1980s, and government and non-government organizations (NGOs) were integrating aspects of soil and water conservation in rural development programs. There was already more diversity in SWC approaches and measures, but participatory approaches were not yet well developed and/or not very successful.
In the last two decades, there has been a further decentralization and a focus on market liberalization, which led to more diverse SWC or SLM approaches and measures. But it also drew more attention to the productivity and (short-term) viability aspects and less to security and protection and thus long-term viability aspects. Since 1990, SWC has broadened toward sustainable land management (SLM), which in the last decade has contributed to the further introduction of conservation agriculture, with varying degrees of success in the case study countries.Overall, because of the low success rate of this top-down approach with line interventions, it was realized that a
more participatory approach had to be followed. The emphasis shifted to area interventions, such as cover crops, mulching and composting. In some countries, voluntary ways of collaboration between farmers were developed. More recently, conservation agriculture has become popular, focusing on less soil disturbance, continuous land cover and crop rotations (de Graaffa et al., 2013).
9.3 Making CSA work for the poor
The key I-features of pro-poor CSA are:
• Inclusiveness at the global and the local level, to ensure that the poor benefit.
• Information about changing climatic conditions as well as possible responses.
• Innovation to develop and disseminate new practices and technologies.
• Investment in physical infrastructure and learning new ways.
• Insurance to cope with risks due to climate shocks and risks of adopting new practices.
ICRAF policy brief No 12 (Neufeldt et al., 2011) focuses on the challenges in making climate-smart agricultural production work for the poor, who are the most vulnerable to climate impacts. It offers recommendations to overcome constraints, as even small management changes can have significant income and livelihoods benefits.
There are three main constraints to adoption of climate-smart agriculture (CTCN, 2014):
1. Food insecure small-scale farmers find it hard to innovate and invest in better management systems when they are fully occupied with finding sufficient food to survive.
2. Many climate-smart agricultural practices incur establishment and maintenance costs, and it can take considerable time before farmers benefit from the practices.
3. Access to markets and capital are key constraints

90
Compendium of Practices in Climate-Smart Agriculture and Solar Irrigation
for resource-poor farmers and limit their ability to innovate and raise their income.
To address these constraints:
• Development and climate finance programs must focus on improving livelihoods and income so that there is incentive for small-scale farmers to invest in climate-smart agriculture.
• Combining practices that deliver short-term benefits with those that give longer-term benefits can help reduce opportunity costs and provide greater incentives to invest in better management practices.
• National agriculture development plans with appropriate institutions at local and national levels, provision of infrastructure, access to information and training and stakeholder participation and improvement of tenure arrangements are necessary for long-term transformation toward sustainable intensification and management of resources.
There is a need to transform agriculture, because by 2050, approximately 70% more food will have to be produced to feed growing populations, particularly in developing countries. Climate-smart agriculture has the potential to increase sustainable productivity, increase the resilience of farming systems to climate impacts and mitigate climate change through greenhouse gas emission reductions and carbon sequestration.
Climate-smart agriculture can have very different meanings depending upon the scale at which it is being applied. For example, at the local scale, it may provide opportunities for higher production through improved management techniques such as more targeted use of fertilizers. At the national scale, it could mean providing a framework that incentivizes sustainable management practices., and at the global scale it may equate to setting rules for the global trade of biofuels. It is not clear how actions at one scale may affect the others. For smallholder farmers in developing countries, the opportunities for greater food security and increased income, together with greater resilience, will be more important for adopting climate-smart agriculture than for mitigation opportunities. For intensive mechanized agricultural operations, the opportunities to reduce emissions will be of greater interest.
Case study 9.2 Innovation and food security
There is a distinct negative relationship between the number of food deficit months and the innovativeness of small farmers. Food security and innovation can both be seen as broad proxies for farmers’ abilities to cope with climate-related shocks, input constraints, access to assets and markets and changes to their lifestyles. Whether more innovative farmers are food secure or whether food-insecure farmers simply cannot invest in new technologies was analyzed in a 2011 study of 700 randomly chosen farm households across five sites in Ethiopia, Kenya, Tanzania and Uganda. Despite the wide range of livelihoods, climates and institutional settings across these sites, the findings show that innovation and food security significantly influence each other. The policy implications for each situation differ. If food security is dependent to some extent on the ability or willingness to innovate, it makes sense to look at the innovations that are already being made and identify the institutional arrangements and technical, management, capital, financing and market-relevant factors which allow for successful up-scaling. If food-insecure farmers are unable to innovate, then safety nets—such as cash, credits, insurance products or other goods—will be essential before they can make significant changes to their farming practices (Neufeldt et al., 2011).
Picture 9.1 Vision for farmer-centric accounting system for smallholders in developing countries
Source: CTCN, 2014.

91
Compendium of Practices in Climate-Smart Agriculture and Solar Irrigation
Case study 9.3 Farmer climate coping strategies
Smallholder farmers in western Kenya are aware that their climate coping strategies are not sustainable because they are forced to rely on actions that have negative long-term repercussions. These include eating seeds reserved for planting, selling assets (livestock, tree poles, etc.) at below market value, or building up debt in order to survive. Farmers in the study believe the most effective way to adapt to climate-related shocks is through improving their general standard of living. Interviews with food-insecure and food-secure farmers showed that poorer farmers were not investing in agroforestry or other improved management practices because they were entirely focused on activities related to improving their household’s food supply. Food-secure farmers, however, discussed goals related to their children’s education, the expansion of land holdings and other long-term investments. Similar results for China show that the opportunity costs for land are much higher for smallholder farmers than those with larger areas of land. Large-scale farmers took only a year after introducing improved grazing management practices to achieve net positive incomes. In contrast, small-scale farmers took 10 years to achieve similar results (Thorlakson, 2011).
9.4 How to overcome CSA challenges:
• Provide an enabling legal and political environment with a national plan, appropriate institutions and governance structures that coordinate between sectoral responsibilities and across national and local institutions.
• Improve market accessibility to enhance income-generating opportunities.
• Involve farmers in the project-planning process to ensure the development projects are relevant to local communities.
• Improve access to knowledge and training, including through farmer-to-farmer dissemination of knowledge about successful agricultural technologies.
• Introduce more secure tenure. For example, in Kenya, net returns on adjudicated land were approximately three times higher than those on unadjudicated land where tenure was less secure.
• Overcome the barriers of high opportunity costs to land: many improved management practices provide benefits to farmers only after considerable periods of time. As a result, poor households may be reluctant to incur costs that must be borne before the benefits can be reaped. Pairing short-term with longer-term practices may overcome some of the timing constraints.
• Improve access to farm implements and capital. Payments for carbon sequestration may be an appropriate way of covering the time lag between investing in climate-smart practices and obtaining the environmental and economic benefits. Other financial instruments, such as microcredits or index insurances, could provide the necessary funds or minimize risk to overcome these investment gaps.
9.5 Risk management and good practice
Climate change will add more risks to production and aggravate existing risks, especially for the more vulnerable. Increased variability and uncertainty make even more necessary the establishment of risk management strategies to address every type of risk, whether climate, animal or plant diseases.
Such strategies should combine specific policies targeted to address specific agents and categories of risks:
• Policies targeted at farmers can include measures aimed at building economic resilience at the farm level, by increasing income, enabling saving, promoting diversification or offering insurance.

92
Compendium of Practices in Climate-Smart Agriculture and Solar Irrigation
• Policies should also address risks along the food chain, including storage, post-harvest losses and food safety risks.
• Policies targeted at consumers would use measures specifically designed to address access to food.
The efficiency of any specific risk management policy is largely dependent on the existence of enabling policies, institutions, coordination mechanisms and basic infrastructure. For example, opening markets and adequate transport systems have an important role in diluting the impact of a shock over greater areas (CTCN, 2014).
Good practice in developing a climate-smart agriculture approach Good practice in developing a CSA approach should involve several key steps (FAO, 2019):
• Creating the evidence base for the approach,
• Supporting enabling policies and planning,
• Strengthening national and local institutions,
• Enhancing access to finance,
• Implementing practices in the field.
In addition, monitoring and evaluation is a key element for successful iterative implementation, and it should be integrated into the implementation steps.
Need for research Many climate-smart agricultural practices can be integrated into a single farming system, providing multiple benefits that can improve livelihoods and incomes. However, there are practices that cannot be integrated because they impact other elements of the farming system. For example, the timing of a practice may lead to labor constraints, high investment or maintenance costs may exceed the capacity of asset poor farmers, and competition for crop residues may restrict the availability of feed for livestock and biogas production. Identifying these constraints is important to developing economically attractive and environmentally sustainable management practices that have adaptation and mitigation benefits.
Likewise, CSA practices which are suitable for humid tropics (e.g., rice management) might be not appropriate in dryer areas (e.g., drip irrigation, grassland restoration) and vice versa, or to slopes (e.g., terraces, contour planting).
Tool 9.1 Stakeholder Approach to Risk Informed and Evidence Based Decision Making (SHARED Decision Hub)
The Stakeholder Approach to Risk Informed and Evidence Based Decision Making (SHARED) is a tailored method for stakeholder engagement, managing relationships and brokering multi-stakeholder partnerships and knowledge domains. These interactions are founded on a principle of fostering evidence-based decision-making.
SHARED was developed by ICRAF in 2013. The tool has been applied at subnational, national and international levels with development partners, government actors, the community and research.
The main objective of SHARED is to enable integrated planning around the interrelated dimensions and the use of accessible evidence to inform planning, decision-making and investments, with many of the impacts likely to be seen in a longer time frame.
SHARED brings together diverse actors across sectors, institutions and scales to address complex development challenges, using a systems approach that recognizes social, economic and environmental drivers of degradation while building the wide-ranging relationships needed to contribute to solutions.
SHARED is applied to complex systems that often include forested landscapes, agriculture and agroforestry. Agroforestry has been the focus of a number of SHARED engagements, but the tool can work in a range of scales and places.
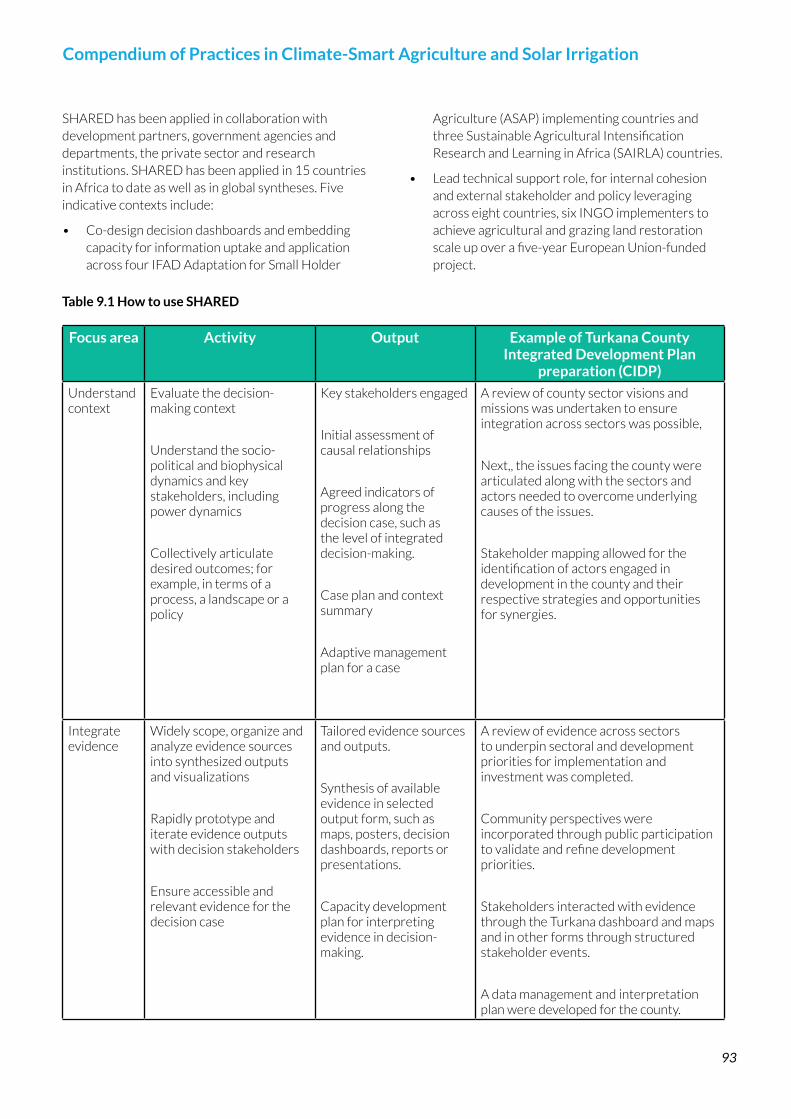
93
Compendium of Practices in Climate-Smart Agriculture and Solar Irrigation
Table 9.1 How to use SHARED
Focus area Activity Output Example of Turkana County Integrated Development Plan
preparation (CIDP)
Understand context
Evaluate the decision-making context
Understand the socio-political and biophysical dynamics and key stakeholders, including power dynamics
Collectively articulate desired outcomes; for example, in terms of a process, a landscape or a policy
Key stakeholders engaged
Initial assessment of causal relationships
Agreed indicators of progress along the decision case, such as the level of integrated decision-making.
Case plan and context summary
Adaptive management plan for a case
A review of county sector visions and missions was undertaken to ensure integration across sectors was possible,
Next,, the issues facing the county were articulated along with the sectors and actors needed to overcome underlying causes of the issues.
Stakeholder mapping allowed for the identification of actors engaged in development in the county and their respective strategies and opportunities for synergies.
Integrate evidence
Widely scope, organize and analyze evidence sources into synthesized outputs and visualizations
Rapidly prototype and iterate evidence outputs with decision stakeholders
Ensure accessible and relevant evidence for the decision case
Tailored evidence sources and outputs.
Synthesis of available evidence in selected output form, such as maps, posters, decision dashboards, reports or presentations.
Capacity development plan for interpreting evidence in decision-making.
A review of evidence across sectors to underpin sectoral and development priorities for implementation and investment was completed.
Community perspectives were incorporated through public participation to validate and refine development priorities.
Stakeholders interacted with evidence through the Turkana dashboard and maps and in other forms through structured stakeholder events.
A data management and interpretation plan were developed for the county.
SHARED has been applied in collaboration with development partners, government agencies and departments, the private sector and research institutions. SHARED has been applied in 15 countries in Africa to date as well as in global syntheses. Five indicative contexts include:
• Co-design decision dashboards and embedding capacity for information uptake and application across four IFAD Adaptation for Small Holder
Agriculture (ASAP) implementing countries and three Sustainable Agricultural Intensification Research and Learning in Africa (SAIRLA) countries.
• Lead technical support role, for internal cohesion and external stakeholder and policy leveraging across eight countries, six INGO implementers to achieve agricultural and grazing land restoration scale up over a five-year European Union-funded project.

94
Compendium of Practices in Climate-Smart Agriculture and Solar Irrigation
Focus area Activity Output Example of Turkana County Integrated Development Plan
preparation (CIDP)
Prioritize and plan
Engage in process management and sequencing of interactions with key actors.
Facilitate negotiating and prioritizing interventions and investments related to the decision case, using evidence
Additional evidence and research needs.
Plausibility assessment of initially agreed outcome such that the potential achievement and relevance of the agreed outcome are reviewed.
Prioritized intervention plan and stakeholder roles based on case needs and available evidence.
Strategic partnership proposals.
Linkages among targets, indicators and goals were understood and evaluated. Turkana stakeholders and department representatives reviewed sector targets as the base level and linked these targets and indicators up to the global scale of the Sustainable Development Goals to ensure achievements in the county contribute toward national and global development targets.
Each sectoral department determined the priorities based on the evidence, community perspectives, budget and the governor’s manifesto.
Develop cross-sectoral strategies along with cross-sectoral integrated flagships that address multiple issues simultaneously through coordination and partnerships for greater return on investment.
Learn and respond
Integrate monitoring and adaptive learning plan into decision cycle.
Adapt investment and implementation priorities.
Respond and integrate new evidence.
Agreed partnership roles and activities for learning and response.
Monitoring and adaptive learning response plan.
Indicators and targets identified through the planning process will be tracked by the county to inform a process of learning and response.
For any new project entering the county, a set of testing questions were determined to see if the project was a good fit for the county needs and priorities.
Table 9.1 How to use SHARED (cont.)
Source: ICRAF, 2013.

95
Compendium of Practices in Climate-Smart Agriculture and Solar Irrigation
Table 9.2 Effective use of SHARED
Where? Turkana Ethiopia, Tanzania, Zambia
Kenya, Mali, Senegal, Niger, Ghana, Rwanda, Ethiopia, Somalia
Global
When? 2013-2018 2016-2019 2017-ongoing 2016-2017
By whom? SHARED Hub with County Government, UN agencies and NGO partners
ICRAF and partners in each country
ICRAF and consortia of partners
ICRAF and FAO
For what? Evidence based inclusive decision making and development of integrated five year development plan
Bringing evidence to bear for enhanced sustainable agricultural intensification uptake.
Co-design of decision dashboards
Internal cohesion and external stakeholder and policy leveraging
Study, framework development and convening of an expert consultation around cross-sectoral collaboration and based in multi-country case studies
• Technical support role, for internal cohesion and external stakeholder and policy leveraging for sustainable wood fuel systems in Kenya and Tanzania.
• Technical support to devolved country development planning processes, such as managing a two-year inclusive process with the Ministry of Finance and Planning in Turkana County and landscape resilience and food security in Laikipia County.
• National and global studies and facilitated expert consultations on cross-sectoral collaboration for food security, climate smart agriculture and implementation of REDD+.
Impacts are largely in behavior shifts in targeted stakeholders, such as a request for more data, enhanced access and use of evidence through decision dashboards. A shift in stakeholder relationships has also been seen.
Within the Regreening Africa project, the SHARED tool is being used to support scaling of land restoration work through wider practice and policy work over 500,000 hectares of land.
Preconditions
The main challenge in using this tool is limited current availability and use of evidence to inform decisions and thus limited capacity to interpret and use evidence in many stakeholders. This challenge is being addressed through developing structured engagement processes that enhance evidence access, interpretation and developing outputs, such as accessible online decision dashboards that are co-designed by the end users.
Source: ICRAF, 2013.

96
Compendium of Practices in Climate-Smart Agriculture and Solar Irrigation
Module 10. CSA logframe
This module provides an example of a logframe for CSA.
10.0 Example of a CSA logframe: CCAFS–CGIAR activities, 2012–2015
Theme 1. Adaptation to Progressive Climate Change
MILESTONES (OUTPUT TARGETS)
PERFORMANCE INDICATOR
MEANS OF VERIFICATION
ASSUMPTIONS PARTNERS
Objective 1.1 Analyze and design processes to support adaptation of farming systems in the face of future uncer-tainties of climate in space and time.
Outcome 1.1: Agricultural and food security strategies that are adapted towards predicted conditions of climate change promoted and communicated by the key development and funding agencies (national and international), civil society organizations and private sector in at least 20 countries.
Output 1.1.1 Development of farming systems and production technologies adapted to climate change conditions in time and space through design of tools for improving crops, livestock, agronomic and natural resource manage-ment practices.
Milestone 1.1.1 2012 (1). Platform established for multi-location trials of technologies and geno-types for GxE interaction analysis and the calibra-tion and evaluation of crop models.
Number of unique geographic locations, where individual and multi site tri-als are carried out; assessment of related information and meta-data collected; and exchange of derived information.
Task report; website/ AMKN platform.
Willingness of part-ners to carry out the trials and share the trial data.
CIAT and other CGIAR centers, CIRAD, JIRCAS, NA-RES (e.g. EIAR, KARI, NARO, IARI, CRIDA, BARC, BARI NARC, CILSS, etc) and other ARI institutions in-volved in agricultural trials.

97
Compendium of Practices in Climate-Smart Agriculture and Solar Irrigation
MILESTONES (OUTPUT TARGETS)
PERFORMANCE INDICATOR
MEANS OF VERIFICATION
ASSUMPTIONS PARTNERS
Milestone 1.1.1 2013. Tools and guidelines developed to support the selection (and / or maintenance) of the most appropriate water storage options and/ or their combinations for river basin development planning under conditions of increasing climate variability; options most likely to benefit or adversely affect marginal social groups including women assessed. Reviews of tools and guidelines, including links to individual guidelines and access to tools, with explicit recognition of gender and social differentiation.
Tools and guidelines developed, reviewed and made publicly available. Hydro-economic and socio-economic methodologies to quantify climate change impacts at water shed and sub-basin level (IWMI). Brief on their use to promote gender and social inclusion.
CCAFS website; review documents.
Willing uptake of tools and guidelines; sufficiently accurate predictions of future water storage deficits and needs.
IWMI,WRI- Ghana,PIK,ZEF, MRC.
Milestone 1.1.1 2014. Analogue based evaluation and conservation of germplasm of at least 2 crops supported in a minimum of 6 analogue sites.
Field evaluation of germplasm for specific traits; collection efforts for land races in analogue sites.
Final report and peer reviewed article.
Bioversity.
Milestone 1.1.1 2015 (1). One to five flagship technologies that are gender and socially-responsive identified, developed and demonstrated in each of the 3 initial target regions which would directly enhance the adaptive capacity of the farming systems to the climate change conditions. Launch through high level engagement with key stakeholders at a key international meeting.
Technologies developed and made publicly available. Positive feedback and increased demand of new technologies by the clientele. Field validation and assessment including criteria for assessing their social and gender implications during field visits by different stakeholders made as a part of 2015 visits.
website; documentation for annual reporting.
Willingness and interest of local partners in nominating candidate technologies and managing the trials at pilot sites.
CGIAR centers in collaboration with other themes in the MP, NARES, ARIs, CIRAD, NGOs, national governments, Farmers’ organizations.
Milestone 1.1.1 2012 (2). Robust method developed for calculating spatial and temporal analogue of climate. Partner co-authored peer-reviewable method developed and tested codes using pattern scaled HadCM3 climate output. Case studies conducted in at least 2 analogue sites in each region
Methods developed and made publicly available through developed communication platforms; Application to G x E analysis; farmer experimental networks initiated in 2011 for variety/germplasm evaluation strengthened
CCAFSwebsite/ AMKN platform ; documentation for annual reporting
Robustness of testable methods using only climate model output (i.e. pattern- scaled HadCM3)
CIAT, University of Leeds

98
Compendium of Practices in Climate-Smart Agriculture and Solar Irrigation
MILESTONES (OUTPUT TARGETS)
PERFORMANCE INDICATOR
MEANS OF VERIFICATION
ASSUMPTIONS PARTNERS
Milestone 1.1.1 2015 (2). Analogue Research results synthesized, documented, published and communicated at all levels.
Methods developed and made publically available online and through downloadable scripts. Full documentation available. Regional reorts on analogues results published in CCAFS reports. Dissemination of results in targeted workshop at national level.
CCAFS website, documentation for annual reporting.
Analogue method successfully developed and deemed a useful approach by stakeholders.
University of Oxford, University of Greenwich, ICRISAT, CIAT, ICRAF, NARES, Intl NGOs.
Milestone 1.1.1 2012 (3). Practices developed that enhance the efficiency of water use in aquaculture and small scale irrigation (eg, increased productivity per unit use of water; increased irrigable area with same amount of water); Time series differential productivity and irrigated area analysis. The social and gender implications of applying these practices assessed.
Practices developed and made publicly available to different types of beneficiary groups
CCAFS website; documentation for annual reporting
Existence of aquaculture farms and terrestrial agriculture in close proximity; Recyclable use of water between aquaculture and field agriculture, including tree crops.
CCAFS, NARES, ARIs, IWMI, ICRAF.
Milestone 1.1.1 2012 (4). Assessment of the potential for exploitation of ground water for crop production in at least three basins.
Maps demonstrating the potential for groundwater exploitation, which take adequate account of uncertainty.
Report, and potentially peer-reviewed paper.
Sufficient groundwater available for exploitation at least some sites.
IWMI, WRI-Ghana, PIK, ZEF, MRC, OSS.
Output 1.1.2 Building of regional and national capacities to produce and communicate socially inclusive adaptation and mitigation strategies for progressive climate change at the national level (e.g. through NAPAs).

99
Compendium of Practices in Climate-Smart Agriculture and Solar Irrigation
MILESTONES (OUTPUT TARGETS)
PERFORMANCE INDICATOR
MEANS OF VERIFICATION
ASSUMPTIONS PARTNERS
Milestone 1.1.2 2012. At least 10 countries capacitated to spatial and temporal analogues in EA, WA and IGP. Training workshop(s) organized and videos produced on the use of the Analogue methodology (for examining both spatial and temporal analogues based on multiple climate projections, see milestone 1.1.1 2012 (2)). Engagement of key IGP stakeholders such as national universities, NARC, ICAR (DWR), BARC, NGOs; Farmer exchanges including at least 40% women convened among analogue sites integrating analysis of social, cultural and gender– disaggegated barriers to adaptation.
Capacity building workshops; Two trainings delivered engaging 25 participants; min 2 videos produced; understanding social, gender-differentiated and cultural barriers to adapting through farmer exchanges; exchanges convened engaging men and women farmers in 2 regions.
CCAFS website; documentation for annual reporting; participant lists for film showings, trainings and exchanges.
National universities, ICAR, BARC, NARC, NGOs. University of Greenwich (NRI), University of Oxford, and local partners from IGP, EA and WA involved in the implementation phase of the farmer exchanges.
Milestone 1.1.2 2013 (1). New knowledge developed on (1) the potential application domains for agricultural and water management practices, technologies and policies (including maps), prioritized on the basis of their potential benefits for marginal social groups, especially women and (2) best means of transferring these technologies and ensuring their adoption to gender and socially- differentiated beneficiary groups; findings synthesized and presented in report and journal articles.
Synthesis report and journal articles completed and disseminated.
CCAFS website; Journal publishers’ websites.
Availability of sound climate projections to 2030 and beyond.
CGIAR Centers, ESSP (e.g. Leeds University), NARES and ARIs.
Milestone 1.1.2 2014 (1). Researchers and development agents trained on socially and gender-sensitive strategies for the conservation and use of local biodiversity within the climate change context.
Trainings held engaging at least 20 male and female R&D agents representing at least 5 organizations from 3 countries (Nepal, Bolivia and India).
Training participant lists; documentation for annual reporting.
MS Swaminathan Research Foundation, India; Local Initiative for Biodiversity, Research and Development (LI-BIRD), Nepal; PROINPA, Bolivia; Semongok Agriculture Research Centre (ARC), Sarawak Malaysia.

100
Compendium of Practices in Climate-Smart Agriculture and Solar Irrigation
MILESTONES (OUTPUT TARGETS)
PERFORMANCE INDICATOR
MEANS OF VERIFICATION
ASSUMPTIONS PARTNERS
Milestone 1.1.2 2013 (2). Research and development partners (especially female and young scientists) in at least 11 countries trained in using new monitoring and modelling tools for climate change adaptation for different crops including underutilized species; outcomes summarized in report.
Reports completed and disseminated; training materials developed and delivered; young and female scientists actively using new tools.
CCAFS website. Regional Universities Forum for Capacity Building in Agriculture (RUFORUM), Uganda; International Foundation for Science (IFS), Sweden; African Network for Agriculture, Agroforestry and Natural Resources Education (ANAFE), Kenya; Institut de Recherché et de Développment sur la Biodiversité des Plantes Cultivées, Aromatiques et Médicinales (IRDCAM), Benin; Plant Genetic Resources Research Institute (PGRRI), Ghana; University of Nairobi, Kenya; LI-BIRD, Nepal; MS Swaminathan Research Foundation, India; PROINPA, Bolivia.
Milestone 1.1.2 2014 (2). Gender-sensitive and socially differentiated strategies developed for conservation and use of local biodiversity within the climate change context; findings presented in strategy document, journal article.
Strategy document completed and disseminated; journal article published.
CCAFS website; Journal publisher’s website.
MS Swaminathan Research Foundation, India; Local Initiative for Biodiversity, Research and Development (LI-BIRD), Nepal; Semongok Agriculture Research Centre (ARC), Sarawak Malaysia; PROINPA, Bolivia.
Milestone 1.1.2 2013 (3). Capacities raised in at least 6 countries to assess the impacts of climate change on crops and identifying pro-poor and gender-responsive adaptation strategies at the subnational scale using crop models and gender-differentiated local knowledge (links with T4.2). Additional case studies on climate analogues initiated in at least 12 more analogue sites.
Capacity building workshops on crop modeling, climate change scenarios; case studies commissioned on simulation of impacts; case studies on climate analogues extended to more sites.
National workshops, CCAFS reports.
Suitable data available for assessing socially-differentiated impacts.
University of Oxford, ICRISAT, CIAT, ICRAF, NARES, Intl NGOs.
Output 1.1.3 New knowledge, guidelines and access to germplasm are provided for using genetic and species diversity to enhance adaptation, productivity and resilience to changing climate with benefits for socially marginal groups.

101
Compendium of Practices in Climate-Smart Agriculture and Solar Irrigation
MILESTONES (OUTPUT TARGETS)
PERFORMANCE INDICATOR
MEANS OF VERIFICATION
ASSUMPTIONS PARTNERS
Milestone 1.1.3 2012 (1). Approaches, methods and tools for gender and socially-sensitive partic-ipatory assessment of where and when bio-diversity rich practices facilitate adaptation to climate change reviewed; findings summarized in report.
Consultation workshops; report completed and disseminated. Num-ber of gender and socially differentiat-ed communities and individuals surveyed, number of methods and tools tested.
CCAFS website; documentation for annual reporting; workshop agendas and participant lists.
International Union for Conservation of Nature (IUCN), Switzerland; PROIN-PA, Bolivia; LI-BIRD, Nepal; MS Swam-inathan Research Foundation, India; German experts (incl. Prof. K. Hammer); FAO, the Interna-tional Treaty on Plant Genetic resources for Food and Agriculture (ITPGRFA); Univer-sity of Perugia, Italy; University of Basil-icata, Italy; Regione Abruzzo & Regione Basilicata, Italy).
Milestone 1.1.3 2013 (1). Germplasm (wild and domesticated) with traits important for adapting to climate change and traits with potential benefits for different user groups conserved in local, national and regional ex situ collections and made available to target users; findings presented in peer-reviewed journal articles and genebank reports; databases aug-mented.
Collections and databases expanded and made publicly available; reports completed and dis-seminated; journal articles published.
Germplasm col-lection records; CCAFS website; Journal publishers’ websites; documen-tation for annual reporting.
Partners willing to share germplasm and knowledge; Farmers are willing participate in household surveys; local seed suppliers are willing to adopt locally adapted varieties; Rural radio partners are a credible source of information. Farmers have access to radios.
Institute of Biodi-versity and Con-servation, Ethiopia; National Agricultural Research Institute, PNG; Institut d’Econ-omie Rurale, Mali; Indian Council of Agricultural Re-search, India; Mil-lennium seed bank; BGCI; Members of the Musa Taxonomy Advisory Group.
Milestone 1.1.3 2014 (1). Accessions identified with potential adaptive traits for climate change adaptation for at least 5 crops using innovative methods and prioritized on the basis of traits with potential benefits for the poor and women users. Methodology to select genebank material adapted to local current climate conditions and future climate shifts developed and tested and crop suitability atlases for priority crops (as de-fined by fraction of total production accounted for) produced; findings presented in reports and journal articles.
Reports completed and disseminated. Journal articles published. Lists produced (e.g., adapted local vari-eties conserved in genebanks; newly and already collect-ed domesticated and wild germplasm adapted to climate change noting their potential for pro- poor and gender-re-sponsive benefits). Methodology developed and made publicly available.
CCAFS website; journal publishers’ websites.
Adaptation traits easily identifiable and availability of sufficient data. Good Georefer-enced data for accessions are available. Exchange of germplasm supported by participating coun-tries. Local seed providers ready to participate and collaborate with the project. Policy framework in place for sharing of infor-mation. Sufficient cross-site similar-ity for transfer of lessons, germplasm and tools.
CIAT; Institute of Biodiversity and Con-servation, Ethiopia; National Agricultural Research Institute, Papua new Guin-ea (PNG); Institut d’Economie Rurale, Mali; Indian Council of Agricultural Re-search, India; Mil-lennium Seed Bank, UK; Botanic Garden Conservation Inter-national (BGCI), UK; members of the Musa Taxonomy Advisory Group; University of Philippines Los Banos (UPLB), Philippines; KULeuven, Belgium; CIALCA partners; Semongok Agricul-ture Research Centre (ARC), Sarawak Malaysia; PROINPA, Bolivia.
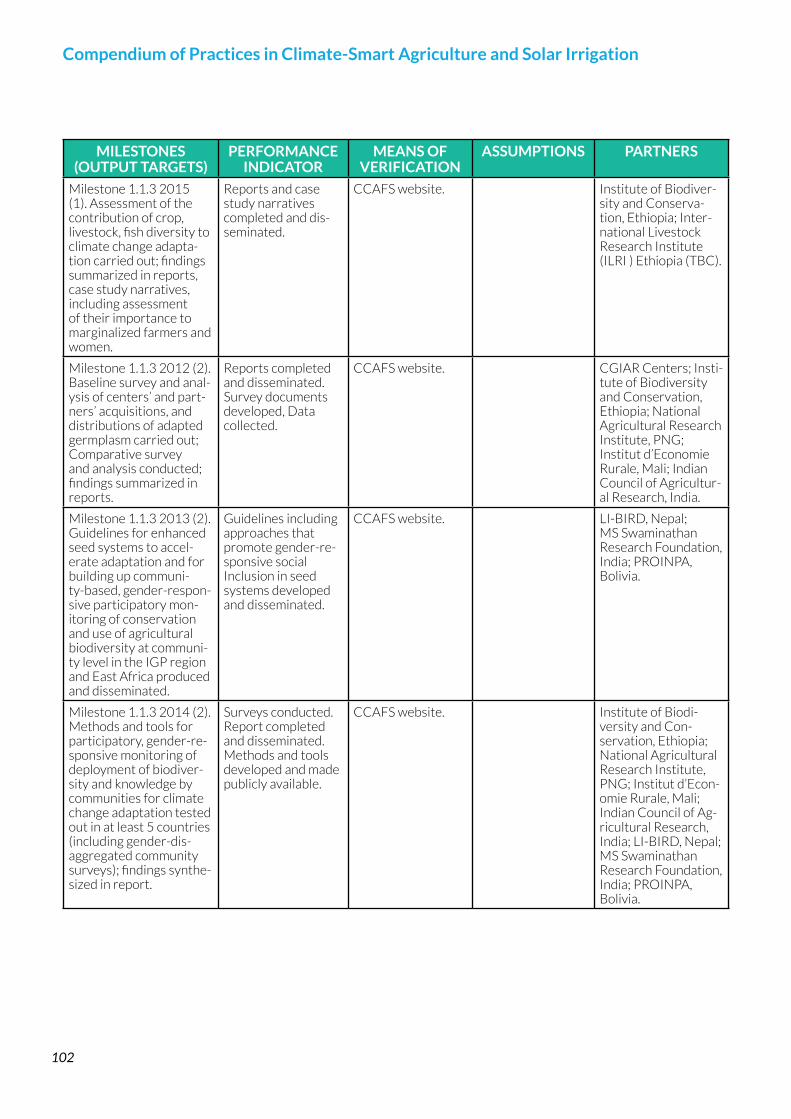
102
Compendium of Practices in Climate-Smart Agriculture and Solar Irrigation
MILESTONES (OUTPUT TARGETS)
PERFORMANCE INDICATOR
MEANS OF VERIFICATION
ASSUMPTIONS PARTNERS
Milestone 1.1.3 2015 (1). Assessment of the contribution of crop, livestock, fish diversity to climate change adapta-tion carried out; findings summarized in reports, case study narratives, including assessment of their importance to marginalized farmers and women.
Reports and case study narratives completed and dis-seminated.
CCAFS website. Institute of Biodiver-sity and Conserva-tion, Ethiopia; Inter-national Livestock Research Institute (ILRI ) Ethiopia (TBC).
Milestone 1.1.3 2012 (2). Baseline survey and anal-ysis of centers’ and part-ners’ acquisitions, and distributions of adapted germplasm carried out; Comparative survey and analysis conducted; findings summarized in reports.
Reports completed and disseminated. Survey documents developed, Data collected.
CCAFS website. CGIAR Centers; Insti-tute of Biodiversity and Conservation, Ethiopia; National Agricultural Research Institute, PNG; Institut d’Economie Rurale, Mali; Indian Council of Agricultur-al Research, India.
Milestone 1.1.3 2013 (2). Guidelines for enhanced seed systems to accel-erate adaptation and for building up communi-ty-based, gender-respon-sive participatory mon-itoring of conservation and use of agricultural biodiversity at communi-ty level in the IGP region and East Africa produced and disseminated.
Guidelines including approaches that promote gender-re-sponsive social Inclusion in seed systems developed and disseminated.
CCAFS website. LI-BIRD, Nepal; MS Swaminathan Research Foundation, India; PROINPA, Bolivia.
Milestone 1.1.3 2014 (2). Methods and tools for participatory, gender-re-sponsive monitoring of deployment of biodiver-sity and knowledge by communities for climate change adaptation tested out in at least 5 countries (including gender-dis-aggregated community surveys); findings synthe-sized in report.
Surveys conducted. Report completed and disseminated. Methods and tools developed and made publicly available.
CCAFS website. Institute of Biodi-versity and Con-servation, Ethiopia; National Agricultural Research Institute, PNG; Institut d’Econ-omie Rurale, Mali; Indian Council of Ag-ricultural Research, India; LI-BIRD, Nepal; MS Swaminathan Research Foundation, India; PROINPA, Bolivia.

103
Compendium of Practices in Climate-Smart Agriculture and Solar Irrigation
MILESTONES (OUTPUT TARGETS)
PERFORMANCE INDICATOR
MEANS OF VERIFICATION
ASSUMPTIONS PARTNERS
Milestone 1.1.3 2015 (2). Germplasm information on potential for climate change adaptation inte-grated in global informa-tion systems and accessi-ble online. (1) Databases of priority collections augmented with georef erenced passport data and trait information use-ful to the diversity anal-ysis for climate change impacts and adaptation effectively linked to glob-al systems, (2) important trait information acces-sible in global systems, including GENEYSYS, and Crop Trait ontology augmented with traits of interest to Climate Change , (3) comple-mentary data sources on wild species identified through GBIF, (4) training materials, (5) list of and information on newly and already collected germ-plasm (domesticated and wild) adapted to climate change; Materials of interest safely duplicated in Global Collection and made available.
(1) Databases, ac-cession information, data, training mate-rials, lists developed and made publicly available. (2) Acces-sion level informa-tion with quality geo references; (3) Data on duplication to global collection and important trait in-formation published in GENESYS;(4) Complementary data sources on wild species identified through GBIF; (5) training materials. List of and informa-tion on newly and already collected germplasm (domes-ticated and wild) adapted to climate change noting any potential for use in pro-poor and gen-der-responsive adap-tation strategies.
CCAFS/other websites; technical reports, Genebank catalogues; data-bases.
Global Crop Diver-sity Trust; priority national/ regional Collections; CGIAR genebanks; EURISCO partners; PGR net-works; the Interna-tional Treaty on Plant Genetic resources for Food and Agriculture (ITPGRFA),Italy; Unit-ed States Department of Agriculture (USDA), USA; Global Diversity Information Facility (GBIF), Denmark; Bio-Geomancer Research consortium; Sud Ex-perts Plantes members (IRD/AIRD), France; Botanic Garden Conservation Inter-national (BGCI), UK; Generation Challenge Programme, Mexico; International Musa Testing Programme partners.
Milestone 1.1.3 2013 (3). Farmers’ traditional, gen-der-differentiated knowl-edge on use of diversity and climate change adaptation documented and made available in at least 3 countries; findings presented in databases, reports and peer re-viewed article.
Databases produced and made publicly available; reports completed and dis-seminated; journal articles published.
CCAFS website; Journal publishers’ websites; documen-tation for annual reporting.
Institute of Biodiver-sity and Conservation, Ethiopia; National Agricultural Research Institute, PNG; Institut d’Economie Rurale, Mali; Indian Council of Agricultural Research, India.
Milestone 1.1.3 2015 (3). Case studies docu-mented of potential role of informal seed systems for pro-poor and gender responsive diffusion of adapted germplasm.
Case studies;

104
Compendium of Practices in Climate-Smart Agriculture and Solar Irrigation
MILESTONES (OUTPUT TARGETS)
PERFORMANCE INDICATOR
MEANS OF VERIFICATION
ASSUMPTIONS PARTNERS
Milestone 1.1.3 2013 (4). Data gathered on how communities enhance conservation and use of local biodiversity with-in the climate change context, disaggregated by gender and other social strata; findings summa-rized in technical reports, factsheets and journal articles.
Technical reports, fact sheets includ-ing implications for pro-poor and gender responsive con-servation and use completed and dis-seminated; journal articles published.
CCAFS website; Journal publisher’s website.
MS Swaminathan Research Foundation, India; Local Initiative for Biodiversity, Re-search and Develop-ment (LI-BIRD), Nepal; PROINPA, Bolivia.
Full logframe can be accessed at: https://cgspace.cgiar.org/bitstream/handle/10568/32804/ccafs_consolidat-ed_logframe-2012-2015.pdf.
Reference
CCAFS (2012) Consolidated logframe of activities 2012-2015. CGIAR Research Program on Climate Change, Agriculture and Food Security (CCAFS). Copenhagen, Denmark.

105
Compendium of Practices in Climate-Smart Agriculture and Solar Irrigation
CGIAR Research Program on Climate Change Agricul-ture and Food Security (CCAFS): https://ccafs.cgiar.org/.
Inter-Agency Working Group on Climate Smart Agricul-ture in International Development: https://rmportal.net/groups/csa/about-csa.
Food and Agriculture Organization of the United Na-tions: http://www.fao.org/climate-smart-agriculture/en/.
Global Alliance on Climate Smart Agriculture (GACSA): http://www.fao.org/gacsa/en/.
World Bank: http://www.worldbank.org/en/topic/agricul-ture.
Africa CSA: http://africacsa.org/.
SNV Netherlands Development Organisation: http://www.snv.org/theme/climate-change.
Farming First: http://www.farmingfirst.org/tag/cli-mate-smart-agriculture/.
CSA Youth Network: https://csayouthnetwork.word-press.com/.
Compendium references AfSIS (2020) About Africa Soil Information Service. http://africasoils.net/about/.
AMIS (2020) Agricultural Market Information System. http://www.amis-outlook.org/amis-about/en/.
APSIM (2020) What is APSIM? https://www.apsim.info/apsim-model/.
Ayana, M., Eshetu, F. and Tadele, K. (2005) Simple and low-cost drip irrigation system: an alternative approach to raise household farm productivity. IWMI workshop paper. http://publications.iwmi.org/pdf/H039819.pdf.
Banerjee, C. (2014) Up, Up and Away! The Economics of Vertical Farming . Journal of Agricultural Studies ISSN 2166-0379, Vol. 2, No. 1. http://www.macrothink.org/journal/index.php/jas.
Bames and Fagg, (2003) Faidherbida albida Monograph and annotated bibliography. https://www.researchgate.
CSA Database of key documents
Key websites and references
net/publication/308681316_Faidherbida_albida_Monograph_and_annotated_bibliography.
Bureau, R.M. (2018) Pros and cons of solar powered irrigation system. https://ruralmarketing.in/news/international/pros-cons-of-solar-powered-irriga-tion-systems.
Bogdanski, A., Dubois, O., Jamieson, C. and Krell, R. (2011) Making Integrated Food-Energy Systems Work for People and Climate: An Overview. FAO. http://www.fao.org/3/i2044e/i2044e.pdf.
Bouman, B., Peng, S., Castan A., Visperas, R. (2005) Yield and water use of irrigated tropical aerobic rice systems. Agricultural Water Management, Volume 74, Issue 2: 87–105. Available at: http://www.sciencedi-rect.com/science/article/pii/S0378377404003257.
CGIAR CCAFS (2020) Low emissions development tools. https://ccafs.cgiar.org/research/low-emis-sions-development/tools.
CCAFS (2012) Consolidated logframe of activities 2012-2015. CGIAR Research Program on Climate Change, Agriculture and Food Security (CCAFS). Copenhagen, Denmark: CGIAR Research Program on Climate Change, Agriculture and Food Security (CCAFS).
Cicekli, M. and Barlas, N. (2014) Transformation of to-day greenhouses into high technology vertical farming systems for metropolitan regions. Journal of Environ-mental Protection and Ecology 15, No 4, 1779–1785.https://docs.google.com/a/jepe-journal.info/view-er?a=v&pid=sites&srcid=amVwZS1qb3VybmFsLm-luZm98amVwZS1qb3VybmFsfGd4OjQ1MzQ3ZT-RhYzI2YTRlNjk.
CIMMYT (2010) Resource conserving technologies in South Asia: Frequently asked question. Jat ML, Singh RG, Sidhu HS, Singh UP, Malik RK, Kamboj BR, Jat RK, Singh V, Hussain I, Mazid MA, Sherchan DP, Khan A, Singh VP, Patil SG, Gupta R. pp 1-32.
CSA, FAO (2010) “Climate-Smart” Agriculture, Policies, Practices and Financing for Food Security, Adaptation and Mitigation, FAO, 2010. http://www.fao.org/3/i1881e/i1881e00.htm.
CTCN (2020) Conservation tillage. https://www.ctc-n.org/technologies/conservation-tillage.
CTCN (2014) ICRAF webinar on climate-smart agri-culture. Grey literature.

106
Compendium of Practices in Climate-Smart Agriculture and Solar Irrigation
de Graaff, J., Aklilu, A., Ouessar, M., Asins-Velis, S., Kes-sler, A. (2013) The development of soil and water con-servation policies and practices in five selected countries from 1960 to 2010. Land Use Policy, Volume 32, Pages 165-174. http://www.sciencedirect.com/science/article/pii/S0264837712002062.
Decision Dashboards: http://www.worldagroforest-ry.org/output/decision-dashboards (https://www.worldagroforestry.org/sites/agroforestry/files/out-put/attachments/Decision%20dashboards%20informa-tion%20sheet.pdf).
Dekens, J. and Bagamba, F. (2014) Promoting an inte-grated approach to climate adaptation: Lessons from the coffee value chain in Uganda. Climate resilient value chains briefing note series. https://www.iisd.org/system/files/publications/value_chains_coffee_uganda_brief-ing_note.pdf.
Dinnes D.L. (2004): Assessment of practices to reduce Nitrogen and potassium non-point source pollution of Iowa’s surface waters, Iowa Dept. of National resources, Des Moines, LA.
ECOCROP (2020) Crop Ecological Requirements Database. http://www.fao.org/land-water/land/land-gov-ernance/land-resources-planning-toolbox/category/details/en/c/1027491/.
Evidence Based Planning and Decision Making for Devolved Counties: Experiences from Turkana County: http://www.worldagroforestry.org/output/evidence-based-planning-and-decision-making-de-volved-counties-experiences-turkana-county.
Food Agriculture Natural Resources Policy Analysis Network (FANRPAN) (2012) Engaging youth in cli-mate-smart agriculture. Policy brief series. Issue No. 1: Volume XII.. JSTOR collection. https://www.jstor.org/sta-ble/resrep00704?seq=4#metadata_info_tab_contents.
FAO (2020) Land and Water. http://www.fao.org/land-water/databases-and-software/en/.
FAO (2019) Climate-smart agriculture and the Sus-tainable Development Goals: Mapping interlinkages, synergies and trade-offs and guidelines for integrated implementation. Rome. file:///C:/Users/User/Down-loads/CA6043EN.pdf.
FAO (2018) The benefits and risks of solar - powered irrigation: a global overview. http://www.fao.org/3/i9047en/I9047EN.pdf.
FAO (2013) Climate-smart agriculture sourcebook. http://www.fao.org/docrep/018/i3325e/i3325e.pdf.
FAO (2013) Climate-smart agriculture sourcebook. Rome. 558 pp. http://www.fao.org/docrep/018/i3325e/i3325e.pdf.
FAO (2011) The state of food and agriculture: women in agriculture closing the gender gap for developing. Rome 160 p. http://www.fao.org/3/i2050e/i2050e.pdf.
FAO (2011) Sustainable land management in practice: cross-slope barriers: pp114-119. http://www.fao.org/docrep/014/i1861e/i1861e07.pdf.
FAO (2010) “Climate-Smart” Agriculture: Policies, Prac-tices and Financing for Food Security, Adaptation and Mitigation. Rome: Food and Agriculture Organization (FAO).
FAO (2009) Harvesting agriculture’s multiple benefits: Mitigation, Adaptation, development and Food Security. FAO Policy Brief.
Foster K, Neufeldt H, Franks P, Diro R, Munden L, Anand M, Wollenberg E. (2013) Climate Finance for Agriculture and Livelihoods. ICRAF Policy Brief 15. Nairobi, Kenya. World Agroforestry Centre (ICRAF).
Garrity, D. (2010) Evergreen agriculture: A robust ap-proach to sustainable food security in Africa. https://link.springer.com/article/10.1007/s12571-010-0070-7.
Gutierrez-Montes, I., Arguedas, M., Ramirez-Aguero, F., Mercado, L., Sellare, J. (2020) Contributing to the construction of a framework for improved gender integration into climate-smart agriculture projects monitoring and evaluation: MAP-Norway experience. Climatic Change 158, 93–106. https://link.springer.com/article/10.1007/s10584-018-2231-1.
Gutiérrez-Montes I, Ramirez F (2016) The Mesoamer-ican Agro-environmental Program: critical lessons learned from an integrated approach to achieve Sus-tainable Land Management. In: Méndez E, Bacon C, Cohen R, Gliessman, S. Agroecology: a transdisciplinary, participatory, and action-oriented approach. https://www.researchgate.net/publication/300225675_The_Mesoamerican_Agroenvironmental_Program_Criti-cal_Lessons_Learned_from_an_Integrated_Approach_to_Achieve_Sustainable_Land_Management.
Gutiérrez-Montes I, Emery M, Fernandez-Baca E (2012) Why gender matters to ecological management and poverty reduction. Integrating Ecology and Poverty Reduction, Springer, pp 39–59. https://link.springer.com/chapter/10.1007/978-1-4614-0186-5_4.
Hall, A. (2004) Breeding for adaptation to drought and heat in cowpea. European Journal of Agronomy. Volume 21, Issue 4: 447–454.
107
Compendium of Practices in Climate-Smart Agriculture and Solar Irrigation
IPCC (2014) Climate change 2014: Syn-thesis report. https://books.google.co.uz/books?hl=en&lr=&id=aJ-TBQAAQBAJ&oi=fnd&p-g=PA1142&dq=Climate+Change+2014:+Synthe-sis+Report&ots=v2LzPJb6EI&sig=luxqf5aqanY_CA6TWUraUMmpBzo&redir_esc=y#v=onepage&q=-Climate%20Change%202014%3A%20Synthesis%20Report&f=false.
Kabeer N (2005) Gender equality and women’s empow-erment: a critical analysis of third millennium develop-ment goal. Gend Dev 13(1):13–24. https://www.amherst.edu/media/view/232742/original/Kabeer%2B2005.pdf.
Kamara, A.. Kureh, I., Menkir A., Kartung, P., Tarfa, B., and Amaza, P. (2006) Participatory on-farm evaluation of the performance of drought-tolerant maize varieties in the Guinea savannas of Nigeria. International Journal of Food, Agriculture and Environment. Vol.4,No 1: 192-196. Available at: http://cat.inist.fr/?aModele=afficheN&cp-sidt=17447320.
Keating, B. & Carberry, P.S. & Hammer, G. & Probert, M.E. & Robertson, M.J. & Holzworth, Dean & Huth, N.I. & Hargreaves, John & Meinke, Holger & Hochman, Z & McLean, Greg & Verburg, K & Snow, Val & Dimes, John & Silburn, David & Wang, E & Brown, S & Bristow, Keith & Asseng, Senthold & Smith, Chris. (2003). An overview of APSIM, a model designed for farming systems simulation. European Journal of Agronomy. 18. 267-288. 10.1016/S1161-0301(02)00108-9. https://www.researchgate.net/publication/222415852_An_overview_of_APSIM_a_model_designed_for_farming_systems_simulation.
Kimble, J.M., Rice C.W., Reed, D., Mooney, S, Follett, R.F., and Lal, R. (2007) Soil Carbon Management, Economic, Environmental and Social Benefits. CRC Press, Taylor & Francic Group.
MDA (2011) Conservation Practices, Minnesota Conser-vation Funding Guide, Minnesota Department of Agricul-ture. http://www.mda.state.mn.us/protecting/conserva-tion/practices/constillage.
Mercado L, Aguilar L (2015) Mesoamerican agro-en-vironmental programme monitoring and evaluation system. CATIE. MAP. https://www.catie.ac.cr/cst/attach-ments/article/3/cartilla-4pag.pdf.
Millennium Ecosystem Assessment (MEA) (2005) Eco-systems and human well-being: synthesis. Washington D.C., Island Press. 155 pp. http://www.millenniumassess-ment.org/en/Synthesis.aspx.
Minang, P.A., van Noordwijk, M., Freeman, O.E., Mbow, C., de Leeuw, J. & Catacutan, D., eds. (2015) Climate-smart landscapes: multifunctionality in practice. Nairobi, Kenya:
World Agroforestry Centre (ICRAF). 444 pp. https://www.worldagroforestry.org/output/climate-smart-land-scapes-multifunctionality-practice.
Mutua, J., Muriuki, J., Gachie, P., Bourne, M. and Capis, J. (2014) Conservation agriculture with trees: Principles and practice. A simplified guide for extension staff and farmers. Technical manual 21. World Agroforestry Cen-tre, (ICRAF) Nairobi, Kenya. http://apps.worldagroforest-ry.org/downloads/Publications/PDFS/TM17693.pdf.
Mwongera C. et al. (2019) Climate-Smart Agricultural Value Chains: Risks and Perspectives. In: Rosenstock T., Nowak A., Girvetz E. (eds) The Climate-Smart Agriculture Papers. Springer, Cham. https://doi.org/10.1007/978-3-319-92798-5_20.
Nationally Appropriate Mitigation Actions (NAMAs) (2020) https://energypedia.info/wiki/Nationally_Appro-priate_Mitigation_Actions_(NAMAs).
Nefzaoui, A. (1996) The intergration of fodder shrubs and cactus in the feeding of small ruminants in the arid zone of North Africa. In:A. W.Speedy, C.Dalibard, and R.Sansoucy (eds.) Livestock Feed Resources Within Integrated Farming Systems. FAO Electronic Conference in Tropical Feeds, pp. 467—483. Food and Agriculture Organization of the United Nation. Rome.
Neufeldt H, Kristjanson P, Thorlakson T, Gassner A, Norton-Griffiths M, Place F, Langford K (2011) ICRAF Policy Brief 12: Making climate-smart agriculture work for the poor. Nairobi, Kenya. World Agroforestry Centre (ICRAF). https://ccafs.cgiar.org/resources/publications/making-climate-smart-agriculture-work-poor.
NSBM (2006) Ruminants and Greenhouse Gasses: Sustainable Feeding Strategies to Balancing the Is-sues. Atapattu Dept. of Animal Science, Faculty of Agriculture, University of Ruhuna. Available at: http://forestrysymposium2005.blogspot.com/2006/09/rumi-nants-and-greenhouse-gasses.html.
Ocen, G. (1999) Feeding strategies for sustainable cattle production UNISWA Jnl of Agric. Vol 8: 31-38.
Palmer, J.J. (1998) Cut-and-carry forage systems based on nitrogen-fixing plants for Asia's tropical slope lands. http://www.agnet.org/library/eb/463.
Paustion, K., Cole C.V., Sauerbeck, D. and Sampson, N. (1995) CO2 mitigation by agriculture: An overview> climatic change. 40(1):135-162.
Quisumbing A, Meinzen-Dick R (2001) Empowering women to achieve food security: overview. In: Quisumb-ing A, Meinzen-Dick R (eds) Empowering women to

108
Compendium of Practices in Climate-Smart Agriculture and Solar Irrigation
achieve food security. Focus 6. Policy Brief 1 of 12. IFPRI, Washington D.C.
Rehman, A. (2007) Zero tillage technology for rice and wheat crops. Quoted from site www.archives.dawn.com.
Sachs, I. and Silk, D. (1991) Final Report of the Food En-ergy Nexus Programme of the United Nations University, 1983-1987. UNU-FEN.
SHARED Website: http://www.worldagroforestry.org/shared.
Suddick, E.C., Scow, K.M., Horwath, W.R., Jackson, L.E., Smart, D.R., Mitchell, J, and Six, J (2010) The Potential for California Agricultural Crop Soils to Reduce Green-house Gas Emissions: A Holistic Evaluation. Advances in Agronomy 107:123-162.
Sunderland, T. (2012) Landscape guidelines and prin-ciples. Presentation at conference. Bogor, Indonesia, CIFOR.
Terazono, E. (2020) Vertical farming: hope or hype? Financial Times. https://www.ft.com/content/0e3aafca-2170-4552-9ade-68177784446e.
Thorlakson ,T. (2011) Reducing subsistence farmers’ vul-nerability to climate change: the potential contributions of agroforestry in western Kenya. ICRAF Occasional Paper 16. World Agroforestry Centre, Nairobi.
Tran Duc Vien (2007) Indigenous Fallow Manage-ment with Melia azedarach Linn. in Northern Vietnam. ResearchGate.https://www.researchgate.net/publi-cation/237328774_Indigenous_Fallow_Management_with_Melia_azedarach_Linn_in_Northern_Vietnam.
Twomlow, S., Rohrbach, D., Dimes, J., Ruslke, J., Mupang-wa, W., Ncube, B., Hove, L., Moyo, M., Mashingaldze, N., Mahposa, P. (2010) Micro-dosing as a pathway to Africa’s Green Revolution: Evidence from broad-scale on-farm trials. Nutrient Cycling in Agroecosystems, 88: 3–15.
United Nations (UN) (2015) The World’s women 2015. United Nations, Department of Economic and Social Affairs, Statistics Division, New York. https://unstats.un.org/unsd/gender/downloads/worldswomen2015_re-port.pdf.
United Nations (UN) (2015) The World’s women 2015. United Nations, Department of Economic and Social Affairs, Statistics Division, New York. https://unstats.un.org/unsd/gender/downloads/worldswomen2015_re-port.pdf.
Valle, R. (2017) Benefits of intercropping that you never imagined! Blog. https://richmondvale.org/en/blog/4-ben-
efits-of-intercropping-that-you-never-imagined.
van der Hoek, W.; Sakthivadivel, R.; Renshaw, M.; Silver, J. B.; Birley, M. H.; Konradsen, F. (2001) IWMI Research Report 47: Alternate wet/dry irrigation in rice cultiva-tion: A practical way to save water and control malaria and Japanese encephalitis? https://www.iwmi.cgiar.org/publications/iwmi-research-reports/iwmi-research-re-port-47/.
CSA ToolsThe Agro-Chain Greenhouse Gas Emissions (ACGE). https://ccafs.cgiar.org/resources/tools/acge-calcu-lator#:~:text=The%20Agro%2DChain%20Green-house%20Gas,associated%20to%20a%20food%20product.&text=It%20combines%20a%20calculation%20framework,loss%20factors%20along%20the%20chain.
Global yield gap atlas. http://www.yieldgap.org/.
Samples: Standard assessment of agricultural mitigation potential and livelihoods. https://ccafs.cgiar.org/re-sources/tools/samples-standard-assessment-agricultur-al-mitigation-potential-and-livelihoods#:~:text=The%20Standard%20Assessment%20of%20Agricultural,op-tions%20compatible%20with%20food%20security.
GHG Mitigation in rice information kiosk.https://ccafs.cgiar.org/resources/tools/ghg-mitigation-rice-informa-tion-kiosk#:~:text=The%20GHG%20mitigation%20in%20rice,options%20in%20rice%20production%20systems.&text=Irrigated%20rice%20is%20the%20most,food%20security%2C%20particularly%20in%20Asia.
MRV platform for agriculture MRV platform for agricul-ture. https://www.agmrv.org/.
CSA guide. https://csa.guide/.
Small-holder agriculture monitoring and baseline as-sessment tool. https://ccafs.cgiar.org/resources/tools/small-holder-agriculture-monitoring-and-baseline-as-sessment-tool.
CCAFS-MOT: a mitigation options tool for agriculture. https://ccafs.cgiar.org/resources/tools/ccafs-mot-mit-igation-options-tool-agriculture#:~:text=The%20CCAFS%20Mitigation%20Options%20Tool,deci-sions%20about%20emissions%20reductions%20from
Climate-smart agriculture rapid appraisal (CSA-RA) pri-oritization tool. https://ccafs.cgiar.org/resources/tools/climate-smart-agriculture-rapid-appraisal-csa-ra-priori-tization-tool.
Climate-smart agriculture prioritization framework. https://ccafs.cgiar.org/resources/tools/climate-smart-ag-

109
Compendium of Practices in Climate-Smart Agriculture and Solar Irrigation
riculture-prioritization-framework.
The ex-ante carbon-balance tool. http://www.fao.org/tc/exact/ex-act-home/en/.
VideosClimate-smart agriculture: What is it all about? https://youtu.be/OjhRfvdc7bA.
How to feed the world in 2050: actions in a changing climate https://youtu.be/gjtIl5B1zXI.
Leslie Lipper, senior environmental economnist at the Food and Agriculture Organisation of the United Na-tions, explains climate-smart agriculture. https://youtu.be/F9_nH7_O8Ys.
Bruce Campbell, Program Director of the CGIAR Research Program on Climate Change, Agriculture and Food Security, talks about climate change and the future of food security. https://youtu.be/tBXiPAPNyMQ.
Climate-Smart Agriculture: Helping the World Produce More Food. https://youtu.be/i0V2xzEw44Y.
CSA: triple win. http://www.youtube.com/watch?v=rs-pA1Ee02U.
Landscape approach. http://www.youtube.com/watch?v=xPjSAw1F8eE.
Agroforestry. http://www.youtube.com/watch?v=3SWPxS-yKUo.
Regreening Africa's landscape - Trees as natural fertiliz-er. https://www.youtube.com/watch?v=hJuMX8LOpO0.
Food energy system in South Africa. http://www.youtube.com/watch?v=MGNxRZD4Uxs.
Cheap drip irrigation. http://www.youtube.com/watch?v=MNoL13ptJ6Y.
Feeding the World through Plant Breeding and Genetics. http://www.youtube.com/watch?v=p9p7vx5O3Xc.
FAO Policy Series: Climate Smart Agriculture. https://www.youtube.com/watch?v=KYeFNnPJVEg&fea-ture=youtu.be.
Climate-Smart Agriculture in Action. https://www.you-tube.com/watch?v=q7JnJ0oBa94.
Understanding Climate-Smart Agriculture. https://www.youtube.com/watch?v=lUdNMsVDIZ0.
Climate-Smart Agriculture for policy maker. https://www.youtube.com/watch?v=BMVyQfqof4I.
Unleashing the potential of Africa's youth through innovation in agriculture. https://www.youtube.com/
watch?v=aUR_aE3RU6M.
Future of Food: Farming in the age of climate change. https://www.youtube.com/watch?v=Tjr6z1GMDqc.
Infosys: Smart Agriculture Solution. https://www.you-tube.com/watch?v=0WR4BeFcLks.
What is IoT and what does it mean for farmers? https://www.youtube.com/watch?v=pOLAIVUs9S8.
Climate-Smart Agriculture: Helping the World Produce More Food. https://www.youtube.com/watch?v=i0V2x-zEw44Y.
The CGIAR Development Dialogues: Climate-smart agri-culture. https://www.youtube.com/watch?v=x7sL9qo4e-BU.

110
Compendium of Practices in Climate-Smart Agriculture and Solar Irrigation
Module References
Module 11. Cicekli, M., & Barlas, N. (2014). Transformation of
today greenhouses into high technology vertical farming systems for metropolitan regions. Journal of Environmental Protection and Ecology, 15(4), 1779–1785. https://docs.google.com/a/jepe-journal.info/viewer?a=v&pid=sites&srcid=amVwZS1qb-3VybmFsLmluZm98amVwZS1qb3VybmFsfGd4O-jQ1MzQ3ZTRhYzI2YTRlNjk.
2. FAO (2019). Climate-smart agriculture and the Sus-tainable Development Goals: Mapping interlinkages, synergies and trade-offs and guidelines for integrat-ed implementation. Rome. file:///C:/Users/User/Downloads/CA6043EN.pdf.
3. CSA, FAO (2010). “Climate-Smart” Agriculture, Policies, Practices and Financing for Food Security, Adaptation and Mitigation. http://www.fao.org/3/i1881e/i1881e00.htm.
4. CTCN (2014). ICRAF webinar on climate-smart agriculture. Grey literature.
5. FAO (2013). Climate-smart agriculture sourcebook. http://www.fao.org/docrep/018/i3325e/i3325e.pdf.
6. FAO (2019). Climate-smart agriculture and the Sus-tainable Development Goals: Mapping interlinkages, synergies and trade-offs and guidelines for integrat-ed implementation. Rome. file:///C:/Users/User/Downloads/CA6043EN.pdf.
7. IPCC (2014). Climate change 2014: Syn-thesis report. https://books.google.co.uz/books?hl=en&lr=&id=aJ-TBQAAQBAJ&oi=fnd&p-g=PA1142&dq=Climate+Change+2014:+Synthe-sis+Report&ots=v2LzPJb6EI&sig=luxqf5aqanY_CA6TWUraUMmpBzo&redir_esc=y#v=onep-age&q=Climate%20Change%202014%3A%20Synthesis%20Report&f=false.
8. Neufeldt H., Kristjanson P., Thorlakson T., Gassner A., Norton-Griffiths M., Place F., & Langford K. (2011). ICRAF Policy Brief 12: Making climate-smart agriculture work for the poor. Nairobi, Kenya. World Agroforestry (ICRAF). https://ccafs.cgiar.org/re-sources/publications/making-climate-smart-agricul-ture-work-poor.
9. FAO (2013). Climate-Smart Agriculture Sourcebook (pp. 558). Rome. http://www.fao.org/docrep/018/i3325e/i3325e.pdf.
10. Millennium Ecosystem Assessment (MEA) (2005). Ecosystems and Human Well-being: Synthesis (pp. 155). Washington D.C., Island Press. http://www.millenniumassessment.org/en/Synthesis.aspx.
11. Minang, P.A., van Noordwijk, M., Freeman, O.E., Mbow, C., de Leeuw, J., & Catacutan, D., eds. (2015) Climate-Smart Landscapes: Multifunctional-ity in Practice (pp. 444). Nairobi, Kenya: World Agro-forestry (ICRAF). https://www.worldagroforestry.org/output/climate-smart-landscapes-multifunction-ality-practice.
12. Sunderland, T. (2012). Landscape Guidelines and Principles. Presentation at conference. Bogor, Indo-nesia, CIFOR.
13. Cole, S. (2018). Importance of agroforestry systems in carbon sequestration. Penn State University. https://www.cabi.org/forestscience/news/65086.
14. Current D., Sara E., & Scherr J. (1995). The Costs and Benefits of Agroforestry to Farmers. The World Bank Research Observer, 10(2), 151–80. https://www.researchgate.net/publication/5217843_The_Costs_and_Benefits_of_Agroforestry_to_Farmers.
15. FAO (2017). Agroforestry. http://www.fao.org/for-estry/agroforestry/80338/en/.
16. Hoff, M. (2017). Eight ways to Sequester Carbon to Avoid Climate Catastrophe. https://www.ecowatch.com/carbon-sequestration-2461971411.html.
17. Kiptot, E., & Franzel S. (2011). Gender and agrofor-estry in Africa: Are Women Participating? ICRAF Occasional Paper No. 13. Nairobi: ICRAF – World Agroforestry. http://www.worldagroforestry.org/downloads/Publications/PDFS/OP16988.pdf.
18. Murthy, I., Gupta, M., Tomar, S., Munsi, M., Tiwari, R., Hegde, G., & Ravindranath, N. (2013). Carbon Sequestration Potential of Agroforestry Systems in India. https://www.omicsonline.org/carbon-seques-tration-potential-of-agroforestry-systems-in-in-
Module 2

111
Compendium of Practices in Climate-Smart Agriculture and Solar Irrigation
dia-2157-7617.1000131.php?aid=11511.
19. Mutua, J., Muriuki, J., Gachie, P., Bourne, M., & Capis, J. (2014). Conservation Agriculture with Trees: Prin-ciples and Practice: A Simplified Guide for Extension Staff and Farmers. Technical Manual No. 21. World Agroforestry (ICRAF) Nairobi, Kenya. .http://www.worldagroforestry.org/downloads/Publications/PDFS/TM17693.pdf.
20. Nair, P.K.R., Nair, V., Kumar, M., & Showalter, J. (2010). Carbon Sequestration in Agroforestry Systems. Advances in Agronomy, 108(5), 237–307. https://www.sciencedirect.com/science/article/pii/S0065211310080053.
21. van der Hoek, W., Sakthivadivel, R., Renshaw, M., Silver, J. B., Birley, M. H., and Konradsen, F. (2001). IWMI Research Report 47: Alternate Wet/Dry Irrigation in Rice Cultivation: A Practical Way to Save Water and Control Malaria and Japanese En-cephalitis. https://www.iwmi.cgiar.org/publications/iwmi-research-reports/iwmi-research-report-47/.
22. Ayana, M., Eshetu, F., & Tadele, K. (2005). Simple and low-cost drip irrigation system: an alternative ap-proach to raise household farm productivity. IWMI workshop paper. http://publications.iwmi.org/pdf/H039819.pdf.
23. CTCN (2014) ICRAF webinar on climate-smart agriculture. Grey literature.
24. CTCN (2014). ICRAF webinar on climate-smart agriculture. Grey literature.
25. FAO (2013). Climate-smart agriculture sourcebook. http://www.fao.org/docrep/018/i3325e/i3325e.pdf.
26. CTCN (2014). ICRAF webinar on climate-smart agriculture. Grey literature.
27. Valle, R. (2017). 4 Benefits of intercropping that you never imagined! Blog. https://richmondvale.org/en/blog/4-benefits-of-intercropping-that-you-nev-er-imagined.
28. CTCN (2014). ICRAF webinar on climate-smart agriculture. Grey literature.
29. Mutua, J., Muriuki, J., Gachie, P., Bourne, M., & Capis, J. (2014). Conservation agriculture with trees: Principles and practice. A simplified guide for exten-sion staff and farmers. Technical manual 21. World Agroforestry (ICRAF) Nairobi, Kenya. http://apps.worldagroforestry.org/downloads/Publications/PDFS/TM17693.pdf.
30. CTCN (2014). ICRAF webinar on climate-smart agriculture. Grey literature.
31. Tran Duc Vien (2007). Indigenous Fallow Man-agement with Melia azedarach Linn. in Northern Vietnam. ResearchGate. https://www.researchgate.net/publication/237328774_Indigenous_Fallow_Management_with_Melia_azedarach_Linn_in_North-ern_Vietnam.
32. CIMMYT (2010). Jat M.L., Singh R.G., Sidhu H.S., Singh U.P., Malik R.K., Kamboj B.R., Jat R.K., Singh V., Hussain I., Mazid M.A., Sherchan D.P., Khan A., Singh V.P., Patil S.G., & Gupta R. Resource Conserv-ing Technologies in South Asia: Frequently Asked Questions (pp. 1–32).
33. CTCN (2020). Conservation tillage. https://www.ctc-n.org/technologies/conservation-tillage.
34. CTCN (2014). ICRAF webinar on climate-smart agriculture. Grey literature.
35. Dinnes, D.L. (2004). Assessment of Practices to Reduce Nitrogen and Potassium Non-point Source Pollution of Iowa’s Surface Waters, Iowa Dept. of National resources, Des Moines, LA.
36. Kimble, J.M., Rice C.W., Reed, D., Mooney, S, Follett, R.F., & Lal, R. (2007). Soil Carbon Management, Economic, Environmental and Social Benefits. CRC Press, Taylor & Francis Group.
37. MDA (2011). Conservation Practices, Minnesota Conservation Funding Guide, Minnesota Depart-ment of Agriculture. http://www.mda.state.mn.us/protecting/conservation/practices/constillage.
38. Paustion, K., Cole C.V., Sauerbeck, D., & Sampson, N. (1995). CO2 Mitigation by Agriculture: An overview. Climatic Change, 40(1), 135–162.
39. Rehman, A. (2007). Zero tillage technology for rice and wheat crops. www.archives.dawn.com.
40. Suddick, E.C., Scow, K.M., Horwath, W.R., Jackson, L.E., Smart, D.R., Mitchell, J, & Six, J. (2010). The Potential for California Agricultural Crop Soils to Reduce Greenhouse Gas Emissions: A Holistic Eval-uation. Advances in Agronomy 107, 123–162.
41. CTCN (2014). ICRAF webinar on climate-smart agriculture. Grey literature.
42. FAO (2011). Sustainable land management in prac-tice: cross-slope barriers (pp. 114–119). http://www.fao.org/docrep/014/i1861e/i1861e07.pdf.

112
Compendium of Practices in Climate-Smart Agriculture and Solar Irrigation
43. Banerjee, C. (2014). Up, Up and Away! The Econom-ics of Vertical Farming. Journal of Agricultural Stud-ies, 2(1), ISSN 2166-0379. http://www.macrothink.org/journal/index.php/jas.
44. Bogdanski, A., Dubois, O., Jamieson, C., & Krell, R. (2011). Making Integrated Food-Energy Systems Work for People and Climate: An Overview. FAO. http://www.fao.org/3/i2044e/i2044e.pdf.
45. CTCN (2014). ICRAF webinar on climate-smart agriculture. Grey literature.
46. FAO (2009). Harvesting Agriculture’s Multiple Bene-fits: Mitigation, Adaptation, Development and Food Security. FAO Policy Brief.
47. Sachs, I., & Silk, D. (1991). Final Report of the Food Energy Nexus Programme of the United Nations University, 1983–1987. UNU-FEN.
48. CTCN (2014). ICRAF webinar on climate-smart agriculture. Grey literature.
49. CTCN (2014). ICRAF webinar on climate-smart agriculture. Grey literature.
50. Twomlow, S., Rohrbach, D., Dimes, J., Ruslke, J., Mupangwa, W., Ncube, B., Hove, L., Moyo, M., Mashingaldze, N., & Mahposa, P. (2010). Micro-dos-ing as a pathway to Africa’s Green Revolution: Evidence from broad-scale on-farm trials. Nutrient Cycling in Agroecosystems, 88: 3–15.
51. CTCN (2014). ICRAF webinar on climate-smart agriculture. Grey literature.
52. Nefzaoui, A. (1996). The integration of fodder shrubs and cactus in the feeding of small ruminants in the arid zone of North Africa. In: A. W. Speedy, C. Dalibard, and R. Sansoucy (eds.) Livestock Feed Resources Within Integrated Farming Systems. FAO Electronic Conference in Tropical Feeds (pp. 467–483). Food and Agriculture Organization of the United Nations. Rome.
53. NSBM (2006). Ruminants and Greenhouse Gasses: Sustainable Feeding Strategies to Balancing the Issues. Atapattu Dept. of Animal Science, Faculty of Agriculture, University of Ruhuna. http://forest-rysymposium2005.blogspot.com/2006/09/rumi-nants-and-greenhouse-gasses.html.
54. Ocen, G. (1999). Feeding strategies for sustainable cattle production UNISWA Jnl of Agric., 8: 31-38.
55. Palmer, J.J. (1998). Cut-and-carry forage systems
based on nitrogen-fixing plants for Asia’s tropical slope lands. http://www.agnet.org/library/eb/463.
56. Bouman, B., Peng, S., Castan A., & Visperas, R. (2005). Yield and water use of irrigated tropical aer-obic rice systems. Agricultural Water Management, 74(2): 87–105. http://www.sciencedirect.com/sci-ence/article/pii/S0378377404003257.
57. CTCN (2014). ICRAF webinar on climate-smart agriculture. Grey literature.
58. Hall, A. (2004). Breeding for adaptation to drought and heat in cowpea. European Journal of Agronomy, 21(4), 447–454.
59. Kamara, A., Kureh, I., Menkir A., Kartung, P., Tarfa, B., & Amaza, P. (2006). Participatory on-farm evaluation of the performance of drought-tolerant maize variet-ies in the Guinea savannas of Nigeria. International Journal of Food, Agriculture and Environment, 4(1), 192–196. http://cat.inist.fr/?aModele=afficheN&cp-sidt=17447320.
Module 360. Bureau, R.M. (2018). Pros and cons of solar powered
irrigation systems. https://ruralmarketing.in/news/international/pros-cons-of-solar-powered-irriga-tion-systems.
61. FAO (2018). The benefits and risks of solar-powered irrigation: a global overview. http://www.fao.org/3/i9047en/I9047EN.pdf.
62. FAO (2013). Climate-smart agriculture sourcebook. http://www.fao.org/3/i3325e/i3325e.pdf.
63. APSIM (2020).What is APSIM? https://www.apsim.info/apsim-model/.
64. ECOCROP (2020). Crop Ecological Requirements Database. http://www.fao.org/land-water/land/land-governance/land-resources-planning-toolbox/category/details/en/c/1027491/.
65. Keating, B.A., Carberry, P.S., Hammer, G. L., Prob-ert, M.E., Robertson, M.J., Holzworth, Dean, Huth, N.I., Hargreaves, John, Meinke, Holger, Hochman, Z., McLean, Greg, Verburg, K, Snow, Val, Dimes,
Module 4

113
Compendium of Practices in Climate-Smart Agriculture and Solar Irrigation
John, Silburn, David, Wang, E., Brown, S., Bristow, Keith, Asseng, Senthold, Chapman, S., McCrown, R.L., Freebairn, David, & Smith, Chris. (2003). An overview of APSIM, a model designed for farm-ing systems simulation. European Journal of Agronomy 18(3–4), 267–288. 10.1016/S1161-0301(02)00108-9. https://www.researchgate.net/publication/222415852_An_overview_of_APSIM_a_model_designed_for_farming_systems_simulation.
66. CTCN (2014). ICRAF webinar on climate-smart agriculture. Grey literature.
67. Hao, Z., AghaKouchak, A., Nakhjiri, N., & Farahmand, A. (2014). Global integrated drought monitoring and prediction system. University of California. Scientific Data 1: 140001. http://www.nature.com/articles/sdata20141.
68. AfSIS (2020). About Us. http://africasoils.net/about/.
69. CTCN (2014). ICRAF webinar on climate-smart agriculture. Grey literature.
70. CTCN (2014). ICRAF webinar on climate-smart agriculture. Grey literature.
71. FAO (2020). Land and Water. http://www.fao.org/land-water/databases-and-software/en/.
72. CTCN (2014). ICRAF webinar on climate-smart agriculture. Grey literature.
73. AMIS (2020). About AMIS. http://www.amis-out-look.org/amis-about/en/.
Module 574. SAMPLES. About SAMPLES. https://ccafs.cgiar.org/
resources/tools/samples-standard-assessment-ag-ricultural-mitigation-potential-and-livelihoods#:~:-text=The%20Standard%20Assessment%20of%20Agricultural,options%20compatible%20with%20food%20security.
75. CGIAR, CCAFS. GHG Mitigation in Rice Infor-mation Kiosk. https://ccafs.cgiar.org/resources/tools/ghg-mitigation-rice-information-kiosk#:~:-text=The%20GHG%20mitigation%20in%20rice,options%20in%20rice%20production%20systems.&text=Irrigated%20rice%20is%20the%20most,food%20security%2C%20particularly%20in%20Asia.
76. CGIAR, CCAFS. MRV Platform for Agriculture. https://www.agmrv.org/.
77. CGIAR, CCAFS. Climate-Smart Agriculture 101. https://csa.guide/.
78. CGIAR, CCAFS. Small-holder Agriculture Monitor-ing and Baseline Assessment Tool. https://ccafs.cgiar.org/resources/tools/small-holder-agriculture-moni-toring-and-baseline-assessment-tool.
79. CCAFS-MOT: a mitigation options tool for ag-riculture. https://ccafs.cgiar.org/resources/tools/ccafs-mot-mitigation-options-tool-agricul-ture#:~:text=The%20CCAFS%20Mitigation%20Options%20Tool,decisions%20about%20emis-sions%20reductions%20from.
80. Climate-smart agriculture rapid appraisal (CSA-RA) prioritization tool. https://ccafs.cgiar.org/resources/stools/climate-smart-agriculture-rapid-apprais-al-csa-ra-prioritization-tool.
81. CGIAR, CCAFS. Climate-smart Agriculture Pri-oritization Framework. https://ccafs.cgiar.org/resources/tools/climate-smart-agriculture-prioriti-zation-framework.
82. FAO (2010). “Climate-Smart” Agriculture: Policies, Practices and Financing for Food Security, Adap-tation and Mitigation. Rome: Food and Agriculture Organization (FAO). http://www.fao.org/3/i1881e/i1881e00.htm.
83. CGIAR, CCAFS (2020). Low Emissions Develop-ment. https://ccafs.cgiar.org/research/low-emis-sions-development/tools.
84. CTCN (2014) ICRAF webinar on climate-smart agriculture. Grey literature.
85. FAO. The ex-ante carbon-balance tool. http://www.fao.org/tc/exact/ex-act-home/en/.
Module 686. Food Agriculture Natural Resources Policy Analysis
Network (FANRPAN) (2012). Engaging Youth in Cli-mate-Smart Agriculture. Policy brief series. Issue No. 1: Volume XII. JSTOR collection. https://www.jstor.org/stable/resrep00704?seq=4#metadata_info_tab_contents.

114
Compendium of Practices in Climate-Smart Agriculture and Solar Irrigation
87. FAO (2010). “Climate-Smart” Agriculture: Policies, Practices and Financing for Food Security, Adapta-tion and Mitigation. Rome. http://www.fao.org/3/i1881e/i1881e00.htm.
88. FAO (2011). The State of Food and Agriculture: Women in Agriculture Closing the Gender Gap for Development. Rome. http://www.fao.org/3/i2050e/i2050e.pdf.
89. Gutierrez-Montes, I., Arguedas, M., Ramirez-Aguero, F., Mercado, L., & Sellare, J. (2020). Contributing to the construction of a framework for improved gender integration into climate-smart agriculture projects monitoring and evaluation: MAP-Norway experience. Climatic Change 158, 93–106. https://link.springer.com/article/10.1007/s10584-018-2231-1.
90. Gutiérrez-Montes I, Emery M, Fernandez-Ba-ca E (2012). Why Gender Matters to Ecological Management and Poverty Reduction. Inte-grating Ecology and Poverty Reduction (pp. 39–59). Springer. https://link.springer.com/chap-ter/10.1007/978-1-4614-0186-5_4.
91. Gutiérrez-Montes I, Ramirez F (2016). The Meso-american Agro-environmental Program: Critical Lessons Learned from an Integrated Approach to Achieve Sustainable Land Management. In: Méndez E, Bacon C, Cohen R, Gliessman, S. Agroecology: A Transdisciplinary, Participatory, and Action-ori-ented Approach. https://www.researchgate.net/publication/300225675_The_Mesoamerican_Agroenvironmental_Program_Critical_Lessons_Learned_from_an_Integrated_Approach_to_Achieve_Sustainable_Land_Management.
92. Kabeer N (2005). Gender equality and women’s empowerment: a critical analysis of the third Millen-nium Development Goal. Gender and Devopment, 13(1), 13–24. https://www.amherst.edu/media/view/232742/original/Kabeer%2B2005.pdf.
93. Mercado L, & Aguilar L (2015). Mesoamerican Agroenvironmental Program (MAP): Monitoring and Evaluation System. CATIE. MAP. https://www.catie.ac.cr/cst/attachments/article/3/cartilla-4pag.pdf.
94. Quisumbing A, & Meinzen-Dick R (2001). Empow-ering women to achieve food security: overview. In: Quisumbing A, & Meinzen-Dick R (eds) Empowering women to achieve food security. Focus 6. Policy Brief 1 of 12. IFPRI, Washington D.C.
95. United Nations (UN) (2015). The World’s Women 2015. United Nations, Department of Economic and Social Affairs, Statistics Division, New York. https://unstats.un.org/unsd/gender/downloads/worlds-women2015_report.pdf.
Module 796. CTCN (2014). ICRAF webinar on climate-smart
agriculture. Grey literature.
97. Dekens, J. , & Bagamba, F. (2014). Promoting an Integrated Approach to Climate Adaptation: Lessons from the coffee value chain in Uganda. Climate Re-silient Value Chains and Food Systems. Briefing note series. https://www.iisd.org/system/files/publica-tions/value_chains_coffee_uganda_briefing_note.pdf.
98. Mwongera C. et al. (2019). Climate-Smart Agri-cultural Value Chains: Risks and Perspectives. In: Rosenstock T., Nowak A., & Girvetz E. (eds). The Climate-Smart Agriculture Papers. Springer, Cham. https://doi.org/10.1007/978-3-319-92798-5_20.
99. CTCN (2014). ICRAF webinar on climate-smart agriculture. Grey literature.
100. Foster K., Neufeldt H., Franks P., Diro R., Mun-den L., Anand M., & Wollenberg E. (2013). Climate Finance for Agriculture and Livelihoods. ICRAF Policy Brief 15. Nairobi, Kenya. World Agroforestry (ICRAF).
Module 8
101. CTCN (2014). ICRAF webinar on climate-smart agriculture. Grey literature.
102. de Graaff, J., Aklilu, A., Ouessar, M., Asins-Velis, S., & Kessler, A. (2013). The development of soil and water conservation policies and practices in five se-lected countries from 1960 to 2010. Land Use Policy Volume 32, Pages 165–174. http://www.sciencedi-rect.com/science/article/pii/S0264837712002062.
Module 9

115
Compendium of Practices in Climate-Smart Agriculture and Solar Irrigation
103. FAO (2019). Climate-Smart Agriculture and the Sustainable Development Goals: Mapping interlink-ages, synergies and trade-offs and guidelines for integrated implementation. Rome. file:///C:/Users/User/Downloads/CA6043EN.pdf.
104. FAO (2013). Climate-Smart Agriculture Source-book. http://www.fao.org/docrep/018/i3325e/i3325e.pdf.
105. Energypedia. Nationally Appropriate Mitigation Actions (NAMAs) (2020). https://energypedia.info/wiki/Nationally_Appropriate_Mitigation_Actions_(NAMAs).
106. Neufeldt, H., Kristjanson, P., Thorlakson, T., Gassner, A., Norton-Griffiths, M., Place, F., & Lang-ford, K. (2011). Making climate-smart agriculture work for the poor. ICRAF Policy Brief No 12. World Agroforestry (ICRAF), Nairobi, Kenya. http://apps.worldagroforestry.org/downloads/Publications/PDFS/BR11267.pdf.
107. World Agroforestry. SHARED: the decision hub. http://www.worldagroforestry.org/shared.
108. Thorlakson, T. (2011). Reducing subsistence farmers’ vulnerability to climate change: the poten-tial contributions of agroforestry in western Kenya. ICRAF Occasional Paper 16. World Agroforestry, Nairobi.
109. World Agroforesty. “Decision Dash-boards.” http://www.worldagroforestry.org/output/decision-dashboards (https://www.worldagroforest-ry.org/sites/agroforestry/files/out-put/attachments/Decision%20dashboards%20information%20sheet.pdf).
110. World Agroforestry. “Evidence Based Plan-ning and Decision Making for Devolved Counties: Experiences from Turkana County.” http://www.worldagroforestry.org/output/evidence-based-plan-ning-and-decision-making-devolved-counties-expe-riences-turkana-county.
Module 10111. CCAFS (2012). Consolidated logframe of activi-
ties 2012–2015.
112. CGIAR Research Program on Climate Change, Agriculture and Food Security (CCAFS).
113. Copenhagen, Denmark: CGIAR Research Program on Climate Change, Agriculture and Food Security (CCAFS).

116
Compendium of Practices in Climate-Smart Agriculture and Solar Irrigation
Follow our activities

117
Compendium of Practices in Climate-Smart Agriculture and Solar Irrigation
The Global Green Growth Institute does not make any warranty, either express or implied, or assumes any legal liability or responsibility for the accuracy,
completeness, or any third party’s use or the results of such use of any information, apparatus, product,
or process disclosed of the information contained herein nor represents that its use would not infringe
privately owned rights.www.gggi.org
Follow our activities on Facebook and Twitter
www.GGGI.org
Follow our activities on Facebook and Twitter.
The Global Green Growth Institute
19F Jeongdong Building, 21-15, Jeongdong-gil, Jung-gu, Seoul, Korea 04518