climate change vulnerability assessment and adaptation plan
TRANSCRIPT

Climate Change Vulnerability Assessment and Adaptation Plan
Sustainable Communities Workshop
December 1, 2016

Purpose of the City’s Climate Adaptation Plan
• Improve the City’s understanding of climate-related risks to public infrastructure
• Identify adaptation strategies to address critical infrastructure & natural system vulnerabilities
• Inform the public about our risks and opportunities to adapt
• Elevate climate literacy among City staff
• Enhance the City’s capacity to incorporate climate data in decision making 2

Planning Steps
3
Research and clarify local
climate impacts
Identify at-risk municipal systems
Conduct vulnerability assessment
Prioritize vulnerabilities
Develop adaptation strategies
Create adaptation plan
Milestone 1
Targeted Climate Variables: • Sea Level Rise • Storm Surge • Extreme Precipitation • Extreme Heat Days

Literature Review
4

Global Sea Level Rise
5
Local / Regional Sea Level Rise
Sea Level Rise – Observed Data
Source: Commonwealth Scientific Industrial Research Organization

Extreme Precipitation – Observed Data
6 Source: NOAA National Center for Environmental Information
Percentage of Extreme 1-day Rainfall Events Annually in the SE U.S.
Trendline in Yellow
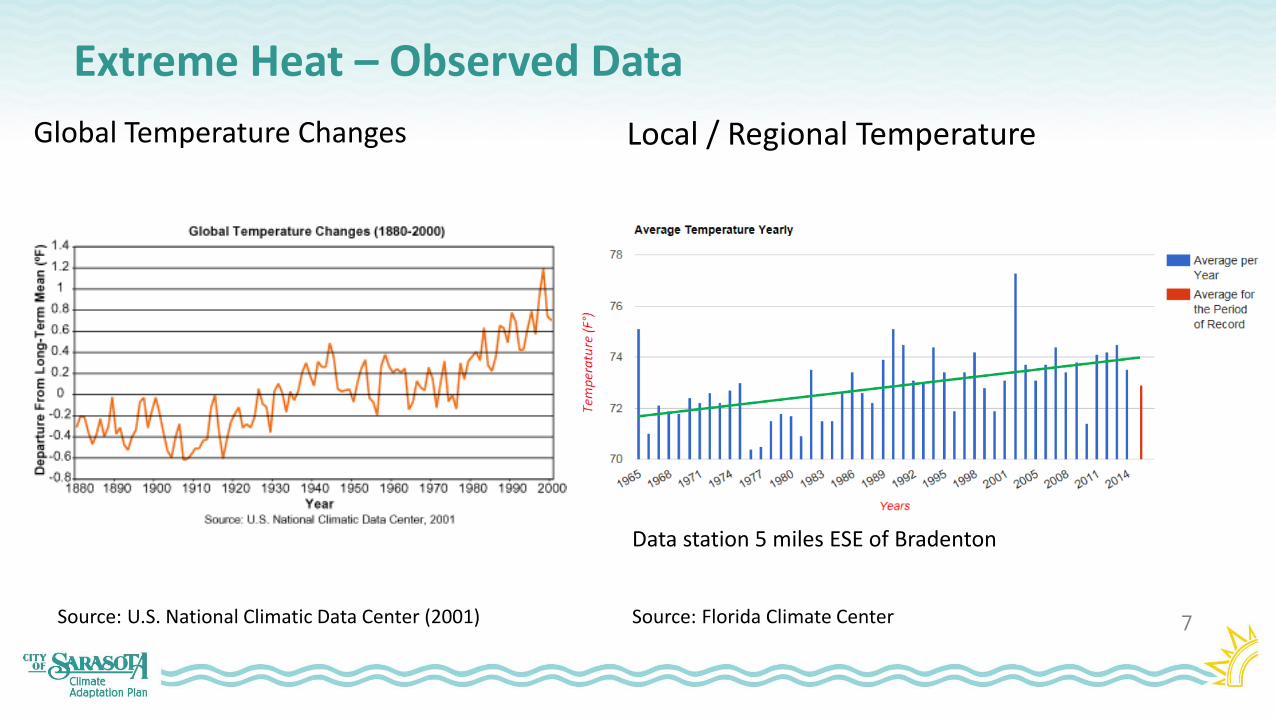
Extreme Heat – Observed Data
7
Global Temperature Changes Local / Regional Temperature
Source: Florida Climate Center
Data station 5 miles ESE of Bradenton
Source: U.S. National Climatic Data Center (2001)

Climate Projection – Sea Level Rise
8
YEAR NOAA LOW
NOAA INT LOW
NOAA INT HIGH
NOAA HIGH
2020 .48 .84 1.44 2.04
2030 1.56 2.52 4.68 7.2
2050 3.6 6.6 13.32 21
2100 8.76 20.64 46.92 77.04
Climate Projection Tool: NOAA Digital Coast Sea Level Rise Mapper
Projected sea level rise (inches) based on St. Petersburg tidal gauge

Climate Projection - Temperature
• 50 to 60 additional days over 95o F / year
• Increase air temperature of 3.6oF – 5.4oF by 2050
• Water temperature increase of 1.3o – 5oF
9
Climate Projection Tool: NOAA National Climatic Data Center/Cooperative Institute for Climate and Satellites

10
Climate Projection – Storm Surge
Climate Projection Tool(s): NOAA’s Coastal Flood Exposure Mapper, NOAA Sea, Lake, and Overland Surges from Hurricanes (SLOSH) model
Storm surge associated with extreme storms and seasonally-high “King Tides” poses an immediate and credible threat to our community as tides surge increasingly higher and extend further inland.
Left and center photo by Larry Stults Hurricane Hermine – low tide Sarasota

Climate Projection – Precipitation and Extreme Storms
• 5-10% increase in extreme precipitation events by 2050
• Same potential for drought conditions by 2050
• Future hurricane conditions not known
• Greater potential for higher storm surge
• Greater potential for coastal, bay and creek flooding
11
Climate Projection Tool(s): NOAA Atlas 14 Point Precipitation Frequency Estimator, NOAA’s Coastal Flood Exposure, NOAA Sea, Lake, and Overland Surges from Hurricanes (SLOSH) model, Sarasota County Stormwater Model

Nest Step - Vulnerability Assessment of City Infrastructure
• Water Supply Facilities o Lift stations
• Wastewater o Treatment plant, pipes, pump stations
• Stormwater Management Facilities o Major outfalls, evacuation routes
• Transportation Infrastructure & Facilities o Evacuation routes, bridges, busiest roads
• Natural Systems and Coastal Resiliency o Beaches, mangrove, parks
12

Next Steps – Vulnerability Assessment
13
• CCNA • Public Input Meeting • Commission Meeting
• City Commission Meeting • Public Input
Interim Vulnerabilities Report Draft Adaptation Plan
• City staff meeting/interviews • Review asset databases • Review maintenance logs

Summary of Global and Regional Climate Scenarios
14

15
Want to stay updated? email: [email protected] Call: 941-365-2200 ext 4202 Visit: http://www.sarasotagov.org/sgc/index.cfm