circuitos biodegradaveis
TRANSCRIPT

7/27/2019 circuitos biodegradaveis
http://slidepdf.com/reader/full/circuitos-biodegradaveis 1/46
www.sciencemag.org/cgi/content/full/337/6102/1640/DC1
Supplementary Materials for
A Physically Transient Form of Silicon Electronics
Suk-Won Hwang, Hu Tao, Dae-Hyeong Kim, Huanyu Cheng, Jun-Kyul Song, Elliott Rill,
Mark A. Brenckle, Bruce Panilaitis, Sang Min Won, Yun-Soung Kim, Young Min Song,
Ki Jun Yu, Abid Ameen, Rui Li, Yewang Su, Miaomiao Yang, David L. Kaplan, Mitchell
R. Zakin, Marvin J. Slepian, Yonggang Huang, Fiorenzo G. Omenetto,* John A. Rogers*
*To whom correspondence should be addressed. E-mail: [email protected] (J.A.R.);
[email protected] (F.G.O.)
Published 28 September 2012, Science 337, 1640 (2012)
DOI: 10.1126/science.1226325
This PDF file includes:
Materials and Methods
Figs. S1 to S22
References (19–32)

7/27/2019 circuitos biodegradaveis
http://slidepdf.com/reader/full/circuitos-biodegradaveis 2/46
2
Materials and Methods
1. Fabrication of devices
Doped single crystalline silicon nanomembranes (thickness ~300 nm, p-type)
were fabricated from silicon-on-insulator (SOI, SOITEC, France) wafers to serve as
active materials for the semiconductor devices. High temperature diffusion of
phosphorous (~950 C) and boron (~1,000 C) defined highly doped regions for source
and drain electrodes in transistors and for n and p type areas of diodes, photodetectors
and solar cells. The lateral dimensions of the doped Si NMs were defined by reactive ion
etching (RIE) with sulfur hexafluoride (SF6) gas. To release the silicon from the SOI, the
buried oxide was removed by wet etching with hydrofluoric acid (HF, 49% Electronic
grade, ScienceLab, USA). Individual Si NMs formed by this process were transfer
printed to a spin cast film of silk on a silicon wafer (as a temporary ‘carrier’ substrate).
Gate and interlayer dielectrics (MgO, or SiO2), as well as electrodes and interconnects
(Mg) were deposited by electron-beam evaporation through high resolution stencil
masks. For the latter, MgO layers served as adhesion promoters, except for the Mg/Si
contacts needed for the transistors, where Mg was either deposited directly or, for
improved yields and adhesion strength, with an 5 nm layer of Ti.
2. Preparation of substrates, encapsulation layers and packages
B. mori silkworm cocoons were cut and boiled in a 0.02 M Na2CO3 solution to
extract the glue-like sericin proteins. The remaining silk fibroin was rinsed in Milli-Q
water and dissolved in a LiBr solution at 60 °C for 4 h and then dialyzed with distilled
7/27/2019 circuitos biodegradaveis
http://slidepdf.com/reader/full/circuitos-biodegradaveis 3/46
3
water using dialysis cassettes for a couple of days to remove LiBr. After centrifugation
and filtration to remove insoluble remnants, the silk solution was diluted to 5 to 7 wt %
with ion-free distilled water and cast onto silicon substrates or glass slide to form ∼20 μm
thick films and kept drying out in air to form silk films.
3. Silk fibroin packaging scheme
Two ~100 μm silk fibroin films, cut into areas of ~5 cm × 5 cm, were cross-linked
via lamination at 120 °C for 60 s, to achieve maximum β-sheet crystallinity and complete
adhesion of the silk layers. The films were stacked, and then one edge was sealed by re-
lamination with 10 μL of ~6 % silk fibroin solution as an adhesion layer. The silk
substrate for the functional device was left uncrosslinked, and placed in between the two
cross-linked films. Finally, the other three sides were sealed by the same method, fully
encapsulating the sample in between the two films. Excess film was trimmed from the
edges to minimize the size of the encapsulated sample for implantation.
4. Animal model evaluations
Female BALB/c mice (6 - 8 weeks old) and female albino Sprague-Dawley rats
were anesthetized with an intraperitoneal injection of a ketamine/xylazine mix. The
depth of anesthesia was monitored by palpebral and withdrawal reflexes to confirm that
the animal had reached “stage 3” of anesthesia. The back was shaved and cleaned at the
incision site with 70 % ethanol, followed by a betadine surgical scrub. Once stage 3 was
confirmed, a small longitudinal incision was made through the skin and the sterile
implants (ethylene oxide sterilized) were inserted. The incision was closed with a Dexon

7/27/2019 circuitos biodegradaveis
http://slidepdf.com/reader/full/circuitos-biodegradaveis 4/46
4
5-0 suture. The animal was monitored until ambulatory and given a dose of analgesia
(Buprenorphine subcutaneously) as soon as surgery was completed.
5. Transient electronic systems with wireless power supply for thermal therapy
The device consists of Si NM resistors, with Mg inductive coils and
interconnection lines, formed on a silk substrate, with a separate silk package. Transfer
printing of doped Si NMs was followed by deposition and patterning of a first metal layer
(Ti/Mg, 5/250 nm), an interlayer dielectric (MgO, 400 nm) and a second metal layer
(Ti/Mg, 10/800 nm). The device was then packaged with silk, as described previously.
The coupling frequency for wireless power transmission was ~70 MHz.
6. Disintegrating transistor
Instead of a single Si NM, arrays of narrow Si nanoribbons (NRs) can be used, as
a way to accelerate transience through a process of disintegration that can enhance
diffusive mass transport. The fabrication in this case began with doped arrays of Si NRs
defined using procedures described in previous sections. Here, however, the buried oxide
was only partially removed from beneath the Si NRs, although completely removed in the
intervening regions. Next, patterning a layer of photoresist (AZ 5214) formed structures
(i.e. anchor bars; 10 µm × 50 µm, 1.5µm thick) that tethered the Si NRs to their
lithographically defined locations during a second etching step to complete the removal
of the buried oxide. Next, the arrays of Si NRs were transfer printed onto a separate
silicon substrate coated with a layer of silk. Evaporation of MgO (150 nm) on selected
areas through a polyimide shadow mask defined gate dielectrics and adhesion promoting

7/27/2019 circuitos biodegradaveis
http://slidepdf.com/reader/full/circuitos-biodegradaveis 5/46
5
layers. Finally, source, drain, and gate electrodes (Ti/Mg, 5/200 nm) were defined by a
similar procedure, to complete the devices.
7. Dissolution test of silicon
A series of dissolution tests of Si NMs were performed to study the detailed
kinetics of the process. The test structures for this purpose consisted of arrays of NMs in
3 3 µm square geometries, formed on SOI wafers by photolithography and RIE. We
investigated thicknesses of 35 nm, 70 nm, and 100 nm. The samples were placed into 50
mL of 1.0 M phosphate buffered saline (PBS, pH 7.4, Sigma-Aldrich, USA) at either
room temperature or temperatures close to those of the human body (37 °C). The
samples were removed from the PBS solution every two days to measure the height of
the Si NMs by atomic force microscopy (AFM, Asylum Research MFP-3D, USA). The
PBS solution was replaced every other day.
8. High resolution stencil masks
The sensitivity of silk to solvents and processes typically used in
photolithography motivated the use of high resolution shadow masking techniques for
patterning metals and dielectrics. The required stencil masks were made from uniform
polyimide (PI) films (12.5 µm, Kapton, Dupont, USA), with openings etched in desired
geometries. The fabrication process began with attachment of such a film onto a glass
slide coated with 10:1 poly(dimethylsiloxane) (monomer:catalyst, by weight) (PDMS,
Sylgard 184, Dow Corning, USA). A metal layer (Cr/Au, 10/150 nm) was deposited by
electron beam evaporation, patterned using photolithography and etched with wet

7/27/2019 circuitos biodegradaveis
http://slidepdf.com/reader/full/circuitos-biodegradaveis 6/46
6
etchant. The metal served as a hard mask during dry etching through the PI films with
oxygen (O2) gas. After etching, the metal mask was removed by wet etching, and the
patterned PI films were carefully peeled away to form high resolution stencil masks.
9. Encapsulation
Several different encapsulation layers were used to control the dissolution rate.
Test structures used to study this process involved traces of Mg (300 nm), patterned by a
lift-off process followed by e-beam evaporation, on glass slides. Parts of the traces were
coated with various encapsulating materials: MgO (400nm or 800nm), silk, PLGA
(poly(lactic-co-glycolic acid) 85:15, Mw 50,000-70,000, Sigma-Aldrich, USA) or
collagen film (Devro, USA). For silk encapsulation, several cycles of coating and
treatment were repeated: dipping the samples into a silk solution, drying at 65 °C,
treating with methanol to increase beta sheet content and then drying. Multiple coating
and subsequent methanol treatments were to increase the total thickness of the silk films.
PLGA was coated by placing a PDMS enclosure around the area to be coated and then
filling the internal volume with a PLGA solution. The solution was allowed to evaporate,
leaving only PLGA as an encapsulating layer. Collagen films were attached to glass
edges using a concentrated solution of PLGA, which was then allowed to dry, leaving a
solid but flexible, adhesive layer between the collagen and glass. The results are shown in
Fig. S7.

7/27/2019 circuitos biodegradaveis
http://slidepdf.com/reader/full/circuitos-biodegradaveis 7/46
7
10. Studies of transience and tunability of transience at the device level
In addition to the dissolution rate of transient materials, we studied the behavior at
the device level and demonstrated strategies to control the transience. In particular, we
first constructed several different transient devices, including n-channel MOSFETs,
silicon diodes, logic gates (NAND) and Mg resistors. The fabrication, except for the Mg
resistors, started with high temperature doping processes for the Si NMs (300 nm thick),
as described in previous sections. Transfer printed Si NMs of this type served as the
semiconductor layers. Layers of SiO2 (100 nm thick) deposited by PECVD served as the
gate dielectrics for the individual MOSFETs and those that were used in the NAND
gates. Similar layers, but with 400 nm thickness, provided interlayer dielectrics. The
electrodes consisted of Mg (300 or 400 nm thick) deposited by electron beam
evaporation. The device layouts appear in Fig. S17.
Encapsulation layers of MgO (400 nm thick) and crystallized silk (approximately
70 µm thick) provided transient barriers to DI water. In all cases, system configurations
allowed continuous probing of electrical properties through remotely located electrode
pads that connected to the devices, submerged in DI water at room temperature contained
in a removable well made of PDMS, as in Fig. S18. The results, summarized in Fig. S19,
show kinetics with two distinct timescales: the first, and longest, corresponds to
transience in the encapsulation layers; the second is due to the dissolution of active layers
in the devices, where disappearance of Mg occurs first. These behaviors illustrate
transience at the device level. The outcomes also demonstrate the ability to define
transience times with materials (i.e. encapsulation layers) that do not play active roles in

7/27/2019 circuitos biodegradaveis
http://slidepdf.com/reader/full/circuitos-biodegradaveis 8/46
8
device operation. In this manner, transience time can be engineered in a manner that is
independent of electrical function.
11. I n vivo studies of transience in an implantable RF metamaterial antenna
To study transience in vivo, we built a metamaterial antenna with overall
dimensions ~1.35 cm × 1.35 cm (made of 400 nm Mg and coated with 600 nm MgO as
the protection layer), to achieve a designed resonant frequency of ~1.8 GHz, on an
untreated/water-dissolvable silk film (~50 μm thick) encapsulated in silk package (~2 × 2
cm and ~100 μm thick) sealed along the edges via hot embossing using a few silk drops
as an adhesive, as described previously. Upon implantation under the skin of a female
albino Sprague-Dawley rat, this construction prevents direct contact between the device
and the surrounding tissues. Transience in this case is defined mainly by diffusion of bio-
fluids through edges of the silk pocket. The antenna was examined by measuring the
resonant responses with a network analyzer (HP 8753D) before and after the
encapsulation process and prior to implantation. In vivo responses were recorded on day
0 (right after the implantation), day 4, day 8 and day 15 (when the resonance of antenna
was barely detectable), as shown in Fig. 4C. The device was retrieved thereafter,
showing resorption into the tissue matrix with signs of faint and disconnected Mg traces.

7/27/2019 circuitos biodegradaveis
http://slidepdf.com/reader/full/circuitos-biodegradaveis 9/46
9
12. In vitro tests of bacterial inhibition provided by a transient, wireless thermal
therapy device
Devices with designs similar to those described previously were placed beneath a
~3 mm thick agar plate loaded with Escherichia coli bacteria (ATCC 25922, American
Type Culture Collection, Manassas VA). The bacteria was reconstituted and expanded
according to the provided instructions, and the liquid cultures were grown for 18-24
hours to an optical density (OD600) of 0.8 (corresponding to a viable count of ~107
CFU/mL). Three different device structures were separately examined. The first two
were controls, and consisted of Mg resistors and Mg RF inductive coils, both in isolation.
The third was the fully functional device (i.e. Mg resistor connected to a Mg RF
inductive coil). In all three cases, wireless power was applied at 80 MHz by an external
RF supply with a separately located primary coil (1 turn, diameter = 5 cm, 12 AWG), at
an input of ~33 dBm (i.e. 2 watts). The temperature profile of the bacterial-loaded agar
plate was monitored in real time using a thermal camera (FLIR SC645, FLIR Inc.). The
images showed negligible heating in the cases of the control samples, and heating to ~50
°C in the center of the plate (corresponding to the heater position) for the functional
device. After ~30 minutes of heating, the agar plates were placed in a 37 °C incubator
overnight to allow lawn growth. Visual inspection showed local absence of bacteria in
the region heated by the device, and no noticeable change for the controls. The results
are shown in Fig. S20.
7/27/2019 circuitos biodegradaveis
http://slidepdf.com/reader/full/circuitos-biodegradaveis 10/46
10
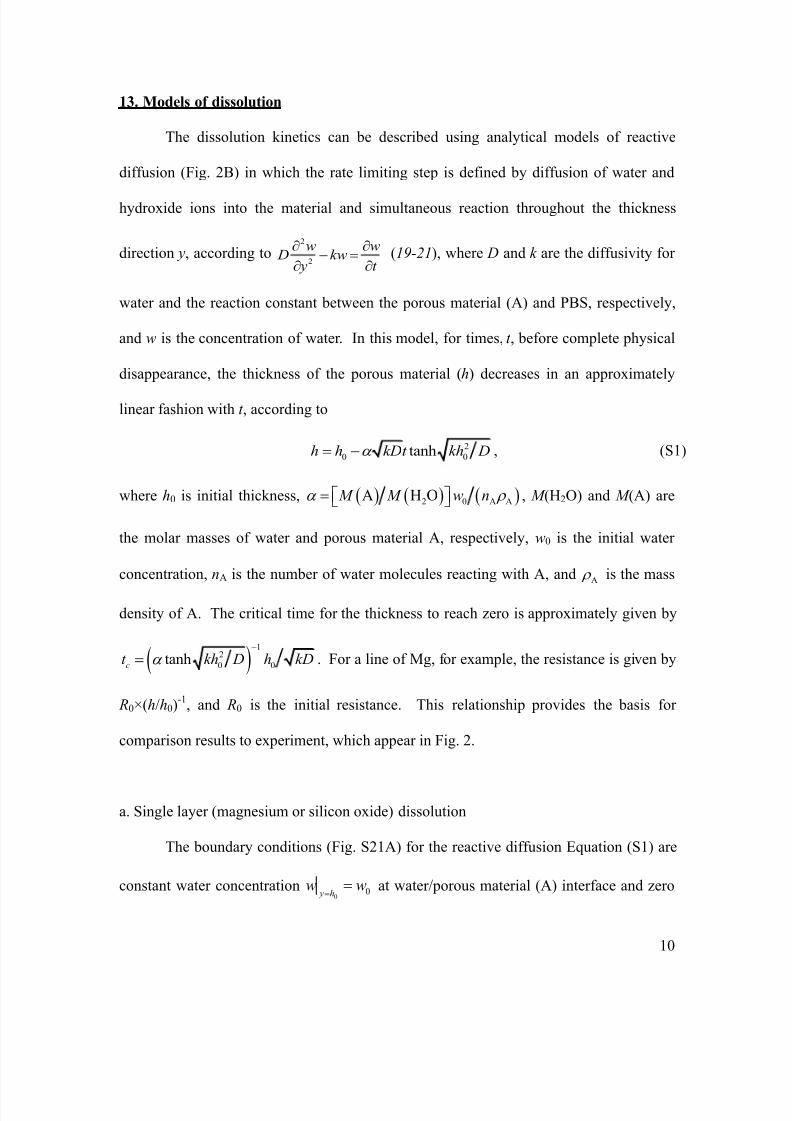
13. Models of dissolution
The dissolution kinetics can be described using analytical models of reactive
diffusion (Fig. 2B) in which the rate limiting step is defined by diffusion of water and
hydroxide ions into the material and simultaneous reaction throughout the thickness
direction y, according to2
2
w w D kw
y t
(19-21), where D and k are the diffusivity for
water and the reaction constant between the porous material (A) and PBS, respectively,
and w is the concentration of water. In this model, for times, t , before complete physical
disappearance, the thickness of the porous material (h) decreases in an approximately
linear fashion with t , according to
2
0 0tanhh h kDt kh D , (S1)
where h0 is initial thickness, 2 0 A AA H O M M w n , M (H2O) and M (A) are
the molar masses of water and porous material A, respectively, w0 is the initial water
concentration, nA is the number of water molecules reacting with A, andA
is the mass
density of A. The critical time for the thickness to reach zero is approximately given by
1
2
0 0tanh
ct kh D h kD
. For a line of Mg, for example, the resistance is given by
R0×(h/h0)-1
, and R0 is the initial resistance. This relationship provides the basis for
comparison results to experiment, which appear in Fig. 2.
a. Single layer (magnesium or silicon oxide) dissolution
The boundary conditions (Fig. S21A) for the reactive diffusion Equation (S1) are
constant water concentration0
0 y hw w
at water/porous material (A) interface and zero

7/27/2019 circuitos biodegradaveis
http://slidepdf.com/reader/full/circuitos-biodegradaveis 11/46
11
water flux0
0 y
w y
at the bottom surface of A. The initial condition is zero water
concentration 00 0 0
t w y h
. The solution was obtained by the method of
separation of variables as
22
20
20
2
1
2
0 2221 0200
11cosh
12, 2 cos
21cosh
2
nkh Dt
n Dh
n
kyn
y Dw y t w e n
hkhkhn
D D
.
(S2)
Its product with the reaction constant k gives the mass of water in A (per unit volume),
which in turn gives the mass of dissolute A (per unit volume) to be
A 2A H OkwM n M since nA water molecules react with one A atom. Its
integration over both the thickness direction y and time t gives the net A during
dissolution as
2220
20
2
0 0
2
0 0
2 10
220 0
22 2 221A 2 0 0 20
, ,
tanhA 1
1 2H O 1
2
Si
kh Dt n
Dh
nSi
kh wh Dt f
h h D
khw M kh Dt e D
n M D h kh khn
D D
. (S3)
For k and D in the present study, the summation on the left hand side of the above
equation is negligible, which leads to Eq. (S1).
Equation (S1) applies for Mg since two water molecules react with one Mg atom,

7/27/2019 circuitos biodegradaveis
http://slidepdf.com/reader/full/circuitos-biodegradaveis 12/46
12
2220
20
2 10
220 0
22 2 2210 2 0 0 20
tanhMg 1
1 22 H O 1
2
kh Dt n
Dh
n Mg
khw M khh Dt e D
h M D h kh khn
D D
, (S4)
where 3
Mg=1.738 g cm
is the mass density of Mg. For Mg initial thickness h0=300 nm
and initial resistance (per unit length) R0=1.06 Ω/mm, the resistance (per unit length)
R= R0(h/h0)-1
in Fig. 2E agrees well with the experiments for the reaction constant
k =1.2×10⁻³
s-1
and diffusivity D=6.0×10⁻¹²
cm2/s. Here k for Mg is much larger than that
for Si because the water-Mg reaction is much faster (hours to dissolute Mg versus weeks
to dissolute Si). The critical time t c for the complete dissolution of Mg is 38.4 min,
which agrees well with 40 min for open circuit in experiments.
Similarly, the reaction constant and diffusivity for SiO2 are obtained from the
experiments for PECVD SiO2 shown in Fig. S3 as k =1.5×10⁻⁶
s-1
, D=1.0×10⁻¹⁶
cm2/s at
room temperature (Fig. S3B) and k =3.0×10⁻⁶
s-1
and D=2.0×10⁻¹⁶
cm2/s at body
temperature (Fig. S3C) (9, 10, 22). The related AFM study is shown in Fig. S22.
b. Double layer (MgO/Mg) dissolution
The local coordinate systems for the Mg and MgO layers, denoted by subscripts 1
and 2, respectively, are shown in Fig. S21B. For Mg, the reactive diffusion equation with
zero water flux condition at the bottom surface and initial condition are

7/27/2019 circuitos biodegradaveis
http://slidepdf.com/reader/full/circuitos-biodegradaveis 13/46
13
1
2
1 1
1 1 1 1 12
1
1
1 0
1 1 10
0
0
0 0
y
t
w w D k w y h
y t
w
y
w y h
. (S5)
For MgO, the governing equation with constant water concentration at water/MgO
interface and initial condition are
2
2
2 2
2 2 2 2 22
2
2 00
2 2 20
0
0 0
y
t
w w D k w y h
y t
w w
w y h
. (S6)
The continuity of the concentration and flux of water molecules across the MgO/Mg
interface requires1 1 2 2
1 2 y h y hw w
and
1 1 2 2
1 2
1 2
1 2 y h y h
w w D D
y y
.
The solution of Eqs. (S5) and (S6) is obtained by the method of separation of variables as
2
2 22 11 1
1 0 2 1 1 1
11 2 1
2 2
2 21 22 2 2 2
2 0 1 2 2 2
12 2 1 2
cosh sin cos 0
sinh cosh cos sin 0
n
n
t n nn
n
t n nn
n
k k k yw w E C e h y y h
D D D
k k k y k yw w F C e h y y h
D D D D
, (S7)
where the constants E and F are given by
7/27/2019 circuitos biodegradaveis
http://slidepdf.com/reader/full/circuitos-biodegradaveis 14/46
14
2 2 2 2
1 1 1 1 2 2 1 1 2 2
2 2 1 2 1 2
2 2
1 1 1 1 2 2
2 2 1 2
2 2
1 1 1 1 2 2
2 2 1 2
1
sinh sinh cosh cosh
tanh tanh
tanh tanh 1
E
D k k h k h k h k h
D k D D D D
D k k h k h
D k D D F
D k k h k h
D k D D
, (S8)
the eigenvalue n (n=1,2,3,…) is determined from the following equation
2 21 2 2 2
1 2
1 2 1 1
tan tank k D k
h h D D D k
, (S9)
and C n is given by
21
2 2 1
1
2 21 2
1 2
1 22 2 2 22 1
1 2 2 1
2 22 11 2
1 2
1 2
2cos
=
sin 2 sin 2
sin 1 cos 1
2 2
n
n
n
n
n n
n n
n n
k k D h
DC
k k h h
D Dk k h h h h
D Dk k h h
D D
. (S10)
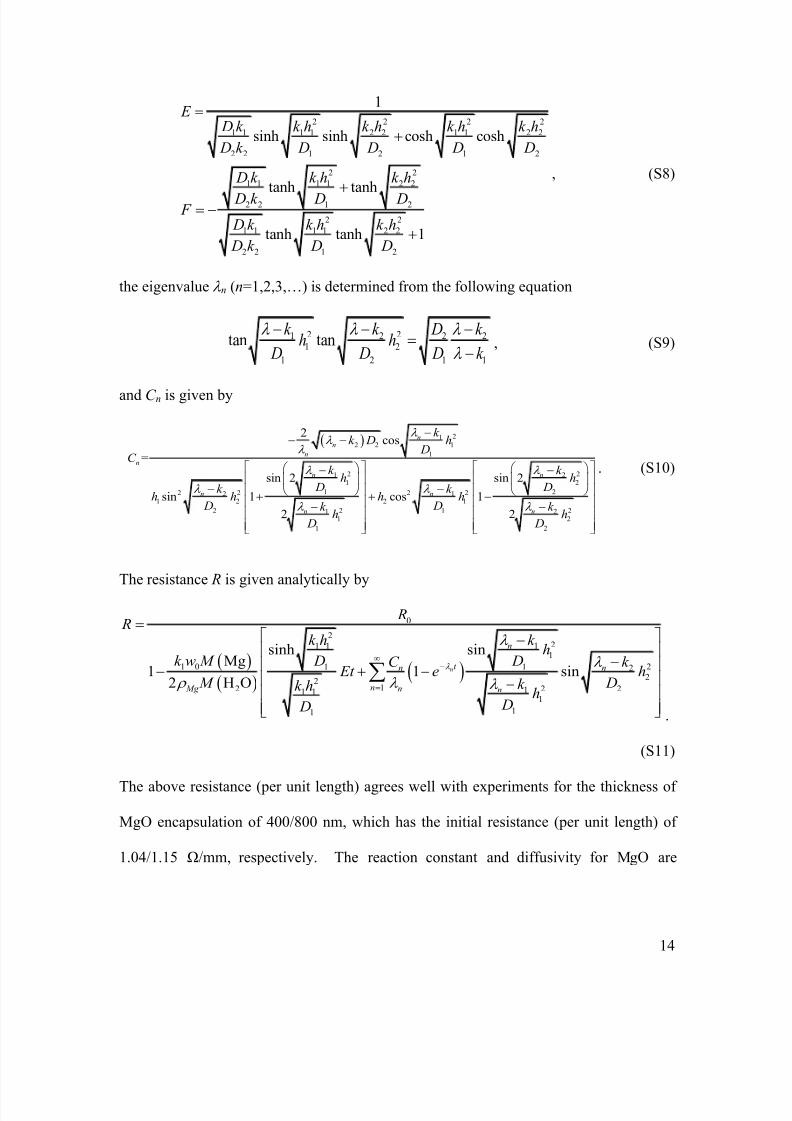
The resistance R is given analytically by
0
2211 1
1
21 0 1 1 22
21 22 211 1
1
11
sinh sinMg
1 1 sin2 H O
n
n
t n n
n Mg n n
R R
k k hh
k w M D DC k Et e h
M Dk k hh
D D
.
(S11)
The above resistance (per unit length) agrees well with experiments for the thickness of
MgO encapsulation of 400/800 nm, which has the initial resistance (per unit length) of
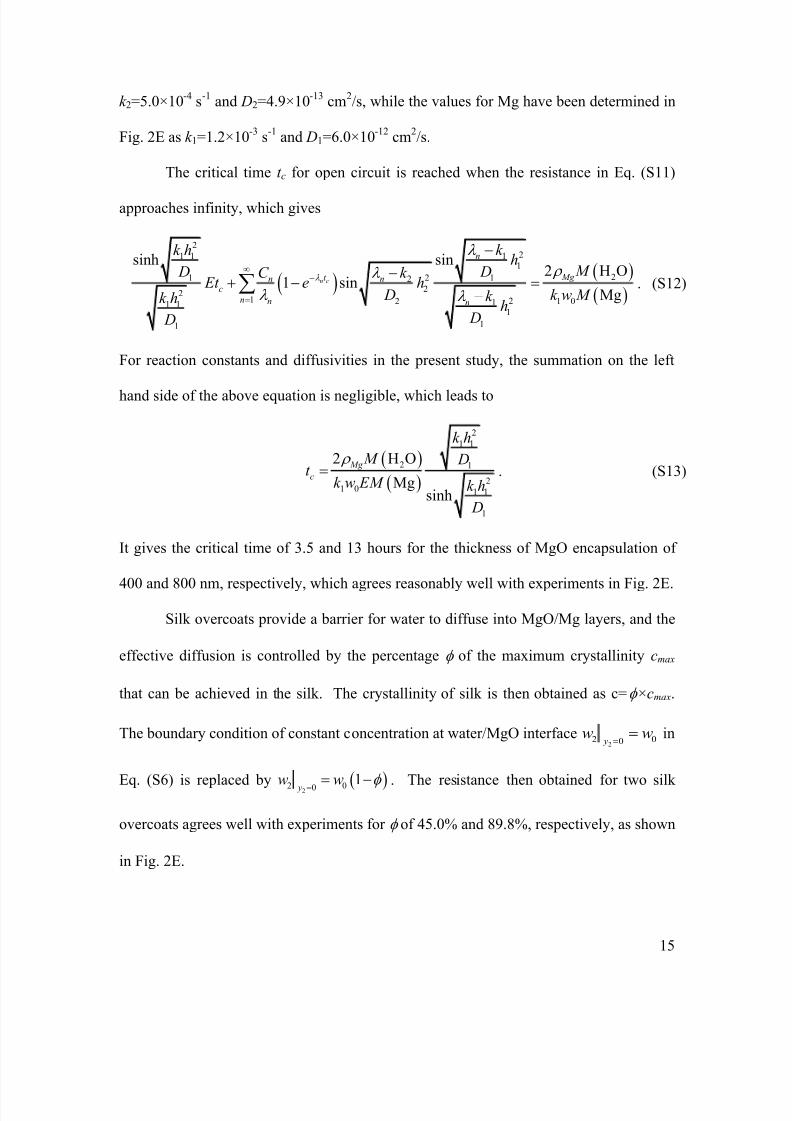
1.04/1.15 Ω/mm, respectively. The reaction constant and diffusivity for MgO are
7/27/2019 circuitos biodegradaveis
http://slidepdf.com/reader/full/circuitos-biodegradaveis 15/46
15
k 2=5.0×10⁻⁴
s-1
and D2=4.9×10⁻¹³
cm2/s, while the values for Mg have been determined in
Fig. 2E as k 1=1.2×10⁻³
s-1
and D1=6.0×10⁻¹²
cm2/s.
The critical time t c for open circuit is reached when the resistance in Eq. (S11)
approaches infinity, which gives
2211 1
1
21 1222
21 22 1 011 1
1
11
sinh sin2 H O
1 sinMg
n c
n
Mg t n nc
n n n
k k hh
M D DC k Et e h
D k w M k k hh
D D
. (S12)
For reaction constants and diffusivities in the present study, the summation on the left
hand side of the above equation is negligible, which leads to
2
1 1
2 1
21 0 1 1
1
2 H O
Mgsinh
Mg
c
k h
M Dt
k w EM k h
D
. (S13)
It gives the critical time of 3.5 and 13 hours for the thickness of MgO encapsulation of
400 and 800 nm, respectively, which agrees reasonably well with experiments in Fig. 2E.
Silk overcoats provide a barrier for water to diffuse into MgO/Mg layers, and the
effective diffusion is controlled by the percentage of the maximum crystallinity cmax
that can be achieved in the silk. The crystallinity of silk is then obtained as c= ×cmax.
The boundary condition of constant concentration at water/MgO interface2
2 00 yw w
in
Eq. (S6) is replaced by 22 001
yw w
. The resistance then obtained for two silk
overcoats agrees well with experiments for of 45.0% and 89.8%, respectively, as shown
in Fig. 2E.

7/27/2019 circuitos biodegradaveis
http://slidepdf.com/reader/full/circuitos-biodegradaveis 16/46
16
14. Models for in vivo transience of an implantable RF metamaterial antenna
The Q factor is related to the inductive reactance X L and resistance R L of inductors
by L L
Q X R . Neglecting small changes in X L, the Q factor normalized by its initial
value can be readily obtained from the thickness of the inductors and the model of double
layer dissolution, with crystallinity of 97.0cmax %.
15. Biocompatibility of transient electronic materials
All of materials in transient electronic devices consist of Si, Mg, MgO/SiO2, and
Silk. These constituent materials must be both bioresorbable and biocompatible, for
many envisioned biomedical applications of transient electronics. Previous literature
studies of the materials used for transient systems described here, but in other device
contexts, together with an examination of naturally occurring physiological
concentrations of these materials provide suggestive evidence. For example, a 1 µg Si
NM device dissolved in 3L of blood plasma yields a concentration of 0.33 µg/L, which
falls below physiological concentrations (23). The boron and phosphorous doping needed
to achieve n and p channel MOSFETs with Si NMs represent concentrations ~1 ng/L for
phosphorous and ~11 pg/L for boron, both of which are well below physiological levels
(400 mg/L for phosphorous, 24 mg/L for boron in blood), even at minimum volumes
necessary to avoid solubility limits for Si (90 µg/L for phosphorous and 1 µg/L for boron
in 0.03 mL). The total amounts of phosphorous (~3 ng) and boron (~33 pg) are orders of
magnitude smaller than the suggested daily intake (~1500 mg for phosphorous and 1 ~ 13
mg for boron) from a normal diet (24-27 ). Moreover, porous silicon and silica
nanoparticles are well established as viable candidates for bioresorbable drug delivery
7/27/2019 circuitos biodegradaveis
http://slidepdf.com/reader/full/circuitos-biodegradaveis 17/46
17
applications (28, 29). Mg and Mg alloys have been demonstrated in biodegradable stents.
In particular, Mg is already used as structural material in certain types of intravascular
stents (30). MgO has been used as coatings for these and related structures (31), as well
as for iron-based nanoparticle contrast agents for magnetic resonance imaging (32). Silk
is approved for clinical use in resorbable surgical sutures and soft tissue scaffolds (5).
The amounts of material utilized or envisioned for transient electronic constructs are
orders of magnitudes lower than those experimentally proven to have acceptable
biocompatibility and, in certain cases, established roles in clinical use.

7/27/2019 circuitos biodegradaveis
http://slidepdf.com/reader/full/circuitos-biodegradaveis 18/46
18
Fig. S1. Image of a demonstration platform for transient electronics, on a silk substrate,
in a bent configurations. The flat state appears in Fig. 1A.

7/27/2019 circuitos biodegradaveis
http://slidepdf.com/reader/full/circuitos-biodegradaveis 19/46
19
Fig. S2. Surface topography associated with Si NMs at various states of dissolution in
PBS, evaluated using atomic force microscopy (AFM) for three different initial
thicknesses. (A) 70 nm, (B) and (C), 30 nm, (D) and (E), 100 nm.

7/27/2019 circuitos biodegradaveis
http://slidepdf.com/reader/full/circuitos-biodegradaveis 20/46
20
Fig. S3. Measured (symbols) and calculated (lines) time dependent change in the
thicknesses of thin layers of transient electronic materials in PBS. (A) Si NM at room
temperature, in which the calculations correspond to simple surface reaction, (B) PECVD SiO2 at room temperature, (C) PECVD SiO2 at 37 °C.

7/27/2019 circuitos biodegradaveis
http://slidepdf.com/reader/full/circuitos-biodegradaveis 21/46
21
Fig. S4. Change of current-voltage characteristics of a serpentine trace of Mg
encapsulated with various materials during dissolution in DI water at room temperature:
(A) Experimental (symbol) and analytical results (line) for the resistance change of Mg
trace (300 nm), as a function of time. The inset shows the image of Mg trace, (B) Ti/Mg
(5/300nm), (C) Ti/Mg/MgO (5/300/400 nm), (D) Ti/Mg/MgO (5/300/800 nm), (E)
Ti/Mg/MgO/silk (i) (5/300/400 nm/ 50 µm), (F) Ti/Mg/MgO/silk (ii) (5/300/800 nm/ 50
µm)

7/27/2019 circuitos biodegradaveis
http://slidepdf.com/reader/full/circuitos-biodegradaveis 22/46
22
Fig. S5. Time dependent dissolution of transient electronic materials in DI water at room
temperature. (A) MgO (150 nm) and (B) Mg (300 nm), with a 5 nm layer of Ti as an
adhesion promoter.

7/27/2019 circuitos biodegradaveis
http://slidepdf.com/reader/full/circuitos-biodegradaveis 23/46
23
Fig. S6. Image and electrical characterization of transient electronic devices designed to
disintegrate, as a means to accelerate the rate of transience. (A) Image of a 6×9 array of
silicon transistors (first frame). Each transistor uses arrays of Si nanoribbons for the
active channel regions (second frame). These nanoribbons disintegrate into individual
pieces in the early stages of dissolution, as shown in the third (3 min) and fourth (5 min)
frames. (B) Images of a 6×8 array of silicon diodes fabricated with Si nanoribbons
before (first and second frame) and after (third and fourth frame) dissolution. (C) Linear
(blue) and log scale (red) transfer curves measured from disintegrating transistors (left),
current-voltage (I-V) curves of disintegrating transistors (middle) and I-V characteristics
of disintegrating diodes (right).

7/27/2019 circuitos biodegradaveis
http://slidepdf.com/reader/full/circuitos-biodegradaveis 24/46
24
Fig. S7. Change in resistance (R) of a dissolving serpentine trace of Mg in DI water,
encapsulated with (A) PLGA, and (B) Collagen.

7/27/2019 circuitos biodegradaveis
http://slidepdf.com/reader/full/circuitos-biodegradaveis 25/46
25
Fig. S8. (A) Comparison of electrical responses of n-channel MOSFETs that use Mg and
Au source/drain electrodes, evaluated by their width-normalized (W) resistance as a
function of channel length ( Lch) at gate voltages of 4V, 5V, and 6V. (B) Measured,
length (L) normalized resistances (R) of Mg and Au traces for multiple line widths, each
for two different thicknesses, 150 nm, and 300 nm, respectively. (C) Transfer curves
(left), and I-V characteristics (right) from n-channel MOSFETs that use Mg and Au
source/drain electrodes.

7/27/2019 circuitos biodegradaveis
http://slidepdf.com/reader/full/circuitos-biodegradaveis 26/46
26
Fig. S9. (A) Images of transient capacitors with different sizes. The area of overlap of
the two Mg electrodes is 30 × 100 µm (black), 100 × 100 µm (red), 150 × 100 µm (blue),
200 × 100 µm (purple). (B) Measured capacitances of devices that use MgO (left) and
SiO2 (right) dielectrics. (C) Image of n-channel transient MOSFETs, consisting of Mg
source, drain, gate electrodes, MgO gate dielectrics and Si NM active layers. (D) Linear(black) and log scale (blue) transfer curves of a representative MOSFETs shown in C.
(E) Linear (black) and log scale (blue) transfer curves of a p-channel transient MOSFET
shown in the left frame of Fig. 3C. The channel length ( Lch), and width (W) are 20 µm
and 600 µm, respectively. The threshold voltage, mobility and on/off ratio are -6 V, 100
± 10 cm2/V·s and ~10
5, respectively. (F) Image of an interconnected 4 × 4 array of

7/27/2019 circuitos biodegradaveis
http://slidepdf.com/reader/full/circuitos-biodegradaveis 27/46
27
temperature sensors based on Si NM diodes. (G) I-V characteristics of a temperature
sensor at different temperatures (left). Voltages applied to a temperature sensor to yield
an output current of 10 µA, at different temperatures. The voltage-temperature slope
from the resulting calibration curve is ~ -2.23 mV/°C (right). (H) Image of 4 × 4 array of
temperature sensors that use Mg resistors, Mg interconnects, and MgO as an interlayer
dielectric. (I) I-V characteristics of a representative temperature sensor shown in h (left).
Measured dependence of the resistance of a Mg temperature sensor on temperature
(right). As the temperature increases, the resistance increases with the slope of ~0.14
Ω/°C.

7/27/2019 circuitos biodegradaveis
http://slidepdf.com/reader/full/circuitos-biodegradaveis 28/46
28
Fig. S10. (A) Image of solar cells that use ~3 µm thick bars of Si and Mg interconnects
(left). Current density and power measured from a representative device as a function of
voltage (right) when illuminated using light from a solar simulator. (B) Experimental
(symbol) and analytical (line) results of the fractional change in resistance of a silicon
resistor as a function of applied tensile (red), and compressive strain (blue). (C) I-V
characteristics of a representative pixel shown in the right frame of Fig. 3E. The curves
labeled dark (red) and bright (blue) correspond to measurements preformed with a light
source in the on and off states, respectively. (D) Various images obtained using a
passive matrix, 8 × 8 array of transient photodetectors, operated in a mode in which the
object is scanned and a collection of recorded images is combined to improve the

7/27/2019 circuitos biodegradaveis
http://slidepdf.com/reader/full/circuitos-biodegradaveis 29/46
29
effective resolution. Each inset shows the original object pattern. A simple optics set-up
containing an object, a diffusive light source, a plano-convex lens, and a separate data
acquisition program were used. The distance between the lens and source image was 98
millimeters. In certain cases, an overscanning procedure was used to remove the effects
of malfunctioning pixels.

7/27/2019 circuitos biodegradaveis
http://slidepdf.com/reader/full/circuitos-biodegradaveis 30/46
30
Fig. S11. Individual pixel layouts for various sensors, (A) Temperature sensor based on
Si NM diodes (left), Mg resistors (right), (B) Si solar cell, (C) Si NM strain sensor, (D)
Si NM photodiode. Insets show electrical schematic diagrams of each sensor.

7/27/2019 circuitos biodegradaveis
http://slidepdf.com/reader/full/circuitos-biodegradaveis 31/46
31
Fig. S12. (A) Image showing an uncorrected, normalized image captured by a transient
camera. The red highlighted regions correspond to malfunctioning pixels. Their effects
could be removed by overscanning. (B) The result of this overscanning process.

7/27/2019 circuitos biodegradaveis
http://slidepdf.com/reader/full/circuitos-biodegradaveis 32/46
32
Fig. S13. Additional histological analysis of biocompatibility. This example corresponds
to a silk device, after implantation for 2 weeks. (A) and (B) show composite collections
of images at low and high magnification. (A, subcutaneous tissue; B, silk film; C, muscle
layer)

7/27/2019 circuitos biodegradaveis
http://slidepdf.com/reader/full/circuitos-biodegradaveis 33/46
33
Fig. S14. (A) Image of wireless power coil integrated with two Si NM resistors in
parallel. (B) I-V characteristics of the Si NM resistors. (C) Infrared (IR) image of
heating coils powered wirelessly through inductive coupling, with two Si NM resistors.

7/27/2019 circuitos biodegradaveis
http://slidepdf.com/reader/full/circuitos-biodegradaveis 34/46
34
Fig. S15. Infrared image of a heater driven inductively at a frequency of 68 MHz using
different input powers: 0 % (top-left), 18 % (bottom-left), 20 % (top-right), and 25 %
(bottom-right).

7/27/2019 circuitos biodegradaveis
http://slidepdf.com/reader/full/circuitos-biodegradaveis 35/46
35
Fig. S16. (A) Demonstration of a Mg resistor integrated with an inductive coil: 1-resistor
(left) and 2-resistor (right). (B) Measured I-V characteristics of a Mg resistor. (C) IR
images of coils with different number of Mg resistors: 1 resistor (left) and 2 resistors
(right).

7/27/2019 circuitos biodegradaveis
http://slidepdf.com/reader/full/circuitos-biodegradaveis 36/46
36
Fig. S17. Layouts of transient devices used for device-level studies. (A) n-channel Si NM MOSFETs, (B) Individual n-channel MOSFET, corresponding to the dashed white
box in A, (C) Individual Si NM diodes, corresponding to the dashed white box in D, (D)
Si diodes, (E) NAND gates, (F) Individual NAND gate, corresponding to the dashed
white box in E, (G) Individual Mg resistor, corresponding to the dashed white box in H,
(H) Mg resistors.

7/27/2019 circuitos biodegradaveis
http://slidepdf.com/reader/full/circuitos-biodegradaveis 37/46
37
Fig. S18. Structures for device-level studies of transience. (A) Schematic illustration,
showing the PDMS well and the remote probing pads. (B) Top-view picture of an array
of devices under test.

7/27/2019 circuitos biodegradaveis
http://slidepdf.com/reader/full/circuitos-biodegradaveis 38/46
38
Fig. S19. Studies of transience and tunability of transience at the device level. (A)
Calculated characteristics, such as mobility, on/off current ratio ( I on /I off ) and threshold
voltage (V th) (left), and log scale (right) transfer curves measured from a transient n-
channel MOSFET, corresponding to the device shown in Fig. 2F, as a function of time
after immersion in DI water. The data show dual kinetics in transience: negligible
change in properties for the first ~4 days, followed by rapid decay. The thicknesses of
the MgO and silk encapsulation layers determine the first timescale; the thickness of the
Mg electrodes defines the second. (B) Time dependent changes in current (left) and
current-voltage characteristics of silicon diodes (right). The overall transient behaviors
are similar to those of the MOSFET. The inset shows an image of an array of devices.
(C) Output voltage characteristics of a logic gate (NAND) measured under similar
conditions, and with input voltages of 0 V. The inset shows an image of an array of
devices. (D) Measurements of length-normalized resistance and fractional changes of
resistance in Mg traces as functions of time. The inset shows an array of resistors.

7/27/2019 circuitos biodegradaveis
http://slidepdf.com/reader/full/circuitos-biodegradaveis 39/46
39
Fig. S20. In vitro tests of bacterial inhibition provided by a transient, wireless thermal
therapy device. (A) Images of three different transient devices, each beneath agar and
with a primary coil for wireless power delivery - an isolated, serpentine Mg resistor (left),
an isolated Mg RF inductive coil (middle), an interconnected resistor and coil (coil +
resistor, right). (B) Magnified view of a resistor (left), a coil (middle) and a heater
(right). (C) Infrared images of agar plates with devices inductively powered at a
frequency of 80 MHz. The resistor (left) and coil (middle) show negligible heating, as
expected. The integrated device (right) shows a peak temperature of ~50 °C at the

7/27/2019 circuitos biodegradaveis
http://slidepdf.com/reader/full/circuitos-biodegradaveis 40/46
40
location of the resistor. (D) Images of bacteria after incubation. The results show no
bacteria clearance for the cases of the resistor (left) and coil (middle). The integrated
device indicates bacteria clearance at a region corresponding to the resistor and hottest
core zone (right).

7/27/2019 circuitos biodegradaveis
http://slidepdf.com/reader/full/circuitos-biodegradaveis 41/46
41
Fig. S21. Schematic illustration for the theoretical models used to capture the kinetics of
dissolution, (A) Single layer, and (B) Double layer.

7/27/2019 circuitos biodegradaveis
http://slidepdf.com/reader/full/circuitos-biodegradaveis 42/46
42

7/27/2019 circuitos biodegradaveis
http://slidepdf.com/reader/full/circuitos-biodegradaveis 43/46
43
Fig. S22. AFM images and line profiles collected at various stages of dissolution of
different thicknesses of SiO2 films deposited by plasma enhanced chemical vapor
deposition (PECVD): (A) and (B) 35nm, (C) and (D) 70nm, (E) and (f) 100nm.

7/27/2019 circuitos biodegradaveis
http://slidepdf.com/reader/full/circuitos-biodegradaveis 44/46
1
References and Notes
1. C. J. Bettinger, Z. Bao, Organic thin-film transistors fabricated on resorbable biomaterial
substrates. Adv. Mater. 22, 651 (2010). doi:10.1002/adma.200902322
2. M. Irimia-Vladu et al., Biocompatible and biodegradable materials for organic field-effect transistors. Adv. Funct. Mater. 20, 4069 (2010). doi:10.1002/adfm.201001031
3. C. Legnani et al., Bacterial cellulose membrane as flexible substrate for organic light
emitting devices. Thin Solid Films 517, 1016 (2008). doi:10.1016/j.tsf.2008.06.011
4. D.-H. Kim et al., Dissolvable films of silk fibroin for ultrathin conformal bio-integratedelectronics. Nat. Mater. 9, 511 (2010). doi:10.1038/nmat2745 Medline
5. Y. Wang et al., In vivo degradation of three-dimensional silk fibroin scaffolds.
Biomaterials 29, 3415 (2008). doi:10.1016/j.biomaterials.2008.05.002 Medline
6. Information on materials and methods is available in supplementary materials on Science
Online.7. D.-H. Kim et al., Epidermal electronics. Science 333, 838 (2011).
doi:10.1126/science.1206157 Medline
8. R. K. Iler, Effect of adsorbed alumina on the solubility of amorphous silica in water. J.
Colloid Interface Sci. 43, 399 (1973). doi:10.1016/0021-9797(73)90386-X
9. J. D. Rimstidt, H. L. Barnes, The kinetics of silica-water reactions. Geochim.
Cosmochim. Acta 44, 1683 (1980). doi:10.1016/0016-7037(80)90220-3
10. M. Morita, T. Ohmi, E. Hasegawa, M. Kawakami, M. Ohwada, Growth of native oxide
on a silicon surface. J. Appl. Phys. 68, 1272 (1990). doi:10.1063/1.347181
11. H. Seidel, L. Csepregi, A. Heuberger, H. Baumgartel, Anisotropic etching of crystallinesilicon in alkaline solutions. J. Electrochem. Soc. 137, 3612 (1990).doi:10.1149/1.2086277
12. R. D. Levine, Molecular Reaction Dynamics (Cambridge Univ. Press, Cambridge,
2005).
13. X. Hu et al., Regulation of silk material structure by temperature-controlled water vapor
annealing. Biomacromolecules 12, 1686 (2011). doi:10.1021/bm200062a Medline
14. H.-J. Chung et al., Fabrication of releasable single-crystal silicon-metal oxide field-effect devices and their deterministic assembly on foreign substrates. Adv. Funct.
Mater. 21, 3029 (2011). doi:10.1002/adfm.201100124
15. S. Santra, P. K. Guha, S. Z. Ali, I. Haneef, F. Udrea, Silicon on insulator diode
temperature sensor–a detailed analysis for ultra-high temperature operation. IEEE
Sens. J. 10, 997 (2010). doi:10.1109/JSEN.2009.2037822
16. S. M. Won et al., IEEE Trans. Electron Devices 58, 4074 (2011).
doi:10.1109/TED.2011.2164923

7/27/2019 circuitos biodegradaveis
http://slidepdf.com/reader/full/circuitos-biodegradaveis 45/46
2
17. National Nosocomial Infections Surveillance (NNIS) report, data summary fromOctober 1986-April 1996, issued May 1996. Am. J. Infect. Control 24, 380 (1996).
doi:10.1016/S0196-6553(96)90026-7 Medline
18. D. J. Anderson et al., PLoS ONE 4, 1 (2009);
http://dx.doi.org/10.1371/journal.pone.0008305.
19. P. V. Danckwerts, Absorption by simultaneous diffusion and chemical reaction. Trans.
Faraday Soc. 46, 300 (1950). doi:10.1039/tf9504600300
20. P. Hawtin, R. Murdoch, The role of in-pore mass transport resistance in the reaction of
porous solids with gases. The air oxidation of large tubes of graphite. Chem. Eng.
Sci. 19, 819 (1964). doi:10.1016/0009-2509(64)85093-4
21. M. N. Ozisik, H. J. Nordwall, Nucl. Sci. Eng. 44, 310 (1971).
22. M. Tomozawa, K. M. Davis, Time dependent diffusion coefficient of water into silica
glass at low temperatures. Mater. Sci. Eng. A 272, 114 (1999). doi:10.1016/S0921-
5093(99)00463-3 23. W. Becker et al., European Food Safety Authority J. 60, 1 (2004).
24. M. R. Naghii, M. Mofid, A. R. Asgari, M. Hedayati, M.-S. Daneshpour, Comparativeeffects of daily and weekly boron supplementation on plasma steroid hormones and
proinflammatory cytokines. J. Trace Elem. Med. Biol. 25, 54 (2011).
doi:10.1016/j.jtemb.2010.10.001 Medline
25. J. Capala et al., Boron neutron capture therapy for glioblastoma multiforme: Clinicalstudies in Sweden. J. Neurooncol. 62, 135 (2003). doi:10.1007/BF02699940
Medline
26. G. A. Block, T. E. Hulbert-Shearon, N. W. Levin, F. K. Port, Association of serum
phosphorus and calcium x phosphate product with mortality risk in chronichemodialysis patients: A national study. Am. J. Kidney Dis. 31, 607 (1998).
doi:10.1053/ajkd.1998.v31.pm9531176 Medline
27. V. R. Young et al., Dietary Reference Intakes for Calcium, Phosphorus, Magnesium,
Vitamin D, and Fluoride (National Academies Press, Washington, DC, 1997).
28. J.-H. Park et al., Biodegradable luminescent porous silicon nanoparticles for in vivoapplications. Nat. Mater. 8, 331 (2009). doi:10.1038/nmat2398 Medline
29. B. G. Trewyn, J. A. Nieweg, Y. Zhao, V. S.-Y. Lin, Biocompatible mesoporous silica
nanoparticles with different morphologies for animal cell membrane penetration.
Chem. Eng. J. 137
, 23 (2008). doi:10.1016/j.cej.2007.09.045 30. F. Witte, The history of biodegradable magnesium implants: A review. Acta Biomater.
6, 1680 (2010). doi:10.1016/j.actbio.2010.02.028 Medline
31. S. Shen, P. S. Chow, F. Chen, R. B. H. Tan, Submicron particles of SBA-15 modified
with MgO as carriers for controlled drug delivery. Chem. Pharm. Bull. (Tokyo) 55,
985 (2007). doi:10.1248/cpb.55.985 Medline

7/27/2019 circuitos biodegradaveis
http://slidepdf.com/reader/full/circuitos-biodegradaveis 46/46
32. C. Martinez-Boubeta et al., Self-assembled multifunctional Fe/MgO nanospheres formagnetic resonance imaging and hyperthermia. Nanomedicine: NBM 6, 362 (2010).
doi:10.1016/j.nano.2009.09.003