chapter 6 long-run economic growth. copyright ©2014 pearson education 6-2 chapter outline the...
TRANSCRIPT

Chapter 6
Long-Run Economic Growth

Copyright ©2014 Pearson Education6-2
Chapter Outline
• The Sources of Economic Growth• Long-Run Growth: The Solow Model• Endogenous Growth Theory• Government Policies to Raise Long-Run Living Standards
Copyright ©2014 Pearson Education6-3
Long-Run Economic Growth
• Introduction– Countries have grown at very different rates over long spans of time (Table 6.1)
– We would like to explain why this happens
Copyright ©2014 Pearson Education6-4
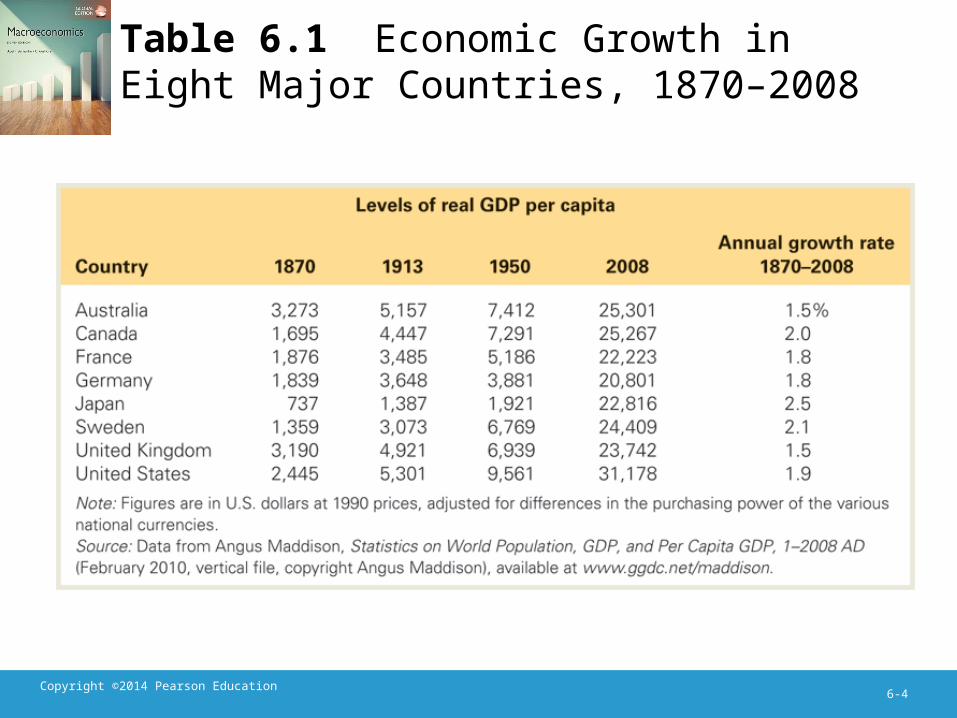
Table 6.1 Economic Growth in Eight Major Countries, 1870–2008
Copyright ©2014 Pearson Education6-5
The Sources of Economic Growth
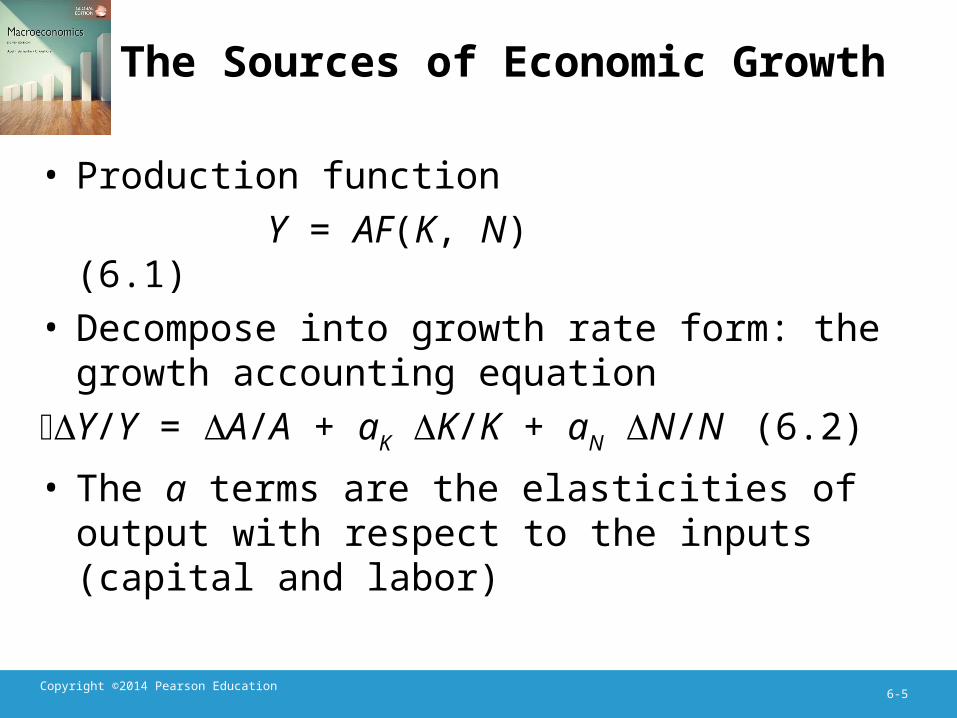
• Production functionY = AF(K, N)
(6.1)• Decompose into growth rate form: the growth accounting equation
Y/Y = A/A + aK K/K + aN N/N (6.2)
• The a terms are the elasticities of output with respect to the inputs (capital and labor)
Copyright ©2014 Pearson Education6-6
The Sources of Economic Growth
• Interpretation– A rise of 10% in A raises output by 10%
– A rise of 10% in K raises output by aK times 10%
– A rise of 10% in N raises output by aN times 10%
• Both aK and aN are less than 1 due to diminishing marginal productivity
Copyright ©2014 Pearson Education6-7
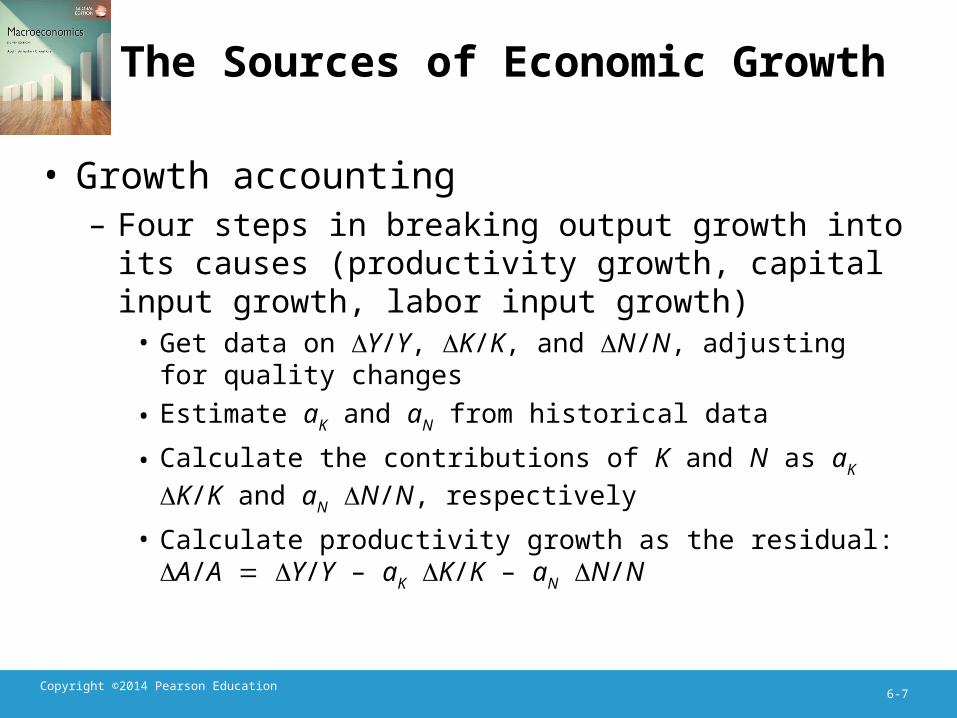
The Sources of Economic Growth
• Growth accounting– Four steps in breaking output growth into its causes (productivity growth, capital input growth, labor input growth)• Get data on Y/Y, K/K, and N/N, adjusting for quality changes
• Estimate aK and aN from historical data
• Calculate the contributions of K and N as aK K/K and aN N/N, respectively
• Calculate productivity growth as the residual: A/A Y/Y – aK K/K – aN N/N
Copyright ©2014 Pearson Education6-8
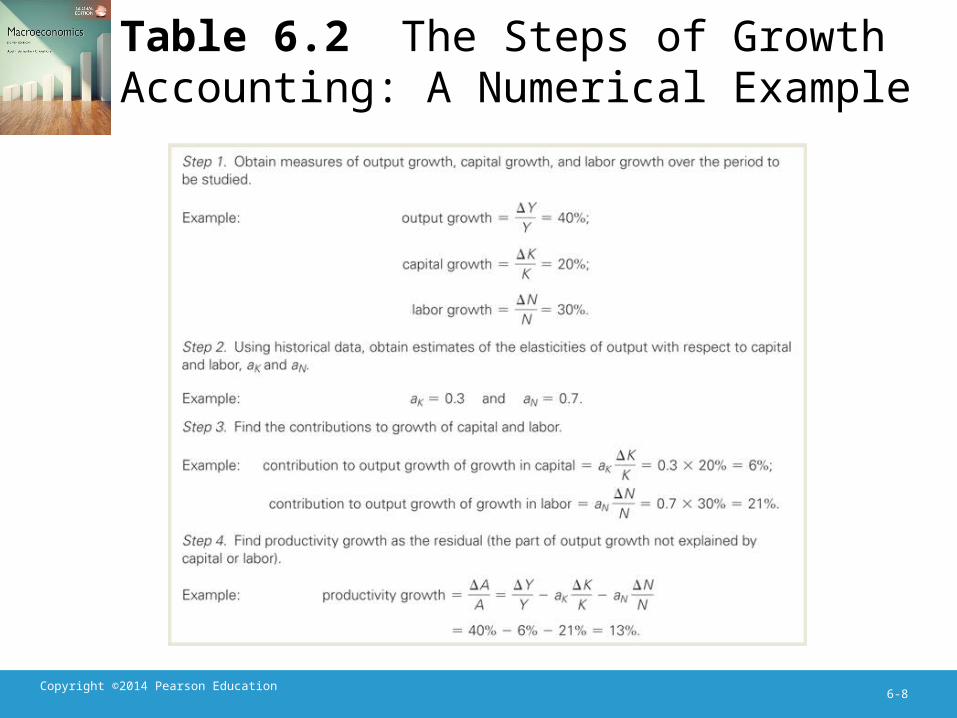
Table 6.2 The Steps of Growth Accounting: A Numerical Example
Copyright ©2014 Pearson Education6-9
The Sources of Economic Growth
• Growth accounting and the productivity slowdown– Denison’s results for 1929–1982 (text Table 6.3)• Entire period output growth 2.92%; due to labor 1.34%; due to capital 0.56%; due to productivity 1.02%
• Pre-1948 capital growth was much slower than post-1948
• Post-1973 labor growth slightly slower than pre-1973
Copyright ©2014 Pearson Education6-10
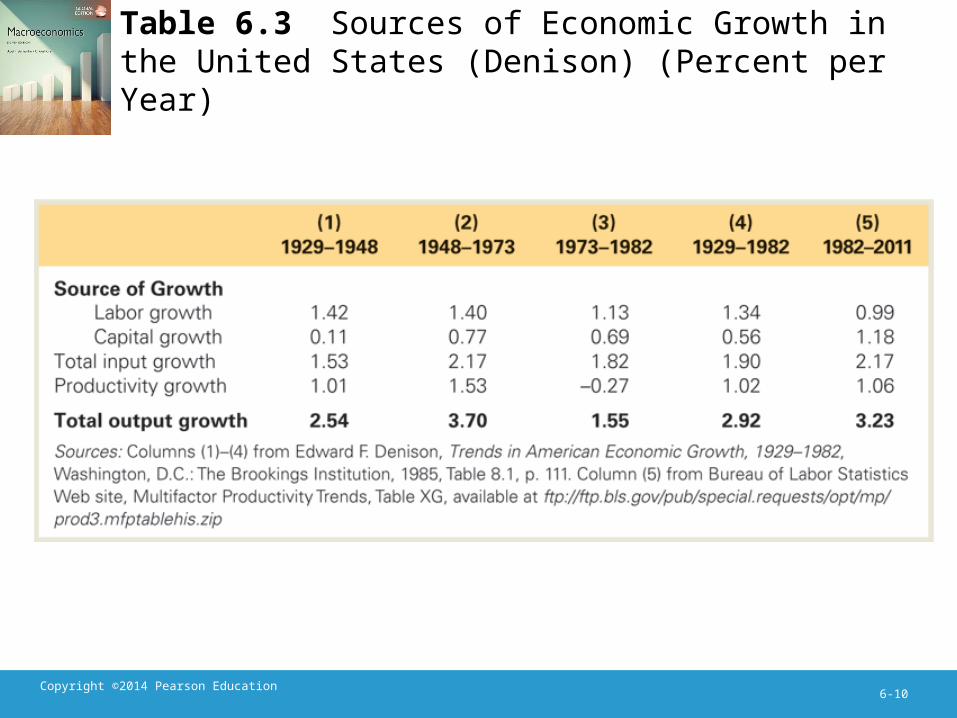
Table 6.3 Sources of Economic Growth in the United States (Denison) (Percent per Year)
Copyright ©2014 Pearson Education6-11
The Sources of Economic Growth
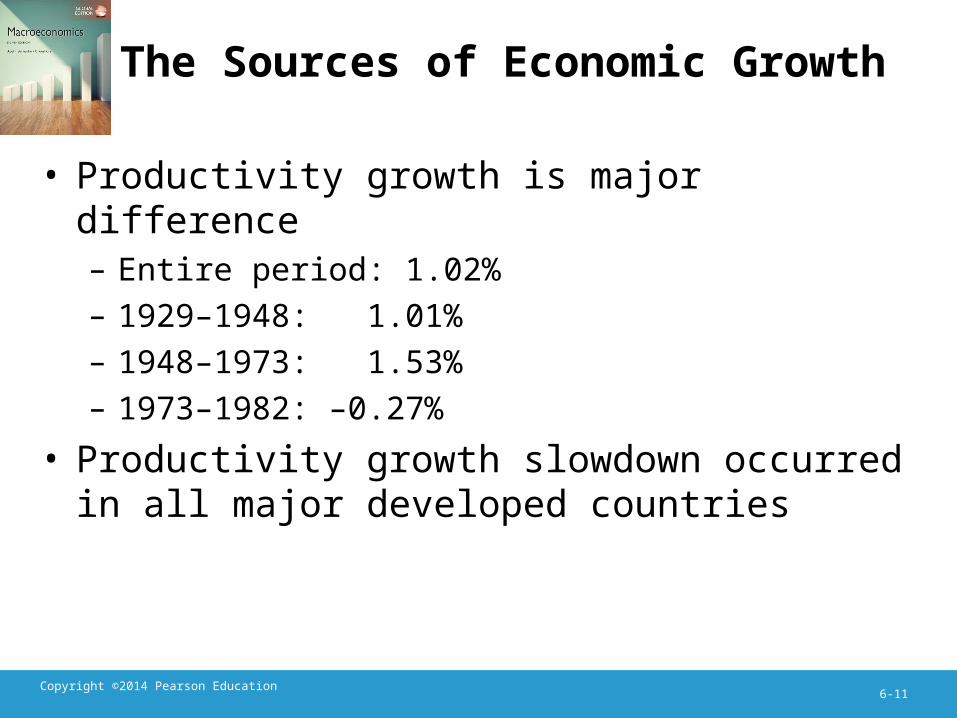
• Productivity growth is major difference– Entire period: 1.02%– 1929–1948: 1.01%– 1948–1973: 1.53%– 1973–1982: –0.27%
• Productivity growth slowdown occurred in all major developed countries
Copyright ©2014 Pearson Education6-12
The Sources of Economic Growth
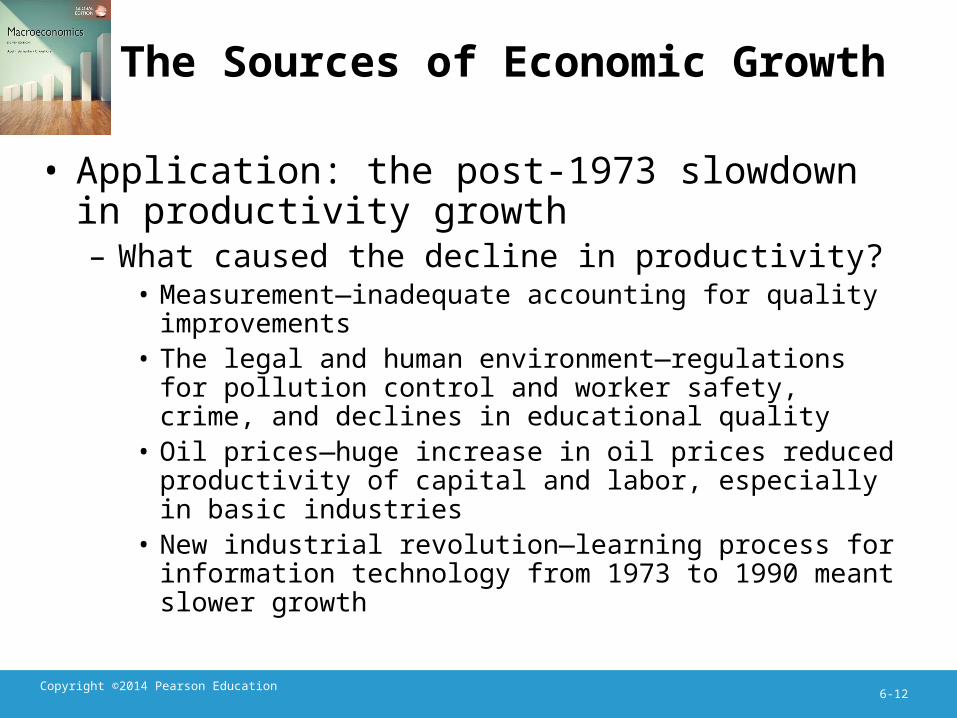
• Application: the post-1973 slowdown in productivity growth– What caused the decline in productivity?
• Measurement—inadequate accounting for quality improvements
• The legal and human environment—regulations for pollution control and worker safety, crime, and declines in educational quality
• Oil prices—huge increase in oil prices reduced productivity of capital and labor, especially in basic industries
• New industrial revolution—learning process for information technology from 1973 to 1990 meant slower growth

Copyright ©2014 Pearson Education6-13
The Sources of Economic Growth
• Application: the recent trends in U.K. productivity
• Labor productivity has been steadily increasing– Labor productivity and TFP grew steadily from 1976 to 2008 (Fig. 6.1)

Copyright ©2014 Pearson Education6-14
Figure 6.1 Productivity levels inthe UK, 1972–2009
Sources: Labor productivity: OECD Labour Statistics, available at http://www.oecd.org/statistics/. Total factor productivity: AMECO, available at http://ec.europa.eu/ economy_finance/db_indicators/ ameco/zipped_en.htm.
Copyright ©2014 Pearson Education6-15
Productivity
• Labor productivity growth has generally exceeded TFP growth since 2001 (Fig. 6.2)

Copyright ©2014 Pearson Education6-16
Sources: Labor productivity: OECD Labour Statistics, availableat http://www.oecd.org/ statistics/. Total factor productivity: AMECO, available at http://ec.europa.eu/economy_ finance/db_indicators/ameco/zipped_en.htm
Figure 6.2, Productivity growththe UK, 1972–2009
Copyright ©2014 Pearson Education6-17
Productivity
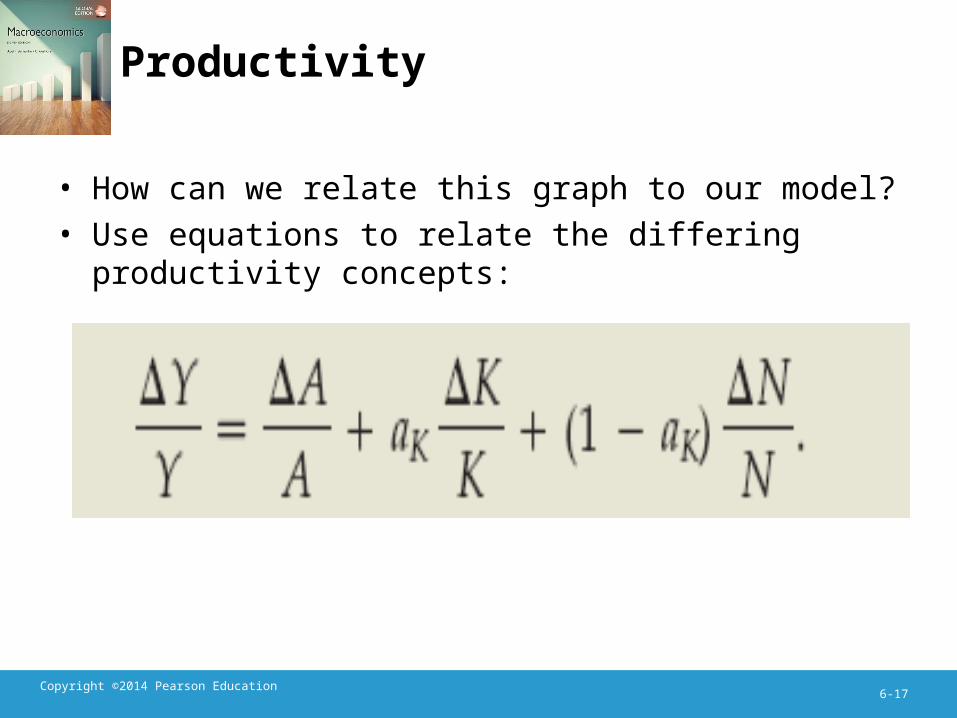
• How can we relate this graph to our model?• Use equations to relate the differing productivity concepts:
Copyright ©2014 Pearson Education6-18
Productivity
• So, labor productivity growth exceeds TFP growth because of faster growth of capital relative to growth of labor
• ICT growth (information and communications technology) may have been a prime reason

Copyright ©2014 Pearson Education6-19
Productivity
• Similar growth in productivity experienced in past– Steam power, railroads, telegraph in late 1800s
– Electrification of factories after WWI– Transistor after WWII
• What matters most is ability of economy to adapt to new technologies
Copyright ©2014 Pearson Education6-20
Long-Run Growth: The Solow Model
• Two basic questions about growth– What’s the relationship between the long-run standard of living and the saving rate, population growth rate, and rate of technical progress?
– How does economic growth change over time? Will it speed up, slow down, or stabilize?
Copyright ©2014 Pearson Education6-21
The Solow Model
• Setup of the Solow model• Basic assumptions and variables
– Population and work force grow at same rate n
– Economy is closed and G 0Ct Yt – It
(6.4)
– Rewrite everything in per-worker terms: yt Yt/Nt; ct Ct/Nt; kt Kt/Nt
– kt is also called the capital-labor ratio
Copyright ©2014 Pearson Education6-22
The Solow Model
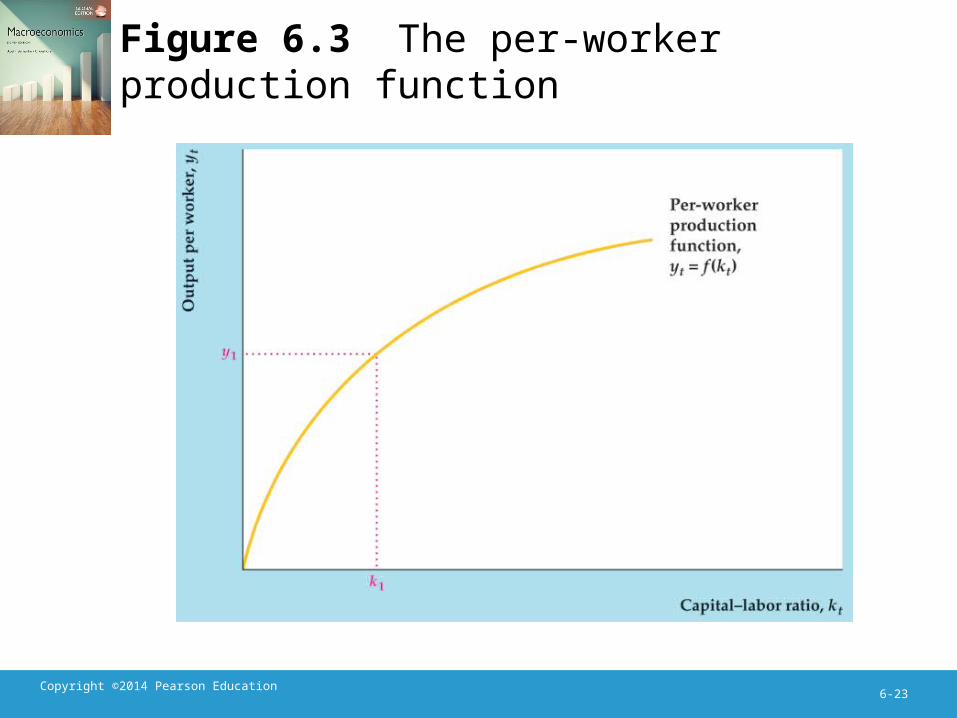
• The per-worker production functionyt f(kt) (6.5)
• Assume no productivity growth for now (add it later)
• Plot of per-worker production function (Fig. 6.3)
• Same shape as aggregate production function
Copyright ©2014 Pearson Education6-23
Figure 6.3 The per-worker production function
Copyright ©2014 Pearson Education6-24
The Solow Model
• Steady states– Steady state: yt, ct, and kt are constant over time
– Gross investment must• Replace worn out capital, dKt
• Expand so the capital stock grows as the economy grows, nKt
It (n d)Kt
(6.6)
Copyright ©2014 Pearson Education6-25
The Solow Model
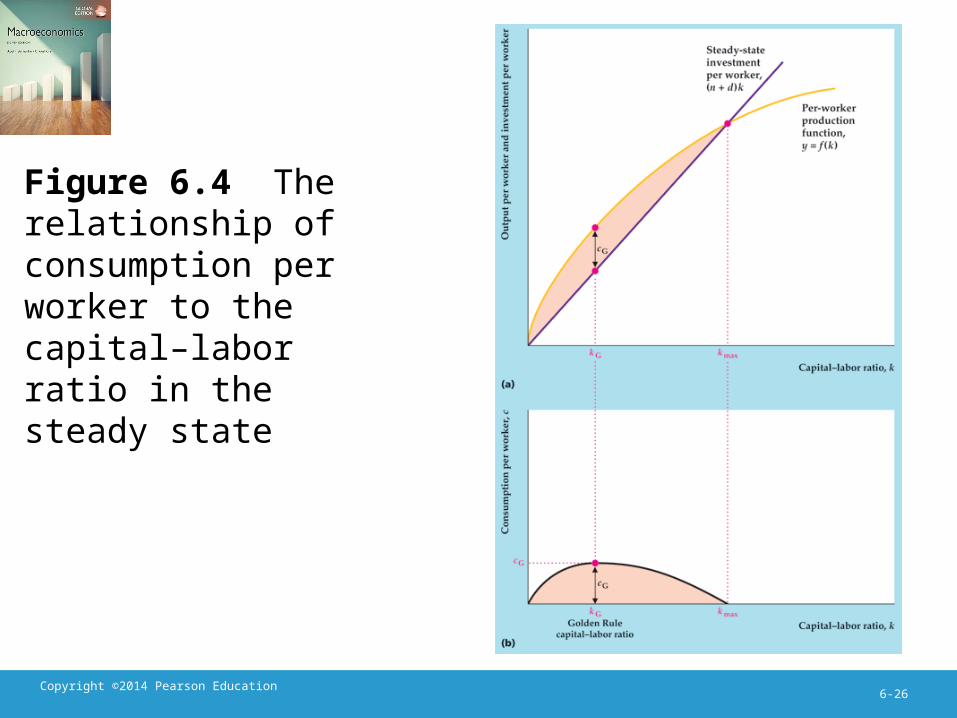
• From Eq. (6.4),Ct Yt – It Yt – (n d)Kt (6.7)
• In per-worker terms, in steady statec f(k)(n d)k
(6.8)• Plot of c, f(k), and (n d)k (Fig. 6.4)
Copyright ©2014 Pearson Education6-26
Figure 6.4 The relationship of consumption per worker to the capital–labor ratio in the steady state
Copyright ©2014 Pearson Education6-27
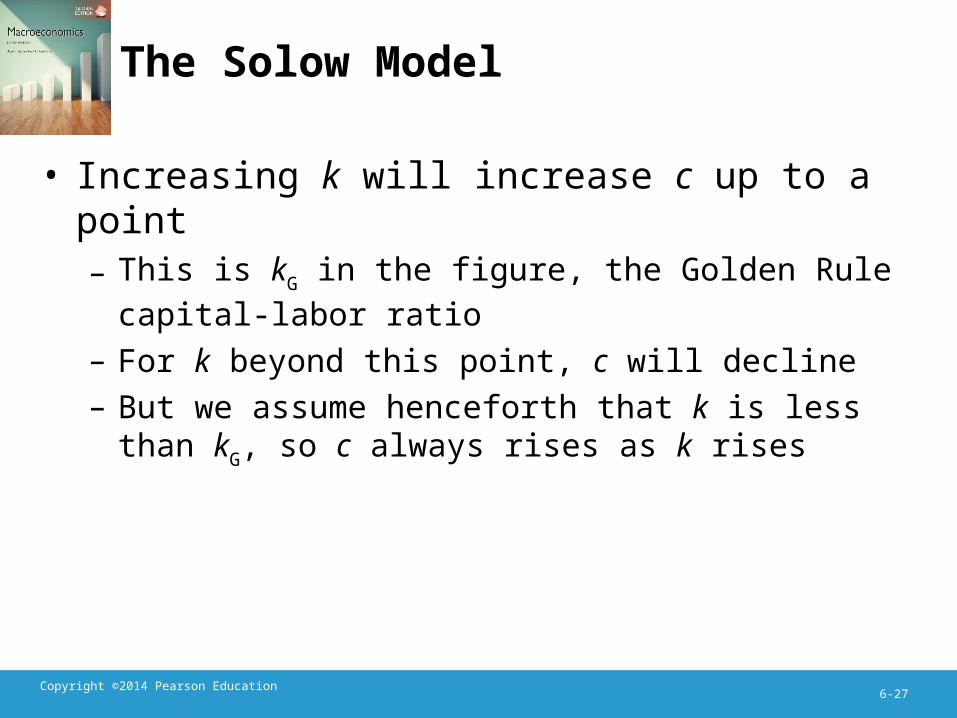
The Solow Model
• Increasing k will increase c up to a point– This is kG in the figure, the Golden Rule capital-labor ratio
– For k beyond this point, c will decline– But we assume henceforth that k is less than kG, so c always rises as k rises
Copyright ©2014 Pearson Education6-28
The Solow Model
• Reaching the steady state– Suppose saving is proportional to current income:
St sYt, (6.9)
where s is the saving rate, which is between 0 and 1
• Equating saving to investment givessYt (n d)Kt
(6.10)
Copyright ©2014 Pearson Education6-29
The Solow Model
• Putting this in per-worker terms gives
sf(k) (n d)k (6.11)
• Plot of sf(k) and (n d)k (Fig. 6.5)
Copyright ©2014 Pearson Education6-30
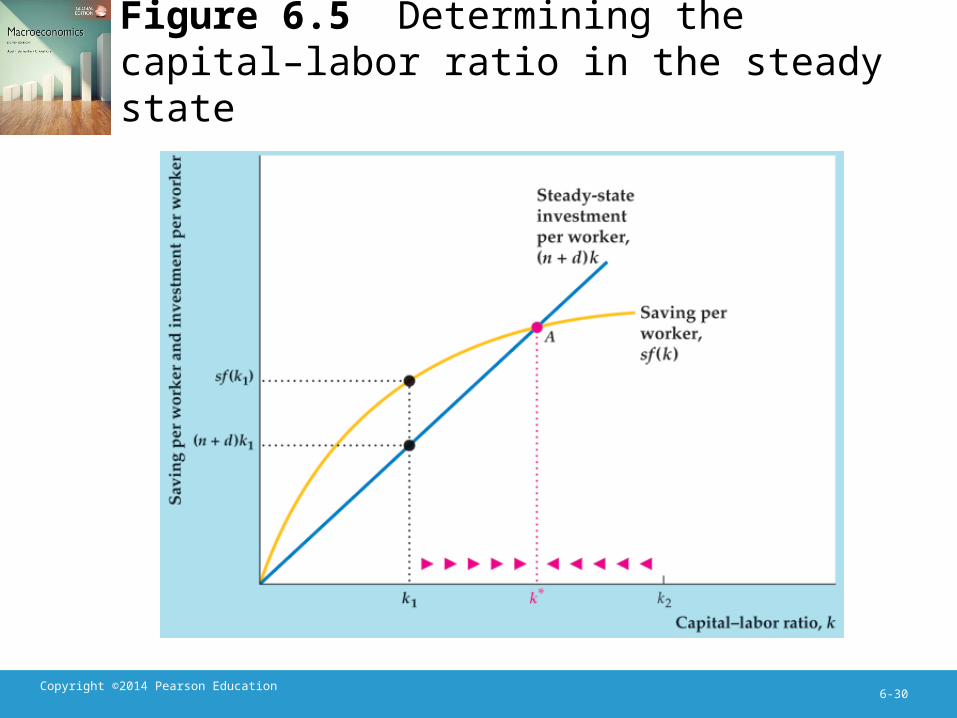
Figure 6.5 Determining the capital–labor ratio in the steady state
Copyright ©2014 Pearson Education6-31
The Solow Model
• The only possible steady-state capital-labor ratio is k*
• Output at that point is y* = f(k*); consumption is c* = f(k*) – (n + d)k*
• If k begins at some level other than k*, it will move toward k*– For k below k*, saving > the amount of investment needed to keep k constant, so k rises
– For k above k*, saving < the amount of investment needed to keep k constant, so k falls
Copyright ©2014 Pearson Education6-32
The Solow Model
• To summarize:With no productivity growth, the economy reaches a steady state, with constant capital-labor ratio, output per worker, and consumption per worker
Copyright ©2014 Pearson Education6-33
The Solow Model
• The fundamental determinants of long-run living standards– The saving rate– Population growth– Productivity growth
Copyright ©2014 Pearson Education6-34
The Solow Model
• The fundamental determinants of long-run living standards
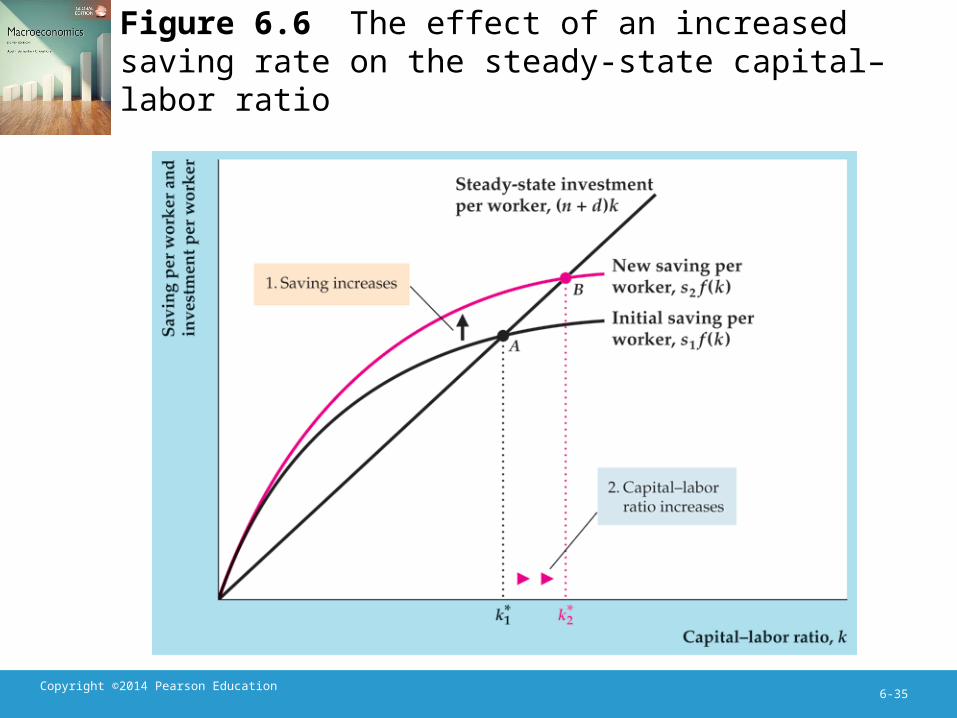
• The saving rate– Higher saving rate means higher capital-labor ratio, higher output per worker, and higher consumption per worker (Fig. 6.6)
Copyright ©2014 Pearson Education6-35
Figure 6.6 The effect of an increased saving rate on the steady-state capital–labor ratio
Copyright ©2014 Pearson Education6-36
The Solow Model
• The fundamental determinants of long-run living standards
• The saving rate– Should a policy goal be to raise the saving rate?• Not necessarily, since the cost is lower consumption in the short run
• There is a trade-off between present and future consumption
Copyright ©2014 Pearson Education6-37
The Solow Model
• The fundamental determinants of long-run living standards– Population growth
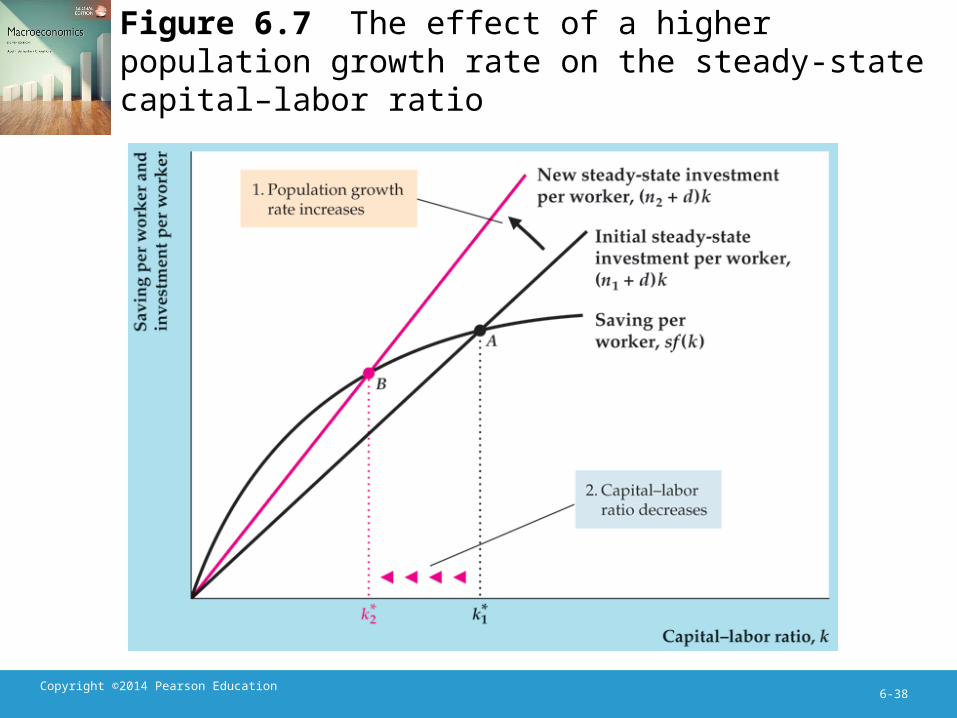
• Higher population growth means a lower capital-labor ratio, lower output per worker, and lower consumption per worker (Fig. 6.7)
Copyright ©2014 Pearson Education6-38
Figure 6.7 The effect of a higher population growth rate on the steady-state capital–labor ratio
Copyright ©2014 Pearson Education6-39
The Solow Model
• The fundamental determinants of long-run living standards– Population growth
• Should a policy goal be to reduce population growth?– Doing so will raise consumption per worker– But it will reduce total output and consumption, affecting a nation’s ability to defend itself or influence world events
Copyright ©2014 Pearson Education6-40
The Solow Model
• The fundamental determinants of long-run living standards– Population growth
• The Solow model also assumes that the proportion of the population of working age is fixed– But when population growth changes dramatically this may not be true
– Changes in cohort sizes may cause problems for social security systems and areas like health care
Copyright ©2014 Pearson Education6-41
The Solow Model
• The fundamental determinants of long-run living standards– Productivity growth
• The key factor in economic growth is productivity improvement
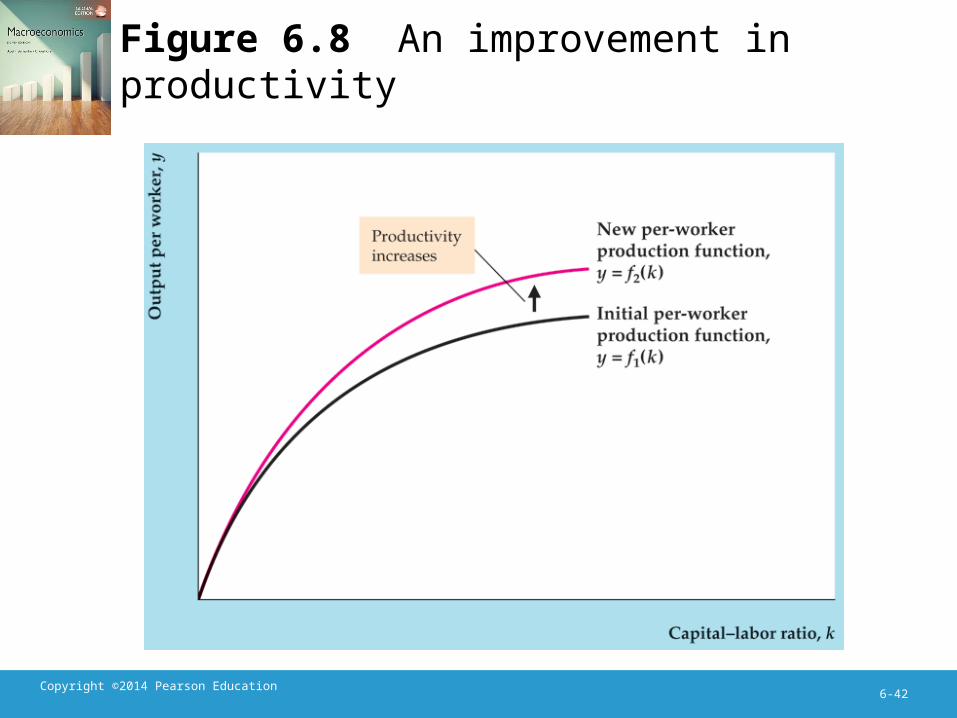
• Productivity improvement raises output per worker for a given level of the capital-labor ratio (Fig. 6.8)
Copyright ©2014 Pearson Education6-42
Figure 6.8 An improvement in productivity
Copyright ©2014 Pearson Education6-43
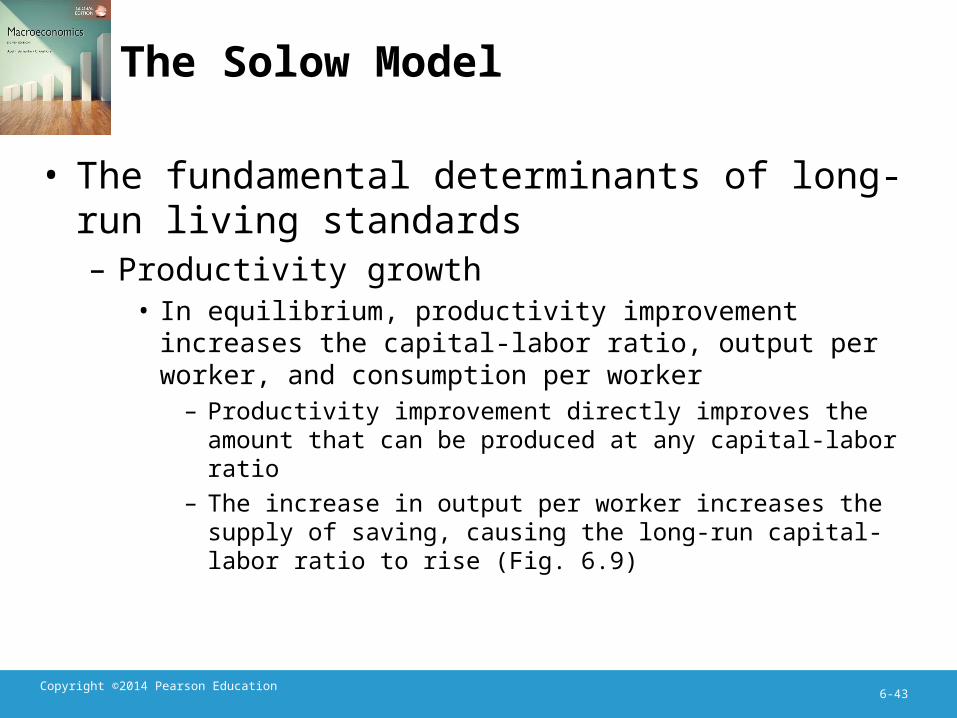
The Solow Model
• The fundamental determinants of long-run living standards– Productivity growth
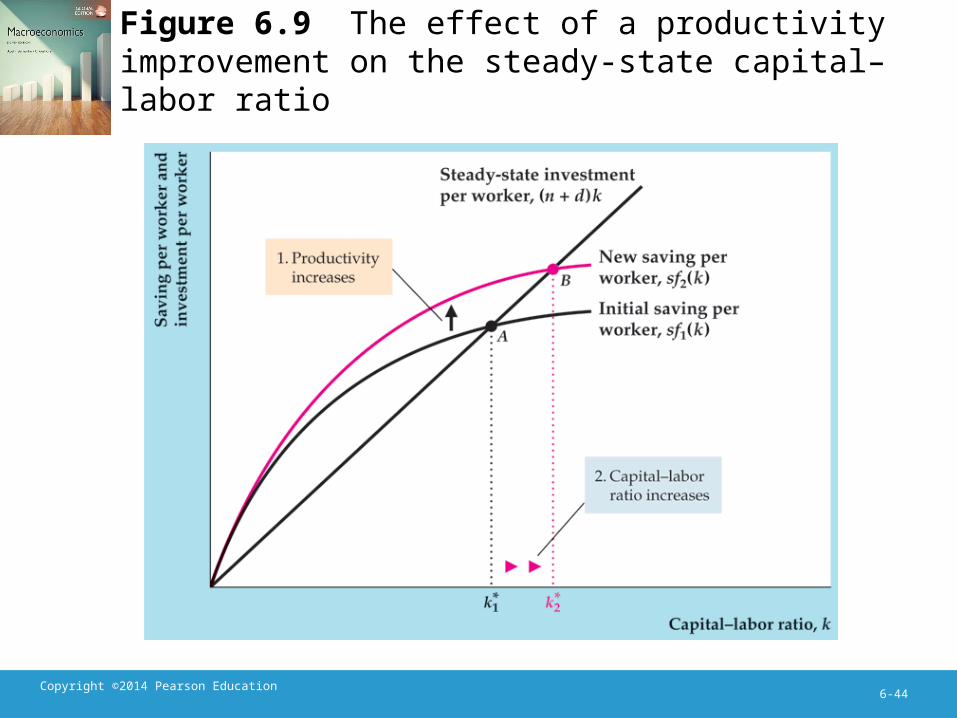
• In equilibrium, productivity improvement increases the capital-labor ratio, output per worker, and consumption per worker– Productivity improvement directly improves the amount that can be produced at any capital-labor ratio
– The increase in output per worker increases the supply of saving, causing the long-run capital-labor ratio to rise (Fig. 6.9)
Copyright ©2014 Pearson Education6-44
Figure 6.9 The effect of a productivity improvement on the steady-state capital–labor ratio
Copyright ©2014 Pearson Education6-45
The Solow Model
• The fundamental determinants of long-run living standards– Productivity growth
• Can consumption per worker grow indefinitely?– The saving rate can’t rise forever (it peaks at 100%) and the population growth rate can’t fall forever
– But productivity and innovation can always occur, so living standards can rise continuously
• Summary: The rate of productivity improvement is the dominant factor determining how quickly living standards rise
Copyright ©2014 Pearson Education6-46
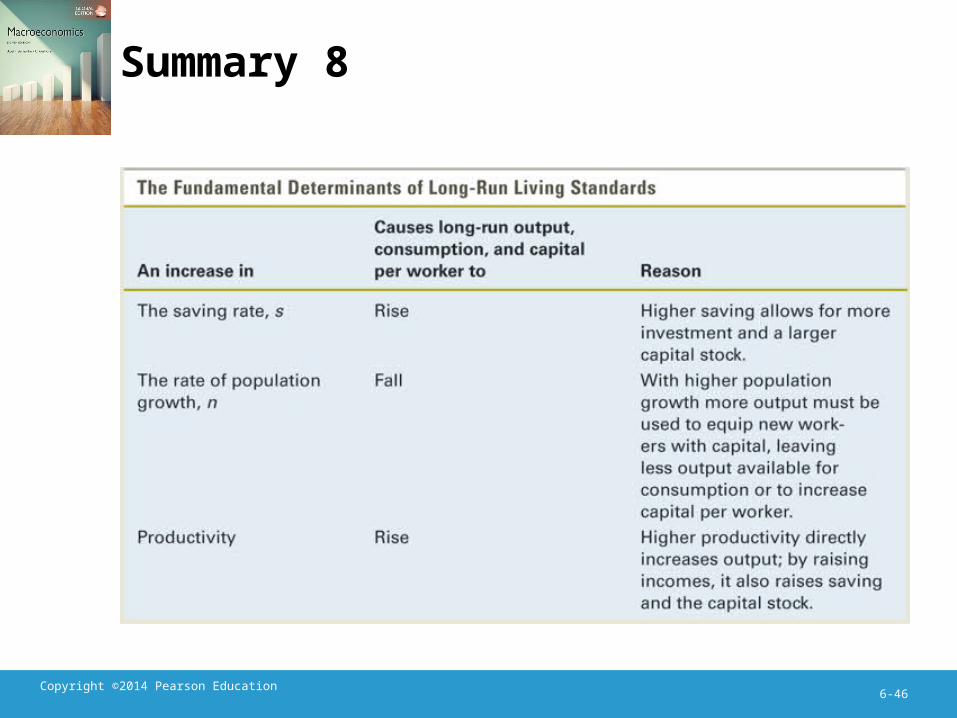
Summary 8
Copyright ©2014 Pearson Education6-47
Application: The growth of China
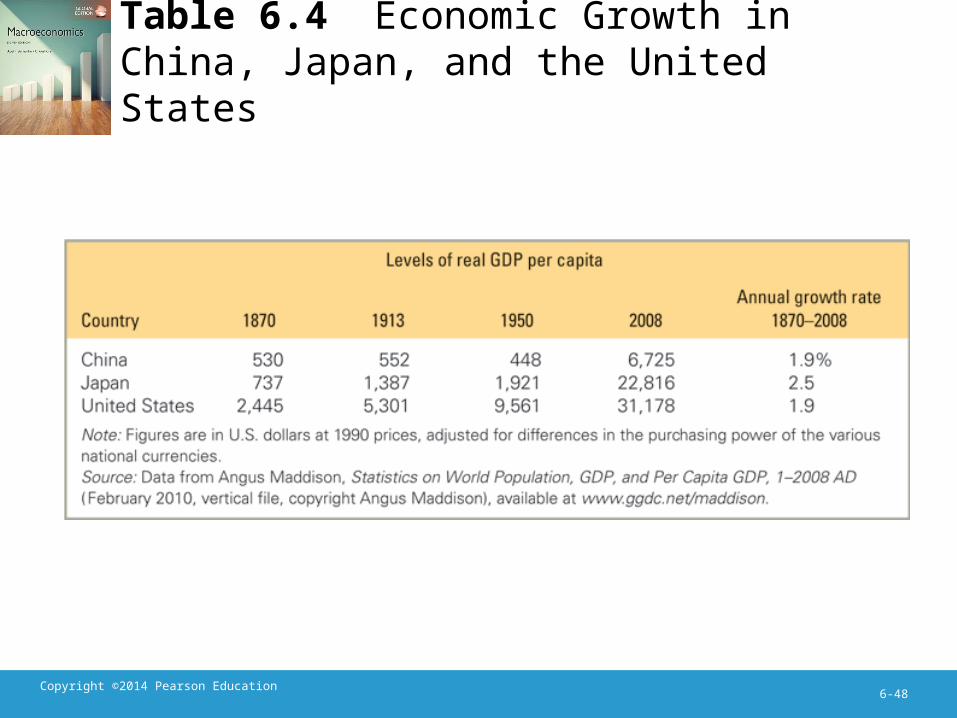
• China is an economic juggernaut• Population 1.4 billion people• Real GDP per capita is low but growing (Table 6.4)
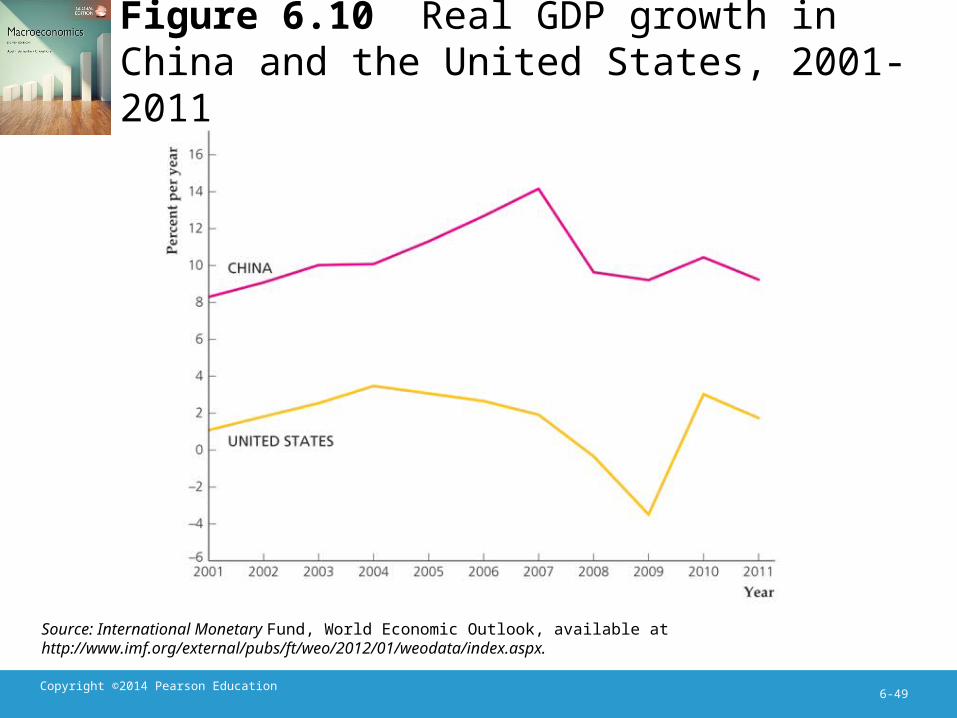
• Starting with low level of GDP, but growing rapidly (Fig. 6.10)
Copyright ©2014 Pearson Education6-48
Table 6.4 Economic Growth in China, Japan, and the United States
Copyright ©2014 Pearson Education6-49
Figure 6.10 Real GDP growth in China and the United States, 2001-2011
Source: International Monetary Fund, World Economic Outlook, available at http://www.imf.org/external/pubs/ft/weo/2012/01/weodata/index.aspx.
Copyright ©2014 Pearson Education6-50
China
• Fast output growth attributable to– Huge increase in capital investment– Fast productivity growth (in part from changing to a market economy)
– Increased trade
Copyright ©2014 Pearson Education6-51
China
• Will China be able to keep growing rapidly?– Rapid growth because of
• use of underemployed resources• using advanced technology developed elsewhere• making transition from centrally-planned economy to market economy
– Such gains may not last – So, it may take China a long time to catch up with the rest of the developed world

Copyright ©2014 Pearson Education6-52
Endogenous Growth Theory
• Endogenous growth theory—explaining the sources of productivity growth– Aggregate production function
Y = AK (6.12)
Copyright ©2014 Pearson Education6-53
Endogenous Growth Theory
• Constant MPK – Human capital
• Knowledge, skills, and training of individuals• Human capital tends to increase in the same proportion as physical capital
– Research and development programs– Increases in capital and output generate increased technical knowledge, which offsets decline in MPK from having more capital
Copyright ©2014 Pearson Education6-54
Endogenous Growth Theory
• Implications of endogenous growth– Suppose saving is a constant fraction of output: S = sAK
– Since investment = net investment + depreciation, I = K + dK
– Setting investment equal to saving implies:
K + dK = sAK (6.13)
Copyright ©2014 Pearson Education6-55
Endogenous Growth Theory
• Implications of endogenous growth• Rearrange (6.13):
K/K = sA – d (6.14)
– Since output is proportional to capital, Y/Y = K/K, so
Y/Y = sA – d (6.15)– Thus the saving rate affects the long-run growth rate (not true in Solow model)

Copyright ©2014 Pearson Education6-56
Endogenous Growth Theory
• Summary– Endogenous growth theory attempts to explain, rather than assume, the economy’s growth rate
– The growth rate depends on many things, such as the saving rate, that can be affected by government policies
Copyright ©2014 Pearson Education6-57
Government Policies to Raise Long-Run Living Standards
• Policies to affect the saving rate– If the private market is efficient, the government shouldn’t try to change the saving rate• The private market’s saving rate represents its trade-off of present for future consumption
• But if tax laws or myopia cause an inefficiently low level of saving, government policy to raise the saving rate may be justified

Copyright ©2014 Pearson Education6-58
Government Policies to Raise Long-Run Living Standards
• Policies to affect the saving rate– How can saving be increased?
• One way is to raise the real interest rate to encourage saving; but the response of saving to changes in the real interest rate seems to be small

Copyright ©2014 Pearson Education6-59
Government Policies to Raise Long-Run Living Standards
• Policies to affect the saving rate– How can saving be increased?
• Another way is to increase government saving– The government could reduce the deficit or run a surplus
– But under Ricardian equivalence, tax increases to reduce the deficit won’t affect national saving

Copyright ©2014 Pearson Education6-60
Government Policies to Raise Long-Run Living Standards
• Policies to raise the rate of productivity growth– Improving infrastructure
• Infrastructure: highways, bridges, utilities, dams, airports
• Empirical studies suggest a link between infrastructure and productivity
• U.S. infrastructure spending has declined in the last two decades

Copyright ©2014 Pearson Education6-61
Government Policies to Raise Long-Run Living Standards
• Policies to raise the rate of productivity growth– Improving infrastructure
• Would increased infrastructure spending increase productivity?– There might be reverse causation: Richer countries with higher productivity spend more on infrastructure, rather than vice versa
– Infrastructure investments by government may be inefficient, since politics, not economic efficiency, is often the main determinant

Copyright ©2014 Pearson Education6-62
Government Policies to Raise Long-Run Living Standards
• Policies to raise the rate of productivity growth– Building human capital
• There’s a strong connection between productivity and human capital
• Government can encourage human capital formation through educational policies, worker training and relocation programs, and health programs
• Another form of human capital is entrepreneurial skill
• Government could help by removing barriers like red tape

Copyright ©2014 Pearson Education6-63
Government Policies to Raise Long-Run Living Standards
• Policies to raise the rate of productivity growth– Encouraging research and development
• Support scientific research• Fund government research facilities• Provide grants to researchers• Contract for particular projects• Give tax incentives• Provide support for science education