chapter 3 - paved road cracking and rut depth analysis
TRANSCRIPT

CHAPTER 3 - PAVED ROAD CRACKING AND RUT DEPTH ANALYSIS
Digitised by the University of Pretoria, Library Services, 2012

Digitised by the University of Pretoria, Library Services, 2012

25 3 • 1 INTRODUCTION
A considerable amount of public money is spent on pavement
maintenance every year, as pavements deteriorate over time due to
traffic loading and climatic factors. For efficient use of mainte
nance resources, it is necessary to estimate the future condition or
serviceability level of the different pavement sections in a specific
network. Such an estimate is only possible if the pavement engineer
or planner has reliable predictive models available. Moreover, dis
tress prediction models are essential technological tools in the anal
ysis of alternative pavement design strategies.
This chapter presents the results of analysis performed on
data collected on pavement cracking and rutting, with the objective
of developing empirical prediction models for these two types of dis
tress manifestations. Quantitative information on pavement cracking
and rutting is obtained from condition surveys, which are mechanistic
measurements of distress. It should be clear that the prediction
models developed can be only used for estimating pavement distress in
a way compatible with the measurement system used in the field.
3. 2 ANALYSIS OF PAVEMENT CRACKING
The approach for studying pavement cracking was to monitor
the percent area cracked at selected test locations on existing
roads. Detailed information developed to characterize each test
location included traffic loads and volumes, pavement structural
number, Benkelman beam and Dynaflect deflections.
The cracking variable used in this analysis is defined as
the percent of the pavement's total area which shows Class 2 to 4
cracks or potholes. Class 1 cracks, which have widths of less than
1 mm and are normally called hairline cracks, were not included in
the percent calculation because they are not readily identifiable in
the field, and their measurement depends, to a great extent, on
the observer's judgement and weather conditions. Additionally, hair
line cracks can result from poor rolling of asphalt mixtures during
construction and, in this case, their prediction as a function of
Digitised by the University of Pretoria, Library Services, 2012

26
pavement strength and traffic loadings is meaningless.
Another reason for not including hairline cracks in the
computation of the cracking variable is that this type of cracking
would hardly ever warrant any pavement maintenance response. More
over, Class 1 cracks were not included in the cracking term used to
estimate serviceability at the AASHO Road Test (HRB. 1962). There
fore, it seems appropriate to quantify a cracking variable as previ
ously defined.
V e r y f e w o f t h e s u r fa c e t r e a t me n t s e c t i o n s e x h i b i t e d c r a c k s.
Consequently, test sections with this type of surfacing were not in
cluded in the analysis of pavement cracking.
3. 2. 1
Observation of the data indicated that it may take a pave
ment several years to show the first crack, but after the initial
cracks appear, the deterioration process is relatively fast. There
fore, it was considered necessary to develop two types of models: one
to predict when cracks first appear and the other to predict how fast
crack s progress in a specified pavement. The analyses corresponding
to these models are called, respectively, crack initiation and crack
progression analysis.
Th e need for these two types of models was identified by
Finn (1973) who stated that, to be helpful to the highway engineer,
the o ut put variable of cracking as predicted from research should in
clude not only some estimate of initial cracking, but also the rate
of progression of cracking with time.
3. 2 . 2 CJLacf<. I nA...:tA..a.:tA..o n
The dependent variable used in this part of the analysis is
the number of equivalent axles supported by the pavement to first
crack. The inference space is governed by the ran ges of the dependent
and independent variables which are listed in Table 3.1. As the ob
jective of this part of the study was to predict when cracks first
app e ar, only test sections which showed their first crack during the
Digitised by the University of Pretoria, Library Services, 2012
27
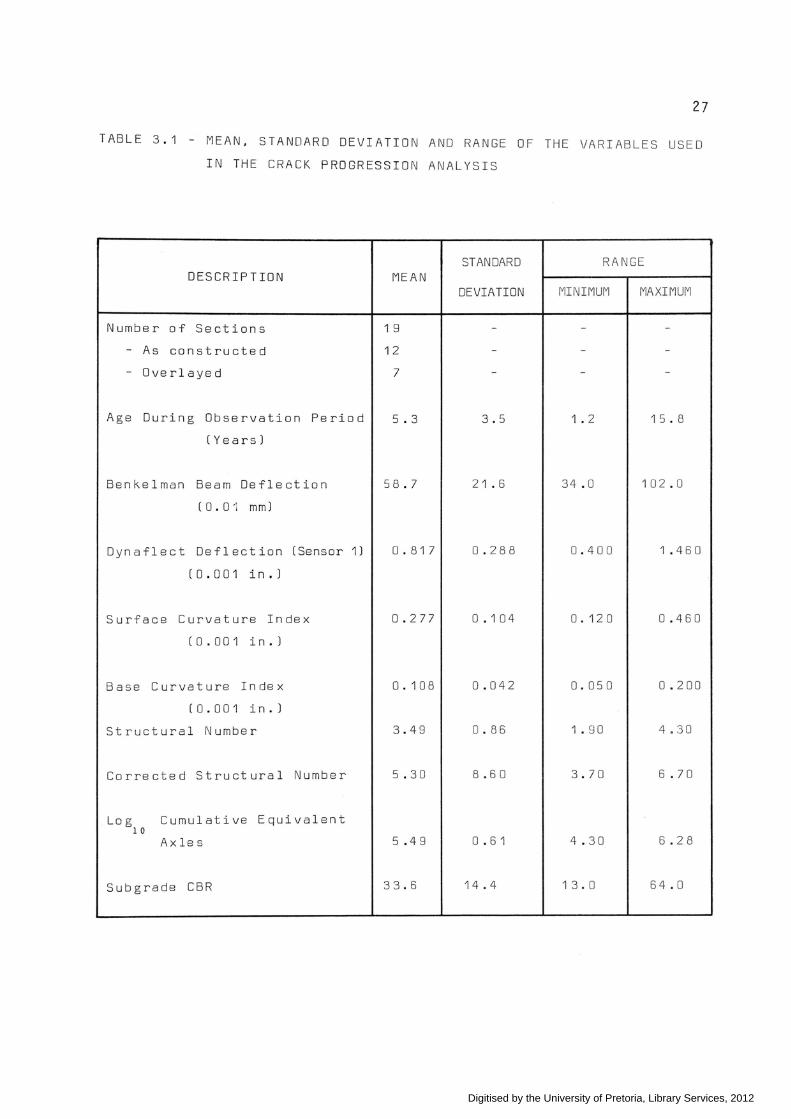
TABLE 3.1 - MEAN, STANDARD DEVIATION AND RANGE OF THE VARIABLES USED
IN THE CRACK PROGRESSION ANALYSIS
STANDARD RANGE DESCRIPTION MEAN
DEVIATION MINIMUM MAXIMUM
Number of Sections 1 9 - - -
- As constructed 1 2 - - -
- Overlayed 7 - - -
Age During Observation Period 5.3 3.5 1 . 2 1 5 . 8
(Years)
Benkelman Beam Deflection 58. 7 21 . 6 34. 0 1 0 2. 0
( 0. 0 'l mm)
Dynaflect Deflect ion (Sensor 1) 0. 81 7 0.288 0.400 1 . 4 6 0
(0.001 in . )
Surface Curvature Index 0.277 0 . 1 0 4 0. 12 0 0.460
( 0 . 0 0 1 in.)
Base Curvature Index 0. 1 0 8 0. 0 4 2 0.050 0. 2 00
( 0. 0 01 in. )
Structural Number 3.49 0.86 1.90 4. 3 0
Corrected Structural Number 5.30 8. 6 0 3.70 6 . 7 0
Log Cumulative Equivalent 1 0
Axles 5. 4 9 0 . 6 1 4.30 6.28
Subgrade CBR 3 3. 6 14.4 1 3. 0 64.0
Digitised by the University of Pretoria, Library Services, 2012

28
study period were used. The correlation matrix of variables included
in the analysis is given in Table 3.2.
A number of functional relationships were investigated
through regression analysis. The model found to best fit the data is:
where
LN 1.205 + 5.96 log SNC
LN logarithm to the base 1 0 of the number of
equivalent axles to first crack;
SNC corrected structural number; and
log logarithm to base 10.
( 3 . 1 )
Equation 3.1 has a correlation coefficient squared of 0.52,
a standard error for residuals of 0.44. and is based on a sample size
of 19. Other statistical results pertaining tc: this equation are given
in Table 3.3. The approximate 95 percent confidence interval is:
CI LN ± 0.95 or 0.11N to 8.9N
As described in Chapter 2, several groups of independent
varia b les were used in the analysis. However, no acceptable regres-
s ion equation could be developed with independent variables other
than corrected structural number. It is expected that test sections
which have not s hown any cracking - and therefore not included in
t h i s a n a 1 y s i s - w i 11 en han ce t h e i n f e r e n c e s p a c e for f u t u r e a n a 1 y s e s .
This may make it pos s ible to obtain reasonable models for the other
combinations of independent variables.
3. 2. 3
Two different dependent variables were used in this part of
the analysis:
Digitised by the University of Pretoria, Library Services, 2012

TABLE 3.2 - CORRELATION MATRIX OF VARIABLES INCLUDED IN THE CRACK
INITIATION ANALYSIS
Variable SNC B 0 AGE
SNC 1 . 0 0 -.64 -. 6 5 . 1 8
B 1 . 0 0 . 7 8 -.24
0 1 . 0 0 -.27
AGE 1.00
LN
TABLE 3.3 - REGRESSION ANALYSIS RESULTS FOR EQUATION 3.1
a) Analysis of Variance
Degrees Sum Mean of of Square Freedom Square
Regression 1 3.474 3.474
Residual 1 7 3.229 0. 1 9 0
b) Regression Equation
Estimate Standard Parameter Error
Intercept 1 . 2 0 5
LSNC 5.963
Correlation coefficient squared
Standard error for residuals
-
1. 394
0. 51 8
0.436
F Ratio
18. 2 9
-
F-Value
-
18.29
LN
. 7 2
-.26
-.26
.44
1 . 0 0
29
Digitised by the University of Pretoria, Library Services, 2012

30
a) the percentage area cracked at a specified
pavement age; and
b) the age when the percent of area cracked reaches
a specified value.
Models developed for the first dependent variable are us e
ful, for example, when the engineer wants to predict the cracking
condition of a pavement t years from now, if no maintenance is ap
plied to the pavement. The resulting numbers could indicate the
need to request addit~onal funds for certain projects in the road
network.
An e x ample of application of models developed for the
se co nd dependent variable is the estimation of the time at which a
pavement cracking condition will reach a limiting value, at which
rehabilitation is necessary. Limiting values for this condition
depend on a number of factors, including the highway function,
resources available ·and local practice. Limiting values suggested by
dif e rent researchers fall in a wide range of 5 to 35 percent, the
average approa c hing 15 percent (Queiroz, 198la, p. 119).
The inference space in the crack progression analysis is
gov e rn e d b y the ranges of the dependent and independent variables
which are listed in Table 3.4. The correlation matrix of a select
s ub se t o f variables included in the analysis is given in Tabl~ 3.5.
A number of functional relationships were investigated in
or de r t o dev elop models t o predict the amount of pavement cracking.
Th e three models wh i ch to best fit the data are:
1. Independent variables include Benkelman beam
deflections
CR 18.53 + 0.0456 B x LN + 0.00501 8 x AG~ x LN
R squared
Standard error
Cl = CR + 25.28
0.644
12.616
( 3. 2)
Digitised by the University of Pretoria, Library Services, 2012

31
TABLE 3.4 - MEAN. STANDARD DEVIATION AND RANGE OF THE VARIABLES USED
IN THE CRACK PROGRESSION ANALYSIS
STANDARD RANGE DESCRIPTION MEAN
DEVIATION MINIMUM MAXIMUM
Number of Sections 28 - - -
- As Constructed 1 8 - - -
- Overlayed 1 0 - - -
Age During Observation Period 7.63 4.82 1 . 2 20 .7
(Years)
Ben k el man Beam Deflection 63.8 27.0 34.0 1 32. 0
( 0 . 0 1 mm)
Dynaflect Deflection (Sensor 1) 0. 7 80 0.236 0.40 1 . 4 6
(0.001 in. )
Surface Curvature Index 0. 26 9 0.094 0. 11 0. 4 6
(0.001 in.)
Base Curvature Inde x 0. 1 0 8 0. 0 34 0.05 0.20
( 0 . 0 01 in . )
Structural Number 3.76 0. 91 1 . 9 0 6.50
Corrected Structural Number 5 . 55 0.79 3.70 7.50
Log Cumulative Equivalent 1 0
Axles 5. 7 5 0.64 4. 30 7. 2 7
Subgrade CBR 33.2 1 2. 8 1 3. 0 64.0
Percentage of Are a Cracked 1 2 . 50 2 0. 86 0.00 83.75
Digitised by the University of Pretoria, Library Services, 2012
32
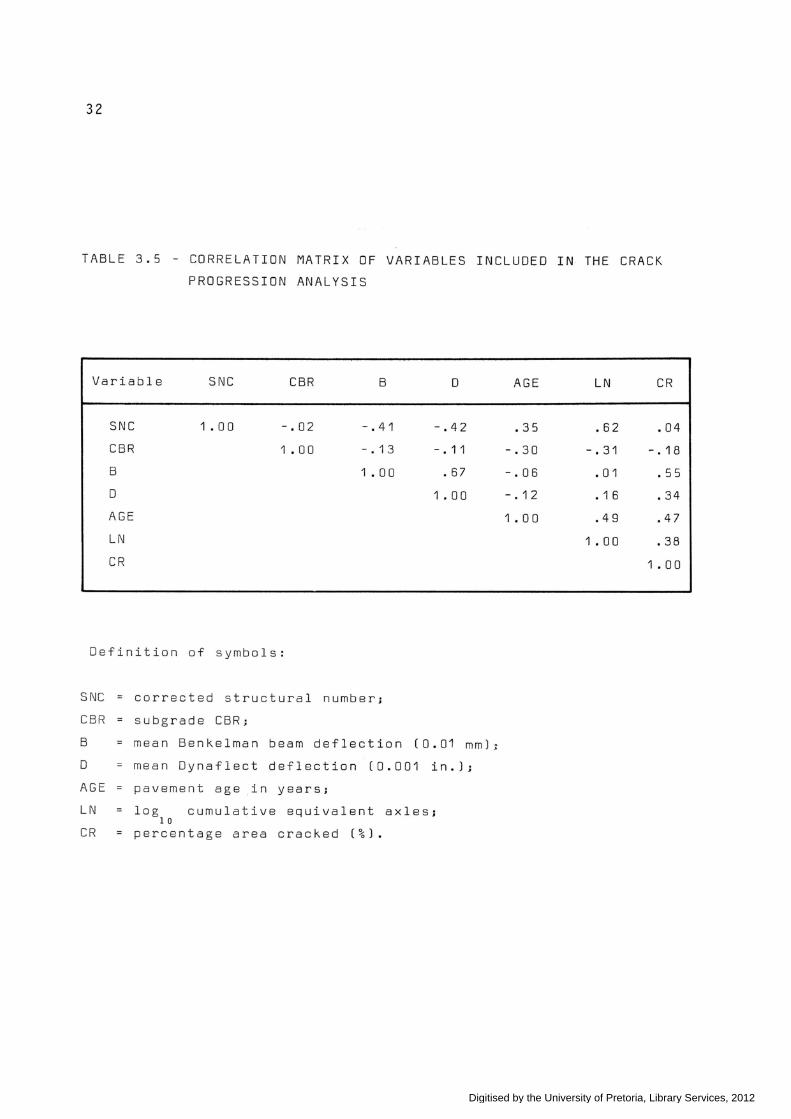
TABLE 3.5 - CORRELATION MATRIX OF VARIABLES INCLUDED IN THE CRACK
PROGRESSION ANALYSIS
Variable SNC CBR B D AGE LN CR
SNC 1 . 0 0 -.02 -. 41 -.42 . 3 5 . 62 .04
CBR 1 . 0 0 -. 1 3 -. 11 -.30 -. 31 -. 18
B 1 . 0 0 . 67 -.06 • 0 1 . 55
D 1 . 0 0 -. 1 2 . 1 6 .34
AGE 1. 0 0 . 4 9 . 4 7
LN 1 . 0 0 .38
CR 1 . 0 0
Definition of symbols:
SNC corrected structural number;
CBR subgrade CBR;
B mean Benkelman beam deflection (0.01 mm);
D mean Dynaflect deflection (0.001 in.);
AGE pavement age in years;
LN log cumulative equivalent axles; 1 0
CR percentage area cracked (%).
Digitised by the University of Pretoria, Library Services, 2012

where
CR - 14.10 + 2.84 0 X LN + 0.395 0 X AGE X LN
R squared
Standard error
CI = CR ± 31.74
0.439
15.843
3. Independent variables include corrected structural
number
CR - 57.7 + 53.5 LN/SNC + 0.313 AGE x LN
R squared
Standard error
CI = CR ± 34.31
0.345
17.120
CR percentage area cracked;
B mean Benkelman deflection (0.01 mm);
LN logarithm to the base 10 of the numbe..r of
cumulative equivalent axles;
AGE pavement age since construction or overlay
(years);
0
SNC
CI
mean Dynaflect deflection (0.001 in.);
corrected structural number; and
approximate 95 percent confidence interval.
33
( 3. 3)
( 3. 4)
Detailed regression results pertaining to Equation 3.2 to 3.4 are
given in Tables 3.6 to 3.8, respectively. Stability of the regres
sion coefficients was examined through ridge analysis. The corre
sponding ridge traces showed that the three equations developed have
very high stability. It was not possible to obtain acceptable re
gression equations (in terms of statistical significance and stabil~
ty of coefficients) involving other groups of independent variables.
Digitised by the University of Pretoria, Library Services, 2012
34
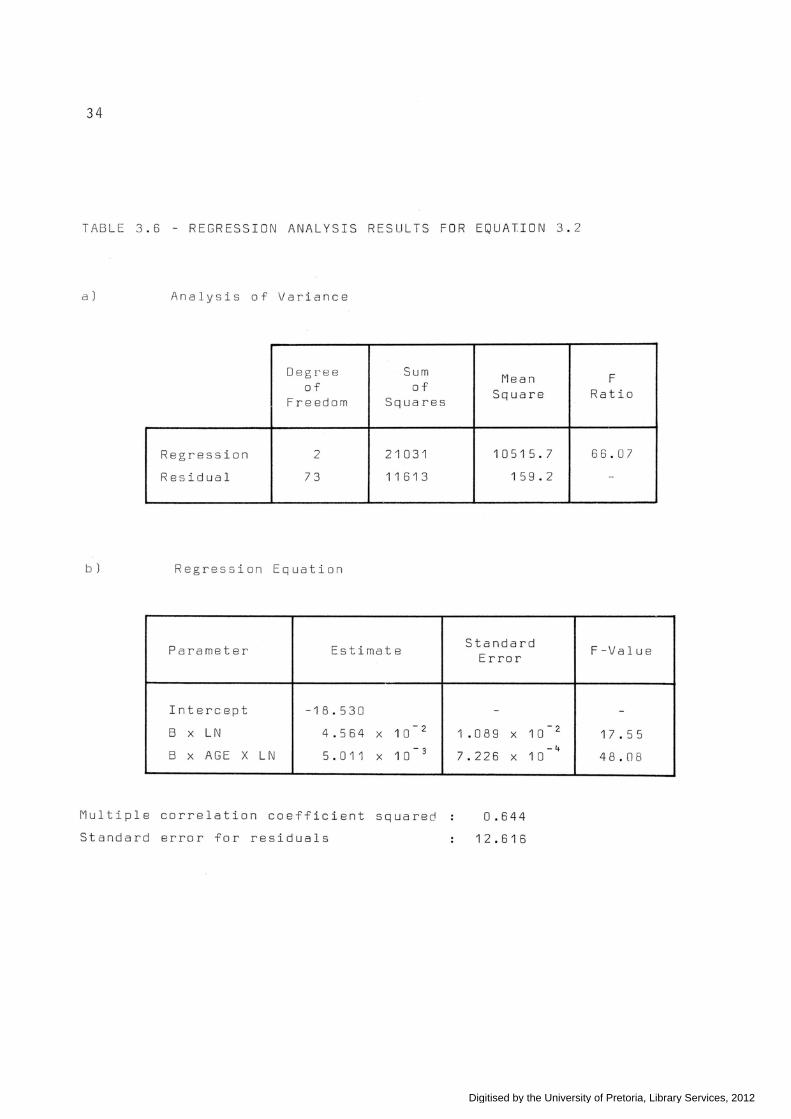
TAB LE 3 .6 - REGRESSION ANALYSIS RESULTS FOR EQUATION 3.2
a ) Analy s is of Va riance
Oegr~ee Sum of of
Freedom Squares
Regre s sion 2 21031
Residual 73 11 61 3
b) Regre ss ion Equation
Parameter Estimate
Intercept -18.530
8 X LN 4.564 X 10- 2
8 X AGE X LN 5. 0 11 X 1 0- 3
Multiple correlation coefficient squared
Standard error for residuals
Mean Square
10515.7
159.2
Standard Error
-
1 . 0 8 9 X
7.226 X
0.644
12.616
1 0- 2
-4 1 0
F Ratio
66.07
--
F-Value
-
1 7 . 55
48.0 8
Digitised by the University of Pretoria, Library Services, 2012

TABLE 3.7 - REGRESSION ANALYSIS RESULTS FOR EQUATION 3.3
a) Analysis of Variance
Degrees Sum of of
Freedom SquareS.
Regression 2 14328
Residual 73 18322
b) Regression Equation
Parameter Estimate
Intercept -14.105
0 X LN 2.843
0 X AGE X LN 0.3948
Multiple correlation coefficient squared
Standard error for residuals
Mean Square
7164.2
2 51 . 0
Standard Error
-
1 . 2 7 8
0.0684
0.439
15.843
F Ratio
28.54
-
F-Value
-
4.95
33.28
35
Digitised by the University of Pretoria, Library Services, 2012