verification of rut depth collected with the ino laser rut ... library... · verification of rut...
TRANSCRIPT

Verification of Rut Depth Collected with the INO Laser Rut Measurement System (LRMS)
Bradley R. Hoffman and Shad M. Sargand
Prepared in cooperation with
The Ohio Department of Transportation
And the U.S. Department of Transporation,
Federal Highway Administration
Student Study Report No. FHWA/OH-2011/18
State Job No. 134515
October 2011
Ohio Research Institute for Transportation and the Environment


1. Report No. FHWA/OH-2011/18
2. Government Accession No.
3. Recipient’s Catalog No.
4. Title and Subtitle Verification of Rut Depth Collected with the INO Laser Rut Measurement System (LRMS)
5. Report Date October 28, 2011
6. Performing Organization Code
7. Author(s) Bradley R. Hoffman, Shad M. Sargand
8. Performing Organization Report No.
9. Performing Organization Name and Address Ohio Research Institute for Transportation and the Environment (ORITE) 141 Stocker Center Ohio University Athens OH 45701-2979
10. Work Unit No. (TRAIS)
11. Contract or Grant No. SJN: 134515 Agreement No. 23585
12. Sponsoring Agency Name and Address Ohio Department of Transportation Innovation, Research, and Implementation Section 1980 West Broad St. Columbus OH 43223
13. Type of Report and Period Covered Student Study
14. Sponsoring Agency Code
15. Supplementary Notes 16. Abstract Pavement rutting can be an indicator that a section of roadway is in need of repair or replacement. It can also become a hazard to drivers, causing loss of control or hydroplaning when water accumulates. To better monitor pavement conditions throughout the state, the Ohio Department of Transportation (ODOT) purchased two road profilers with INO Laser Rut Measurement Systems (LRMS). The vehicle mounted systems provide ODOT pavement condition raters with a faster and safer method for evaluating pavement conditions. This study was intended to evaluate the accuracy, precision, and repeatability of the LRMS system and determine the correlation between manually collected data and data collected using the LRMS. The system’s performance was evaluated by collecting rut measurements over two sections of pavement using the LRMS, the straight edge method, and a mechanical profiling system developed by the Ohio Research Institute for Transportation and the Environment (ORITE) and comparing results. The study showed that the LRMS produces accurate and repeatable results that are similar to those produced with a straight edge or profilometer. Minor adjustments to the Pavement Condition Rating (PCR) system are needed, however, to ensure that scores properly represent the condition of the pavement. A range of 5-25% is recommended for the “occasional” extent classification when the LRMS is used.
17. Key Words Pavement rut measurement, Laser Rut Measurement Systems (LRMS), Pavement Condition Rating (PCR)
18. Distribution Statement No restrictions. This document is available to the public through the National Technical Information Service, Springfield, Virginia 22161
19. Security Classif. (of this report) Unclassified
20. Security Classif. (of this page) Unclassified
21. No. of Pages 80
22. Price
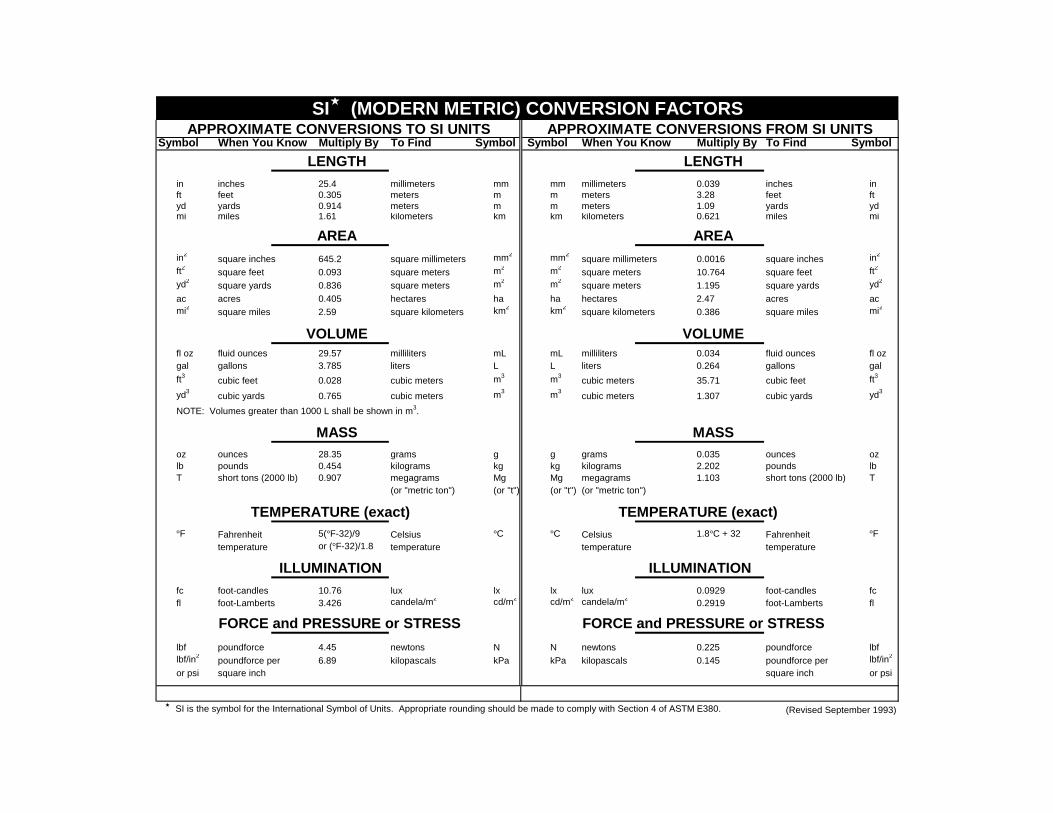
Symbol When You Know Multiply By To Find Symbol Symbol When You Know Multiply By To Find Symbol
in inches 25.4 millimeters mm mm millimeters 0.039 inches inft feet 0.305 meters m m meters 3.28 feet ftyd yards 0.914 meters m m meters 1.09 yards ydmi miles 1.61 kilometers km km kilometers 0.621 miles mi
in2square inches 645.2 square millimeters mm2 mm2
square millimeters 0.0016 square inches in2
ft2 square feet 0.093 square meters m2 m2square meters 10.764 square feet ft2
yd2square yards 0.836 square meters m2 m2
square meters 1.195 square yards yd2
ac acres 0.405 hectares ha ha hectares 2.47 acres acmi2 square miles 2.59 square kilometers km2 km2
square kilometers 0.386 square miles mi2
fl oz fluid ounces 29.57 milliliters mL mL milliliters 0.034 fluid ounces fl ozgal gallons 3.785 liters L L liters 0.264 gallons gal
ft3 cubic feet 0.028 cubic meters m3 m3cubic meters 35.71 cubic feet ft3
yd3cubic yards 0.765 cubic meters m3 m3
cubic meters 1.307 cubic yards yd3
NOTE: Volumes greater than 1000 L shall be shown in m3.
oz ounces 28.35 grams g g grams 0.035 ounces ozlb pounds 0.454 kilograms kg kg kilograms 2.202 pounds lbT short tons (2000 lb) 0.907 megagrams Mg Mg megagrams 1.103 short tons (2000 lb) T
(or "metric ton") (or "t") (or "t") (or "metric ton")
°F Fahrenheit 5(°F-32)/9 Celsius °C °C Celsius 1.8°C + 32 Fahrenheit °F
temperature or (°F-32)/1.8 temperature temperature temperature
fc foot-candles 10.76 lux lx lx lux 0.0929 foot-candles fcfl foot-Lamberts 3.426 candela/m2 cd/m2 cd/m2 candela/m2
0.2919 foot-Lamberts fl
FORCE and PRESSURE or STRESS FORCE and PRESSURE or STRESS
lbf poundforce 4.45 newtons N N newtons 0.225 poundforce lbflbf/in2
poundforce per 6.89 kilopascals kPa kPa kilopascals 0.145 poundforce per lbf/in2
or psi square inch square inch or psi
SI is the symbol for the International Symbol of Units. Appropriate rounding should be made to comply with Section 4 of ASTM E380. (Revised September 1993)
SI (MODERN METRIC) CONVERSION FACTORSAPPROXIMATE CONVERSIONS TO SI UNITS APPROXIMATE CONVERSIONS FROM SI UNITS
LENGTH LENGTH
AREA AREA
VOLUME VOLUME
ILLUMINATION ILLUMINATION
MASS MASS
TEMPERATURE (exact) TEMPERATURE (exact)

Verification of Rut Depth Collected with the INO Laser Rut Measurement System (LRMS)
Prepared in cooperation with the Ohio Department of Transportation
Prepared by
Bradley R. Hoffman and Shad M. Sargand
Ohio Research Institute for Transportation and the Environment Russ College of Engineering and Technology
Ohio University Athens, Ohio 45701-2979
The contents of this report reflect the views of the authors who are responsible for the facts and the accuracy of the data presented herein. The contents do not necessarily reflect the official views or policies of the Ohio Department of Transportation or the Federal Highway Administration. This report does not constitute a standard, specification or regulation.
Submitted October 28, 2011

iv
Acknowledgements There are several Ohio University faculty and graduate students that assisted with this project and deserve acknowledgement. Dr. Shad Sargand, Russ Professor of civil engineering, provided support and guidance throughout the project and Dr. Deborah McAvoy, assistant professor of civil engineering, assisted with the statistical analysis. Mike Krumlauf of ORITE, and graduate students Drew Hatton and Ben Jordan helped with research equipment and provided field support. Wally Richardson offered his expertise with the profilometer system and calibrated it just prior to its use in this study. There are a number of people from ODOT that were essential to this project. Roger Green, Dan Radanovich, and Cynthia Gerst are gratefully acknowledged for their contributions.
v
Table of Contents 1 Introduction ............................................................................................................................. 1
1.1 Problem statement ............................................................................................................ 1 1.2 Objectives ......................................................................................................................... 1
2 Review of literature and equipment ........................................................................................ 3 2.1 Straight edge and dial gage (S&G) .................................................................................. 3 2.2 Profilometer ...................................................................................................................... 3 2.3 Laser rut measurement system ......................................................................................... 6 2.4 Rut depth algorithms ........................................................................................................ 8
2.4.1 Straight edge model .................................................................................................. 8 2.4.2 Wire model................................................................................................................ 8 2.4.3 Pseudo-rut model ...................................................................................................... 9
3 Verification of the LRMS system ......................................................................................... 10 3.1 Experimental procedure ................................................................................................. 10
3.1.1 Localized heavy use/severe rutting on US-30 ........................................................ 10 3.1.2 Light use/medium rutting on SR-682 ..................................................................... 11
3.2 Results ............................................................................................................................ 14 3.2.1 Localized heavy use/severe rutting on US-30 ........................................................ 14 3.2.2 Light use/medium rutting on SR-682 ..................................................................... 19
3.3 Discussion ...................................................................................................................... 27 4 LRMS and the ODOT pavement condition rating system .................................................... 30
4.1 Procedure ........................................................................................................................ 30 4.2 Results and discussion of comparison with S&G PCR ratings ...................................... 33
5 Summary and conclusions .................................................................................................... 36 5.1 Summary ........................................................................................................................ 36 5.2 Recommendations .......................................................................................................... 37
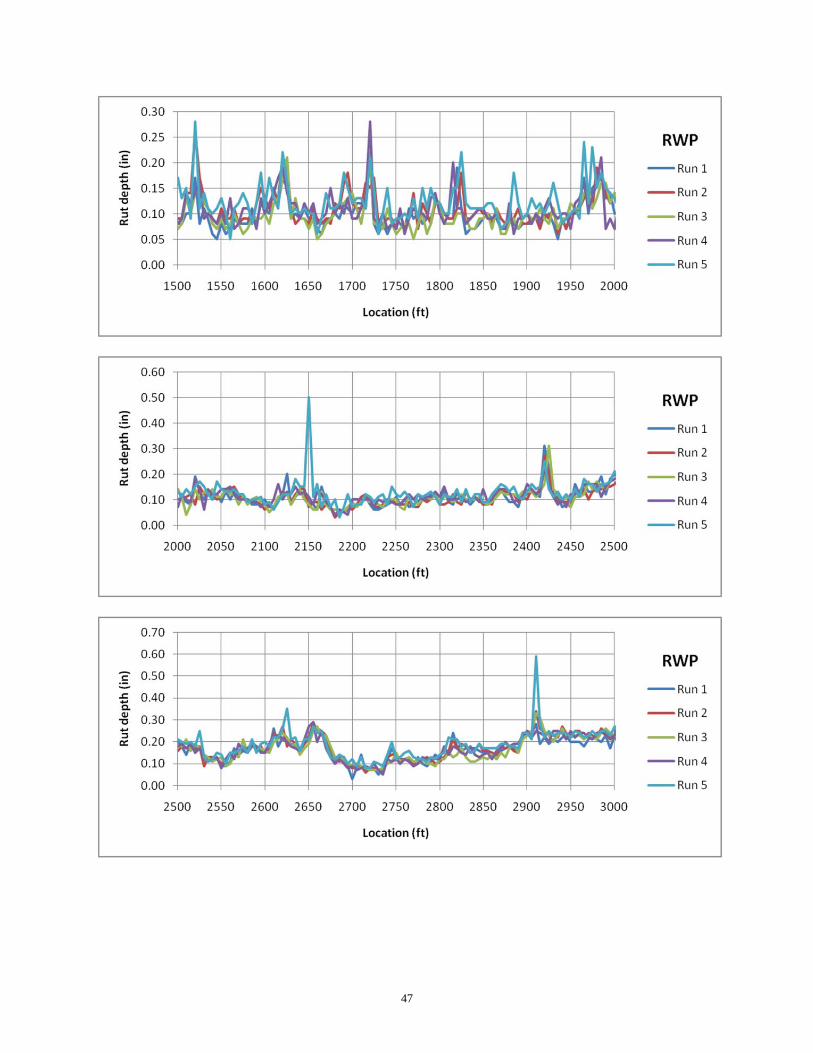
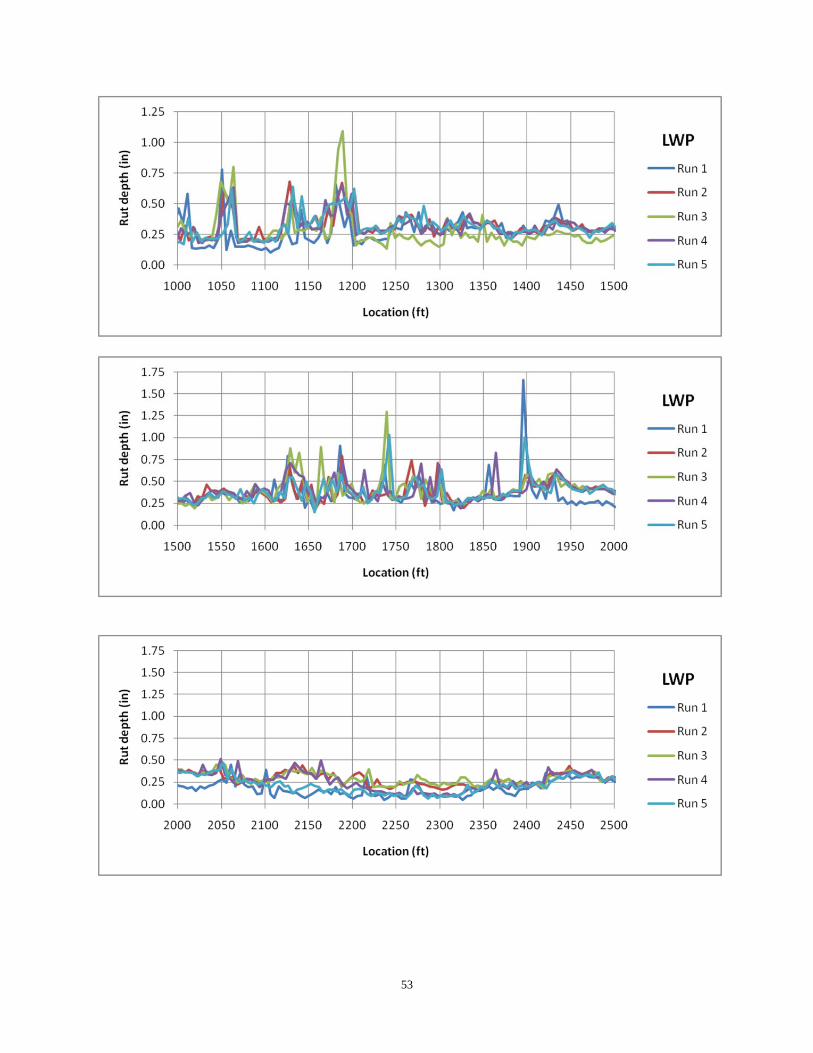
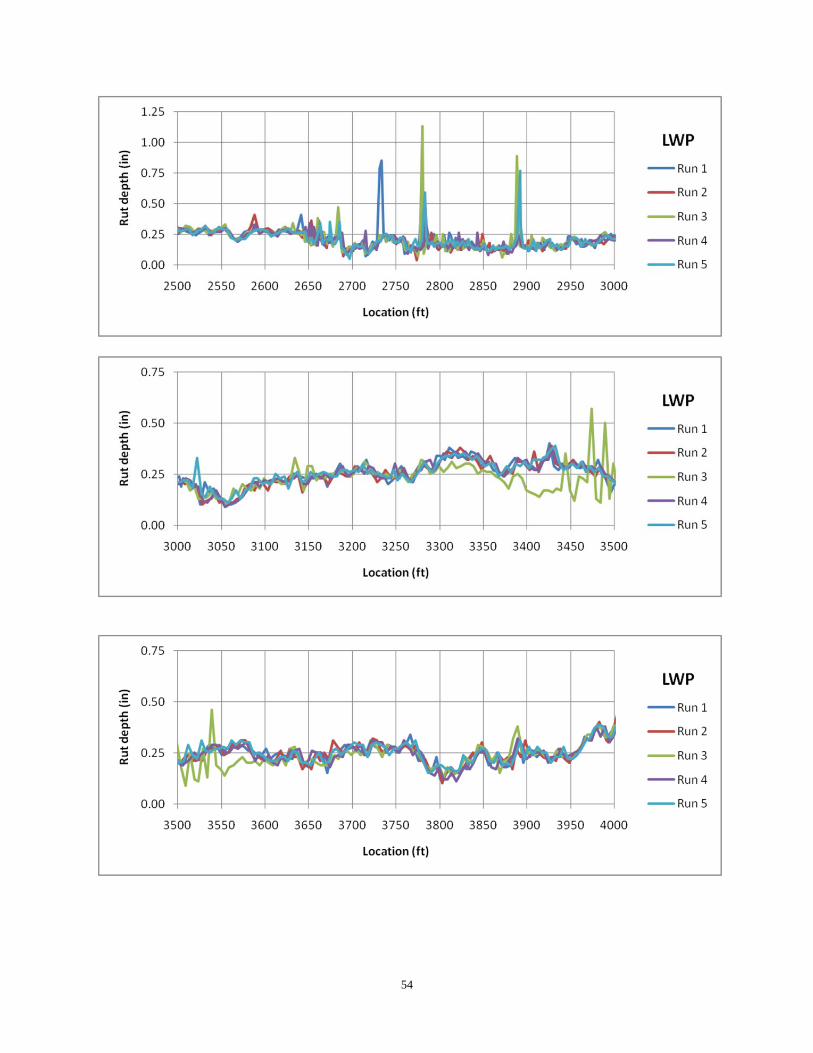
7 References ............................................................................................................................. 38 Appendix A: US-30 Rut Measurements (1 in = 25.4 mm; 100 ft = 30.48 m) ............................. 40 Appendix B: SR-682 Rut Measurements (1 in = 25.4 mm; 100 ft = 30.48 m) ........................... 52 Appendix C: PCR Data from District 10 (S&G and LRMS) ....................................................... 59

vi
List of Figures Figure 1. Measurement of rut using a straight edge and electronic dial gage ............................... 3 Figure 2. ORITE Profilometer measuring a transverse profile on SR-682 .................................... 4 Figure 3. Typical virtual straight edge model using ORITE profilometer data from US-30 (1 in = 2.54 cm) .......................................................................................................................................... 5 Figure 4. Front view of ODOT profiler vehicle ............................................................................. 6 Figure 5. Rear view of ODOT profiler vehicle showing attached INO Laser Rut Measurement System ............................................................................................................................................. 7 Figure 6. Virtual 2 m straight edge model ..................................................................................... 8 Figure 7. Virtual wire model for measuring rut depth ................................................................... 9 Figure 8. Test section at the intersection of US-30 and SR-94 .................................................... 10 Figure 9. Measuring rut depth on US-30 using the ORITE profilometer .................................... 11 Figure 10. Location of SR-682 test section ................................................................................. 12 Figure 11. Rut measurement on SR-682 using the profilometer and 8-ft S&G .......................... 13 Figure 12. Temporary rumble strips used to create an artificially deep rut to be used as a reference point in the LRMS data ................................................................................................. 13 Figure 13. Distribution of rutting by severity on US-30 (LWP).................................................. 16 Figure 14. Distribution of rutting by severity on US-30 (RWP) ................................................. 16 Figure 15. Rut depth measurements from 200 ft (60.96 m) test section on US-30 (LWP) (1 in = 25.4 mm) ....................................................................................................................................... 19 Figure 16. Rut depth measurements from 200-ft (60.96 m) test section on US-30 (RWP) (1 in = 25.4 mm) ....................................................................................................................................... 19 Figure 17. Rut depth measurements from LRMS in left wheel path on SR-682 (1800-2200 ft) (1 in =25.4 mm) ................................................................................................................................. 22 Figure 18. Pavement deterioration on SR-682 ............................................................................. 22 Figure 19. Distribution of rutting by severity on SR-682 (LWP) ................................................ 23 Figure 20. Distribution of rutting by severity on SR-682 (RWP)................................................ 24 Figure 21. Rut depth measurements from the 200-ft (60.96 m) test section on SR-682 (LWP) (1 in = 25.4 mm) ................................................................................................................................ 26 Figure 22. Rut depth measurements from the 200-ft (60.96 m) test section on SR-682 (RWP) (1 in = 25.4 mm) ................................................................................................................................ 26 Figure 23. Pavement profile from profilometer on SR-682 (LWP) where depth measurement was influenced by pavement deterioration (@ 2780 ft) (1 in = 25.4 mm) ................................... 27 Figure 24. 2-m and 4-ft virtual straight edge models (1 in = 25.4 mm) ...................................... 29 Figure 25. PCR rating key for flexible pavement (ODOT, 2006, p. 6) ....................................... 31 Figure 26. PCR rating form for flexible pavement (ODOT, 2006, p. 7) ..................................... 32

vii
List of Tables Table 1. General summary of data collected on US-30 using the Dynatest system .................... 14 Table 2. Games-Howell post-hoc test on LRMS data from US-30 ............................................. 15 Table 3. Games-Howell post-hoc test results on all data from the 200-ft (60.96 m) test section on US-30 ............................................................................................................................................ 18 Table 4. General summary of data collected on SR-682 using the Dynatest system .................. 20 Table 5. Games-Howell post-hoc test results on LRMS data from SR-682 ................................ 21 Table 6. Games-Howell post-hoc test results on LRMS, profilometer, and S&G data from the 200-ft (60.96 m) test section on SR-682 ....................................................................................... 25 Table 7. Mean absolute deviation of LRMS data from US-30 .................................................... 28 Table 8. Mean absolute deviation of LRMS data from SR-682 .................................................. 28 Table 9. Distribution of LRMS PCR scores by corresponding S&G rating ................................ 33 Table 10. Average LRMS PCR scores grouped by corresponding S&G score ............................ 33 Table 11. Effect on the overall average difference between LRMS and S&G PCR scores when the lower boundary of “occasional” rating range is changed ....................................................... 34 Table 12. Effect on the average differences between LRMS and S&G PCR scores when the lower boundary of “occasional” rating range is changed ............................................................. 34


1
1 Introduction
1.1 Problem statement Since 1985, ODOT has been manually collecting rut depth data using a straight edge and
dial gauge (S&G). This method is slow and dangerous to pavement condition raters when traffic control is not available. According to the Pavement Condition Rating (PCR) procedures, the rating team is instructed to stop at 1 mile intervals along the predetermined roadway section and evaluate a 100 foot section of pavement. While this method may be sufficient in many cases, there is potential for raters to overlook short sections of deeper than typical rutting. Also, there have been numerous instances, according to ODOT Infrastructure Management workers, when the level of traffic prevented them from obtaining the necessary number of rut depth measurements to properly evaluate a pavement section. To solve this problem, ODOT purchased two inertial road profilers; one from Pathway Services and one from Dynatest. Both vehicles use rear-mounted INO Laser Rut Measurement Systems (LRMS). These systems utilize two 3D laser profilers and allow the collection of transverse road profiles and calculation of rut depth measurements while the vehicle is in motion, even at high speeds. With the LRMS, numerous rut measurements can be obtained at short intervals over the entire section in a much shorter period of time. The safety risk for the rating team is greatly reduced because they can obtain measurements without leaving the vehicle and without interfering with traffic flow.
As previously discussed, manual evaluations of rutting for the PCR are often based on few actual measurements because of traffic and time limitations. ODOT has collected a database of PCR ratings for rut depth based on manual measurements, LRMS data, or both. The two methods of evaluating rut depth may produce significantly different PCR scores for the same section of pavement. A method for reconciling the difference between the two methods is needed. Before this can be done however, the accuracy, precision, and repeatability of the LRMS system needs to be confirmed.
During the initial preparation for this project, it was discovered that the straight edge and dial gage being used by the ODOT technicians was only 4 ft (1.22 m) in length. The ASTM standard for rut depth measurement (ASTM E 1703/E 1703M, 1995) specifies a minimum length of 1.73 m (5.67 ft) and recommends a length of 1.83 m (6 ft), 2 m (6.56 ft), 3 m (9.84 ft), 3.05 m (10 ft), or 3.66 m (12 ft). Not only is the ODOT straight edge limited by length, but the dial gage is fixed at the center of the bar. It is necessary to determine the possible effect of these factors on the rut depth measurements gathered by ODOT pavement raters.
1.2 Objectives The main goals of this study were to evaluate the rut depth measurement collection
techniques used by ODOT and to verify data gathered using the automated laser rut measurement system. To meet these goals, the following objectives were devised and met:
Conduct tests on a section of rutted pavement at one or more locations using the LRMS, straight edges, and profilometer
o Evaluate the LRMS data for precision, accuracy, and repeatability using the S&G method and Ohio Research Institute for Transportation and the Environment (ORITE) Profilometer as references

2
o Examine the potential effect of straight edge length on the accuracy of S&G measurements to determine whether the 4ft straight edge used by ODOT is adequate
Develop a method for extracting rutting distress scores from the LRMS data to be used with the ODOT pavement condition rating system
Recommend other parameters (maximum, minimum, etc.) that may be suggested by the data for the use and interpretation of INO rut depth measurements
3
2 Review of literature and equipment
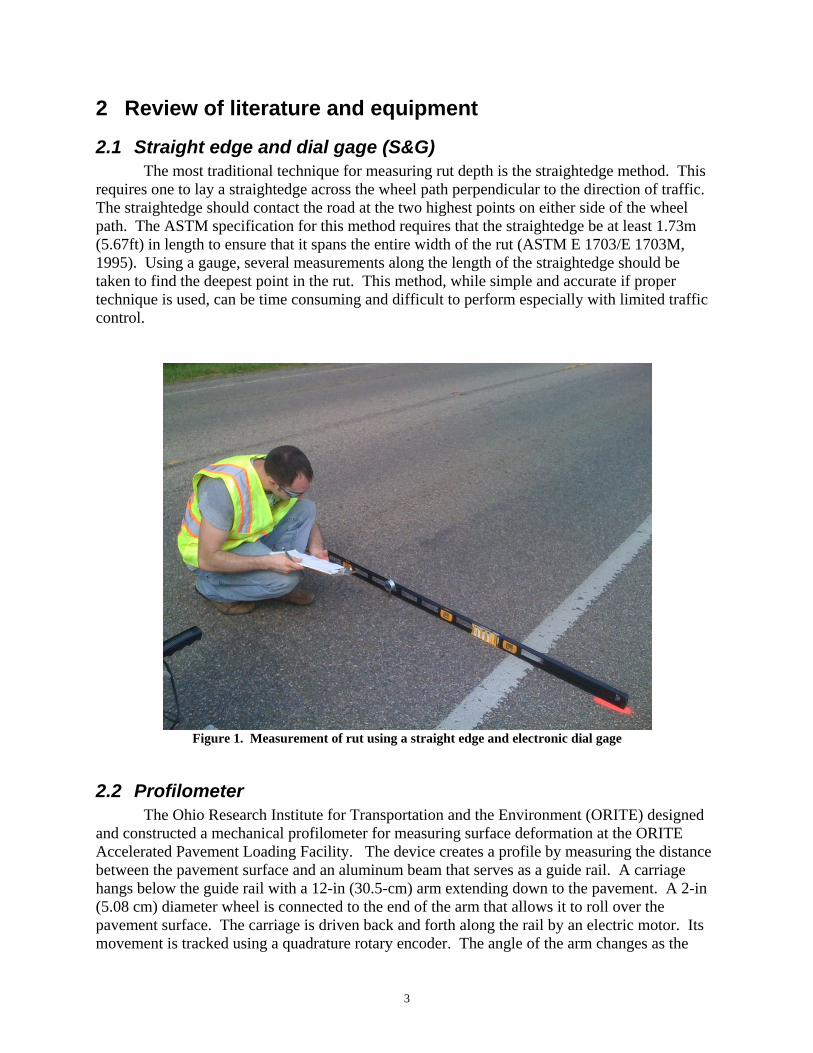
2.1 Straight edge and dial gage (S&G) The most traditional technique for measuring rut depth is the straightedge method. This
requires one to lay a straightedge across the wheel path perpendicular to the direction of traffic. The straightedge should contact the road at the two highest points on either side of the wheel path. The ASTM specification for this method requires that the straightedge be at least 1.73m (5.67ft) in length to ensure that it spans the entire width of the rut (ASTM E 1703/E 1703M, 1995). Using a gauge, several measurements along the length of the straightedge should be taken to find the deepest point in the rut. This method, while simple and accurate if proper technique is used, can be time consuming and difficult to perform especially with limited traffic control.
Figure 1. Measurement of rut using a straight edge and electronic dial gage
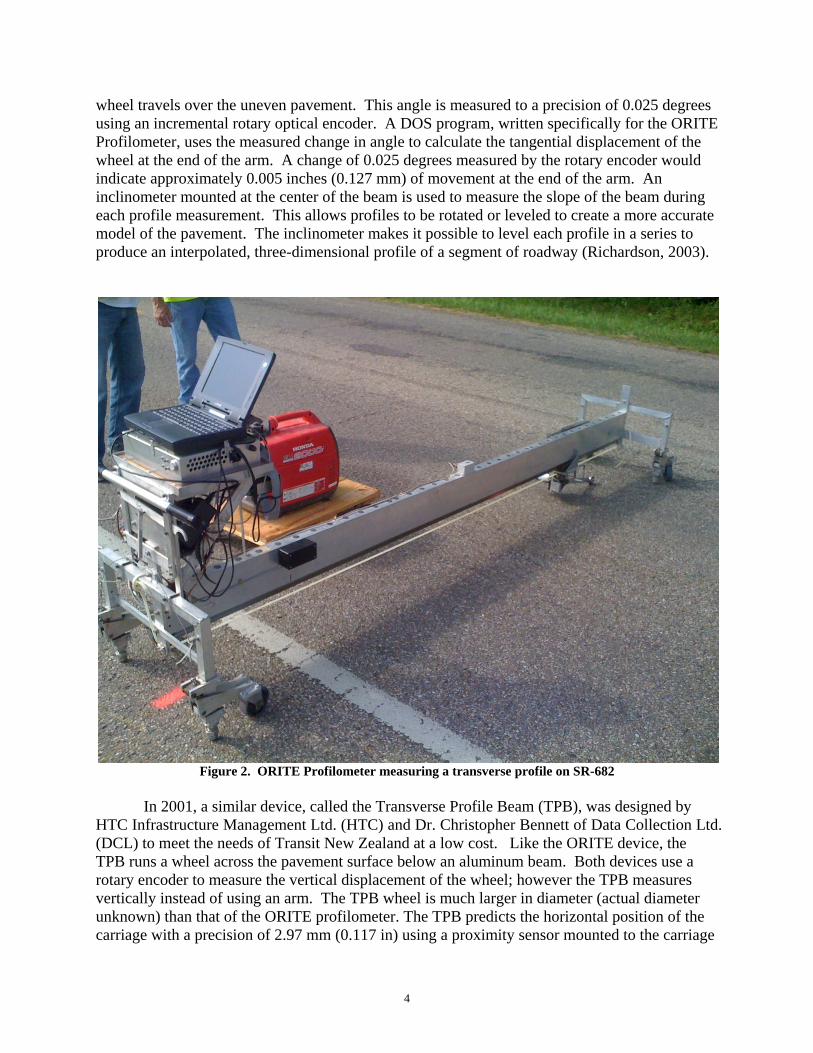
2.2 Profilometer The Ohio Research Institute for Transportation and the Environment (ORITE) designed
and constructed a mechanical profilometer for measuring surface deformation at the ORITE Accelerated Pavement Loading Facility. The device creates a profile by measuring the distance between the pavement surface and an aluminum beam that serves as a guide rail. A carriage hangs below the guide rail with a 12-in (30.5-cm) arm extending down to the pavement. A 2-in (5.08 cm) diameter wheel is connected to the end of the arm that allows it to roll over the pavement surface. The carriage is driven back and forth along the rail by an electric motor. Its movement is tracked using a quadrature rotary encoder. The angle of the arm changes as the
4
wheel travels over the uneven pavement. This angle is measured to a precision of 0.025 degrees using an incremental rotary optical encoder. A DOS program, written specifically for the ORITE Profilometer, uses the measured change in angle to calculate the tangential displacement of the wheel at the end of the arm. A change of 0.025 degrees measured by the rotary encoder would indicate approximately 0.005 inches (0.127 mm) of movement at the end of the arm. An inclinometer mounted at the center of the beam is used to measure the slope of the beam during each profile measurement. This allows profiles to be rotated or leveled to create a more accurate model of the pavement. The inclinometer makes it possible to level each profile in a series to produce an interpolated, three-dimensional profile of a segment of roadway (Richardson, 2003).
Figure 2. ORITE Profilometer measuring a transverse profile on SR-682
In 2001, a similar device, called the Transverse Profile Beam (TPB), was designed by
HTC Infrastructure Management Ltd. (HTC) and Dr. Christopher Bennett of Data Collection Ltd. (DCL) to meet the needs of Transit New Zealand at a low cost. Like the ORITE device, the TPB runs a wheel across the pavement surface below an aluminum beam. Both devices use a rotary encoder to measure the vertical displacement of the wheel; however the TPB measures vertically instead of using an arm. The TPB wheel is much larger in diameter (actual diameter unknown) than that of the ORITE profilometer. The TPB predicts the horizontal position of the carriage with a precision of 2.97 mm (0.117 in) using a proximity sensor mounted to the carriage

5
that produces a pulse when it passes one of the magnets mounted at measured intervals along the beam (Bennett, 2002)
Measurements taken by the TPB were compared to straightedge measurements and repeated over a period of time to confirm that the TPB would produce consistent results. Bennett (2002) reported that the TPB results were within 2.5 mm (0.10 in) of the straightedge. The differences were attributed to the difference in precision between the two methods (the straightedge/wedge measurements were to the nearest mm) and the size of the TPB wheel. Repeated runs of the TPB showed a typical deviation of +/- 1.5 mm (0.06 in). The results of the study show that the TPB could produce reliable and accurate pavement profiles (Bennett, 2002). Given the similarities in design between the ORITE Profilometer and the TPB, Bennett (2002) supports the validity of the data collected by the ORITE Profilometer.
In order to measure the rut depth from the profilometer readings, a method for simulating a 2-m (6.56-ft) straight edge was developed using MATLAB. The MATLAB program begins at the leftmost point of the profile (the profilometer was run from right to left, which resulted in right and left being reversed) and draws a virtual line to every point within 2 m (6.56 ft). Each time a line is drawn, the depth is measured at every point in between its beginning and end. After the final line is drawn and depths are measured, the starting point is shifted one point to the right and the process of drawing lines begins again. This is repeated until the left end of the virtual straight edge is beyond the deepest part of the rut. The largest depth measured during this process is output as the rut depth for that profile. The rut width is recorded as well. This was done for each of the profiles collected in both wheel paths. An example of the resulting virtual straight edge created by the program is shown in Figure 3. Just like in the case of an actual straight edge measurement, the maximum possible depth is found when the virtual straight edge is tangent to the plotted curve at two points near the peaks on either side of the rut.
Figure 3. Typical virtual straight edge model using ORITE profilometer data from US-30 (1 in = 2.54 cm)
3
3.5
4
4.5
5
5.5
6
0 20 40 60 80 100 120
Vertical m
easurement (in)
Horizontal measurement (in)
Profile
Straight edge
Depth

6
2.3 Laser rut measurement system The INO laser rut measurement system used by ODOT utilizes two laser profilers
mounted to the rear of a vehicle, as shown in Figure 4. Each profiler provides part of the overall field of view. The profilers use high-power pulsed infrared laser line projectors and specially designed cameras to create a transverse profile of the roadway surface. The LRMS system reads the vehicle odometer to determine the location of each profile reading and to ensure that measurements are taken at the user-specified intervals. The system is controlled from within the vehicle by a driver or passenger. The rut measurement data are analyzed and can be viewed in real time. In this study, the program RSPWin v2.6.8 from Dynatest was used. A list of specifications for the LRMS taken from the Pavemetrics website (http://www.pavemetrics.com/en/lrms.html) is shown below:
Number of laser profiles: 2 Number of 3D points per profile (max): 1280 Sampling rate: 30 or 150 profiles/s Profile spacing: adjustable Transversal field-of-view (nominal): 4 m (13.1 ft) Transversal resolution: ± 2 mm (0.08 in) Depth range of operation: 500 mm (19.7 in) (30 Hz) or 450 mm (17.7 in) (150 Hz) Depth accuracy (nominal): ±1 mm (0.04in) Laser profiler dimensions (approx.): 108 mm (4.25 in) (W) x 692 mm (27.2 in) (H)
x 220 mm (8.7 in) (D) Laser profiler weight (approx.): 12 kg (26.5 lbs) Power consumption (max): 150 W at 120/240 VAC
Figure 4. Front view of ODOT profiler vehicle

7
Figure 5. Rear view of ODOT profiler vehicle showing attached INO Laser Rut Measurement System
The profiler vehicle used in this study was built by Dynatest Consultants, Inc. The output
file, created in the RSPWin program, includes rut depth, rut width, rut area, and location (milepoint) for both wheel paths. The Dynatest system allows the user to not only adjust the profile spacing, but also to use rapid-fire mode which allows the system to collect data at the maximum 30 Hz sampling rate as opposed to a set distance interval. This feature was advantageous during this study as it allowed for a much higher density of data over the pavement test sections.
In 2002, a research study (Grondin, Leroux, Laurent, 2002) was funded by the Quebec Ministry of Transport (MTQ) to evaluate the INO Laser Rut Measurement System (LRMS). The goal of the study was to determine whether the system could meet the needs of the MTQ and to validate the precision and accuracy promised in the systems specifications. Most of the equipment used by MTQ is identical to what is used by ODOT, with the main exception being the computer and software.
In order to validate the rut depth measurements, Grondin, et al (2002) compiled data collected by the LRMS at twelve 400-m (1312-ft) sites. Six passes were made at each site; three on day one and three more on day two. Readings were taken at 1-m (3.3-ft) intervals and the average depth per 10 m (32.8 ft) was calculated. Multiple passes allowed the team to examine deviation of rut depth measurements. In order to test the LRMS for repeatability, a 2-km (1.24-mi) site was selected and measured five times. The team then conducted measurements on the twelve 400-m (1312-ft) sites. Afterward, the 2-km site was measured again and the results were compared to those obtained earlier in the day. 20 days later, the researchers performed three additional passes. The results show that the LRMS was accurate to 0.5 mm (0.02 in) (mean deviation) and produced reliable and repeatable measurements. The results produced in this research study can be compared to those in Grondin, et al (2002).
8
2.4 Rut depth algorithms Throughout their development, automated transverse profile systems have typically used
three different methods of determining rut depth. Two of these methods, the straight edge model and the wire model, are based on manual measurement methods. The third method, the pseudo-rut model, has been commonly used with rut-bar systems. These systems often provide only 3 or 5 measurements for determining rut depth and have been shown to be inaccurate and unreliable. This is mainly because the limited number of profile measurements allows it to be affected by vehicle wandering (FHWA-RD-01-27, 2001).
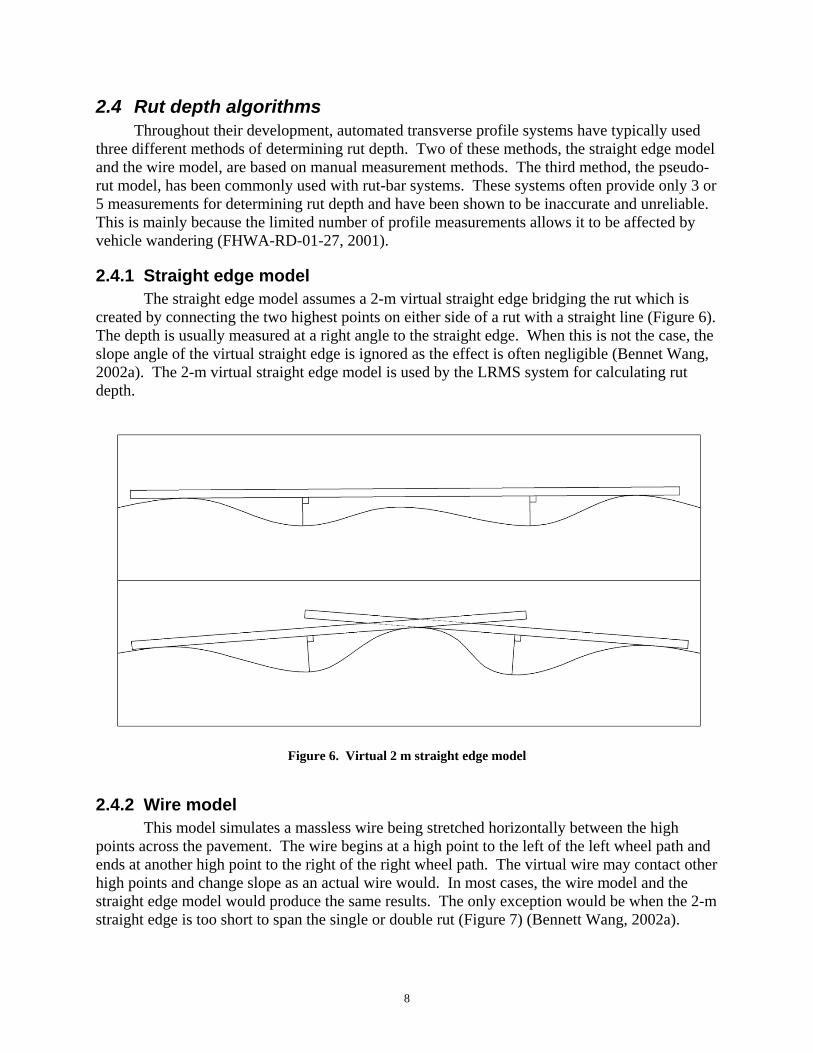
2.4.1 Straight edge model The straight edge model assumes a 2-m virtual straight edge bridging the rut which is
created by connecting the two highest points on either side of a rut with a straight line (Figure 6). The depth is usually measured at a right angle to the straight edge. When this is not the case, the slope angle of the virtual straight edge is ignored as the effect is often negligible (Bennet Wang, 2002a). The 2-m virtual straight edge model is used by the LRMS system for calculating rut depth.
Figure 6. Virtual 2 m straight edge model
2.4.2 Wire model This model simulates a massless wire being stretched horizontally between the high
points across the pavement. The wire begins at a high point to the left of the left wheel path and ends at another high point to the right of the right wheel path. The virtual wire may contact other high points and change slope as an actual wire would. In most cases, the wire model and the straight edge model would produce the same results. The only exception would be when the 2-m straight edge is too short to span the single or double rut (Figure 7) (Bennett Wang, 2002a).

9
Figure 7. Virtual wire model for measuring rut depth
2.4.3 Pseudo-rut model The pseudo-rut model bases the rut depth on the difference between the highest and
lowest points measured. This is not a reliable method for determining rut-depth and can produce poor results. The pseudo-rut method was intended for use with profiler systems that produce a limited number of data points and is not suited for this study (Bennett Wang, 2002a).

10
3 Verification of the LRMS system
3.1 Experimental procedure Two 200-ft (60.96 m) sections of pavement with rutting at a variety of severity levels
were selected for data collection. Each 200-ft (60.96 m) section was measured and marked at 5 ft (1.52 m) intervals. At each interval, rut depth was measured in both the left and right wheel paths using the profilometer, 8 ft S&G, and 4 ft S&G. Workers from the ODOT Infrastructure Management division made five runs at each site with the Dynatest profiling vehicle over a greater length of pavement that contained each 200-ft (60.96 m) section. As the vehicle approached the test sections, the system was switched to rapid-fire mode in order to provide a greater number of measurements for analysis.
3.1.1 Localized heavy use/severe rutting on US-30 A site was selected on US-30 near Wooster, Ohio for testing. The 200-ft (60.96 m)
section was in the westbound approach to a stoplight at the intersection of US-30 and SR-94 (see Figure 8). This area receives a significant amount of large truck traffic. The stopped or slow-moving, heavily loaded trucks had produced a section of extremely severe rutting and upheaving. Areas away from the intersection were typically characterized by light or medium rutting.
Figure 8. Test section at the intersection of US-30 and SR-94

11
Figure 9. Measuring rut depth on US-30 using the ORITE profilometer
ODOT workers made five runs with the Dynatest pavement profiling vehicle and
collected measurements at five foot intervals (with the exception of the rapid-fire segment at the test section). They began collection at milepost 24.863 and ended near milepost 23.330, covering a distance of 1.563 mi (2.515 km). The intersection of US-30 and SR-94 where the 200-ft (60.96 m) test section was located is at milepost 24.015. Data collection with the LRMS system is started and stopped by the operator as the vehicle is in motion. As a result, the accuracy of the starting point is dependent on the vehicle speed and reaction time of the operator. Fortunately, the extreme severity of rutting at the 200-ft (60.96 m) test section provided a well-defined reference point for aligning the data from each run and aligning the LRMS data with the measurements taken with the profilometer and straight edges.
3.1.2 Light use/medium rutting on SR-682 A second test site having a more typical section of distressed pavement was needed in
order to evaluate the LRMS system under normal conditions. A section of SR-682 in Athens County, Ohio was chosen for its low to medium severity rutting. This section is similar to the pavement sections typically found in the PCR database.

12
Figure 10. Location of SR-682 test section
For this test, procedures similar to those used for the US-30 site were followed. A 200ft
(60.96 m) section of pavement at approximately mile point 1.51 was measured and marked at five foot (1.52 m) intervals. Workers from the ODOT Infrastructure Management office made five runs with the Dynatest LRMS system. LRMS data was collected at five foot intervals beginning at milepoint 1 and ending at approximately milepoint 1.8, a distance of about 0.8 mi (1.3 km). As the vehicle approached the test section, rapid-fire mode was initiated, causing the system to record at 30 Hz intervals. Measurements were collected at 5-ft (1.52 m) intervals using the 4 ft straight edge, 8 ft straight edge, and profilometer on the 200-ft (60.96 m) section only. These measurements were then compared with the LRMS results.
Unlike the US-30 test, there was no clearly defined section of severe rutting that could be used as a reference point for aligning data sets. To compensate, a reference point was created at the start of the 200-ft test section by creating a sort of artificial rut that would be easy to distinguish from other areas of the pavement. This was achieved by laying temporary rumble strips longitudinally in the road on both sides of the right wheel path. This artificially raised the sides of the wheel path to simulate a deeper rut and produced a spike in depth measurements that was used to align each set of data (see Figure 12).

13
Figure 11. Rut measurement on SR-682 using the profilometer and 8-ft S&G
Figure 12. Temporary rumble strips used to create an artificially deep rut to be used as a reference point in
the LRMS data

14
3.2 Results
3.2.1 Localized heavy use/severe rutting on US-30 The sets of data from the Dynatest LRMS system were examined in order to determine
whether repeated runs produce similar results. The data collected using the Dynatest system is summarized in Table 1. A small number of points were missing from runs 2, 3, and 5. According to the ODOT workers, this was a result of the vehicle being forced to stop or slow down. The Dynatest system will not collect unless the vehicle is moving at a sufficient speed and data can be lost. These errors result in the omission of both the left and right rut measurements.
Table 1. General summary of data collected on US-30 using the Dynatest system
Data Set Wheel path
Starting Milepost
Final Milepost
Total data points (n*) Errors Data points after
errors removed (n)
Run 1 LWP 24.863 23.33933 1713 0 1713 RWP 24.863 23.33933 1713 0 1713
Run 2 LWP 24.863 23.3327 1737 49 1688 RWP 24.863 23.3327 1737 49 1688
Run 3 LWP 24.863 23.33175 1748 28 1720 RWP 24.863 23.33175 1748 28 1720
Run 4 LWP 24.863 23.33364 1721 0 1721 RWP 24.863 23.33364 1721 0 1721
Run 5 LWP 24.863 23.32986 1735 2 1733 RWP 24.863 23.32986 1735 2 1733
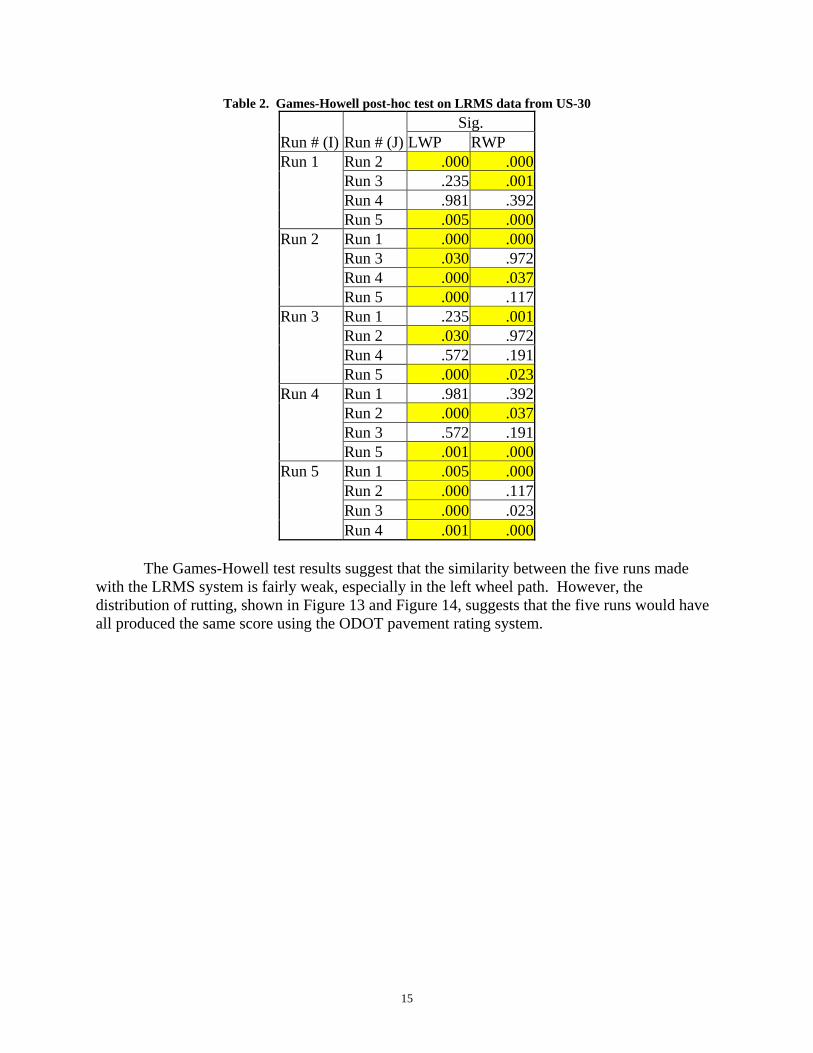
A statistical analysis was conducted with IBM SPSS Statistics software using the analysis
of variance (ANOVA) method and the Games-Howell post-hoc test. Pairs of data were tested to determine their difference using a significance level of 0.05. The results are shown in Table 2. Cells colored yellow show statistical dissimilarity. A natural log transformation was used on data from both wheel paths to achieve normality.
15
Table 2. Games-Howell post-hoc test on LRMS data from US-30
Run # (I) Run # (J)Sig.
LWP RWP Run 1 Run 2 .000 .000
Run 3 .235 .001Run 4 .981 .392Run 5 .005 .000
Run 2 Run 1 .000 .000Run 3 .030 .972Run 4 .000 .037Run 5 .000 .117
Run 3 Run 1 .235 .001Run 2 .030 .972Run 4 .572 .191Run 5 .000 .023
Run 4 Run 1 .981 .392Run 2 .000 .037Run 3 .572 .191Run 5 .001 .000
Run 5 Run 1 .005 .000Run 2 .000 .117Run 3 .000 .023Run 4 .001 .000
The Games-Howell test results suggest that the similarity between the five runs made with the LRMS system is fairly weak, especially in the left wheel path. However, the distribution of rutting, shown in Figure 13 and Figure 14, suggests that the five runs would have all produced the same score using the ODOT pavement rating system.

16
Figure 13. Distribution of rutting by severity on US-30 (LWP)
Figure 14. Distribution of rutting by severity on US-30 (RWP)
The 200-ft (60.96 m) test section was extracted from the LRMS data and compared with the profilometer and S&G data gathered at the test section. S&G measurements could not be obtained at many of the 5-ft (1.52 m) intervals due to the extreme severity of rutting at these locations. The dial gage was not able to reach the bottom of the rut. The profilometer was able to gather data at each interval however. The same ANOVA and Games-Howell tests were used
0
10
20
30
40
50
60
70
80
(< 1/8") Low (1/8"‐3/8") Medium (3/8"‐3/4") High (> 3/4")
Extent (%
)
Rutting Severity
Run 1
Run 2
Run 3
Run 4
Run 5
0
10
20
30
40
50
60
70
80
(< 1/8") Low (1/8"‐3/8") Medium (3/8"‐3/4") High (> 3/4")
Extent (%
)
Rutting Severity
Run 1
Run 2
Run 3
Run 4
Run 5

17
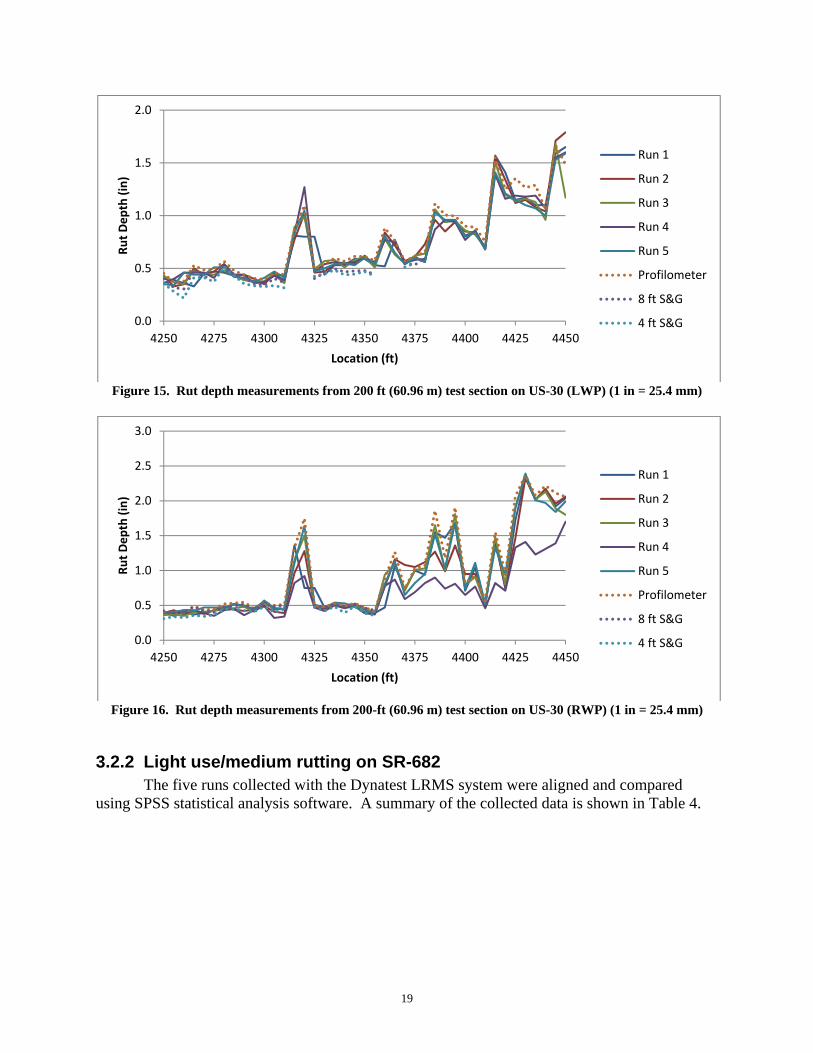
in this analysis. Once again, a significance level of 0.05 was used. The natural log transformation was not necessary in this case. The results are shown in Table 3 and plots of the measurements are shown in Figure 15 and Figure 16. Unlike the previous test, the results of the ANOVA test on only the test section show strong statistical similarity and therefore imply strong repeatability. They also show that there was no statistical difference between the LRMS rut depth and alternative measurement methods.

18
Table 3. Games-Howell post-hoc test results on all data from the 200-ft (60.96 m) test section on US-30
Run # (I) Run # (J) Sig.
Run # (I) Run # (J) Sig.
LWP RWP LWP RWP Run 1 Run 2 1.000 1.000 Profilometer Run 1 .999 .999
Run 3 1.000 1.000 Run 2 1.000 .996 Run 4 1.000 .491 Run 3 .996 .999 Run 5 1.000 1.000 Run 4 .999 .166
Profilometer .999 .999 Run 5 .996 .999 8 ft S&G .752 1.000 8 ft S&G .048 .961 4 ft S&G .232 .259 4 ft S&G .004 .002
Run 2 Run 1 1.000 1.000 8 ft S&G Run 1 .752 1.000 Run 3 1.000 1.000 Run 2 .543 .414 Run 4 1.000 .538 Run 3 .610 .758 Run 5 1.000 1.000 Run 4 .401 .027
Profilometer 1.000 .996 Run 5 .480 1.000 8 ft S&G .543 .414 Profilometer .048 .961 4 ft S&G .086 .660 4 ft S&G .862 .017
Run 3 Run 1 1.000 1.000 4 ft S&G Run 1 .232 .259 Run 2 1.000 1.000 Run 2 .086 .660 Run 4 1.000 .432 Run 3 .114 .449 Run 5 1.000 1.000 Run 4 .051 1.000
Profilometer .996 .999 Run 5 .065 .024 8 ft S&G .610 .758 Profilometer .004 .002 4 ft S&G .114 .449 8 ft S&G .862 .017
Run 4 Run 1 1.000 .491 Run 2 1.000 .538 Run 3 1.000 .432 Run 5 1.000 .396
Profilometer .999 .166 8 ft S&G .401 .027 4 ft S&G .051 1.000
Run 5 Run 1 1.000 1.000 Run 2 1.000 1.000 Run 3 1.000 1.000 Run 4 1.000 .396
Profilometer .996 .999 8 ft S&G .480 1.000 4 ft S&G .065 .024
19
Figure 15. Rut depth measurements from 200 ft (60.96 m) test section on US-30 (LWP) (1 in = 25.4 mm)
Figure 16. Rut depth measurements from 200-ft (60.96 m) test section on US-30 (RWP) (1 in = 25.4 mm)
3.2.2 Light use/medium rutting on SR-682 The five runs collected with the Dynatest LRMS system were aligned and compared
using SPSS statistical analysis software. A summary of the collected data is shown in Table 4.
0.0
0.5
1.0
1.5
2.0
4250 4275 4300 4325 4350 4375 4400 4425 4450
Rut Depth (in)
Location (ft)
Run 1
Run 2
Run 3
Run 4
Run 5
Profilometer
8 ft S&G
4 ft S&G
0.0
0.5
1.0
1.5
2.0
2.5
3.0
4250 4275 4300 4325 4350 4375 4400 4425 4450
Rut Depth (in)
Location (ft)
Run 1
Run 2
Run 3
Run 4
Run 5
Profilometer
8 ft S&G
4 ft S&G

20
Table 4. General summary of data collected on SR-682 using the Dynatest system
Data Set Wheel Path
Starting Milepost
Final Milepost
Total data points (n*) Errors
Data points after errors removed (n)
Run 1 LWP 1 1.80303 968 0 968 RWP 1 1.80303 968 0 968
Run 2 LWP 1 1.814898 973 0 973 RWP 1 1.814898 973 0 973
Run 3 LWP 1 1.801384 981 0 981 RWP 1 1.801384 981 0 981
Run 4 LWP 1 1.940341 1122 0 1122 RWP 1 1.940341 1122 0 1122
Run 5 LWP 1 1.800189 980 0 980 RWP 1 1.800189 980 0 980
Once the five runs were aligned using the artificial rut caused by the temporary rumble
strips, ANOVA tests were conducted on the right and left wheel paths to determine whether the runs were statistically similar. The Games-Howell post-hoc test was used to provide a detailed comparison. A significance level of 0.05 was used. The results are shown in Table 5.

21
Table 5. Games-Howell post-hoc test results on LRMS data from SR-682
Run # (I) Run # (J)Sig.
LWP RWP
Run 1
Run 2 .000 .999 Run 3 .000 .751 Run 4 .000 .875 Run 5 .000 .650
Run 2
Run 1 .000 .999 Run 3 .389 .613 Run 4 .946 .767 Run 5 .435 .511
Run 3
Run 1 .000 .751 Run 2 .389 .613 Run 4 .863 .999 Run 5 1.000 1.000
Run 4
Run 1 .000 .875 Run 2 .946 .767 Run 3 .863 .999 Run 5 .891 .994
Run 5
Run 1 .000 .650 Run 2 .435 .511 Run 3 1.000 1.000 Run 4 .891 .994
The Games-Howell test shows a strong statistical similarity between each set of data from the right wheel path; however the left wheel path data from Run 1 do not correlate with the other data sets. There are a few instances where the measured rut depths from Run 1 are slightly less than the other runs over a short distance (see Figure 17). In these segments, the measured rut widths in Run 1 are also significantly less than the widths measured in other runs. This may suggest that the vehicle had drifted from the center of the lane or the laser system was being influenced by pavement deterioration observed at the center of the roadway (see Figure 18).

22
Figure 17. Rut depth measurements from LRMS in left wheel path on SR-682 (1800-2200 ft) (1 in =25.4 mm)
Figure 18. Pavement deterioration on SR-682
0
0.2
0.4
0.6
0.8
1
1.2
1.4
1.6
1.8
1800 1850 1900 1950 2000 2050 2100 2150 2200
Rut depth (in)
Location (ft)
Run 1
Run 2
Run 3
Run 4
Run 5

23
Overall, the five runs show strong statistical similarity. There are some outlying data that created some dissimilarity in the first run; however, considering that these tests were run in an uncontrolled environment where the points do not align perfectly, pavement deterioration may influence measurements, and curves in the road may have influenced the driver’s ability to remain at the center of the lane, the end results are convincing enough to deem the measurements repeatable. A distribution of data from SR-682 separated by PCR severity level is shown in Figure 19 and Figure 20. The distributions are similar between runs; however the inconsistency in the left wheel path data from run 1 is evident in Figure 19.
Figure 19. Distribution of rutting by severity on SR-682 (LWP)
0
10
20
30
40
50
60
70
80
90
100
(< 1/8") Low (1/8"‐3/8") Medium (3/8"‐3/4")
High (> 3/4")
Extent (%
)
Rutting Severity
Run 1
Run 2
Run 3
Run 4
Run 5

24
Figure 20. Distribution of rutting by severity on SR-682 (RWP)
A separate ANOVA analysis was conducted on the LRMS data from the 200-ft (60.96 m) test section. The results from the Games-Howell post hoc tests are shown in Table 6. The results of the test show that the five runs were statistically similar; however the right wheel path measurements from Run 3 show a fairly weak correlation with the rest of the data. As was observed previously with Run 1, there exist data from Run 3 that are less than the measurements from other runs. Similarly, the measured rut widths corresponding with these points are also noticeably less than what is shown in the other runs. Because there was little deterioration observed in the right wheel path, it is likely that this was caused by the profiler vehicle drifting away from the center of the lane. In future studies, it may be helpful to videotape the vehicle as it passes over a test section to determine if this is in fact the cause.
0
10
20
30
40
50
60
70
80
90
(< 1/8") Low (1/8"‐3/8") Medium (3/8"‐3/4") High (> 3/4")
Extent (%
)
Rutting Severity
Run 1
Run 2
Run 3
Run 4
Run 5

25
Table 6. Games-Howell post-hoc test results on LRMS, profilometer, and S&G data from the 200-ft (60.96 m) test section on SR-682
Run # (I) Run # (J) Sig.
Run # (I) Run # (J) Sig.
LWP RWP LWP RWP
Run 1 Run 2 .843 1.000 Profilometer Run 1 .007 .966Run 3 1.000 .086 Run 2 .000 .992Run 4 .973 .998 Run 3 .005 .612Run 5 1.000 1.000 Run 4 .000 1.000Profilometer .007 .966 Run 5 .000 .9938 ft S&G .459 .126 8 ft S&G .000 .7564 ft S&G .000 .000 4 ft S&G .000 .001
Run 2 Run 1 .843 1.000 8 ft S&G Run 1 .459 .126Run 3 .927 .167 Run 2 1.000 .241Run 4 1.000 1.000 Run 3 .639 1.000Run 5 .794 1.000 Run 4 .970 .461Profilometer .000 .992 Run 5 .276 .2878 ft S&G 1.000 .241 Profilometer .000 .7564 ft S&G .036 .000 4 ft S&G .036 .189
Run 3 Run 1 1.000 .086 4 ft S&G Run 1 .000 .000Run 2 .927 .167 Run 2 .036 .000Run 4 .994 .336 Run 3 .001 .448Run 5 1.000 .202 Run 4 .005 .000Profilometer .005 .612 Run 5 .000 .0008 ft S&G .639 1.000 Profilometer .000 .0014 ft S&G .001 .448 8 ft S&G .036 .189
Run 4 Run 1 .973 .998Run 2 1.000 1.000Run 3 .994 .336Run 5 .967 1.000Profilometer .000 1.0008 ft S&G .970 .4614 ft S&G .005 .000
Run 5 Run 1 1.000 1.000Run 2 .794 1.000Run 3 1.000 .202Run 4 .967 1.000Profilometer .000 .9938 ft S&G .276 .2874 ft S&G .000 .000

26
Figure 21. Rut depth measurements from the 200-ft (60.96 m) test section on SR-682 (LWP) (1 in = 25.4 mm)
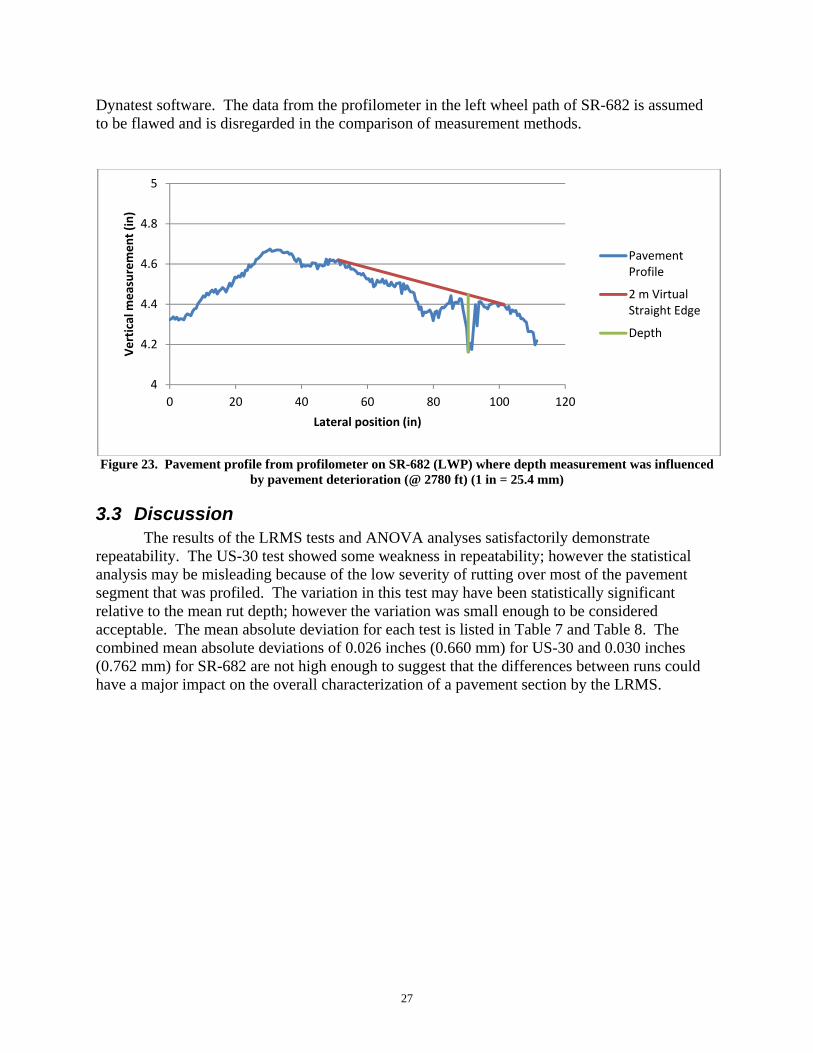
Figure 22. Rut depth measurements from the 200-ft (60.96 m) test section on SR-682 (RWP) (1 in = 25.4 mm) The LRMS data correlate well with the 8 ft straight edge in all cases; however the profilometer measurements correlated with the LRMS readings only in the right wheel path. As one can see in Figure 21, the profilometer measurements are frequently higher than the other measurements. This is due to the deterioration in the left wheel path and near the centerline as shown in Figure 18. Small pits in the roadway surface are read by the profilometer wheel and create low points in the profile that are interpreted as the bottom of the rut by the rut depth algorithm discussed in Section 2.2. An example of this is shown in Figure 23. The LRMS system may not be influenced by this type of deterioration due to the shallow angle at which the laser hits the pavement surface. Its effects may also be diminished by the filtering used in the
0
0.2
0.4
0.6
0.8
1
2740 2790 2840 2890 2940
Rut depth (in)
Location (ft)
Run 1
Run 2
Run 3
Run 4
Run 5
Profilometer
8 ft S&G
4 ft S&G
0
0.1
0.2
0.3
0.4
0.5
2740 2790 2840 2890 2940
Rut depth (in)
Location (ft)
Run 1
Run 2
Run 3
Run 4
Run 5
Profilometer
8 ft S&G
4 ft S&G
27
Dynatest software. The data from the profilometer in the left wheel path of SR-682 is assumed to be flawed and is disregarded in the comparison of measurement methods.
Figure 23. Pavement profile from profilometer on SR-682 (LWP) where depth measurement was influenced
by pavement deterioration (@ 2780 ft) (1 in = 25.4 mm)
3.3 Discussion The results of the LRMS tests and ANOVA analyses satisfactorily demonstrate
repeatability. The US-30 test showed some weakness in repeatability; however the statistical analysis may be misleading because of the low severity of rutting over most of the pavement segment that was profiled. The variation in this test may have been statistically significant relative to the mean rut depth; however the variation was small enough to be considered acceptable. The mean absolute deviation for each test is listed in Table 7 and Table 8. The combined mean absolute deviations of 0.026 inches (0.660 mm) for US-30 and 0.030 inches (0.762 mm) for SR-682 are not high enough to suggest that the differences between runs could have a major impact on the overall characterization of a pavement section by the LRMS.
4
4.2
4.4
4.6
4.8
5
0 20 40 60 80 100 120
Vertical m
easurement (in)
Lateral position (in)
PavementProfile
2 m VirtualStraight Edge
Depth

28
Table 7. Mean absolute deviation of LRMS data from US-30
unit LWP RWP
Combined (LWP and RWP)
Number of points (n) - 1607 1607 3214
Mean Absolute Deviation (in) 0.024 0.028 0.026
(mm) 0.61 0.71 0.66
Standard Deviation of Absolute Deviation
(in) 0.025 0.029 0.027
(mm) 0.64 0.74 0.69
Upper 95% Confidence Interval (in) 0.026 0.029 0.027
(mm) 0.66 0.74 0.69
Lower 95% Confidence Interval (in) 0.023 0.027 0.025
(mm) 0.58 0.69 0.64
Table 8. Mean absolute deviation of LRMS data from SR-682
unit LWP RWP
Combined (LWP and RWP)
Number of points (n) - 845 845 1690
Mean Absolute Deviation (in) 0.033 0.026 0.030
(mm) 0.84 0.66 0.76
Standard Deviation of Absolute Deviation
(in) 0.036 0.021 0.030
(mm) 0.91 0.53 0.76
Upper 95% Confidence Interval (in) 0.036 0.027 0.031
(mm) 0.91 0.69 0.79
Lower 95% Confidence Interval (in) 0.031 0.025 0.028
(mm) 0.79 0.64 0.71 As a tool for evaluating pavement conditions, the LRMS system shows satisfactory
repeatability. However, in the SR-682 test, the extent of medium severity rutting in the right wheel path for all five runs is coincidentally near the 20% threshold between the “occasional” and “frequent” ratings. Runs 1 and 2 would have resulted in a medium-occasional rating, while Runs 3, 4, and 5 would have resulted in a medium-frequent rating. This variation is likely caused by the lateral position of the profiler vehicle in the lane and the exact location of each measurement. To compensate for this problem, an alternative rating system that considers the extent of rutting at all levels of severity may be appropriate. This is discussed further in the next section.
When compared to the profilometer and 8 ft straight edge, the LRMS showed a satisfactory level of accuracy and precision. With the exception of the profilometer data from the left wheel path of SR-682, the differences in measurements were statistically insignificant.
29
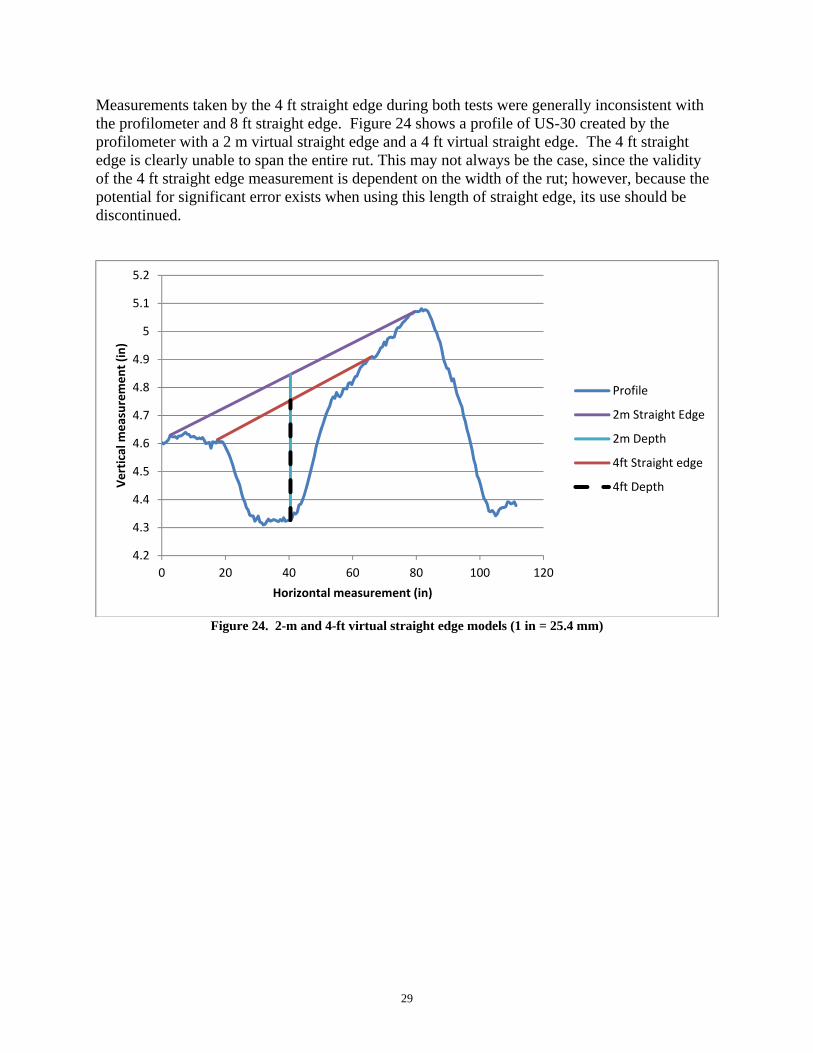
Measurements taken by the 4 ft straight edge during both tests were generally inconsistent with the profilometer and 8 ft straight edge. Figure 24 shows a profile of US-30 created by the profilometer with a 2 m virtual straight edge and a 4 ft virtual straight edge. The 4 ft straight edge is clearly unable to span the entire rut. This may not always be the case, since the validity of the 4 ft straight edge measurement is dependent on the width of the rut; however, because the potential for significant error exists when using this length of straight edge, its use should be discontinued.
Figure 24. 2-m and 4-ft virtual straight edge models (1 in = 25.4 mm)
4.2
4.3
4.4
4.5
4.6
4.7
4.8
4.9
5
5.1
5.2
0 20 40 60 80 100 120
Vertical m
easurement (in)
Horizontal measurement (in)
Profile
2m Straight Edge
2m Depth
4ft Straight edge
4ft Depth

30
4 LRMS and the ODOT pavement condition rating system
4.1 Procedure The PCR ratings for rutting based on S&G measurements were compared to data
collected in ODOT District 10 using the INO LRMS system on the Dynatest profiler. There were 397 locations found for which there exists a PCR score based on manual measurements as well as LRMS data. The following Ohio counties were represented in the data: Athens, Gallia, Hocking, Meigs, Monroe, Morgan, Noble, Vinton, and Washington.
The data files were imported into Microsoft Excel and separated into the necessary log point intervals to correspond with the S&G data. Each interval was assigned a PCR score based on rut depth and extent according to the key and rating form shown in Table 9 and Table 10. A summary of the scores for each site can be found in Appendix C.
Extraction of the PCR scores was done in Excel, using a spreadsheet that was pre-made to allow one to simply paste the data from the files created by the Dynatest software. To do this, each file (extension “.HDR”) was imported as a comma-delimited data set. The rows beginning with “5412” were isolated using the “sort” function, and then copied into the pre-made spreadsheet (lines beginning with “5412” indicate rut measurements in .HDR output files). The spreadsheet then counted the number of rut depth measurements that fell into each severity category and multiplied each of these counts by the measurement interval. These three numbers were divided by the overall length to find the extent of rutting in each severity category. The PCR rating key and rating form for flexible pavement from the ODOT PCR manual are shown in Figure 25 and Figure 26 (ODOT, 2006). The rating key and rating form for composite pavement differ slightly; however rutting is evaluated and scored the same way.

31
Figure 25. PCR rating key for flexible pavement (ODOT, 2006, p. 6)

32
Figure 26. PCR rating form for flexible pavement (ODOT, 2006, p. 7)

33
4.2 Results and discussion of comparison with S&G PCR ratings In Table 9, the distribution (percent) of PCR scores extracted from LRMS data, organized
by corresponding S&G ratings, is shown. A sizable portion of the LRMS scores are in the MO and HO categories. This may indicate that a major cause of the higher PCR scores derived from the LRMS is the effect of isolated areas of medium or severe rutting distresses. These areas are likely missed during the manual rut measurement process.
Table 9. Distribution of LRMS PCR scores by corresponding S&G rating
LRMS (%) none LO LF LE MO MF ME HO HF HE
S&G
none 15.26 10.00 3.16 0.53 28.95 5.79 2.11 33.16 1.05
LO 18.99 16.46 2.53 20.25 7.59 1.27 32.91
LF 21.54 18.46 40.00 4.62 3.08 10.77 1.54
LE 21.95 29.27 2.44 31.71 4.88 2.44 7.32
MO 5.26 31.58 10.53 52.63
MF 66.67 33.33
ME
HO
HF
HE
Table 10. Average LRMS PCR scores grouped by corresponding S&G score
Average
S&G
none (0) 4.03 LO (1.8) 3.70 LF (2.4) 3.26 LE (3.0) 2.80 MO (4.2) 5.17 MF (5.6) 4.80 ME (7.0) N/A HO (6.0) N/A HF (8.0) N/A HE (10.0) N/A
In order to more closely correlate the LRMS PCR with the S&G PCR, it may be necessary to reconsider the method used for rating pavements for rutting when the LRMS is used.

34
The high number and density of data points produced with the automated system might otherwise cause small segments of pavement with higher distresses to have the greatest influence on the overall score, regardless of whether the small segments are truly representative of the overall section.
Of the pavement sections measured with the LRMS that were rated as either MO or HO, 25.4% had rutting at the highest measured severity over less than 1% of the total pavement section length. 64.9% of these sections had rutting at the highest measured severity over less than 5% of the total length. To ensure that the pavement rating is an accurate description of a section’s overall conditions, a threshold for the “occasional” classification for extent may be more practical. For example: instead of an extent of 0-25% being classified as “occasional,” 1-25% or 5-25% might be more appropriate. The effect this might have on PCR score discrepancies between rating methods is shown in Table 11 and Table 12.
Table 11. Effect on the overall average difference between LRMS and S&G PCR scores when the lower boundary of “occasional” rating range is changed
Range for "occasional" classification
0-25% 1-25% 2-25% 3-25% 4-25% 5-25%
Average difference in PCR scores (LRMS-S&G)
2.467 2.121 1.872 1.722 1.575 1.485
Table 12. Effect on the average differences between LRMS and S&G PCR scores when the lower boundary
of “occasional” rating range is changed
Average PCR Score from LRMS
Range for “occasional” classification
0-25% 1-25% 5-25%
PC
R S
core
fro
m S
&G
none (0) 4.03 3.67 2.97 LO (1.8) 3.70 3.35 2.89 LF (2.4) 3.26 2.97 2.44 LE (3.0) 2.80 2.43 1.63 MO (4.2) 5.17 4.91 4.54 MF (5.6) 4.80 4.20 4.20 ME (7.0) N/A N/A N/A HO (6.0) N/A N/A N/A HF (8.0) N/A N/A N/A HE (10.0) N/A N/A N/A
As Table 11 demonstrates, the 5%-25% range for the “occasional” rating dramatically reduces the difference in PCR score between methods. Raising the lower boundary to 5% would allow the LRMS data to produce a PCR score that more accurately represents the state of the pavement section being examined. Spikes in the data that may be caused by errors or other types of pavement deterioration instead of actual rutting would be unlikely to influence the PCR score.

35
More importantly, small sections of heavy rutting that produce outliers in the data would not cause a mischaracterization of the overall pavement section. Although altering the range for the “occasional” rating reduces the impact of using the LRMS in lieu of S&G, there remains a notable difference in scores. Other changes could be devised to further reduce the difference in scores; however because the tests conducted on US-30 and SR-682 showed that the LRMS can produce accurate, reliable, and repeatable results, doing so would require altering data that is already assumed to be correct. The remaining difference in LRMS and S&G scores after changing the “occasional” rating criteria should be attributed to the high density of measurements gathered by the LRMS.
While the 5%-25 range for “occasional” rutting is recommended specifically for the PCR score, sections of pavement with increased rutting that are not extensive enough to exceed 5% of the overall length of the site should not be ignored. Such sections in the data that would not count towards the overall PCR score may represent isolated asphalt stability issues that need addressed as potential wet accident locations. These sections should be properly treated as high stress locations per ODOT guidelines during the next rehabilitation. The existence of localized areas of severe rutting can be determined by checking the extent of rutting at each severity level while analyzing the .HDR file. If such an area is present, it can be easily located in the data using the conditional formatting tool in Microsoft Excel. Once the location is found, a follow-up visual inspection of the site is recommended.
36
5 Summary and conclusions
5.1 Summary This study was conducted to assess the performance of the laser system and develop a
method for extracting PCR scores from rut depth data gathered with the LRMS. The Laser Rut Measurement System provides the Ohio Department of Transportation with a valuable tool for evaluating the condition of pavement infrastructure. The high density of measurements and the accuracy of the laser system allow for a much higher quality assessment of rutting distresses than the traditional manual measurement methods. The ODOT profiler vehicles also allow pavement raters to evaluate a pavement segment in a much shorter amount of time and in a safer manner. Manual measurement requires the pavement rater to be exposed to the hazards of traffic. The ODOT profiler vehicle has the ability to operate while moving with the flow of traffic, thereby dramatically reducing risk of injury. The effect of the length of the straight edge used for manual measurements was also examined.
To test the system’s performance, two tests were conducted on selected pavement sections. The first test was performed on a west-bound section of US-30 in Wayne County, Ohio. This section is heavily used and had undergone light rutting over most of its length, with the exception of a severely rutted 200-ft (60.96 m) section at the approach to its intersection with SR-94. This section of severe rutting was also measured using the profilometer, 8 ft straight edge, and 4 ft straight edge. ODOT provided LRMS data from five runs made with the profiler vehicle over a section approximately 1.53 mi (2.46 km) in length that included the 200-ft (60.96 m) test section. The second test was over a lightly used section of SR-682 in Athens County, Ohio. This segment of SR-682 had undergone low-to-medium rutting over its entire length. A 200-ft (60.96 m) section was selected and rut depth was measured using each of the four methods. Again, ODOT provided LRMS data from five runs over a section approximately 0.80 mi (1.29 km) in length that included the 200-ft (60.96 m) test section.
Statistical analyses were conducted on the data gathered from the two tests using ANOVA tests and Games-Howell post-hoc tests. The results of only the LRMS were examined for accuracy and repeatability, since the other methods were presumed accurate. The statistical analysis of the data from US-30 showed weak statistical similarity when the entire length of profiled pavement was considered. When only the 200-ft (60.96 m) test section was considered, strong statistical similarity was found. When the data from SR-682 was analyzed, statistical similarity between runs was found for the the entire pavement length as well as the 200-ft (60.96 m) test section at this site. The mean absolute deviations for the tests at SR-30 and SR-682 were 0.026 inches (0.660 mm) and 0.030 inches (0.762 mm) respectively. The distributions of measurements by PCR severity level over the entire pavement lengths show that the LRMS system is capable of producing the consistent and reliable PCR scores. Given that these tests were run under somewhat uncontrolled field conditions, it is believed that the results of these tests and analyses are evidence enough to conclude that the LRMS system produces repeatable and accurate results.
Rut depth data from the LRMS, profilometer, 8-ft S&G, and 4-ft S&G for the 200-ft (60.96 m) test sections were analyzed and compared using the ANOVA and Games-Howell tests to assess the precision of the LRMS system and to examine the impact of the shorter straight edge on rut depth measurements. With the exception of the left wheel path data from the profilometer on SR-682, the LRMS measurements at both sites strongly correlated with the profilometer and 8-ft S&G. The profilometer data from SR-682 were influenced by deterioration

37
in the left wheel path that caused the rut depth algorithm to interpret pits in the pavement surface as the bottom of the rut. These data were considered invalid and were disregarded. The strong statistical similarity found in the results of the ANOVA and Games-Howell tests indicate that the LRMS produces accurate rut depth measurements. The 4-ft S&G however did not show strong similarity to the other measurement methods. The shorter length did not allow the straight edge to fully span the width of the rut in many cases. To prevent error and inaccuracy, the 4-ft S&G should be replaced with a device that meets the criteria listed in ASTM E 1703/E 1703M (1995).
5.2 Recommendations The LRMS displayed sufficient precision, accuracy, and repeatability in this study and is
capable of producing reliable information for pavement evaluation purposes. To ensure that the system continues to operate properly, regular checks should be conducted. It is recommended that a section of light-use, low-traffic pavement with a range of rutting distress be selected for checks. The profiler vehicle should be run on this section monthly to ensure that readings are unchanging. More frequent checks may be necessary if the profiler is undergoing heavy use. Checks conducted less frequently may be misleading due to changes in the pavement surface caused by environment or its continued use.
PCR scores can be extracted from the Dynatest .HDR files using the method described in Section 4.1. To prevent small, isolated areas of heavier rutting from mischaracterizing the pavement section, a range of 5-25% is suggested for the “occasional” extent classification. These isolated areas that would not account for 5% or more of the section length should still be reported and considered when performing rehabilitation. The presence of isolated and localized sections of severe rutting is represented in the extent values calculated during the analysis of the rutting files.
Throughout the LRMS data gathered at both sites, there are short sections where one of the five runs produces significantly lower rut depth values than the others. It is suspected that this was a result of the profiler vehicle wandering laterally. Further study may be needed to determine the extent to which this may affect results. It is important that the LRMS operators attempt to keep the vehicle traveling within the existing wheel paths to improve the likelyhood of consistent results.

38
7 References ASTM (2000). “Standard test method for measuring rut-depth of pavement surfaces using a
straightedge” (ASTM Standard E 1703/E 1703M, 1995). West Conshohocken, PA: ASTM International, 1995, DOI: 10.1520/E1703_E1703M-95R05, www.astm.org.
Bennett, C. R. (2002). “Establishing reference transverse profiles for rut depth measurements in
New Zealand.” Motueka, New Zealand: Data Collection Limited. Bennett, C.R. & Wang, H., (2002a). “Harmonizing automated rut depth measurements.” Report
to Transfund New Zealand. Federal Highway Administration, U.S. Department of Transportation (2001). “Adequacy of rut
bar data collection” (FHWA Techbrief Publication No. FHWA-RD-01-27). McLean, VA: Turner-Fairbank Highway Research Center.
Grondin, M., Leroux, D., & Laurent, J. (2002). “Advanced 3D technology for rut measurements:
apparatus on board of the Quebec ministry of transportation multifunction vehicle.” Quebec, Canada: Ministére des Transports du Québec, Canada.
Hoffman, B. (2011). “Evaluation of the automated rut measurement system used by the Ohio
Department of Transportation.” Unpublished master’s thesis, Ohio University Miller, J.S. & Bellinger, W.Y. (2003, June). Distress identification maunal for the long-term
pavement performance program (fourth revised edition) (Report No. FHWA-RD-03-031). McLean, VA: Office of Infrastructure Research and Development.
Ohio Department of Transportation (ODOT), (2006), Pavement Condition Rating Manual, Ohio
Department of Transportation, Columbus OH, April, 2006. Richardson, W. (2003). “Design and operation of the ORITE profilometer.” Unpublished
technical report, Athens, OH: Ohio Research Institute for Transportation and the Environment.
Vedula, K., Hossain, M., Reigle, J., & Miller, R. (2002, 21 October). “Comparison of 3-point
and 5-point rut depth data analysis.” Kansas State University: Offered for Presentation in Pavement Evaluation 2002 Conference, Roanoke, Virgina.
Walker, Roger S. (2004). “Implementation of the real-time transverse pavement profile
measurement system: comprehensive report” (Report No. FHWA/TX-06/5-1782-01-1). Arlington, TX: The University of Texas at Arlington, Transportation Instrumentation Laboratory.
Wang, H. (2005). “Development of laser system to measure pavement rutting.” Unpublished
master’s thesis, University of South Florida.

39
Yoder, E., & Witczak, M. (1975). Principles of pavement design. New York: Wiley.

40
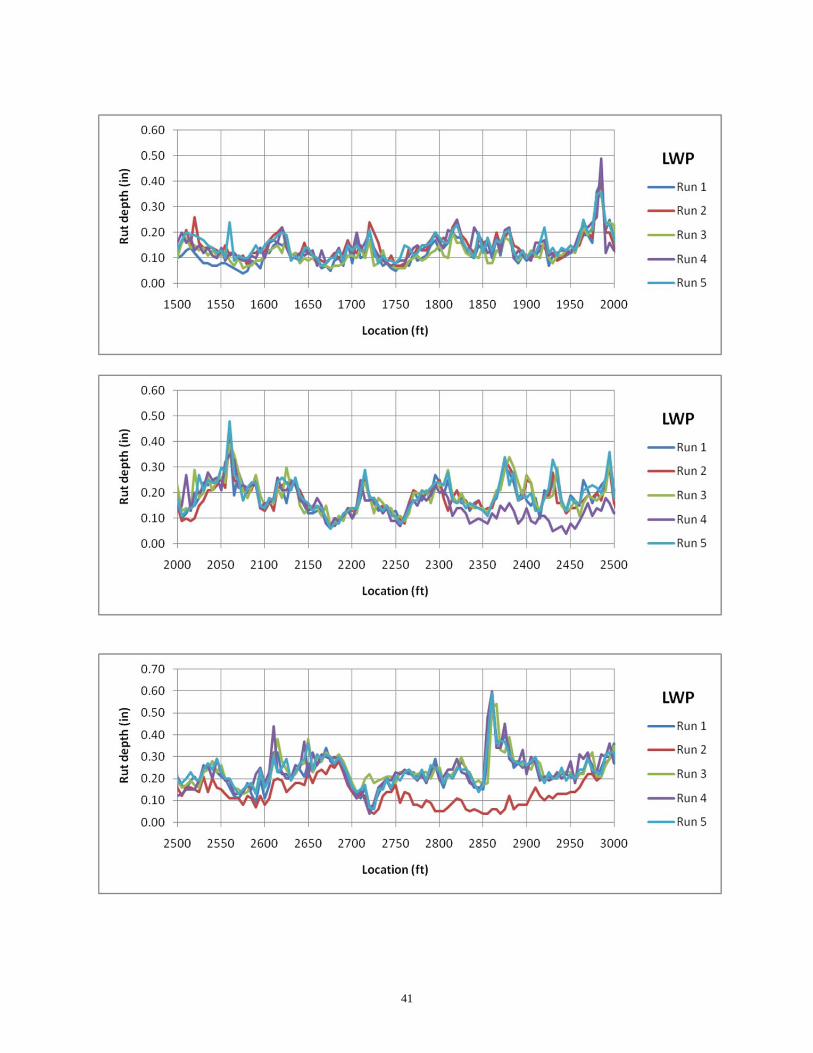
Appendix A: US-30 Rut Measurements (1 in = 25.4 mm; 100 ft = 30.48 m)
LWP = Left Wheel Path
41

42

43

44

45
46
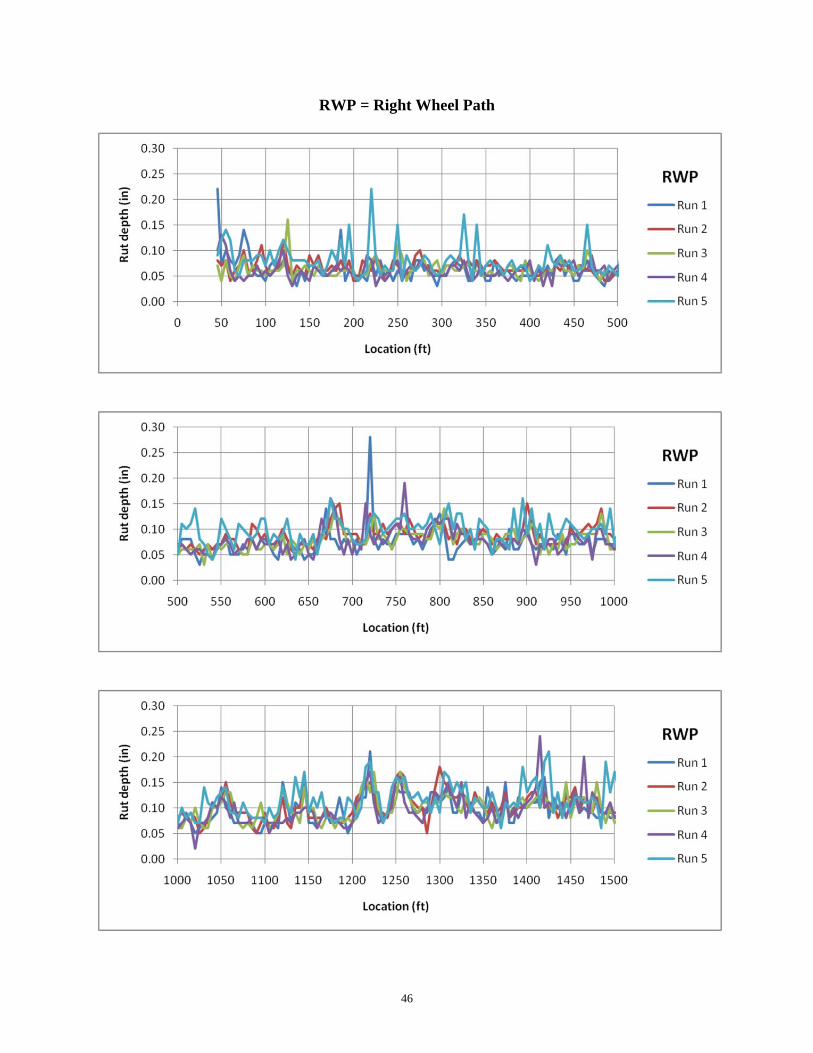
RWP = Right Wheel Path
47

48

49

50

51

52
Appendix B: SR-682 Rut Measurements (1 in = 25.4 mm; 100 ft = 30.48 m)
LWP = Left Wheel Path
53
54

55

56
RWP = Right Wheel Path

57

58

59
Appendix C: PCR Data from District 10 (S&G and LRMS)
County Abbrev
Trans Route
Milepost Segment Length (mi)**
Pavement Type
PCR Ratings PCR Scores
Start End S&G LRMSLRMS (adj*) S&G LRMS
LRMS (adj*)
ATH SR 00143 0 0.79 0.79 FLEXIBLE 0 0 0
ATH SR 00144 0 4.63 4.63 FLEXIBLE HO HO 0 6 6
ATH SR 00144 4.63 8.37 3.74 FLEXIBLE MO LO 0 4.2 1.8
ATH SR 00144 8.37 13.84 5.47 FLEXIBLE HO MO 0 6 4.2
ATH SR 00144 13.84 14.61 0.77 FLEXIBLE HO MF 0 6 5.6
ATH SR 00681 7.28 7.79 0.51 FLEXIBLE 0 0 0
ATH SR 00681 7.79 10.49 2.7 FLEXIBLE LO 0 1.8 0
ATH SR 00124 0 3.33 3.33 FLEXIBLE LO HO LO 1.8 6 1.8
ATH SR 00681 0 6.61 6.61 FLEXIBLE LO LF LF 1.8 2.4 2.4
ATH SR 00681 6.61 7.28 0.67 FLEXIBLE LO 1.8 0 0
ATH SR 00078 3.38 7.2 3.82 FLEXIBLE LF MO LO 2.4 4.2 1.8
ATH SR 00078 7.2 8.35 1.15 FLEXIBLE LF LO LO 2.4 1.8 1.8
ATH SR 00078 9.37 10.37 1 FLEXIBLE LF LO 2.4 1.8 0
ATH SR 00078 10.37 10.88 0.51 FLEXIBLE LF MO LF 2.4 4.2 2.4
ATH SR 00356 0 4.77 4.77 FLEXIBLE MO MO LO 4.2 4.2 1.8
ATH SR 00013 12.88 15.44 2.56 COMPOSITE MO HO MF 4.2 6 5.6
GAL SR 00141 0 7.74 7.74 FLEXIBLE HO MO 0 6 4.2
GAL SR 00141 7.74 9.04 1.3 FLEXIBLE MO MO 0 4.2 4.2
GAL SR 00141 9.04 16.03 6.99 FLEXIBLE HO LO 0 6 1.8
GAL SR 00141 16.03 20.82 4.79 FLEXIBLE MO LO 0 4.2 1.8
GAL SR 00141 20.82 21.55 0.73 FLEXIBLE HO MO 0 6 4.2
GAL SR 00218 0 3.89 3.89 FLEXIBLE HO MF 0 6 5.6
GAL SR 00218 3.89 7.55 3.66 FLEXIBLE HO MO 0 6 4.2
GAL SR 00218 7.55 11.6 4.05 FLEXIBLE MO MO 0 4.2 4.2
GAL SR 00218 11.6 13.83 2.23 FLEXIBLE HO MF 0 6 5.6
GAL SR 00218 13.83 17.09 3.26 FLEXIBLE MO MO 0 4.2 4.2
GAL SR 00233 0 7.92 7.92 FLEXIBLE HO LO 0 6 1.8
GAL SR 00325 0 6.53 6.53 FLEXIBLE 0 0 0
GAL SR 00325 6.53 7.26 0.73 FLEXIBLE 0 0 0
GAL SR 00325 12.02 14.18 2.16 FLEXIBLE LO 0 1.8 0
GAL SR 00553 0 0.31 0.31 FLEXIBLE 0 0 0
GAL SR 00141 21.55 22.15 0.6 FLEXIBLE LO HO MO 1.8 6 4.2
* Adjusted for 5‐25% range for "occasional" classification
** 1 mi = 1.61 km

60
County Abbrev
Trans Route
Milepost Segment Length (mi)**
Pavement Type
PCR Ratings PCR Scores
Start End S&G LRMSLRMS (adj*) S&G LRMS
LRMS (adj*)
GAL SR 00325 7.26 12.02 4.76 FLEXIBLE LO LO 1.8 1.8 0
GAL SR 00553 0.31 2.33 2.02 FLEXIBLE LF 2.4 0 0
HOC SR 00056 0.53 9.44 8.91 FLEXIBLE MO LO 0 4.2 1.8
HOC SR 00093 0 7.31 7.31 FLEXIBLE HO MO 0 6 4.2
HOC SR 00093 7.31 9.94 2.63 FLEXIBLE HO HO 0 6 6
HOC SR 00093 9.94 12.25 2.31 FLEXIBLE HO MO 0 6 4.2
HOC SR 00093 13.68 18.34 4.66 FLEXIBLE HO MF 0 6 5.6
HOC SR 00093 18.34 19.86 1.52 FLEXIBLE MO MO 0 4.2 4.2
HOC SR 00093 19.86 23.47 3.61 FLEXIBLE HO MO 0 6 4.2
HOC SR 00180 0.05 0.39 0.34 FLEXIBLE MO MO 0 4.2 4.2
HOC SR 00278 0 0.25 0.25 FLEXIBLE MO MO 0 4.2 4.2
HOC SR 00278 0.34 5.38 5.04 FLEXIBLE HO MO 0 6 4.2
HOC SR 00312 0 0.4 0.4 FLEXIBLE LO 0 1.8 0
HOC SR 00327 3.8 4.56 0.76 FLEXIBLE 0 0 0
HOC SR 00328 1.75 4.35 2.6 FLEXIBLE HO MO 0 6 4.2
HOC SR 00328 4.35 6.3 1.95 FLEXIBLE MO MO 0 4.2 4.2
HOC SR 00328 6.3 10.67 4.37 FLEXIBLE MO MO 0 4.2 4.2
HOC SR 00374 3.74 6.15 2.41 FLEXIBLE MO MO 0 4.2 4.2
HOC SR 00374 6.15 12.97 6.82 FLEXIBLE HO HO 0 6 6
HOC SR 00374 12.97 13.29 0.32 FLEXIBLE HF HF 0 8 8
HOC SR 00374 17.91 25.3 7.39 FLEXIBLE HO MO 0 6 4.2
HOC SR 00595 3.03 7.08 4.05 FLEXIBLE HO HO 0 6 6
HOC SR 00664 0 2.9 2.9 FLEXIBLE LO 0 1.8 0
HOC SR 00678 0 4 4 FLEXIBLE HO MO 0 6 4.2
HOC SR 00056 0 0.53 0.53 FLEXIBLE LO HO MO 1.8 6 4.2
HOC SR 00056 14.96 21.29 6.33 FLEXIBLE LO HO MF 1.8 6 5.6
HOC SR 00093 13.08 13.68 0.6 FLEXIBLE LO LF LF 1.8 2.4 2.4
HOC SR 00180 0.39 2.36 1.97 FLEXIBLE LO HO MO 1.8 6 4.2
HOC SR 00180 2.36 7.35 4.99 FLEXIBLE LO HO MO 1.8 6 4.2
HOC SR 00180 16.08 16.32 0.24 FLEXIBLE LO MO MO 1.8 4.2 4.2
HOC SR 00216 0 4.68 4.68 FLEXIBLE LO HO MF 1.8 6 5.6
HOC SR 00327 0 3.8 3.8 FLEXIBLE LO LO LO 1.8 1.8 1.8
* Adjusted for 5‐25% range for "occasional" classification
** 1 mi = 1.61 km

61
County Abbrev
Trans Route
Milepost Segment Length (mi)**
Pavement Type
PCR Ratings PCR Scores
Start End S&G LRMSLRMS (adj*) S&G LRMS
LRMS (adj*)
HOC SR 00664 16.33 21.61 5.28 FLEXIBLE LO LO 1.8 1.8 0
HOC SR 00664 21.61 24.5 2.89 FLEXIBLE LO LO 1.8 1.8 0
HOC SR 00093 12.62 13.08 0.46 FLEXIBLE LF MO MO 2.4 4.2 4.2
HOC SR 00664 5.31 12.07 6.76 FLEXIBLE LF MO MO 2.4 4.2 4.2
HOC SR 00664 12.07 15.05 2.98 FLEXIBLE LF HO MO 2.4 6 4.2
HOC SR 00664 15.93 16.33 0.4 FLEXIBLE LF LO 2.4 1.8 0
HOC SR 00664 15.05 15.93 0.88 FLEXIBLE LE HO HO 3 6 6
HOC SR 00180 7.35 14.43 7.08 FLEXIBLE MO HO MF 4.2 6 5.6
HOC SR 00180 14.43 16.08 1.65 FLEXIBLE MO MO MO 4.2 4.2 4.2
HOC SR 00374 0 3.74 3.74 FLEXIBLE MO MO MO 4.2 4.2 4.2
MEG SR 00124 8.71 12.15 3.44 FLEXIBLE HO LO 0 6 1.8
MEG SR 00124 20.66 20.8 0.14 FLEXIBLE LF LF 0 2.4 2.4
MEG SR 00124 20.8 20.94 0.14 FLEXIBLE 0 0 0
MEG SR 00124 29.55 31.46 1.91 FLEXIBLE MO LO 0 4.2 1.8
MEG SR 00124 31.9 36.74 4.84 FLEXIBLE MO LO 0 4.2 1.8
MEG SR 00124 36.74 38.55 1.81 FLEXIBLE MO LO 0 4.2 1.8
MEG SR 00124 38.55 42.02 3.47 FLEXIBLE MO LO 0 4.2 1.8
MEG SR 00124 42.02 45.04 3.02 FLEXIBLE MO LO 0 4.2 1.8
MEG SR 00124 45.04 45.63 0.59 FLEXIBLE MO LO 0 4.2 1.8
MEG SR 00124 45.63 45.91 0.28 FLEXIBLE LO 0 1.8 0
MEG SR 00124 51.22 57.29 6.07 FLEXIBLE LO LO 0 1.8 1.8
MEG SR 00124 62.29 66.18 3.89 FLEXIBLE MO LO 0 4.2 1.8
MEG SR 00124 66.18 66.93 0.75 FLEXIBLE 0 0 0
MEG SR 00143 1.05 8.25 7.2 FLEXIBLE HO MO 0 6 4.2
MEG SR 00143 15.5 19.36 3.86 FLEXIBLE HO HO 0 6 6
MEG SR 00248 0 9.15 9.15 FLEXIBLE MO LO 0 4.2 1.8
MEG SR 00681 0 4.76 4.76 FLEXIBLE MO LO 0 4.2 1.8
MEG SR 00681 4.76 9.06 4.3 FLEXIBLE MO 0 4.2 0
MEG SR 00681 9.06 9.7 0.64 FLEXIBLE 0 0 0
MEG SR 00681 9.7 17.49 7.79 FLEXIBLE MO LO 0 4.2 1.8
MEG SR 00681 17.49 21.16 3.67 FLEXIBLE MO 0 4.2 0
MEG SR 00684 0.58 2.97 2.39 FLEXIBLE MF MF 0 5.6 5.6
* Adjusted for 5‐25% range for "occasional" classification
** 1 mi = 1.61 km

62
County Abbrev
Trans Route
Milepost Segment Length (mi)**
Pavement Type
PCR Ratings PCR Scores
Start End S&G LRMSLRMS (adj*) S&G LRMS
LRMS (adj*)
MEG SR 00689 0 4.16 4.16 FLEXIBLE MF MF 0 5.6 5.6
MEG SR 00692 0 3.19 3.19 FLEXIBLE MO MO 0 4.2 4.2
MEG SR 00833 0.08 0.37 0.29 COMPOSITE 0 0 0
MEG SR 00833 0.37 2.84 2.47 COMPOSITE MO LO 0 4.2 1.8
MEG SR 00124 0 8.71 8.71 FLEXIBLE LO HO MF 1.8 6 5.6
MEG SR 00124 23.74 29.04 5.3 FLEXIBLE LO MO MO 1.8 4.2 4.2
MEG SR 00124 29.04 29.55 0.51 FLEXIBLE LO MO LO 1.8 4.2 1.8
MEG SR 00124 45.91 47.36 1.45 FLEXIBLE LO MO MO 1.8 4.2 4.2
MEG SR 00124 47.36 51.22 3.86 FLEXIBLE LO LO LO 1.8 1.8 1.8
MEG SR 00124 57.29 62.29 5 FLEXIBLE LO MO LO 1.8 4.2 1.8
MEG SR 00681 21.16 28.94 7.78 FLEXIBLE LO LO LO 1.8 1.8 1.8
MEG SR 00124 22.52 22.73 0.21 FLEXIBLE LF LO LO 2.4 1.8 1.8
MOE SR 00007 0.33 0.83 0.5 FLEXIBLE LO LO 0 1.8 1.8
MOE SR 00007 1.09 2.06 0.97 FLEXIBLE LO LO 0 1.8 1.8
MOE SR 00007 12.41 13.37 0.96 FLEXIBLE MO MO 0 4.2 4.2
MOE SR 00026 0 5.56 5.56 FLEXIBLE HO MO 0 6 4.2
MOE SR 00026 5.56 7.76 2.2 FLEXIBLE HO MO 0 6 4.2
MOE SR 00026 7.76 12.64 4.88 FLEXIBLE HO HO 0 6 6
MOE SR 00026 12.64 14.76 2.12 FLEXIBLE HO HO 0 6 6
MOE SR 00026 14.76 16.42 1.66 FLEXIBLE MF MF 0 5.6 5.6
MOE SR 00026 16.42 17.14 0.72 FLEXIBLE MO LF 0 4.2 2.4
MOE SR 00026 17.14 17.98 0.84 FLEXIBLE HO MO 0 6 4.2
MOE SR 00026 21.37 29.7 8.33 FLEXIBLE HO MF 0 6 5.6
MOE SR 00026 29.7 30.35 0.65 FLEXIBLE HO MF 0 6 5.6
MOE SR 00078 0 2.03 2.03 FLEXIBLE HO MO 0 6 4.2
MOE SR 00078 7.46 8.13 0.67 FLEXIBLE MO MO 0 4.2 4.2
MOE SR 00078 8.13 8.78 0.65 FLEXIBLE HO MF 0 6 5.6
MOE SR 00078 16.42 17.24 0.82 FLEXIBLE MF MF 0 5.6 5.6
MOE SR 00078 17.24 23.5 6.26 FLEXIBLE HO MF 0 6 5.6
MOE SR 00078 23.5 27.8 4.3 FLEXIBLE ME MF 0 7 5.6
MOE SR 00145 0 0.79 0.79 FLEXIBLE MO LF 0 4.2 2.4
MOE SR 00145 0.79 7.37 6.58 FLEXIBLE HO MO 0 6 4.2
* Adjusted for 5‐25% range for "occasional" classification
** 1 mi = 1.61 km

63
County Abbrev
Trans Route
Milepost Segment Length (mi)**
Pavement Type
PCR Ratings PCR Scores
Start End S&G LRMSLRMS (adj*) S&G LRMS
LRMS (adj*)
MOE SR 00145 7.37 8.5 1.13 FLEXIBLE ME MF 0 7 5.6
MOE SR 00145 8.5 15.36 6.86 FLEXIBLE HO MF 0 6 5.6
MOE SR 00145 15.36 20.4 5.04 FLEXIBLE MO MO 0 4.2 4.2
MOE SR 00145 20.4 21.41 1.01 FLEXIBLE 0 0 0
MOE SR 00145 22.06 24.47 2.41 FLEXIBLE MO MO 0 4.2 4.2
MOE SR 00145 24.47 25.8 1.33 FLEXIBLE HO MO 0 6 4.2
MOE SR 00255 0 8.87 8.87 FLEXIBLE HO HO 0 6 6
MOE SR 00260 4.33 5.52 1.19 FLEXIBLE HO HO 0 6 6
MOE SR 00260 5.52 8.73 3.21 FLEXIBLE HF HF 0 8 8
MOE SR 00260 8.73 11.32 2.59 FLEXIBLE HO HO 0 6 6
MOE SR 00379 0 1.85 1.85 FLEXIBLE HO HO 0 6 6
MOE SR 00536 0.64 12.58 11.94 FLEXIBLE HO MF 0 6 5.6
MOE SR 00565 0 4.1 4.1 FLEXIBLE HO MF 0 6 5.6
MOE SR 00800 17.92 18.39 0.47 FLEXIBLE 0 0 0
MOE SR 00800 18.39 23.09 4.7 FLEXIBLE 0 0 0
MOE SR 00800 23.09 26.04 2.95 FLEXIBLE LO 0 1.8 0
MOE SR 00007 0 0.33 0.33 COMPOSITE LF LF 0 2.4 2.4
MOE SR 00007 0.83 1.09 0.26 COMPOSITE LE LF 0 3 2.4
MOE SR 00007 2.06 2.21 0.15 COMPOSITE LF LF 0 2.4 2.4
MOE SR 00007 8.5 12.41 3.91 COMPOSITE MO MO 0 4.2 4.2
MOE SR 00007 13.37 13.95 0.58 COMPOSITE LO 0 1.8 0
MOE SR 00007 13.95 21.32 7.37 COMPOSITE MO MO 0 4.2 4.2
MOE SR 00007 21.32 22.73 1.41 COMPOSITE ME MF 0 7 5.6
MOE SR 00007 25.23 28.55 3.32 COMPOSITE MO MO 0 4.2 4.2
MOE SR 00078 9.17 14.35 5.18 COMPOSITE MF MF 0 5.6 5.6
MOE SR 00078 14.35 15.33 0.98 COMPOSITE 0 0 0
MOE SR 00536 0 0.24 0.24 COMPOSITE MF MF 0 5.6 5.6
MOE SR 00026 17.98 21.37 3.39 FLEXIBLE LO MF MF 1.8 5.6 5.6
MOE SR 00078 2.03 7.46 5.43 FLEXIBLE LO HO HO 1.8 6 6
MOE SR 00078 27.8 32.26 4.46 FLEXIBLE LO MF MF 1.8 5.6 5.6
MOE SR 00379 1.85 4.67 2.82 FLEXIBLE LO HO HO 1.8 6 6
MOE SR 00379 4.67 8.07 3.4 FLEXIBLE LO HO HO 1.8 6 6
* Adjusted for 5‐25% range for "occasional" classification
** 1 mi = 1.61 km

64
County Abbrev
Trans Route
Milepost Segment Length (mi)**
Pavement Type
PCR Ratings PCR Scores
Start End S&G LRMSLRMS (adj*) S&G LRMS
LRMS (adj*)
MOE SR 00537 0 4.98 4.98 FLEXIBLE LO HO HO 1.8 6 6
MOE SR 00078 8.78 9.17 0.39 COMPOSITE LO MO LF 1.8 4.2 2.4
MOE SR 00078 15.33 15.72 0.39 COMPOSITE LO LO 1.8 1.8 0
MOE SR 00078 15.72 16.42 0.7 FLEXIBLE MO MF MF 4.2 5.6 5.6
MOE SR 00007 2.21 8.5 6.29 COMPOSITE MF HO LO 5.6 6 1.8
MRG SR 00078 0 8.81 8.81 FLEXIBLE HO MO 0 6 4.2
MRG SR 00078 8.81 10.25 1.44 FLEXIBLE MO MO 0 4.2 4.2
MRG SR 00078 26.04 27.8 1.76 FLEXIBLE MO LO 0 4.2 1.8
MRG SR 00083 10.32 15.58 5.26 FLEXIBLE HO MO 0 6 4.2
MRG SR 00376 9.99 11.1 1.11 FLEXIBLE MO LO 0 4.2 1.8
MRG SR 00376 11.1 13.24 2.14 FLEXIBLE HO MO 0 6 4.2
MRG SR 00376 13.24 18.4 5.16 FLEXIBLE HO MO 0 6 4.2
MRG SR 00376 18.4 19.43 1.03 FLEXIBLE HO 0 6 0
MRG SR 00078 10.25 15.69 5.44 FLEXIBLE LO MO MO 1.8 4.2 4.2
MRG SR 00078 15.69 16.8 1.11 FLEXIBLE LO MO MO 1.8 4.2 4.2
MRG SR 00060 17.99 21.82 3.83 COMPOSITE LO 1.8 0 0
MRG SR 00060 2.01 2.34 0.33 FLEXIBLE LF MO MO 2.4 4.2 4.2
MRG SR 00060 11.56 12.02 0.46 FLEXIBLE LF LO LO 2.4 1.8 1.8
MRG SR 00060 12.19 12.48 0.29 FLEXIBLE LF 2.4 0 0
MRG SR 00078 19.35 23.65 4.3 FLEXIBLE LF HO MO 2.4 6 4.2
MRG SR 00078 23.65 26.04 2.39 FLEXIBLE LF HO MO 2.4 6 4.2
MRG SR 00669 5.62 11.9 6.28 FLEXIBLE LF HO MF 2.4 6 5.6
MRG SR 00669 11.9 13.18 1.28 FLEXIBLE LF MO LF 2.4 4.2 2.4
MRG SR 00669 13.18 19.03 5.85 FLEXIBLE LF MO LF 2.4 4.2 2.4
MRG SR 00669 19.03 19.43 0.4 FLEXIBLE LF MO LO 2.4 4.2 1.8
MRG SR 00060 0 2.01 2.01 COMPOSITE LF 2.4 0 0
MRG SR 00060 2.34 3.32 0.98 COMPOSITE LF 2.4 0 0
MRG SR 00060 3.73 4.01 0.28 COMPOSITE LF 2.4 0 0
MRG SR 00060 4.01 9.36 5.35 COMPOSITE LF MO LO 2.4 4.2 1.8
MRG SR 00060 12.02 12.19 0.17 COMPOSITE LF 2.4 0 0
MRG SR 00060 12.86 17.99 5.13 COMPOSITE LF 2.4 0 0
MRG SR 00060 3.32 3.73 0.41 FLEXIBLE LE 3 0 0
* Adjusted for 5‐25% range for "occasional" classification
** 1 mi = 1.61 km

65
County Abbrev
Trans Route
Milepost Segment Length (mi)**
Pavement Type
PCR Ratings PCR Scores
Start End S&G LRMSLRMS (adj*) S&G LRMS
LRMS (adj*)
MRG SR 00669 0 0.44 0.44 FLEXIBLE LE HO MO 3 6 4.2
MRG SR 00060 11.23 11.56 0.33 COMPOSITE LE MO 3 4.2 0
MRG SR 00060 12.48 12.86 0.38 COMPOSITE LE 3 0 0
MRG SR 00078 18.88 19.35 0.47 FLEXIBLE MO LO 4.2 1.8 0
MRG SR 00078 27.8 30.58 2.78 FLEXIBLE MO HO MO 4.2 6 4.2
MRG SR 00284 0 4.05 4.05 FLEXIBLE MO MO LO 4.2 4.2 1.8
MRG SR 00555 23.02 27.12 4.1 FLEXIBLE MO HO MO 4.2 6 4.2
MRG SR 00669 0.44 2.65 2.21 FLEXIBLE MO HO MO 4.2 6 4.2
MRG SR 00060 9.36 11.23 1.87 COMPOSITE MO MO MO 4.2 4.2 4.2
NOB SR 00078 16.04 20.09 4.05 FLEXIBLE MO 0 4.2 0
NOB SR 00078 20.09 21.35 1.26 FLEXIBLE MO LO 0 4.2 1.8
NOB SR 00083 0 6.77 6.77 FLEXIBLE HO MO 0 6 4.2
NOB SR 00146 8.15 8.38 0.23 FLEXIBLE LF LF 0 2.4 2.4
NOB SR 00146 8.38 8.85 0.47 FLEXIBLE MO MO 0 4.2 4.2
NOB SR 00146 8.85 9.4 0.55 FLEXIBLE MO MO 0 4.2 4.2
NOB SR 00146 9.4 18.02 8.62 FLEXIBLE HO MO 0 6 4.2
NOB SR 00146 18.02 18.59 0.57 FLEXIBLE LF LF 0 2.4 2.4
NOB SR 00147 17.03 21.04 4.01 FLEXIBLE HO MO 0 6 4.2
NOB SR 00260 12.13 14.35 2.22 FLEXIBLE HO MO 0 6 4.2
NOB SR 00265 0 0.32 0.32 FLEXIBLE ME MF 0 7 5.6
NOB SR 00821 7.33 7.62 0.29 FLEXIBLE LO 0 1.8 0
NOB SR 00078 7.89 12.51 4.62 COMPOSITE 0 0 0
NOB SR 00078 12.51 16.04 3.53 COMPOSITE MF MF 0 5.6 5.6
NOB SR 00821 0.84 1.36 0.52 COMPOSITE HO LO 0 6 1.8
NOB SR 00821 1.36 2.18 0.82 COMPOSITE MO 0 4.2 0
NOB SR 00821 2.18 7.33 5.15 COMPOSITE LO 0 1.8 0
NOB SR 00821 12.57 12.77 0.2 COMPOSITE LO LO 0 1.8 1.8
NOB SR 00146 0 0.85 0.85 FLEXIBLE LO HO MF 1.8 6 5.6
NOB SR 00260 0 1.9 1.9 FLEXIBLE LO HO HO 1.8 6 6
NOB SR 00260 3.77 11.1 7.33 FLEXIBLE LO HO MO 1.8 6 4.2
NOB SR 00260 11.1 12.13 1.03 FLEXIBLE LO MO LO 1.8 4.2 1.8
NOB SR 00313 0 1.25 1.25 FLEXIBLE LO HO MF 1.8 6 5.6
* Adjusted for 5‐25% range for "occasional" classification
** 1 mi = 1.61 km

66
County Abbrev
Trans Route
Milepost Segment Length (mi)**
Pavement Type
PCR Ratings PCR Scores
Start End S&G LRMSLRMS (adj*) S&G LRMS
LRMS (adj*)
NOB SR 00313 1.25 6.21 4.96 FLEXIBLE LO HO MF 1.8 6 5.6
NOB SR 00340 0.71 7.08 6.37 FLEXIBLE LO HO MO 1.8 6 4.2
NOB SR 00513 5.57 9.38 3.81 FLEXIBLE LO HO MF 1.8 6 5.6
NOB SR 00513 9.46 10.1 0.64 FLEXIBLE LO HO MF 1.8 6 5.6
NOB SR 00564 4.32 8.91 4.59 FLEXIBLE LO MO LO 1.8 4.2 1.8
NOB SR 00564 8.91 10.66 1.75 FLEXIBLE LO MO LO 1.8 4.2 1.8
NOB SR 00724 0 2.75 2.75 FLEXIBLE LO MF MF 1.8 5.6 5.6
NOB SR 00761 0 1.9 1.9 FLEXIBLE LO MF MF 1.8 5.6 5.6
NOB SR 00821 0 0.84 0.84 COMPOSITE LO MO 1.8 4.2 0
NOB SR 00145 0 9.18 9.18 FLEXIBLE LF HO MO 2.4 6 4.2
NOB SR 00145 9.18 12.39 3.21 FLEXIBLE LF MO MO 2.4 4.2 4.2
NOB SR 00564 0.01 1.44 1.43 FLEXIBLE LF MO LF 2.4 4.2 2.4
NOB SR 00564 1.44 4.32 2.88 FLEXIBLE LF MO MO 2.4 4.2 4.2
NOB SR 00564 10.66 13.48 2.82 FLEXIBLE LF LO LO 2.4 1.8 1.8
NOB SR 00565 0 2.88 2.88 FLEXIBLE LF MO MO 2.4 4.2 4.2
NOB SR 00821 11.97 12.24 0.27 FLEXIBLE LF MO 2.4 4.2 0
NOB SR 00821 16.55 21.36 4.81 FLEXIBLE LF MO MO 2.4 4.2 4.2
NOB SR 00821 13.22 16.55 3.33 COMPOSITE LF MO MO 2.4 4.2 4.2
NOB SR 00821 13.09 13.22 0.13 FLEXIBLE LE MO MO 3 4.2 4.2
NOB SR 00821 8.3 8.62 0.32 COMPOSITE LE MO LO 3 4.2 1.8
NOB SR 00821 12.77 13.09 0.32 COMPOSITE LE MF MF 3 5.6 5.6
NOB SR 00146 0.85 8.15 7.3 FLEXIBLE MO HO MF 4.2 6 5.6
NOB SR 00340 0 0.71 0.71 FLEXIBLE MO MF MF 4.2 5.6 5.6
NOB SR 00513 0 0.42 0.42 FLEXIBLE MO HO HO 4.2 6 6
NOB SR 00513 0.42 5.57 5.15 FLEXIBLE MO HO HO 4.2 6 6
NOB SR 00513 10.1 12.45 2.35 FLEXIBLE MO HO MF 4.2 6 5.6
NOB SR 00672 0 0.37 0.37 FLEXIBLE MO HO MF 4.2 6 5.6
NOB SR 00821 7.62 8.3 0.68 COMPOSITE MO MO LO 4.2 4.2 1.8
NOB SR 00821 8.62 9 0.38 FLEXIBLE MF MO MO 5.6 4.2 4.2
NOB SR 00821 12.24 12.57 0.33 FLEXIBLE MF MO LO 5.6 4.2 1.8
VIN SR 00056 3.2 7.65 4.45 FLEXIBLE 0 0 0
VIN SR 00327 0 2.24 2.24 FLEXIBLE 0 0 0
* Adjusted for 5‐25% range for "occasional" classification
** 1 mi = 1.61 km

67
County Abbrev
Trans Route
Milepost Segment Length (mi)**
Pavement Type
PCR Ratings PCR Scores
Start End S&G LRMSLRMS (adj*) S&G LRMS
LRMS (adj*)
VIN SR 00056 0 3.2 3.2 FLEXIBLE LO 1.8 0 0
VIN SR 00327 2.24 4.94 2.7 FLEXIBLE LO 1.8 0 0
VIN SR 00671 0 4.58 4.58 FLEXIBLE LO LO 1.8 1.8 0
VIN SR 00689 0 3.36 3.36 FLEXIBLE LO MO MO 1.8 4.2 4.2
VIN SR 00327 6.89 13.56 6.67 FLEXIBLE LF MO 2.4 4.2 0
VIN US 00050 4.91 9.19 4.28 FLEXIBLE 0 0 0
VIN US 00050 12.08 13.67 1.59 FLEXIBLE 0 0 0
VIN US 00050 0 4.91 4.91 COMPOSITE 0 0 0
VIN US 00050 9.19 10.68 1.49 COMPOSITE 0 0 0
VIN US 00050 17.75 18.23 0.48 COMPOSITE 0 0 0
VIN US 00050 18.23 19.76 1.53 COMPOSITE MO 0 4.2 0
VIN US 00050 13.67 16.34 2.67 FLEXIBLE LO 1.8 0 0
VIN US 00050 16.34 16.56 0.22 COMPOSITE LO 1.8 0 0
VIN US 00050 23.1 26.5 3.4 COMPOSITE LO LO 1.8 1.8 0
VIN US 00050 26.5 30.16 3.66 COMPOSITE LO LO 1.8 1.8 0
VIN US 00050 10.68 12.08 1.4 FLEXIBLE LF LO 2.4 1.8 0
VIN US 00050 17.58 17.75 0.17 FLEXIBLE LF 2.4 0 0
VIN US 00050 16.56 16.68 0.12 COMPOSITE LF 2.4 0 0
VIN US 00050 19.76 23.1 3.34 COMPOSITE LF LO 2.4 1.8 0
VIN US 00050 16.68 17.58 0.9 COMPOSITE LE 3 0 0
WAS SR 00007 33.12 34.12 1 FLEXIBLE 0 0 0
WAS SR 00007 36.26 37.24 0.98 FLEXIBLE MO 0 4.2 0
WAS SR 00026 12.57 19.03 6.46 FLEXIBLE HO HO 0 6 6
WAS SR 00026 19.03 20.84 1.81 FLEXIBLE HO HO 0 6 6
WAS SR 00060 5.15 5.74 0.59 FLEXIBLE 0 0 0
WAS SR 00260 0 0.3 0.3 FLEXIBLE LO LO 0 1.8 1.8
WAS SR 00550 20.74 21.6 0.86 FLEXIBLE MO MO 0 4.2 4.2
WAS SR 00555 7.48 9.94 2.46 FLEXIBLE MF MF 0 5.6 5.6
WAS SR 00555 9.94 16.1 6.16 FLEXIBLE MO MO 0 4.2 4.2
WAS SR 00555 16.1 19.41 3.31 FLEXIBLE HO MO 0 6 4.2
WAS SR 00676 4.52 4.78 0.26 FLEXIBLE MO MO 0 4.2 4.2
WAS SR 00676 4.78 5.41 0.63 FLEXIBLE MF MF 0 5.6 5.6
* Adjusted for 5‐25% range for "occasional" classification
** 1 mi = 1.61 km

68
County Abbrev
Trans Route
Milepost Segment Length (mi)**
Pavement Type
PCR Ratings PCR Scores
Start End S&G LRMSLRMS (adj*) S&G LRMS
LRMS (adj*)
WAS SR 00676 16.91 19.88 2.97 FLEXIBLE HO MF 0 6 5.6
WAS SR 00676 19.88 22.05 2.17 FLEXIBLE HO MF 0 6 5.6
WAS SR 00676 22.05 22.49 0.44 FLEXIBLE MF MF 0 5.6 5.6
WAS SR 00676 22.49 23.06 0.57 FLEXIBLE HO HO 0 6 6
WAS SR 00676 23.06 24.03 0.97 FLEXIBLE HO MO 0 6 4.2
WAS SR 00807 0 0.24 0.24 FLEXIBLE HO MO 0 6 4.2
WAS SR 00821 11.76 12.21 0.45 FLEXIBLE HO LO 0 6 1.8
WAS SR 00007 24.51 24.86 0.35 COMPOSITE LF LF 0 2.4 2.4
WAS SR 00007 24.51 24.86 0.35 COMPOSITE LO LO 0 1.8 1.8
WAS SR 00007 24.86 26.01 1.15 COMPOSITE 0 0 0
WAS SR 00007 24.86 26.01 1.15 COMPOSITE LO 0 1.8 0
WAS SR 00007 26.01 28.29 2.28 COMPOSITE MO 0 4.2 0
WAS SR 00007 26.01 28.29 2.28 COMPOSITE 0 0 0
WAS SR 00007 28.29 31.59 3.3 COMPOSITE MO 0 4.2 0
WAS SR 00007 34.12 36.26 2.14 COMPOSITE LO 0 1.8 0
WAS SR 00060 5.74 10.3 4.56 COMPOSITE 0 0 0
WAS SR 00060 10.3 10.95 0.65 COMPOSITE 0 0 0
WAS SR 00060 10.95 11.24 0.29 COMPOSITE 0 0 0
WAS SR 00124 2.82 4.34 1.52 COMPOSITE MO LO 0 4.2 1.8
WAS SR 00550 1.28 2.5 1.22 COMPOSITE MF MF 0 5.6 5.6
WAS SR 00618 0 1.48 1.48 COMPOSITE MO MO 0 4.2 4.2
WAS SR 00618 1.48 3.23 1.75 COMPOSITE MO 0 4.2 0
WAS SR 00618 4 5.19 1.19 COMPOSITE MO LF 0 4.2 2.4
WAS SR 00676 24.03 24.43 0.4 COMPOSITE MO MO 0 4.2 4.2
WAS SR 00821 12.21 18.92 6.71 COMPOSITE HO MO 0 6 4.2
WAS SR 00821 18.92 19.18 0.26 COMPOSITE LO 0 1.8 0
WAS SR 00821 19.18 19.58 0.4 COMPOSITE LO 0 1.8 0
WAS SR 00007 38.94 39.94 1 FLEXIBLE LO 1.8 0 0
WAS SR 00007 47.48 48.21 0.73 FLEXIBLE LO 1.8 0 0
WAS SR 00026 2.37 7 4.63 FLEXIBLE LO HO MO 1.8 6 4.2
WAS SR 00026 7 12.54 5.54 FLEXIBLE LO HO HO 1.8 6 6
WAS SR 00026 21.81 29.96 8.15 FLEXIBLE LO HO LO 1.8 6 1.8
* Adjusted for 5‐25% range for "occasional" classification
** 1 mi = 1.61 km

69
County Abbrev
Trans Route
Milepost Segment Length (mi)**
Pavement Type
PCR Ratings PCR Scores
Start End S&G LRMSLRMS (adj*) S&G LRMS
LRMS (adj*)
WAS SR 00060 1.32 1.84 0.52 FLEXIBLE LO 1.8 0 0
WAS SR 00060 1.84 2.73 0.89 FLEXIBLE LO 1.8 0 0
WAS SR 00124 0 2.82 2.82 FLEXIBLE LO MO MO 1.8 4.2 4.2
WAS SR 00260 0.3 0.47 0.17 FLEXIBLE LO LO LO 1.8 1.8 1.8
WAS SR 00260 0.47 9.76 9.29 FLEXIBLE LO HO MO 1.8 6 4.2
WAS SR 00260 9.98 11 1.02 FLEXIBLE LO HO HO 1.8 6 6
WAS SR 00550 18.42 18.91 0.49 FLEXIBLE LO MF MF 1.8 5.6 5.6
WAS SR 00555 0 7.48 7.48 FLEXIBLE LO MF MF 1.8 5.6 5.6
WAS SR 00676 0 4.52 4.52 FLEXIBLE LO HO MO 1.8 6 4.2
WAS SR 00821 0.48 2.27 1.79 FLEXIBLE LO 1.8 0 0
WAS SR 00821 2.27 3.41 1.14 FLEXIBLE LO LO 1.8 1.8 0
WAS SR 00007 39.94 40.16 0.22 COMPOSITE LO 1.8 0 0
WAS SR 00060 2.73 2.9 0.17 COMPOSITE LO 1.8 0 0
WAS SR 00550 0 0.89 0.89 COMPOSITE LO ME MF 1.8 7 5.6
WAS SR 00550 15.16 18.42 3.26 COMPOSITE LO MO MO 1.8 4.2 4.2
WAS SR 00550 21.6 21.86 0.26 COMPOSITE LO MO MO 1.8 4.2 4.2
WAS SR 00618 7 7.45 0.45 COMPOSITE LO 1.8 0 0
WAS SR 00821 5.18 6.17 0.99 COMPOSITE LO 1.8 0 0
WAS SR 00821 19.58 20.77 1.19 COMPOSITE LO LO 1.8 1.8 0
WAS SR 00007 44.2 45.56 1.36 FLEXIBLE LF LO 2.4 1.8 0
WAS SR 00026 20.84 21.81 0.97 FLEXIBLE LF MO LF 2.4 4.2 2.4
WAS SR 00145 0 0.48 0.48 FLEXIBLE LF 2.4 0 0
WAS SR 00145 0.48 3.25 2.77 FLEXIBLE LF MO LO 2.4 4.2 1.8
WAS SR 00550 0.89 1.28 0.39 FLEXIBLE LF MO MO 2.4 4.2 4.2
WAS SR 00550 14.78 15.16 0.38 FLEXIBLE LF MO MO 2.4 4.2 4.2
WAS SR 00676 5.41 10.52 5.11 FLEXIBLE LF HO MF 2.4 6 5.6
WAS SR 00676 10.52 12.27 1.75 FLEXIBLE LF MF MF 2.4 5.6 5.6
WAS SR 00676 12.42 16.91 4.49 FLEXIBLE LF ME MF 2.4 7 5.6
WAS SR 00007 23.06 23.94 0.88 COMPOSITE LF MO MO 2.4 4.2 4.2
WAS SR 00007 24.28 24.51 0.23 COMPOSITE LF 2.4 0 0
WAS SR 00007 42.22 44.2 1.98 COMPOSITE LF LO 2.4 1.8 0
WAS SR 00007 45.56 47.48 1.92 COMPOSITE LF 2.4 0 0
* Adjusted for 5‐25% range for "occasional" classification
** 1 mi = 1.61 km

70
County Abbrev
Trans Route
Milepost Segment Length (mi)**
Pavement Type
PCR Ratings PCR Scores
Start End S&G LRMSLRMS (adj*) S&G LRMS
LRMS (adj*)
WAS SR 00007 49.43 51.06 1.63 COMPOSITE LF HF HF 2.4 8 8
WAS SR 00007 51.06 51.33 0.27 COMPOSITE LF MO 2.4 4.2 0
WAS SR 00007 51.33 52.17 0.84 COMPOSITE LF LO LO 2.4 1.8 1.8
WAS SR 00026 2.03 2.37 0.34 COMPOSITE LF MO MO 2.4 4.2 4.2
WAS SR 00060 3.07 3.6 0.53 COMPOSITE LF 2.4 0 0
WAS SR 00550 2.5 9.01 6.51 COMPOSITE LF ME MF 2.4 7 5.6
WAS SR 00550 10.56 14.78 4.22 COMPOSITE LF MO MO 2.4 4.2 4.2
WAS SR 00550 18.91 20.09 1.18 COMPOSITE LF MO MO 2.4 4.2 4.2
WAS SR 00550 20.09 20.74 0.65 COMPOSITE LF MF MF 2.4 5.6 5.6
WAS SR 00821 6.17 6.97 0.8 COMPOSITE LF 2.4 0 0
WAS SR 00821 6.97 10.3 3.33 COMPOSITE LF LO LO 2.4 1.8 1.8
WAS SR 00821 10.3 10.5 0.2 COMPOSITE LF MF MF 2.4 5.6 5.6
WAS SR 00821 10.5 11.76 1.26 COMPOSITE LF HO MF 2.4 6 5.6
WAS SR 00007 31.59 33.01 1.42 FLEXIBLE LE MO MO 3 4.2 4.2
WAS SR 00007 31.59 33.01 1.42 FLEXIBLE LE MO LF 3 4.2 2.4
WAS SR 00007 33.01 33.12 0.11 FLEXIBLE LE 3 0 0
WAS SR 00007 40.16 42.22 2.06 FLEXIBLE LE LO 3 1.8 0
WAS SR 00007 48.91 49.43 0.52 FLEXIBLE LE MO 3 4.2 0
WAS SR 00060 20.13 20.75 0.62 FLEXIBLE LE MO 3 4.2 0
WAS SR 00339 0 0.45 0.45 FLEXIBLE LE LO 3 1.8 0
WAS SR 00339 0.45 1.41 0.96 FLEXIBLE LE 3 0 0
WAS SR 00339 1.41 4.39 2.98 FLEXIBLE LE 3 0 0
WAS SR 00339 4.39 8.57 4.18 FLEXIBLE LE LO 3 1.8 0
WAS SR 00339 8.57 13.64 5.07 FLEXIBLE LE LO 3 1.8 0
WAS SR 00339 13.64 16.56 2.92 FLEXIBLE LE MO 3 4.2 0
WAS SR 00339 16.56 18.59 2.03 FLEXIBLE LE 3 0 0
WAS SR 00339 18.59 20.44 1.85 FLEXIBLE LE MO LO 3 4.2 1.8
WAS SR 00821 4.4 5.18 0.78 FLEXIBLE LE LO LO 3 1.8 1.8
WAS SR 00007 37.24 38.94 1.7 COMPOSITE LE HO MF 3 6 5.6
WAS SR 00007 48.21 48.91 0.7 COMPOSITE LE 3 0 0
WAS SR 00007 52.17 54.03 1.86 COMPOSITE LE LO 3 1.8 0
WAS SR 00026 0.34 1.28 0.94 COMPOSITE LE MO MO 3 4.2 4.2
* Adjusted for 5‐25% range for "occasional" classification
** 1 mi = 1.61 km
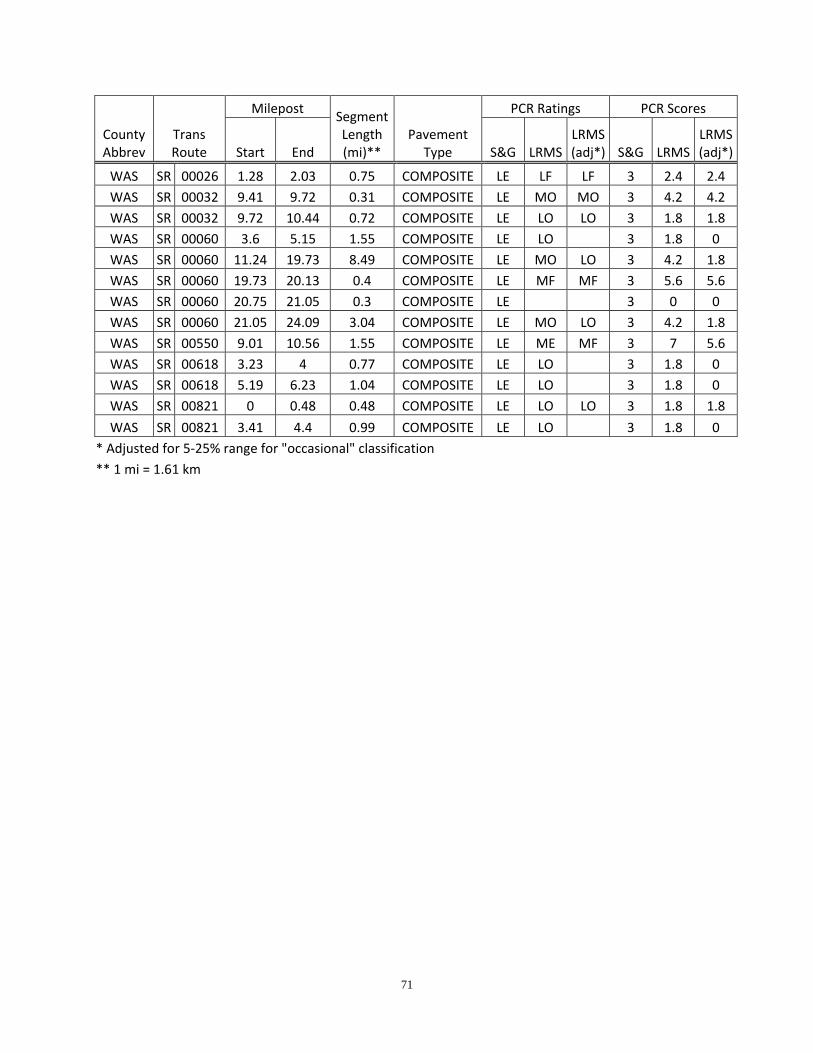
71
County Abbrev
Trans Route
Milepost Segment Length (mi)**
Pavement Type
PCR Ratings PCR Scores
Start End S&G LRMSLRMS (adj*) S&G LRMS
LRMS (adj*)
WAS SR 00026 1.28 2.03 0.75 COMPOSITE LE LF LF 3 2.4 2.4
WAS SR 00032 9.41 9.72 0.31 COMPOSITE LE MO MO 3 4.2 4.2
WAS SR 00032 9.72 10.44 0.72 COMPOSITE LE LO LO 3 1.8 1.8
WAS SR 00060 3.6 5.15 1.55 COMPOSITE LE LO 3 1.8 0
WAS SR 00060 11.24 19.73 8.49 COMPOSITE LE MO LO 3 4.2 1.8
WAS SR 00060 19.73 20.13 0.4 COMPOSITE LE MF MF 3 5.6 5.6
WAS SR 00060 20.75 21.05 0.3 COMPOSITE LE 3 0 0
WAS SR 00060 21.05 24.09 3.04 COMPOSITE LE MO LO 3 4.2 1.8
WAS SR 00550 9.01 10.56 1.55 COMPOSITE LE ME MF 3 7 5.6
WAS SR 00618 3.23 4 0.77 COMPOSITE LE LO 3 1.8 0
WAS SR 00618 5.19 6.23 1.04 COMPOSITE LE LO 3 1.8 0
WAS SR 00821 0 0.48 0.48 COMPOSITE LE LO LO 3 1.8 1.8
WAS SR 00821 3.41 4.4 0.99 COMPOSITE LE LO 3 1.8 0
* Adjusted for 5‐25% range for "occasional" classification
** 1 mi = 1.61 km


ORITE 141 Stocker Center Athens, Ohio 45701-2979 740-593-2476 Fax: 740-593-0625 [email protected] http://www.ohio.edu/orite/