capital budgeting and cash flows estimation (2008)
TRANSCRIPT

8/8/2019 Capital Budgeting and Cash Flows Estimation (2008)
http://slidepdf.com/reader/full/capital-budgeting-and-cash-flows-estimation-2008 1/64
Capital Budgeting and
the Estimation of Cash Flows

8/8/2019 Capital Budgeting and Cash Flows Estimation (2008)
http://slidepdf.com/reader/full/capital-budgeting-and-cash-flows-estimation-2008 2/64
WHAT IS CAPITAL BUDGETING?
Analysis of potential additions to fixed assets,
whose benefits last for many years.
Long-term decisions; involve large
expenditures.
Will affect firm¶s performance for many years,
so is very important to firm¶s future.
Conceptually, capital budget process isidentical to decision process used by
individuals¶ making investment decisions

8/8/2019 Capital Budgeting and Cash Flows Estimation (2008)
http://slidepdf.com/reader/full/capital-budgeting-and-cash-flows-estimation-2008 3/64

8/8/2019 Capital Budgeting and Cash Flows Estimation (2008)
http://slidepdf.com/reader/full/capital-budgeting-and-cash-flows-estimation-2008 4/64
Steps:
1. Estimate CFs (inflows & outflows).
2. Assess riskiness of CFs (Cash Flows).
3. Determine R = WACC (adj.). determine appropriate
discount rate, based on riskiness of Cash Flows & general level int.rates
4. Find NPV of the expected cash flows and/or IRR.
5. Accept if NPV > 0 and/or IRR > WACC.

8/8/2019 Capital Budgeting and Cash Flows Estimation (2008)
http://slidepdf.com/reader/full/capital-budgeting-and-cash-flows-estimation-2008 5/64
Good Decision Criteria for Capital
Budgeting Process
We need to ask ourselves the followingquestions when evaluating decision criteria
Does the decision rule adjust for the time value of
money?
Does the decision rule adjust for risk?
Does the decision rule utilize all relevant
information? (such as all cash flows)
Does the decision rule provide information onwhether we are creating value for the firm?

8/8/2019 Capital Budgeting and Cash Flows Estimation (2008)
http://slidepdf.com/reader/full/capital-budgeting-and-cash-flows-estimation-2008 6/64

8/8/2019 Capital Budgeting and Cash Flows Estimation (2008)
http://slidepdf.com/reader/full/capital-budgeting-and-cash-flows-estimation-2008 7/64
Net Present Value
The difference between the market value of aproject and its cost
How much value is created from undertaking
an investment? The first step is to estimate the expected future
cash flows.
The second step is to estimate the required return
for projects of this risk level. The third step is to find the present value of the
future cash flows and subtract the initial investment.

8/8/2019 Capital Budgeting and Cash Flows Estimation (2008)
http://slidepdf.com/reader/full/capital-budgeting-and-cash-flows-estimation-2008 8/64
NPV ± Decision Rule
If the NPV is positive, accept the project A positive NPV means that the project is
expected to add value to the firm and will
therefore increase the wealth of the owners. Since our goal is to increase owner wealth,
NPV is a direct measure of how well thisproject will meet our goal.
0
.1
n
t
t
t
CF NPV
R!
!
§
.
10
1
CF R
CF NPV
t
t
n
t
! §
!

8/8/2019 Capital Budgeting and Cash Flows Estimation (2008)
http://slidepdf.com/reader/full/capital-budgeting-and-cash-flows-estimation-2008 9/64
Computing NPV for the Project
Using the formulas:
NPV = 63,120/(1.12) + 70,800/(1.12)2 +91,080/(1.12)3 ± 165,000 = 12,627.42
Using the calculator:
CF0 = -165,000; C01 = 63,120; F01 = 1; C02 =70,800; F02 = 1; C03 = 91,080; F03 = 1; NPV; I =
12; CPT NPV = 12,627.42 Do w e accept or reject the project?

8/8/2019 Capital Budgeting and Cash Flows Estimation (2008)
http://slidepdf.com/reader/full/capital-budgeting-and-cash-flows-estimation-2008 10/64
Calculating NPVs with a
Spreadsheet
Spreadsheets are an excellent way tocompute NPVs, especially when you have to
compute the cash flows as well. Using the NPV function
The first component is the required return enteredas a decimal
The second component is the range of cash flowsbeginning with year 1
Subtract the initial investment after computing theNPV

8/8/2019 Capital Budgeting and Cash Flows Estimation (2008)
http://slidepdf.com/reader/full/capital-budgeting-and-cash-flows-estimation-2008 11/64
Decision Criteria Test - NPV
Does the NPV rule account for the time valueof money?
Does the NPV rule account for the risk of thecash flows?
Does the NPV rule provide an indicationabout the increase in value?
Does the decision rule utilize all relevantinformation? (such as all cash flows)
Should we consider the NPV rule for our primary decision criteria?

8/8/2019 Capital Budgeting and Cash Flows Estimation (2008)
http://slidepdf.com/reader/full/capital-budgeting-and-cash-flows-estimation-2008 12/64
Payback Period
How long does it take to get the initial costback in a nominal sense?
Computation Estimate the cash flows
Subtract the future cash flows from the initial costuntil the initial investment has been recovered
Decision Rule ± Accept i f the payback period is l ess than some preset l imit

8/8/2019 Capital Budgeting and Cash Flows Estimation (2008)
http://slidepdf.com/reader/full/capital-budgeting-and-cash-flows-estimation-2008 13/64
Computing Payback For The Project
Assume we will accept the project if it
pays back within two years.
Year CF Cumulative CF
0 -165,000 -165,0001 63,120 -101, 880
2 70,800 -31,080
3 91,080 60,000
Payback Period: 2+ (31,080/91,080)=2.34 years

8/8/2019 Capital Budgeting and Cash Flows Estimation (2008)
http://slidepdf.com/reader/full/capital-budgeting-and-cash-flows-estimation-2008 14/64
Decision Criteria Test - Payback
Does the payback rule account for the time value of money?
Does the payback rule account for the risk of thecash flows?
Does the payback rule provide an indication aboutthe increase in value?
Does the decision rule utilize all relevant information?(such as all cash flows)
Should we consider the payback rule for our primarydecision criteria?

8/8/2019 Capital Budgeting and Cash Flows Estimation (2008)
http://slidepdf.com/reader/full/capital-budgeting-and-cash-flows-estimation-2008 15/64
Advantages and Disadvantages of Payback
Advantages
Easy to understand
Adjusts for uncertainty of
later cash flows Biased towards liquidity
Disadvantages
Ignores the time value of money
Requires an arbitrarycutoff point
Ignores cash flows beyondthe cutoff date
Biased against long-termprojects, such as researchand development, andnew projects

8/8/2019 Capital Budgeting and Cash Flows Estimation (2008)
http://slidepdf.com/reader/full/capital-budgeting-and-cash-flows-estimation-2008 16/64
Discounted Payback Period
Compute the present value of each cash flowand then determine how long it takes to
payback on a discounted basis Compare to a pre-specified required period
Decision Rule - Accept the project i f it pays back on a discounted basis w ithin the
speci f ied time
8/8/2019 Capital Budgeting and Cash Flows Estimation (2008)
http://slidepdf.com/reader/full/capital-budgeting-and-cash-flows-estimation-2008 17/64
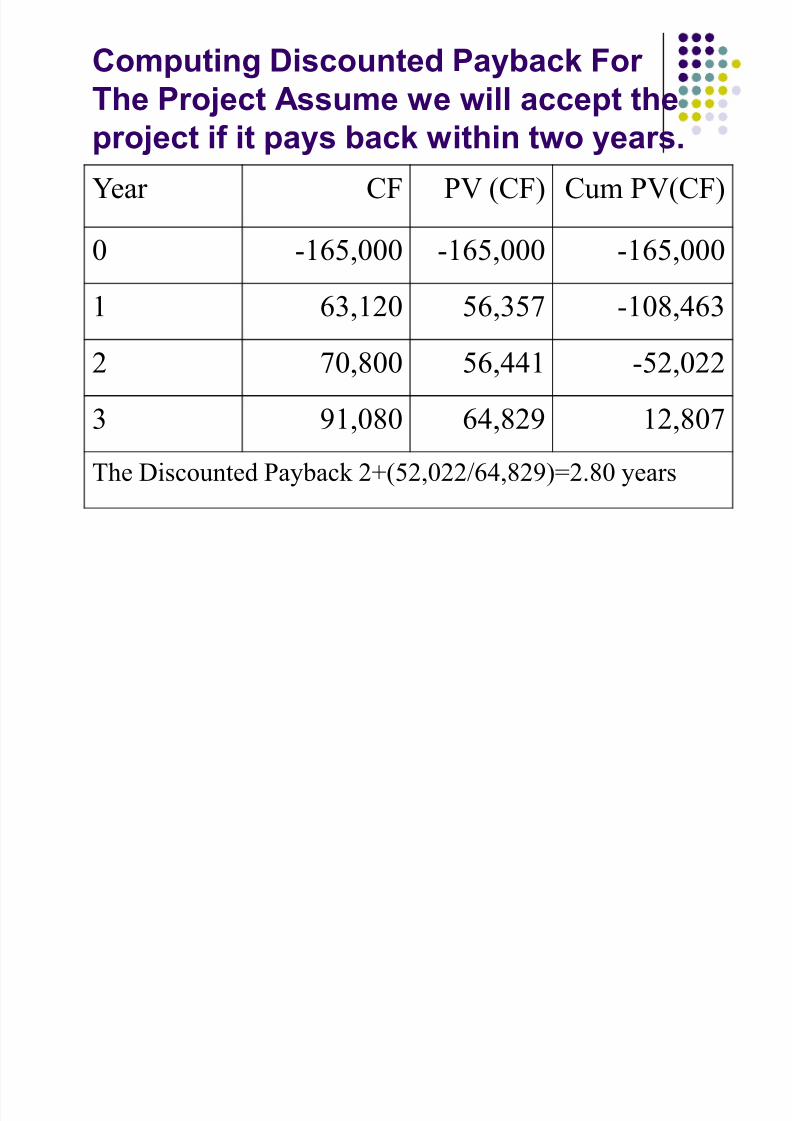
Computing Discounted Payback For
The Project Assume we will accept the
project if it pays back within two years.
Year CF PV (CF) Cum PV(CF)
0 -165,000 -165,000 -165,000
1 63,120 56,357 -108,463
2 70,800 56,441 -52,022
3 91,080 64,829 12,807
The Discounted Payback 2+(52,022/64,829)=2.80 years

8/8/2019 Capital Budgeting and Cash Flows Estimation (2008)
http://slidepdf.com/reader/full/capital-budgeting-and-cash-flows-estimation-2008 18/64
Decision Criteria Test ±
Discounted Payback
Does the discounted payback rule account for thetime value of money?
Does the discounted payback rule account for the
risk of the cash flows?
Does the discounted payback rule provide anindication about the increase in value?
Does the decision rule utilize all relevant information?(such as all cash flows)
Should we consider the discounted payback rule for our primary decision criteria?

8/8/2019 Capital Budgeting and Cash Flows Estimation (2008)
http://slidepdf.com/reader/full/capital-budgeting-and-cash-flows-estimation-2008 19/64
Advantages and Disadvantages of
Discounted Payback
Advantages
Includes time value of money
Easy to understand Does not accept
negative estimated NPVinvestments
Biased towards liquidity
Disadvantages
May reject positive NPVinvestments
Requires an arbitrarycutoff point
Ignores cash flowsbeyond the cutoff point
Biased against long-termprojects, such as R&Dand new products

8/8/2019 Capital Budgeting and Cash Flows Estimation (2008)
http://slidepdf.com/reader/full/capital-budgeting-and-cash-flows-estimation-2008 20/64
Average Accounting Return
There are many different definitions for average accounting return
The one used in the book is: Average net income / average book value
Note that the average book value depends onhow the asset is depreciated.
Need to have a target cutoff rate Decision Rule: Accept the project i f the AAR is g reater than a preset rate.
8/8/2019 Capital Budgeting and Cash Flows Estimation (2008)
http://slidepdf.com/reader/full/capital-budgeting-and-cash-flows-estimation-2008 21/64
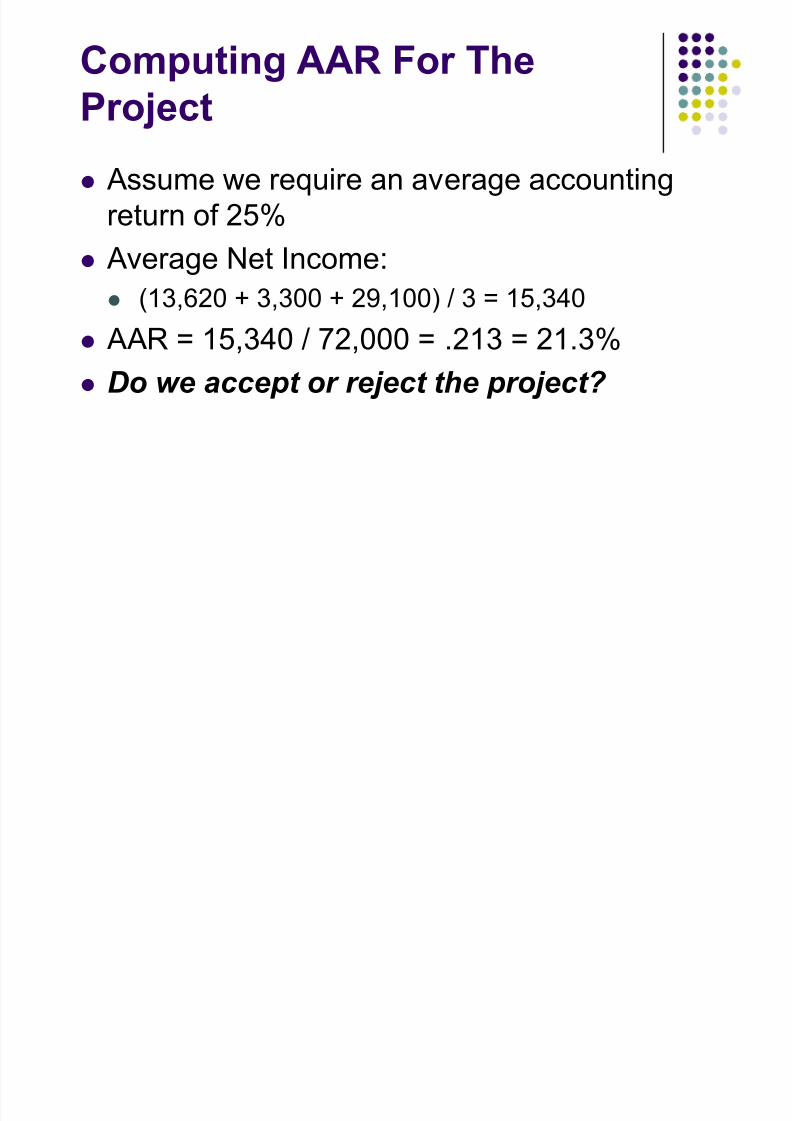
Computing AAR For The
Project
Assume we require an average accountingreturn of 25%
Average Net Income: (13,620 + 3,300 + 29,100) / 3 = 15,340
AAR = 15,340 / 72,000 = .213 = 21.3%
Do w e accept or reject the project?

8/8/2019 Capital Budgeting and Cash Flows Estimation (2008)
http://slidepdf.com/reader/full/capital-budgeting-and-cash-flows-estimation-2008 22/64
Decision Criteria Test - AAR
Does the AAR rule account for the time value of money?
Does the AAR rule account for the risk of the cash
flows?
Does the AAR rule utilize all relevant information?(such as all cash flows)
Does the AAR rule provide an indication about theincrease in value?
Should we consider the AAR rule for our primarydecision criteria?

8/8/2019 Capital Budgeting and Cash Flows Estimation (2008)
http://slidepdf.com/reader/full/capital-budgeting-and-cash-flows-estimation-2008 23/64
Advantages and
Disadvantages of AAR
Advantages
Easy to calculate
Needed information will
usually be available
Disadvantages
Not a true rate of return;time value of money is
ignored Uses an arbitrary
benchmark cutoff rate
Based on accounting netincome and book values,
not cash flows andmarket values
8/8/2019 Capital Budgeting and Cash Flows Estimation (2008)
http://slidepdf.com/reader/full/capital-budgeting-and-cash-flows-estimation-2008 24/64
Internal Rate of Return
This is the most important alternative to NPV
It is often used in practice and is intuitively
appealing It is based entirely on the estimated cash
flows and is independent of interest ratesfound elsewhere

8/8/2019 Capital Budgeting and Cash Flows Estimation (2008)
http://slidepdf.com/reader/full/capital-budgeting-and-cash-flows-estimation-2008 25/64
IRR ± Definition and Decision Rule
Definition: IRR is the return that makes the NPV = 0 Decision Rule: Accept the project i f the I RR is
g reater than the required return
NPV: Enter R, solve for NPV.
IRR: Enter NPV = 0, solve for IRR.
.
10
NPV R
CF
t
t
n
t
!
§!
.0
IRR1
CFt
t
n
0t
!
§!
8/8/2019 Capital Budgeting and Cash Flows Estimation (2008)
http://slidepdf.com/reader/full/capital-budgeting-and-cash-flows-estimation-2008 26/64
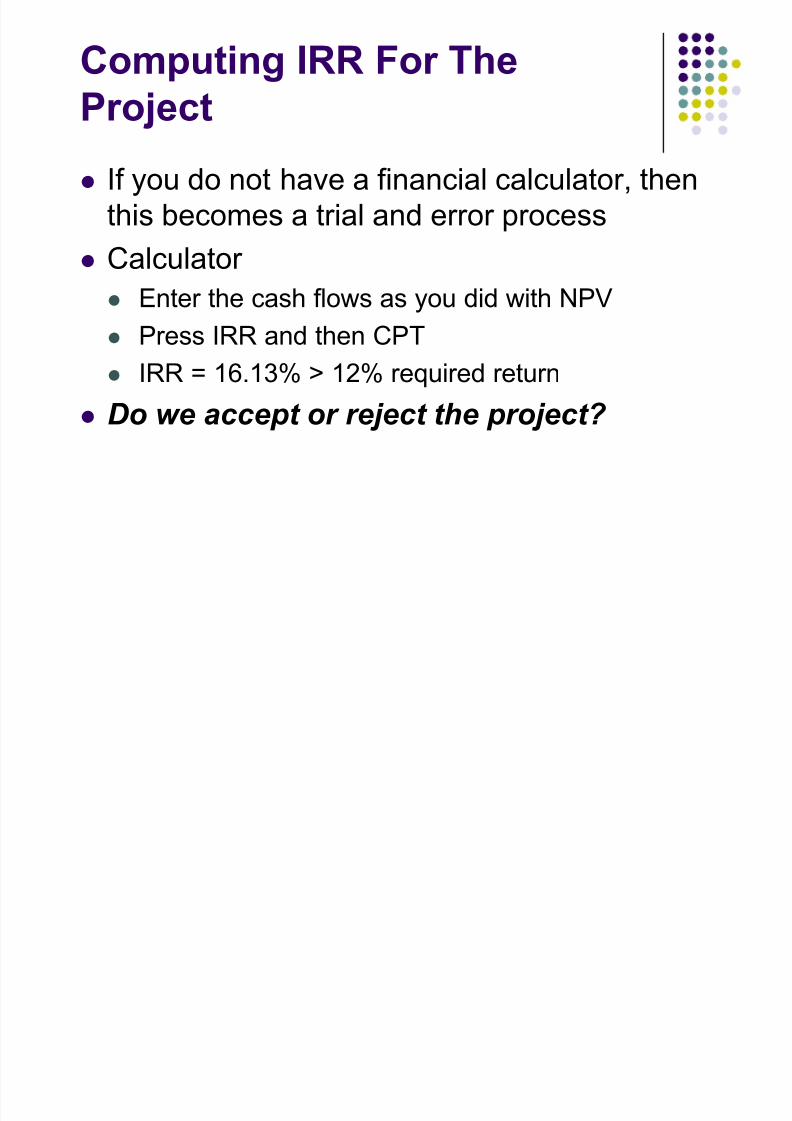
Computing IRR For The
Project
If you do not have a financial calculator, thenthis becomes a trial and error process
Calculator Enter the cash flows as you did with NPV
Press IRR and then CPT
IRR = 16.13% > 12% required return
Do w e accept or reject the project?

8/8/2019 Capital Budgeting and Cash Flows Estimation (2008)
http://slidepdf.com/reader/full/capital-budgeting-and-cash-flows-estimation-2008 27/64
Calculating IRRs With A
Spreadsheet
You start with the cash flows the same asyou did for the NPV
You use the IRR function You first enter your range of cash flows,
beginning with the initial cash flow
You can enter a guess, but it is not necessary
The default format is a whole percent ± you willnormally want to increase the decimal places toat least two

8/8/2019 Capital Budgeting and Cash Flows Estimation (2008)
http://slidepdf.com/reader/full/capital-budgeting-and-cash-flows-estimation-2008 28/64
NPV Profile For The Project
-20,000
-10,000
0
10,000
20,000
30,000
40,000
50,000
60,000
70,000
0 0.02 0.04 0.06 0.08 0.1 0.12 0.14 0.16 0.18 0.2 0.22
Discount Rate
N P V
IRR = 16.13%

8/8/2019 Capital Budgeting and Cash Flows Estimation (2008)
http://slidepdf.com/reader/full/capital-budgeting-and-cash-flows-estimation-2008 29/64
Decision Criteria Test - IRR
Does the IRR rule account for the time value of money?
Does the IRR rule account for the risk of the cash
flows?
Does the decision rule utilize all relevant information?(such as all cash flows)
Does the IRR rule provide an indication about theincrease in value?
Should we consider the IRR rule for our primarydecision criteria?
8/8/2019 Capital Budgeting and Cash Flows Estimation (2008)
http://slidepdf.com/reader/full/capital-budgeting-and-cash-flows-estimation-2008 30/64
Advantages of IRR
Knowing a return is intuitively appealing
It is a simple way to communicate the value
of a project to someone who does not knowall the estimation details
If the IRR is high enough, you may not needto estimate a required return, which is often a
difficult task

8/8/2019 Capital Budgeting and Cash Flows Estimation (2008)
http://slidepdf.com/reader/full/capital-budgeting-and-cash-flows-estimation-2008 31/64
Summary of Decisions For The
Project
Summary
Net Present Value Accept
Payback Period R eject
Discounted Payback Period R eject
Average Accounting Return R eject
Internal Rate of Return Accept

8/8/2019 Capital Budgeting and Cash Flows Estimation (2008)
http://slidepdf.com/reader/full/capital-budgeting-and-cash-flows-estimation-2008 32/64
NPV Vs. IRR
NPV and IRR will generally give us the samedecision. (exactly the same decision if evaluating independent projects)
Exceptions
Non-conventional cash flows ± cash flow signschange more than once
Mutually exclusive projects Initial investments are substantially different
Timing of cash flows is substantially different

8/8/2019 Capital Budgeting and Cash Flows Estimation (2008)
http://slidepdf.com/reader/full/capital-budgeting-and-cash-flows-estimation-2008 33/64
IRR and Non-conventional
Cash Flows
When the cash flows change signs more thanonce, there is more than one IRR
When you solve for IRR you are solving for the root of an equation and when you crossthe x-axis more than once, there will be morethan one return that solves the equation
If you have more than one IRR, which one doyou use to make your decision?

8/8/2019 Capital Budgeting and Cash Flows Estimation (2008)
http://slidepdf.com/reader/full/capital-budgeting-and-cash-flows-estimation-2008 34/64
Another Example ± Non-conventional
Cash Flows
Suppose an investment will cost $90,000initially and will generate the following cashflows:
Year 1: 132,000
Year 2: 100,000
Year 3: -150,000
The required return is 15%. Should we accept or reject the project?

8/8/2019 Capital Budgeting and Cash Flows Estimation (2008)
http://slidepdf.com/reader/full/capital-budgeting-and-cash-flows-estimation-2008 35/64
NPV Profile
($10,000.00)
($8,000.00)
($6,000.00)
($4,000.00)
($2,000.00)
$0.00
$2,000.00
$4,000.00
0 0.05 0.1 0.15 0.2 0.25 0.3 0.35 0.4 0.45 0.5 0.55
Discount Rate
N P V
IRR = 10.11% and 42.66%

8/8/2019 Capital Budgeting and Cash Flows Estimation (2008)
http://slidepdf.com/reader/full/capital-budgeting-and-cash-flows-estimation-2008 36/64
Summary of Decision Rules
The NPV is positive at a required return of 15%, so you should Accept
If you use the financial calculator, you wouldget an IRR of 10.11% which would tell you toR eject
You need to recognize that there are non-
conventional cash flows and look at the NPVprofile

8/8/2019 Capital Budgeting and Cash Flows Estimation (2008)
http://slidepdf.com/reader/full/capital-budgeting-and-cash-flows-estimation-2008 37/64
IRR and Mutually Exclusive Projects
Mutually exclusive projects If you choose one project, you can¶t choose the other
Example: You can choose to attend graduate schoolnext year at either Harvard or Stanford, but not both
Intuitively you would use the following decisionrules:
NPV ± choose the project with the higher NPV
IRR ± choose the project with the higher IRR

8/8/2019 Capital Budgeting and Cash Flows Estimation (2008)
http://slidepdf.com/reader/full/capital-budgeting-and-cash-flows-estimation-2008 38/64
Example With Mutually Exclusive
Projects
Period Project A Project B
0 -500 -400
1 325 325
2 325 200
IRR 19.43% 22.17%
NPV 64.05 60.74
The required return
for both projects is
10%.
Which project
should you accept
and why?
8/8/2019 Capital Budgeting and Cash Flows Estimation (2008)
http://slidepdf.com/reader/full/capital-budgeting-and-cash-flows-estimation-2008 39/64
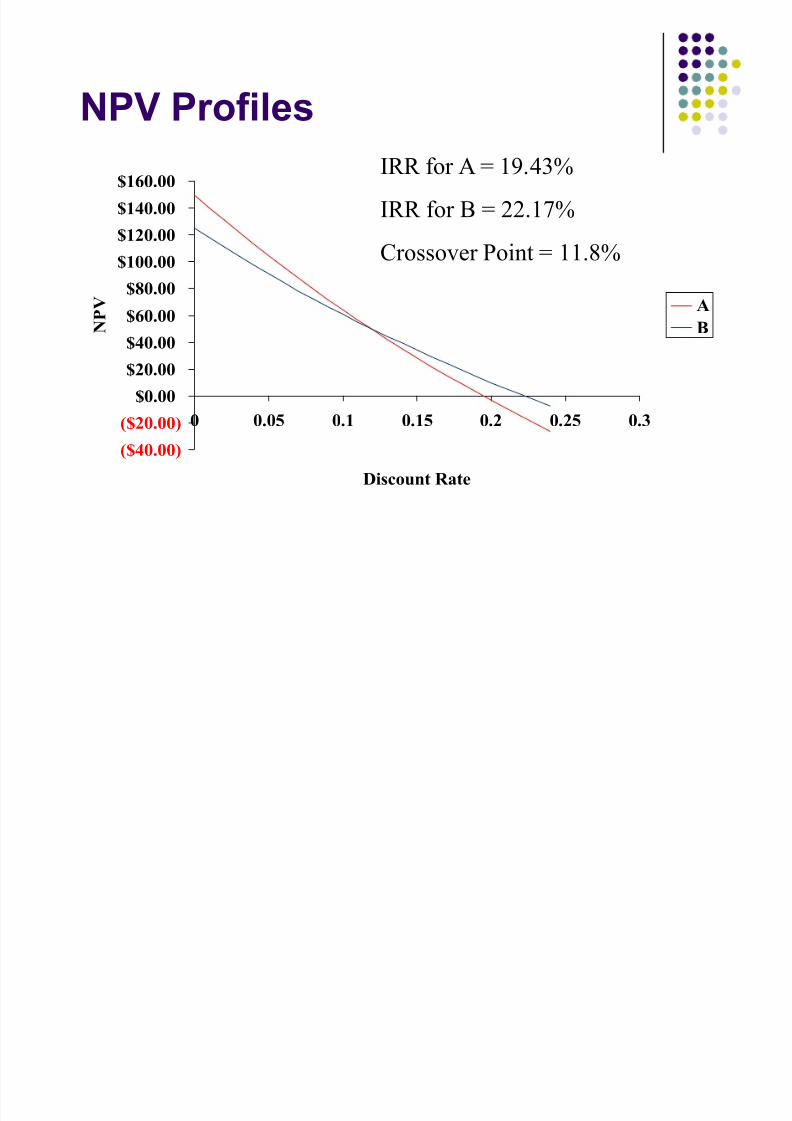
NPV Profiles
($40.00)
($20.00)$0.00
$20.00
$40.00
$60.00
$80.00$100.00
$120.00
$140.00
$160.00
0 0.05 0.1 0.15 0.2 0.25 0.3
Discount Rate
N P V A
B
IRR for A = 19.43%
IRR for B = 22.17%
Crossover Point = 11.8%

8/8/2019 Capital Budgeting and Cash Flows Estimation (2008)
http://slidepdf.com/reader/full/capital-budgeting-and-cash-flows-estimation-2008 40/64
Conflicts Between NPV and IRR
NPV directly measures the increase in value tothe firm
Whenever there is a conflict between NPV and
another decision rule, you should alw ays useNPV
IRR is unreliable in the following situations
Non-conventional cash flows
Mutually exclusive projects
8/8/2019 Capital Budgeting and Cash Flows Estimation (2008)
http://slidepdf.com/reader/full/capital-budgeting-and-cash-flows-estimation-2008 41/64
Profitability Index
Measures the benefit versus per unit cost,based on the time value of money
A profitability index of 1.1 implies that for every $1 of investment, we create anadditional $0.10 in value
This measure can be very useful in situations
where we have limited capital

8/8/2019 Capital Budgeting and Cash Flows Estimation (2008)
http://slidepdf.com/reader/full/capital-budgeting-and-cash-flows-estimation-2008 42/64
Define Profitability Index
.
1
1
0
0
§
§
!
!
!
n
t t
t
n
t t
t
R
COF
R
CIF
PI

8/8/2019 Capital Budgeting and Cash Flows Estimation (2008)
http://slidepdf.com/reader/full/capital-budgeting-and-cash-flows-estimation-2008 43/64
Advantages and Disadvantages of
Profitability Index
Advantages
Closely related to NPV,generally leading to
identical decisions Easy to understand and
communicate
May be useful whenavailable investment
funds are limited
Disadvantages
May lead to incorrectdecisions in
comparisons of mutuallyexclusive investments
8/8/2019 Capital Budgeting and Cash Flows Estimation (2008)
http://slidepdf.com/reader/full/capital-budgeting-and-cash-flows-estimation-2008 44/64
Managers like rates--prefer IRR to
NPV comparisons. Can we give
them a better IRR?
Yes, MIRR is the discount rate which
causes thePV
of a project¶s terminalvalue (TV) to equal the PV of costs.
TV is found by compounding inflows
at WACC.
Thus, MIRR assumes cash inflows
are reinvested at WACC.

8/8/2019 Capital Budgeting and Cash Flows Estimation (2008)
http://slidepdf.com/reader/full/capital-budgeting-and-cash-flows-estimation-2008 45/64
30.0 130.030.0
0 1 2 3
39.0
50.7
219.7
IRR ± the reinvestment hypothesis
-100.0
30%
30%
FV inflows-100.0
PV outflows

8/8/2019 Capital Budgeting and Cash Flows Estimation (2008)
http://slidepdf.com/reader/full/capital-budgeting-and-cash-flows-estimation-2008 46/64
30.0 130.030.0
0 1 2 3
33.0
36.3
199.3
IRR ± the reinvestment hypothesis
-100.0
10%
10%
FV inflows-100.0
PV outflows

8/8/2019 Capital Budgeting and Cash Flows Estimation (2008)
http://slidepdf.com/reader/full/capital-budgeting-and-cash-flows-estimation-2008 47/64
Why use MIRR versus IRR?
MIRR correctly assumes reinvestment at
opportunity cost = WACC. MIRR also
avoids the problem of multiple IRRs.
Managers like rate of return comparisons,
and MIRR is better for this than IRR.

8/8/2019 Capital Budgeting and Cash Flows Estimation (2008)
http://slidepdf.com/reader/full/capital-budgeting-and-cash-flows-estimation-2008 48/64
Capital Budgeting In Practice
We should consider several investmentcriteria when making decisions
NPV and IRR are the most commonly usedprimary investment criteria
Payback is a commonly used secondaryinvestment criteria

8/8/2019 Capital Budgeting and Cash Flows Estimation (2008)
http://slidepdf.com/reader/full/capital-budgeting-and-cash-flows-estimation-2008 49/64
Cash Flows Estimation:
Relevant Cash Flows
The cash flows that should be included in acapital budgeting analysis are those that willonly occur if the project is accepted
These cash flows are called incremental cash
flows
The stand-alone principle allows us to
analyze each project in isolation from the firmsimply by focusing on incremental cash flows

8/8/2019 Capital Budgeting and Cash Flows Estimation (2008)
http://slidepdf.com/reader/full/capital-budgeting-and-cash-flows-estimation-2008 50/64
Asking the Right Question
You should always ask yourself ³Will this cashflow occur ONLY if we accept the project?´
If the answer is ³yes´, it should be included in theanalysis because it is incremental
If the answer is ³no´, it should not be included inthe analysis because it will occur anyway
If the answer is ³part of it´, then we should includethe part that occurs because of the project

8/8/2019 Capital Budgeting and Cash Flows Estimation (2008)
http://slidepdf.com/reader/full/capital-budgeting-and-cash-flows-estimation-2008 51/64
InitialInvestment(-)
210 3
Cash flows Estimation ± New Project
OperatingCash Flow(+)
OperatingCash Flow(+)
Operating Cash Flow(+) Non-Op Cash Flow(+)

8/8/2019 Capital Budgeting and Cash Flows Estimation (2008)
http://slidepdf.com/reader/full/capital-budgeting-and-cash-flows-estimation-2008 52/64
Initial Investment
Total cost for project: the cost incurred in order to make the asset readily available to operate.That includes the purchase cost for the asset,
shipping and testing costs. The firm needs toimpute opportunity cost for asset that isalready owned by the firm, and ignore thesunk costs for the project. Side effects should
be also included and considered. The net working capital increased by the
implementation for the project.
8/8/2019 Capital Budgeting and Cash Flows Estimation (2008)
http://slidepdf.com/reader/full/capital-budgeting-and-cash-flows-estimation-2008 53/64
Sunk costs
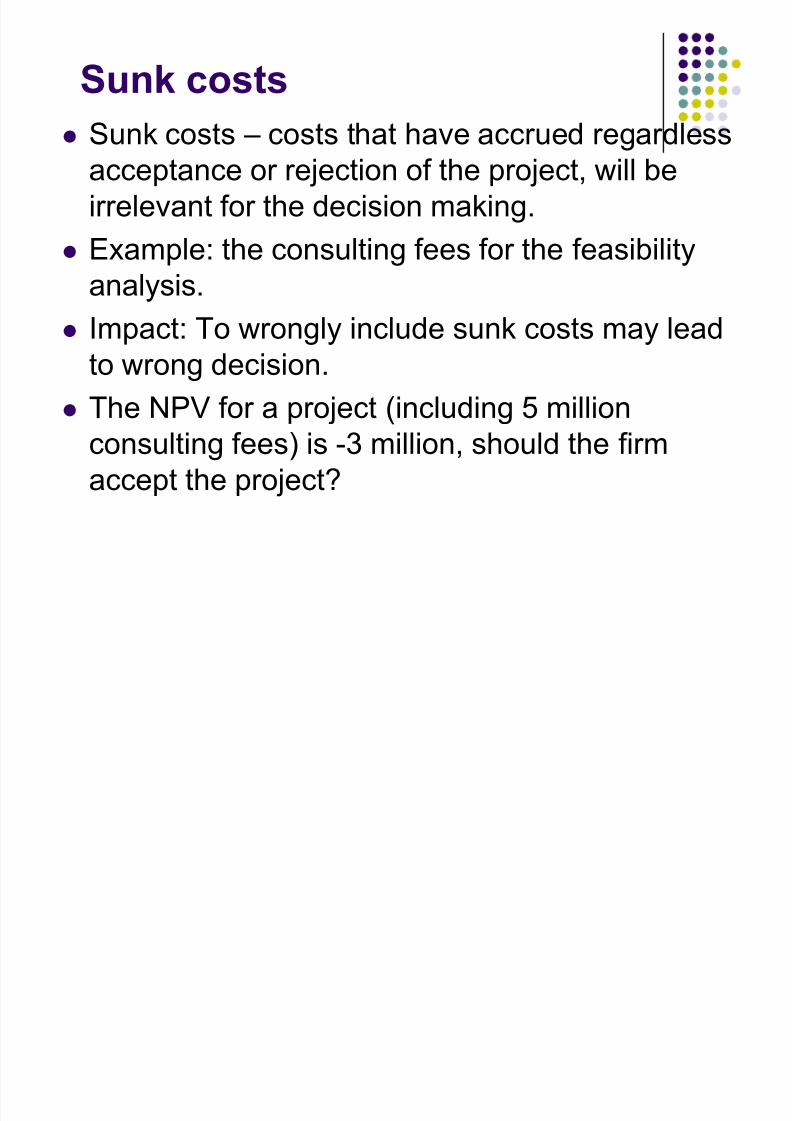
Sunk costs ± costs that have accrued regardlessacceptance or rejection of the project, will beirrelevant for the decision making.
Example: the consulting fees for the feasibilityanalysis.
Impact: To wrongly include sunk costs may leadto wrong decision.
The NPV for a project (including 5 millionconsulting fees) is -3 million, should the firmaccept the project?
8/8/2019 Capital Budgeting and Cash Flows Estimation (2008)
http://slidepdf.com/reader/full/capital-budgeting-and-cash-flows-estimation-2008 54/64
Opportunity costs
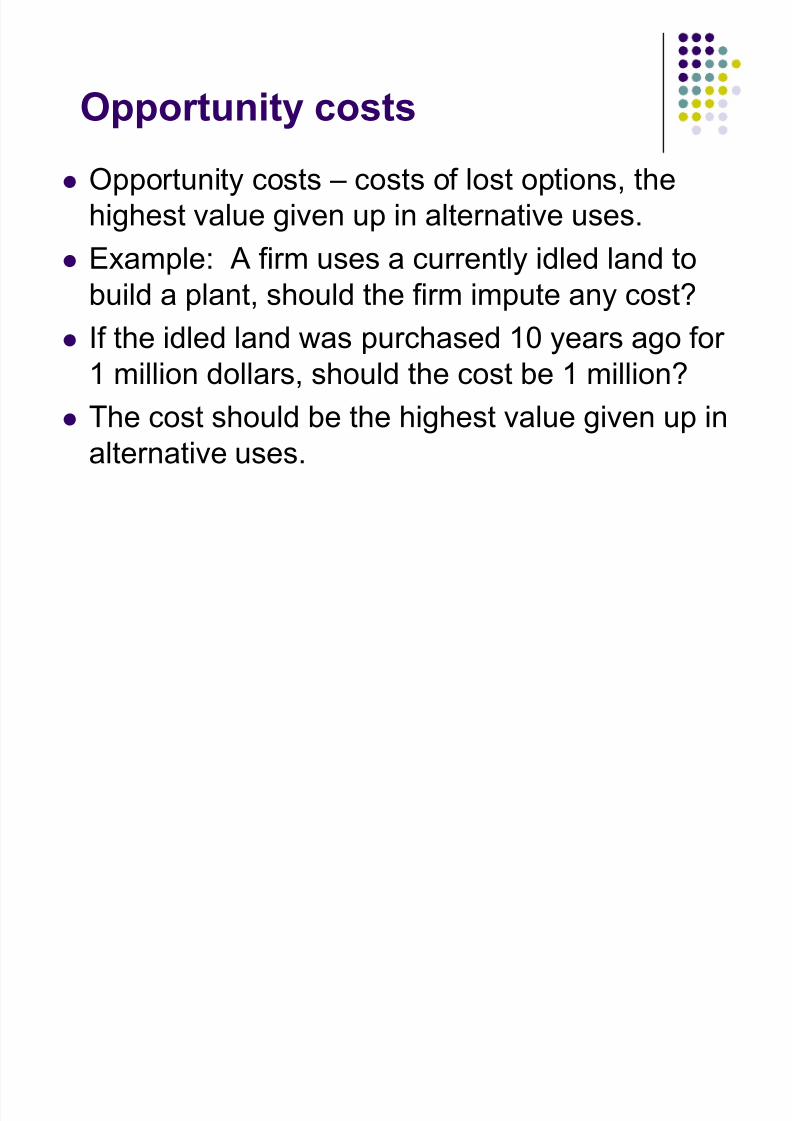
Opportunity costs ± costs of lost options, thehighest value given up in alternative uses.
Example: A firm uses a currently idled land tobuild a plant, should the firm impute any cost?
If the idled land was purchased 10 years ago for 1 million dollars, should the cost be 1 million?
The cost should be the highest value given up inalternative uses.

8/8/2019 Capital Budgeting and Cash Flows Estimation (2008)
http://slidepdf.com/reader/full/capital-budgeting-and-cash-flows-estimation-2008 55/64
Side effects
Positive side effects ± benefits to other projects
Negative side effects ± costs to other projects
8/8/2019 Capital Budgeting and Cash Flows Estimation (2008)
http://slidepdf.com/reader/full/capital-budgeting-and-cash-flows-estimation-2008 56/64
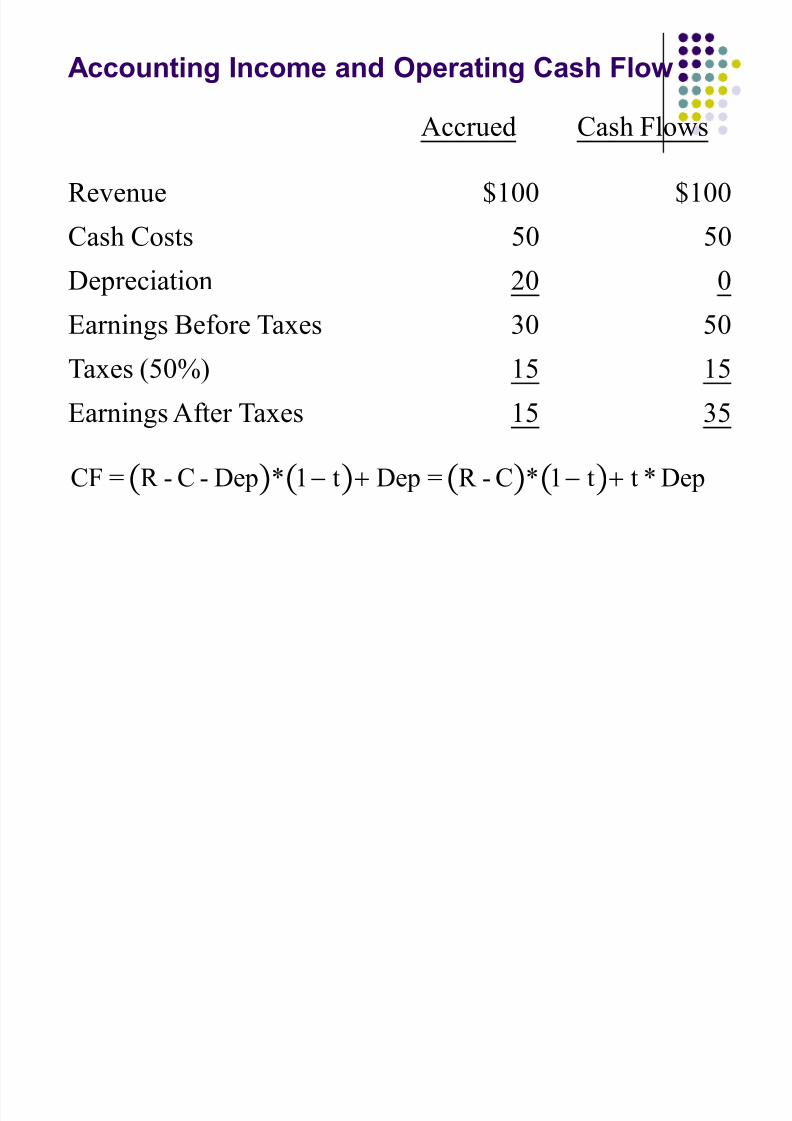
Accounting Income and Operating Cash Flow
Accrued Cash Flows
Revenue $100 $100
Cash Costs 50 50
Depreciation 20 0
Earnings Before Taxes 30 50
Taxes (50%) 15 15
Earnings After Taxes 15 35
CF = R - C - Dep t Dep = R - C t t * Dep* *1 1

8/8/2019 Capital Budgeting and Cash Flows Estimation (2008)
http://slidepdf.com/reader/full/capital-budgeting-and-cash-flows-estimation-2008 57/64
Non-operating cash flows (NOCF)
Disposal Value
The recovery of NWCDisposal value = Market Value Taxes Effects

8/8/2019 Capital Budgeting and Cash Flows Estimation (2008)
http://slidepdf.com/reader/full/capital-budgeting-and-cash-flows-estimation-2008 58/64
New Investment Example:
A toy company is thinking about to expand its
production line into stuff toys, in addition to itscurrent plastic toys. According to the firm, this expansion will notinfluence the cash flows of its current
operations. The purchase price for the newmachine is $10,000,000, and additional$2,000,000 is needed for the shipping andhandling. The firm will use straight line for its
depreciation, the depreciable life is set to be 5years, and zero salvage value. Themanufacturing department thinks the marketvalue for the machine will be $3,000,000 after
5 years.

8/8/2019 Capital Budgeting and Cash Flows Estimation (2008)
http://slidepdf.com/reader/full/capital-budgeting-and-cash-flows-estimation-2008 59/64
The marketing department thinks theexpansion will results an increase of
$6,000,000revenue for the first two years,and $8,000,000 for the final three years. Theoperating costs for the first two years will be$2,000,000, and $3,000,000 for the finalthree years. The firm needs to investadditional $1,000,000 NWC, which isexpected to be recovered in the sameamount after 5 years, for the new expansion.
The tax rate is 25%, and after-tax cost of capital for the firm is 7%, should the firm gofor the expansion?

8/8/2019 Capital Budgeting and Cash Flows Estimation (2008)
http://slidepdf.com/reader/full/capital-budgeting-and-cash-flows-estimation-2008 60/64
t=0 t=1 t=2 t=3 t=4 t=5
Purchase price
(10,000,000)
Shipping and
handling(2,000,000)
Total Cost (12,000,000)
NWCinvestment
(1,000,000)
Initial
Investment(13,000,000)
Revenue 6,000,000 6,000,000 8,000,000 8,000,000 8,000,000
Cost (2,000,000) (2,000,000) (3,000,000) (3,000,000) (3,000,000)
Depreciation 2,400,000 2,400,000 2,400,000 2,400,000 2,400,000
Operating
cash flow3,600,000 3,600,000 4,350,000 4,350,000 4,350,000

8/8/2019 Capital Budgeting and Cash Flows Estimation (2008)
http://slidepdf.com/reader/full/capital-budgeting-and-cash-flows-estimation-2008 61/64
Market value 3,000,000
Book value 0
Disposal gain 3,000,000
Tax liability (750,000)
After-tax
cash flow
from disposal
2,250,000
Recovery of
NWC1,000,000
Non-op CF 3,250,000
CF (13,000,000) 3,600,000 3,600,000 4,350,000 4,350,000 7,600,000
1NPV=$5,797,050
2IRR = 20.52%
( 3 ) PI = 1.446

8/8/2019 Capital Budgeting and Cash Flows Estimation (2008)
http://slidepdf.com/reader/full/capital-budgeting-and-cash-flows-estimation-2008 62/64
Why we do not consider the cash
flows related to the financing?
When you use the after-tax cost of capital to bethe discount rate, you basically take in the effectof the financing.
If you discount the project cash flows (without
financing) by the after-tax cost of capital, youwill get the exact net present value as you use itto discount the total cash flows (project cashflows plus the financing cash flows).
That is, when you use the after-tax cost of
capital to discount financing related cash flows,the net present value would be zero.

8/8/2019 Capital Budgeting and Cash Flows Estimation (2008)
http://slidepdf.com/reader/full/capital-budgeting-and-cash-flows-estimation-2008 63/64
t=0 t=1 t=2 t=3 t=4
Initial invest.
(total cost)
(8,000,000)
Inc. rev. 6,000,000 6,000,000 6,000,000 6,000,000
Inc. cost (2,000,000) (2,000,000) (2,000,000) (2,000,000)
Deprec. 2,000,000 2,000,000 2,000,000 2,000,000
OP CF 3,500,000 3,500,000 3,500,000 3,500,000
NOP CF 3,000,000
Project CF (8,000,000) 3,500,000 3,500,000 3,500,000 6,500,000
Financing 8,000,000
Interest (AT) (360,000) (360,000) (360,000) (360,000)
Repay. (8,000,000)
Fin. Rel. CF 8,000,000 (360,000) (360,000) (360,000) (8,360,000)
Total CF 0 3,140,000 3,140,000 3,140,000 (1,860,000)

8/8/2019 Capital Budgeting and Cash Flows Estimation (2008)
http://slidepdf.com/reader/full/capital-budgeting-and-cash-flows-estimation-2008 64/64
t=0 t=1 t=2 t=3 t=4Project CF (8,000,000) 3,500,000 3,500,000 3,500,000 6,500,000
NPV (at 4.5%) 7,072,024
t=0 t=1 t=2 t=3 t=4
Total CF 0 3,140,000 3,140,000 3,140,000 (1,860,000)
NPV (at 4.5%) 7,072,024
t=0 t=1 t=2 (t=3 t=4
Fin. Rel. CF 8,000,000 (360,000) (360,000) (360,000) (8,360,000)
NPV (at 4.5%) 0
Assuming that financing totally comes from debt, and the before-tax
cost of capital is 6%, tax rate 25%, so the after-tax cost of capital 4.5%.