part 4 of 6 excel-based budgeting for cash flows: cash...
TRANSCRIPT
Budgeting. It seems that no matter how much
we talk about it, how much time we put into it, or how
much emphasis we give it, our colleagues still don’t see its
beauty and usefulness! But we want to change that. This
is the fourth in a series of six articles describing a
detailed, Excel-based budget that can quickly and easily
provide updated information to managers, supervisors,
board members, and external stakeholders. This kind of
budget can make even long-time budget critics acknowl-
edge what a useful tool a budget can be!
Creating such a budget takes a considerable amount of
time and effort, but the rewards are well worth it. When
you’re finished, you’ll have a budget that can quickly and
easily be updated from year to year and from situation to
situation. As new information is provided, new assump-
tions or policies are made, and just a few quick adjust-
ments in one place will push new information through-
out this powerful budget. In this article, we continue
working through our example by creating the first
summary budget: the Cash Budget.
Unlike the groundwork budgets that we discussed in
earlier articles, the Cash Budget doesn’t provide the
details of your operations (like the Production, Direct
Materials, and Direct Labor budgets do), nor is it a Pro
Forma Financial Statement. Instead, it calculates how
much cash you’ll have on hand at the end of the period.
This focus allows you to determine how much, if any,
additional financing your company will need to maintain
operations or how much previous financing your compa-
ny can repay. Therefore, the Cash Budget is an invaluable
tool for both the finance department and upper manage-
ment. Senior managers and owners need to know the
34 S T R AT E G IC F I N A N C E I M a y 2 0 1 0
BUDGETING
Excel-Based Budgetingfor Cash Flows:Cash Is King!
By Teresa Stephenson, CMA, and Jason Porter
Part 4 of 6
M a y 2 0 1 0 I S T R AT E G IC F I N A N C E 35
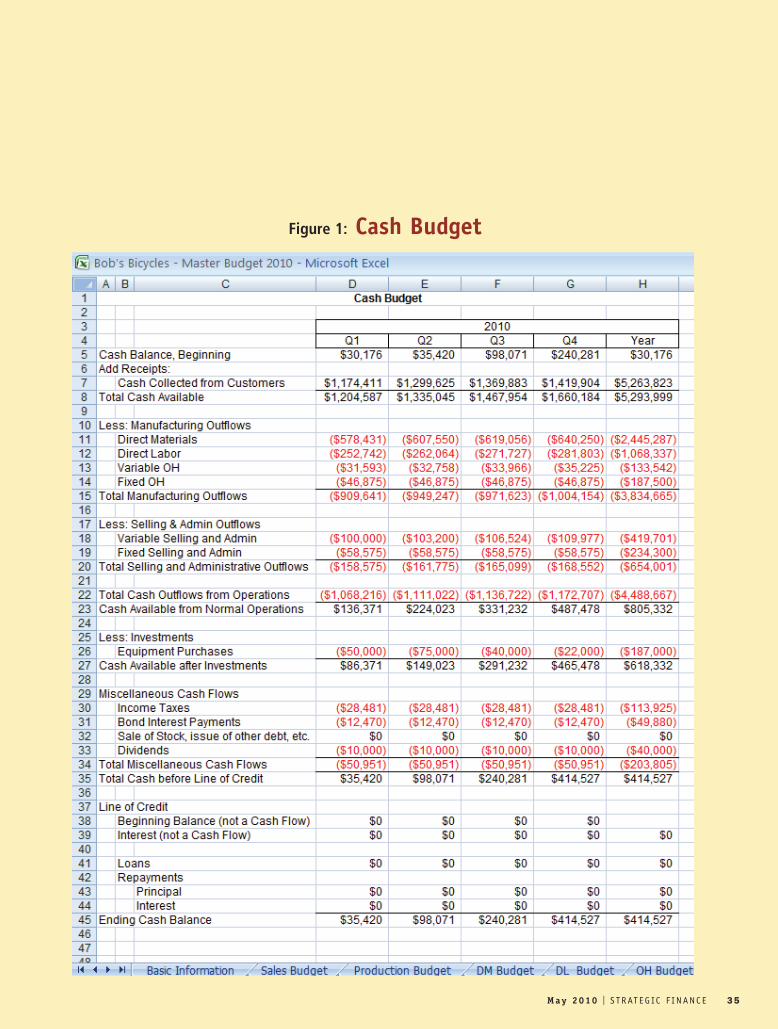
Figure 1: Cash Budget

details of operations and profitability of the company, of
course, but their primary short-term goal is to assess how
well the company is making money and how they can
generate more. Thus the old saying, “Cash is king!”
In order to provide senior management and owners
with this information, the Cash Budget pulls data from
the budgets we’ve already discussed: the Data Input
Sheet, the most fundamental part of the budget; the Cash
Collections Schedule; the Cash Disbursements Schedule;
the Direct Labor Budget; the Manufacturing Overhead
Budget; and the Selling and Administrative Budget.
Though these budgets, as well as the others we’ve already
discussed, provide a great deal of useful information for
your marketing, collections, purchasing, and production
departments, it’s the Cash Budget, as well as the Pro For-
ma Financial Statements that we’ll introduce in the next
article, that pull together all of this groundwork to pro-
vide information for top management.
We’ll give you a minute to open Excel and pull up your
work, and then we’ll get started.
Calculating Cash Available fromNormal OperationsFigure 1 shows the first portion of the Cash Budget for
Bob’s Bicycles, our example company. Unlike the ground-
work budgets that you’ve been working on, the Cash
Budget doesn’t start with your units produced or sold.
The purpose of the Cash Budget is to calculate the total
cash on hand at the end of the period, so your starting
point in Quarter 1 (Q1) is the beginning cash balance for
the year. Like all other key information, this amount is
available on the Data Input Sheet (Figure 1, February
2010) where you’ve included your Balance Sheet numbers
from the previous year. The balances for the other three
columns (Q2-Q4) will begin with the ending cash bal-
ance of the previous period. Q2, for example, will use the
ending cash balance from Q1 as its beginning balance.
The beginning balance of Q3 will use the ending balance
of Q2, and so on.
To your beginning balances, first add your cash collec-
tions during the quarter. These have already been calcu-
lated as part of the Schedule of Cash Collections. Figure 2
presents the Schedule of Cash Collections for Bob’s, and
you can see the information you need in row 19. In your
Cash Budget, you’d report “cash collected from cus-
tomers” for Q1 of $1,174,411. When working with our
students, we like to emphasize at this point that we aren’t
using total sales—we’re using cash collections. Depending
on your credit policy, there might be a big difference
between the two! This is also a major reason for having a
Cash Budget that’s separate from the Statement of Cash
Flows. By presenting actual inflows and outflows rather
than a reconciliation with net income, this budget is
more intuitive for most users.
Once you’ve calculated the total cash available (begin-
ning cash plus cash collected from customers), you can
then calculate your total manufacturing outflows. To do
this, you’ll need “total cash paid for materials” from your
Schedule of Cash Payments, which appears at the bottom
of the Direct Materials Budget (Figure 8, March 2010).
You’ll also need “total DL cost” from the Direct Labor
Budget (Figure 9, March 2010) and “total cash disburse-
ments for OH” from the Schedule of Cash Payments for
Overhead, which appears at the bottom of the Manufac-
turing Overhead Budget (Figure 3). Each of these values
is already calculated, so it’s a simple matter to link them
into the Cash Budget in Q1, then copy the equations
across to the other three quarters. The sum of direct
material, direct labor, and manufacturing overhead gives
the total cash outflows for production. By doing this,
you’re assuming that direct labor and manufacturing
overhead are paid in the current period (or so shortly
36 S T R AT E G IC F I N A N C E I M a y 2 0 1 0
BUDGETING
Figure 2: Schedule of Cash Collections
thereafter that the timing difference is immaterial). We
believe that many companies’ cash disbursements use
this assumption, but if yours doesn’t, you’ll need to cre-
ate schedules of cash disbursements for labor and over-
head that reflect the proper timing of your cash
payments in these areas. You can use the Schedule of
Cash Payments we discussed in the April 2010 issue of
Strategic Finance as a starting point if you need these
additional schedules.
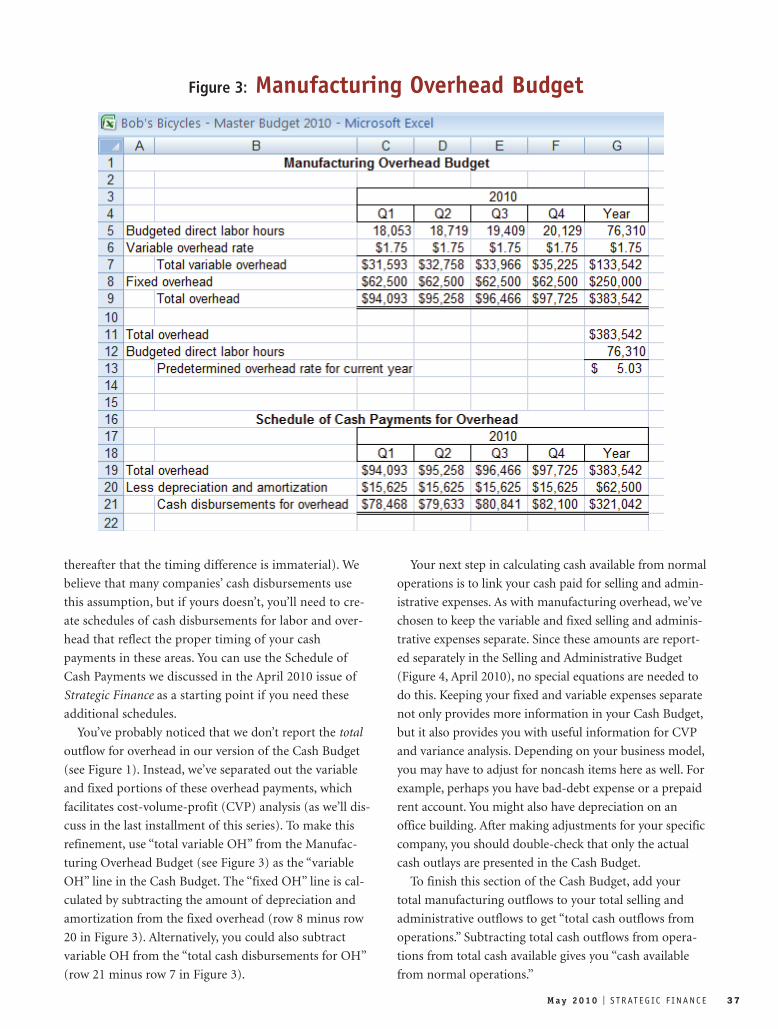
You’ve probably noticed that we don’t report the total
outflow for overhead in our version of the Cash Budget
(see Figure 1). Instead, we’ve separated out the variable
and fixed portions of these overhead payments, which
facilitates cost-volume-profit (CVP) analysis (as we’ll dis-
cuss in the last installment of this series). To make this
refinement, use “total variable OH” from the Manufac-
turing Overhead Budget (see Figure 3) as the “variable
OH” line in the Cash Budget. The “fixed OH” line is cal-
culated by subtracting the amount of depreciation and
amortization from the fixed overhead (row 8 minus row
20 in Figure 3). Alternatively, you could also subtract
variable OH from the “total cash disbursements for OH”
(row 21 minus row 7 in Figure 3).
Your next step in calculating cash available from normal
operations is to link your cash paid for selling and admin-
istrative expenses. As with manufacturing overhead, we’ve
chosen to keep the variable and fixed selling and adminis-
trative expenses separate. Since these amounts are report-
ed separately in the Selling and Administrative Budget
(Figure 4, April 2010), no special equations are needed to
do this. Keeping your fixed and variable expenses separate
not only provides more information in your Cash Budget,
but it also provides you with useful information for CVP
and variance analysis. Depending on your business model,
you may have to adjust for noncash items here as well. For
example, perhaps you have bad-debt expense or a prepaid
rent account. You might also have depreciation on an
office building. After making adjustments for your specific
company, you should double-check that only the actual
cash outlays are presented in the Cash Budget.
To finish this section of the Cash Budget, add your
total manufacturing outflows to your total selling and
administrative outflows to get “total cash outflows from
operations.” Subtracting total cash outflows from opera-
tions from total cash available gives you “cash available
from normal operations.”
M a y 2 0 1 0 I S T R AT E G IC F I N A N C E 37
Figure 3: Manufacturing Overhead Budget
Calculating Total Cash BeforeFinancingThe next section of the Cash Budget organizes the cash
information found in the Data Input Sheet (see Figure 1,
row 25). There are many ways to organize this section,
and it should be structured in the format that best serves
your company. In our example, we decided to present all
of Bob’s investments first. For this company, the only
investments are PPE (property, plant, and equipment),
but this section could also include investments in stocks
and bonds, loans to other businesses, expansion funds,
etc. It should also include any cash inflows from selling
investments. Placing them together this way makes it a
little easier to find important information when you cre-
ate your Pro Forma Financial Statements. After listing all
of your investment inflows and outflows, you then calcu-
late “cash available after investments.”
Since Bob’s is a small company, we’ve chosen to lump
the rest of its cash transactions in a section called “miscel-
laneous cash flows.” In this section, we’ve included cash
payments for taxes, cash payments on debt, cash inflows
from selling stock or other financing, and cash payments
for dividends. Larger companies, or companies with many
loans and other financing obligations, might want to cre-
ate a separate section for each group of transactions. Simi-
larly, depending on your company’s transactions for the
period, you might want to either list your cash inflows as
separate lines or use subheaders and totals for particular
types of transactions, such as inventory financing or loans
related to a particular business segment, to provide a little
more information. As with the other budgets, all of the
information we just discussed is found on the Data Input
Sheet. Figure 4 shows how we organized the cash flow
information in Bob’s Data Input Sheet. Most of this infor-
mation is straightforward, so we won’t go through it line
by line. We’ve chosen to break the payments down into
quarterly payments, such as quarterly bond and dividend
payments (found on the Data Input Sheet and shown in
Figure 4), but you can easily use one-time payments as
long as they’re linked into the Cash Budget correctly. If
you choose to use one-time payments, then you might
want to set up something like the Planned Expansion
table shown in Figure 4. Creating a table like this allows
you to put in different amounts for each quarter without
having to change the links in your Cash Budget each time
you update your budget.
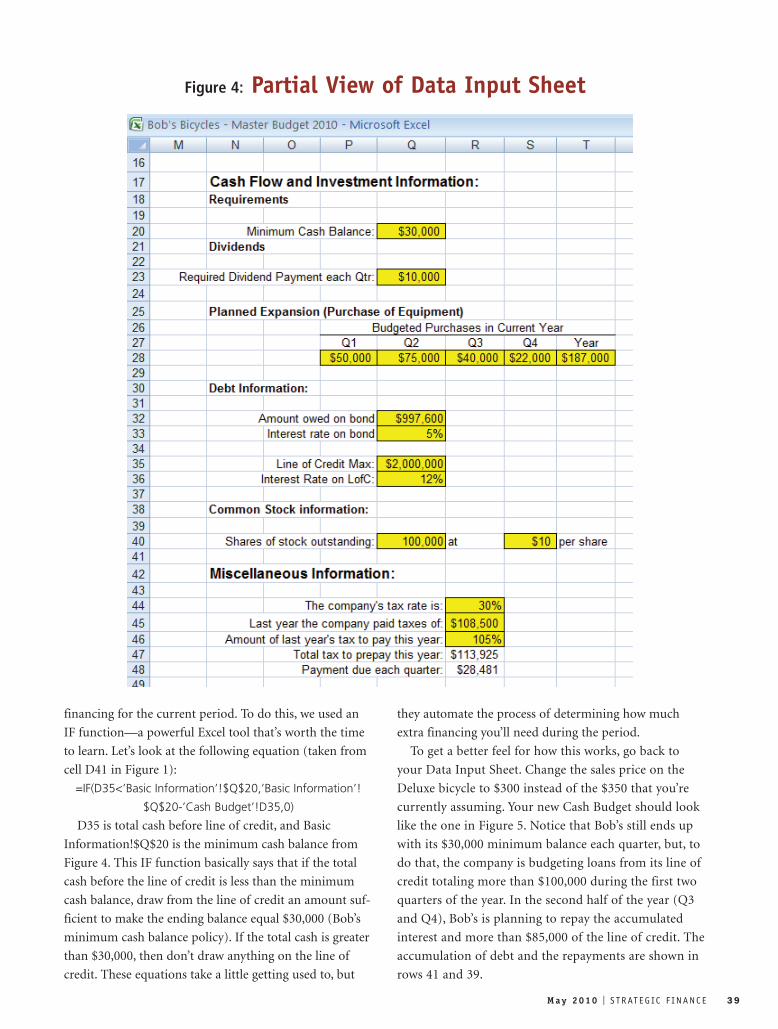
The last miscellaneous item we need to discuss is cash
paid for taxes. As you know (probably too well), esti-
mating taxes and determining how much should be paid
each period is a difficult endeavor. It’s even more diffi-
cult to budget for the taxes that will be paid in the
future. Mistakes can be costly since the Internal Revenue
Service (IRS) assesses penalties if the funds remitted
each quarter aren’t sufficient to cover your tax liability
for that quarter. To avoid both the difficulty and the
possible penalties, we’ve chosen to use the IRS “safe har-
bor” rules in calculating the amount of taxes that Bob’s
will need to remit each quarter. These rules allow com-
panies to pay based on their prior-period tax liability,
avoiding late penalties by making payments in good
faith. (IRC §6655 requires corporations to make esti-
mated payments equal to 100% of last year’s tax liability
or 100% of the current year’s liability. The regulations
regarding “safe harbor” rules for estimated tax payments
can be found in 26 CFR Part 1 Income Tax; Safe Harbor
for Certain Installments of Corporate Estimated Tax
Due [T.D. 8132] 52 FR 10049.) For Bob’s, we chose to
use 105% of the prior-year’s tax liability as a conserva-
tive estimate for the tax payments. You can find the cal-
culations for the tax payments on the Data Input Sheet
and shown at the bottom of Figure 4.
Your final step in this section is to subtract net miscel-
laneous payments (or add net miscellaneous inflows) to
your cash available after investments to get “total cash
before extra financing.” Every company has to have some
form of additional financing available to cover dips in
working capital. For Bob’s, this is a line of credit, so we
called the line “total cash before line of credit,” but the
financing source will vary for every company (line of
credit, money from the owner, short-term bonds, expan-
sion funds, sale of stock, etc.)
Calculating Necessary FinancingIf you go back to Figure 4, you’ll see that Bob’s has a
company policy to maintain a minimum balance of
$30,000 in cash. In our example, Bob’s is having a great
year. You’ll notice in Figure 1 that Bob’s didn’t need to
borrow any additional money to finance its operations or
to maintain its minimum cash balance of $30,000. But
most companies aren’t so lucky. This last section, then, is
designed to calculate how much extra financing is needed
each period. To do this, the first line shows how much
Bob’s has already drawn on its line of credit. The next
line calculates the interest on the line of credit by taking
the amount already drawn plus any drawn during the
current period and multiplying the total by the quarterly
interest rate on the line of credit.
The next line shows how much Bob’s needs in extra
38 S T R AT E G IC F I N A N C E I M a y 2 0 1 0
BUDGETING
M a y 2 0 1 0 I S T R AT E G IC F I N A N C E 39
financing for the current period. To do this, we used an
IF function—a powerful Excel tool that’s worth the time
to learn. Let’s look at the following equation (taken from
cell D41 in Figure 1):
=IF(D35<’Basic Information’!$Q$20,’Basic Information’!
$Q$20-’Cash Budget’!D35,0)
D35 is total cash before line of credit, and Basic
Information!$Q$20 is the minimum cash balance from
Figure 4. This IF function basically says that if the total
cash before the line of credit is less than the minimum
cash balance, draw from the line of credit an amount suf-
ficient to make the ending balance equal $30,000 (Bob’s
minimum cash balance policy). If the total cash is greater
than $30,000, then don’t draw anything on the line of
credit. These equations take a little getting used to, but
they automate the process of determining how much
extra financing you’ll need during the period.
To get a better feel for how this works, go back to
your Data Input Sheet. Change the sales price on the
Deluxe bicycle to $300 instead of the $350 that you’re
currently assuming. Your new Cash Budget should look
like the one in Figure 5. Notice that Bob’s still ends up
with its $30,000 minimum balance each quarter, but, to
do that, the company is budgeting loans from its line of
credit totaling more than $100,000 during the first two
quarters of the year. In the second half of the year (Q3
and Q4), Bob’s is planning to repay the accumulated
interest and more than $85,000 of the line of credit. The
accumulation of debt and the repayments are shown in
rows 41 and 39.
Figure 4: Partial View of Data Input Sheet
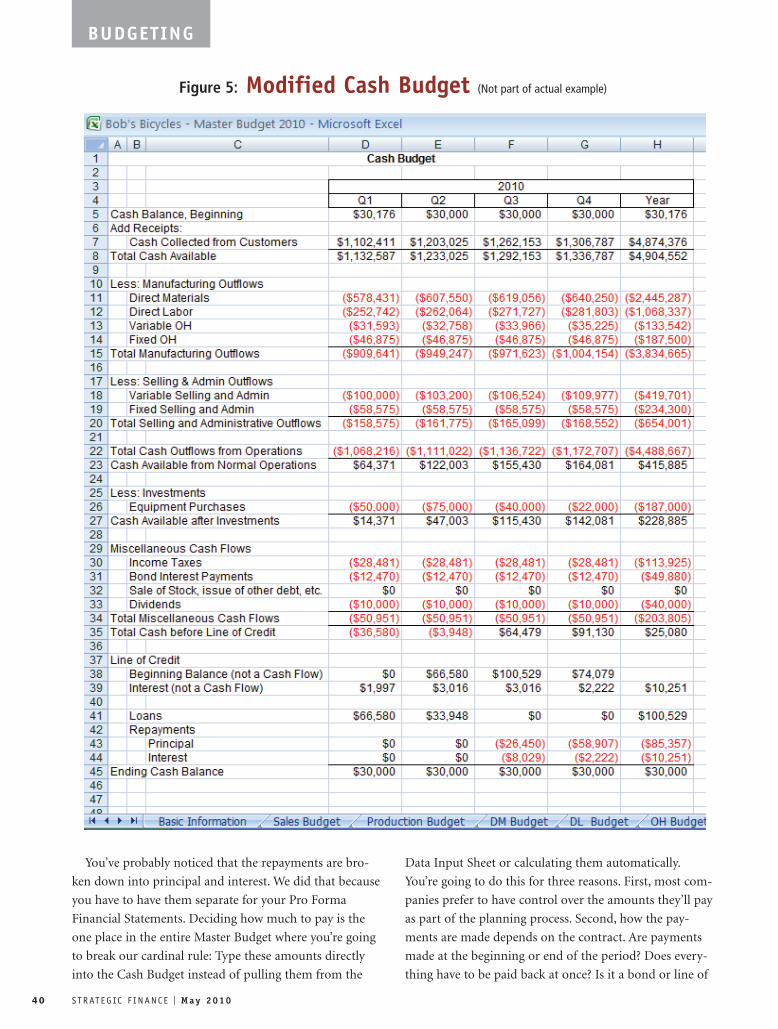
You’ve probably noticed that the repayments are bro-
ken down into principal and interest. We did that because
you have to have them separate for your Pro Forma
Financial Statements. Deciding how much to pay is the
one place in the entire Master Budget where you’re going
to break our cardinal rule: Type these amounts directly
into the Cash Budget instead of pulling them from the
Data Input Sheet or calculating them automatically.
You’re going to do this for three reasons. First, most com-
panies prefer to have control over the amounts they’ll pay
as part of the planning process. Second, how the pay-
ments are made depends on the contract. Are payments
made at the beginning or end of the period? Does every-
thing have to be paid back at once? Is it a bond or line of
40 S T R AT E G IC F I N A N C E I M a y 2 0 1 0
Figure 5: Modified Cash Budget (Not part of actual example)
BUDGETING
credit? The list of possibilities goes on and on. Third, try-
ing to automate the process in Excel is so extensive with
the other equations in the Cash Budget that we didn’t feel
it was worth the complication—and trying to do it with-
out creating a circular logic loop is pretty darned hard!
Instead, we recommend that either the finance or
accounting manager type in the information each period
based on the company’s policies, contracts, and cash
available. Just make sure that only the accounting or
finance departments can make these changes, or you
might end up with cash flows that make no sense. (We’ll
discuss how to block unauthorized changes in the last
article of this series.) The final line, of course, is the end-
ing cash balance for the period. This is the “total cash
before line of credit” plus “loans” and less any “principal”
and “interest” repayments on the line of credit. Don’t add
or subtract the information on rows 37-39. The informa-
tion on those rows keeps track of principal and interest
owed, not the cash flows. Once you’ve done this calcula-
tion, you can link the ending balance for each quarter
into the beginning balance for the following quarter.
Finishing the “Year” ColumnThe column for the yearly totals takes a little extra care.
First, the beginning balance in the “Year” column should
equal the beginning balance in Q1 since both Q1 and the
year begin on January 1 (or whatever day your fiscal year
begins). Most of the other numbers are the sum of the
annual inflows and outflows, but the totals (such as total
cash available and cash available from normal operations)
need to be based on the same equations as the quarterly
subtotals. For example, “total cash available for the year”
needs to be the annual beginning balance plus the total
cash collections from customers. Using the sum of the
four quarters will double and triple count the beginning
balances. If you use quarterly sums for each reporting
line (i.e., those coming from the data input page and the
other budgets) and copy over the equations from the
quarterly columns for all of the subtotals, you should
avoid the “double counting” problem. Take a minute to
think that through, and it will make sense, but we find
many of our students don’t grasp this right off the bat. If
you’ve done it correctly, the ending balance for Q4 will
also be the ending balance for the year. Again, that should
make sense because the end of Q4 and the end of the year
is December 31 for calendar-based companies.
Voila! Once your Q4 and annual column balance, your
Cash Budget is done and you’re ready to create the Pro
Forma Financial Statements.
Good Communication ToolsThe first article in this series discussed the importance of
budgets, the usefulness of an Excel-based budget, the Data
Input Sheet, and the Sales Budget. The second article
showed how to create the Production, Direct Materials, and
Direct Labor budgets. The third article continued the series
by discussing the creation of the Manufacturing Overhead
Budget, the Ending Finished Goods Inventory Budget, and
the Selling and Administrative Budget. This article dis-
cussed the first of the summary budgets, the Cash Budget.
This budget begins summarizing the work of the other
budgets for internal purposes, such as financing decisions,
CVP analysis, and company policy decision making.
Though the Cash Budget provides a key input for
internal decision making, it can also be invaluable for
communicating with bankers, other creditors, equity
holders, unions, and other external stakeholders. Since
the Cash Budget doesn’t provide the details of your oper-
ations (like the Production, Direct Materials, and Direct
Labor budgets), you can give it to these external parties
without risking your competitive advantage or giving
away other details of your operations. Also, for many
businesses, especially smaller ones, this Cash Budget may
actually prove more important when seeking external
financing than the Pro Forma Financial Statements.
Now that our first summary budget is done, we can
turn our attention to the concluding pieces of the Master
Budget: the Pro Forma Financial Statements. These final
segments of the Master Budget provide key information
for current decision making as well as important infor-
mation you can use for benchmarking and financial
analysis. In the next article we’ll focus on creating these
Pro Forma Financial Statements, and then we’ll finish our
series talking about using the Master Budget for decision
making and discussing some ethical issues surrounding
budgeting. Until then, happy budgeting! SF
Teresa Stephenson, CMA, Ph.D., is assistant professor of
accounting at the University of Wyoming and is a member
of IMA’s Denver-Centennial Chapter. You can reach her at
(307) 766-3836 or [email protected].
Jason Porter, Ph.D., is assistant professor of accounting at
the University of Idaho and is a member of IMA’s Washing-
ton Tri-Cities Chapter. You can reach him at (208) 885-
7153 or [email protected].
Note: A copy of the example spreadsheet, including all the
formulas, is available from either author.
M a y 2 0 1 0 I S T R AT E G IC F I N A N C E 41