bill stankiewicz copy scope 2010 disney.com
DESCRIPTION
Scope conference 2010 in Florida, Bill Stankiewicz attended.www.shipperswarehouse.comTRANSCRIPT

Disney E-Commerce Leverages
Business Intelligence
to improve Profitability
&
Carlton Farr Jonathan Shaver
transportation business intelligence
Disney E-Commerce Case Study | Introduction |
• Disney E-Commerce is a division of Disney Consumer Products business segment of the Walt Disney Company.
• Provides direct to consumer services including:
– Online ordering
– Customer service
– Warehousing and order fulfillment for Disneystore.com
• Corporate offices in Glendale CA
• Fulfillment Facility in Jonesville SC
• A leading logistics and financial services company
– Serves Parcel, LTL, & TL shippers with complex data needs
– Premier provider of shipping data accuracy, visibility and velocity
– Processes 500 Million + transactions
• Headquartered in Chicago IL
• Reduce freight spend 5% - 20%

transportation business intelligence
• Limited link between transportation department and finance
– Finance conducted manual accrual
• Timeliness of data
– Delays in billing information and formatting usefulness
• Comprehensive nature of the data
– Limited detail provided
– Accuracy, including the audit, was in question
• Difficulty conducting analysis on transportation spend
– Limited tools
– Data missing key elements to perform analysis
• No continued process to convert data into useful information tools
Complete Data Capture Tools to Convert Raw Data into Intelligent Output
Disney E-Commerce Case Study | Key Business Challenges |
transportation business intelligence
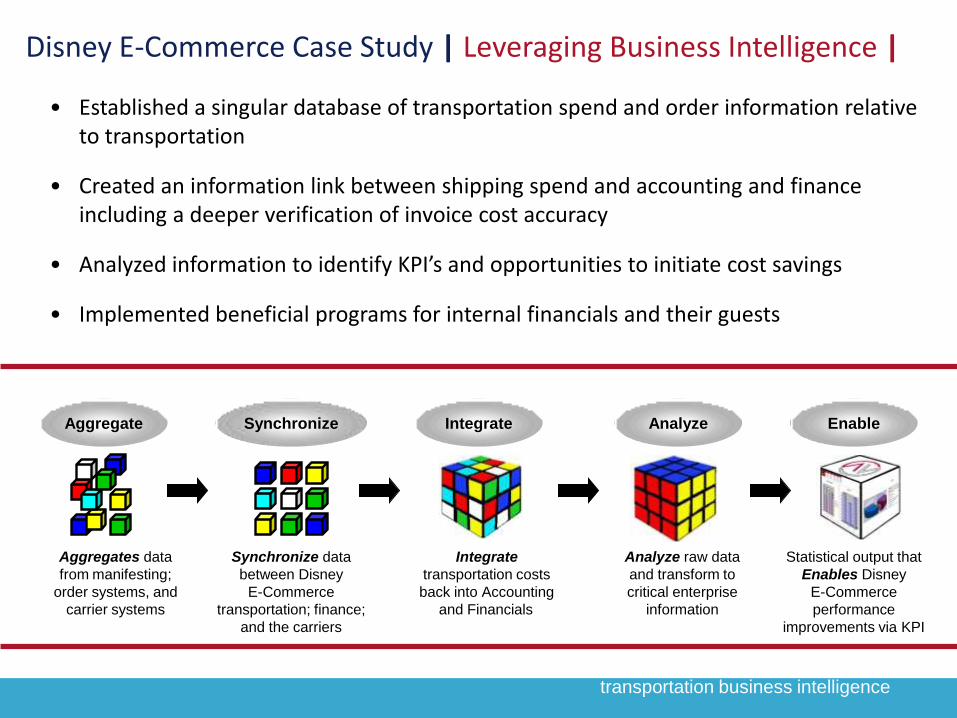
• Established a singular database of transportation spend and order information relative to transportation
• Created an information link between shipping spend and accounting and finance including a deeper verification of invoice cost accuracy
• Analyzed information to identify KPI’s and opportunities to initiate cost savings
• Implemented beneficial programs for internal financials and their guests
Disney E-Commerce Case Study | Leveraging Business Intelligence |
Aggregate
Aggregates data
from manifesting;
order systems, and
carrier systems
Synchronize data
between Disney
E-Commerce
transportation; finance;
and the carriers
Integrate
transportation costs
back into Accounting
and Financials
Analyze raw data
and transform to
critical enterprise
information
Statistical output that
Enables Disney
E-Commerce
performance
improvements via KPI
Synchronize Integrate Analyze Enable

transportation business intelligence
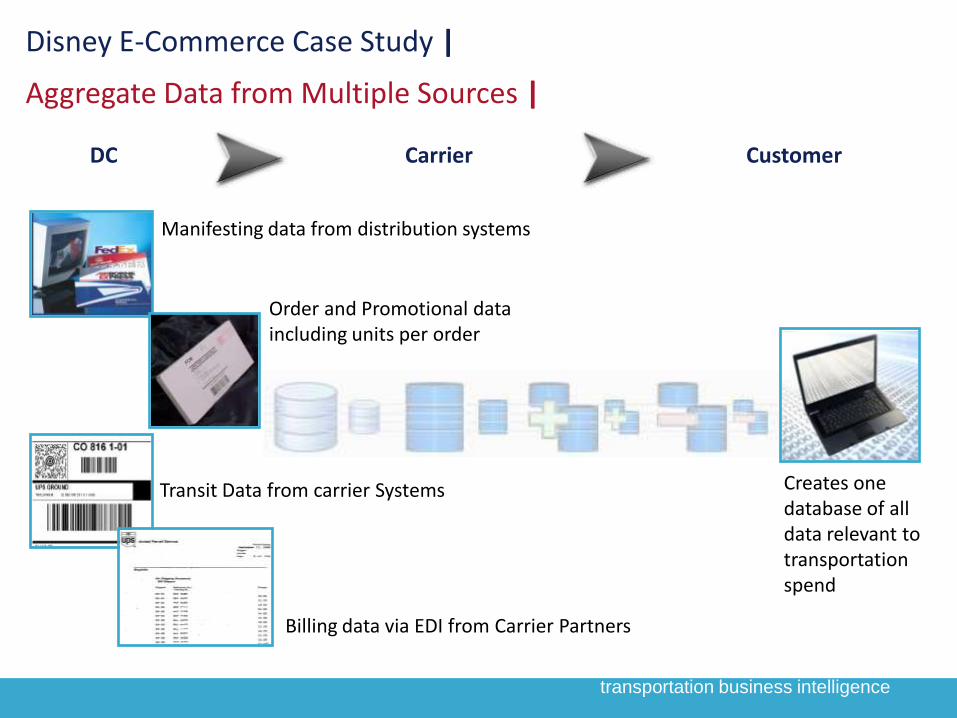
Disney E-Commerce Case Study | Aggregate |
Aggregate
transportation business intelligence
Disney E-Commerce Case Study |
Aggregate Data from Multiple Sources |
Creates one database of all data relevant to transportation spend
DC Carrier Customer
Manifesting data from distribution systems
Order and Promotional data including units per order
Transit Data from carrier Systems
Billing data via EDI from Carrier Partners

transportation business intelligence
Disney E-Commerce Case Study | Synchronize |
Synchronize
transportation business intelligence
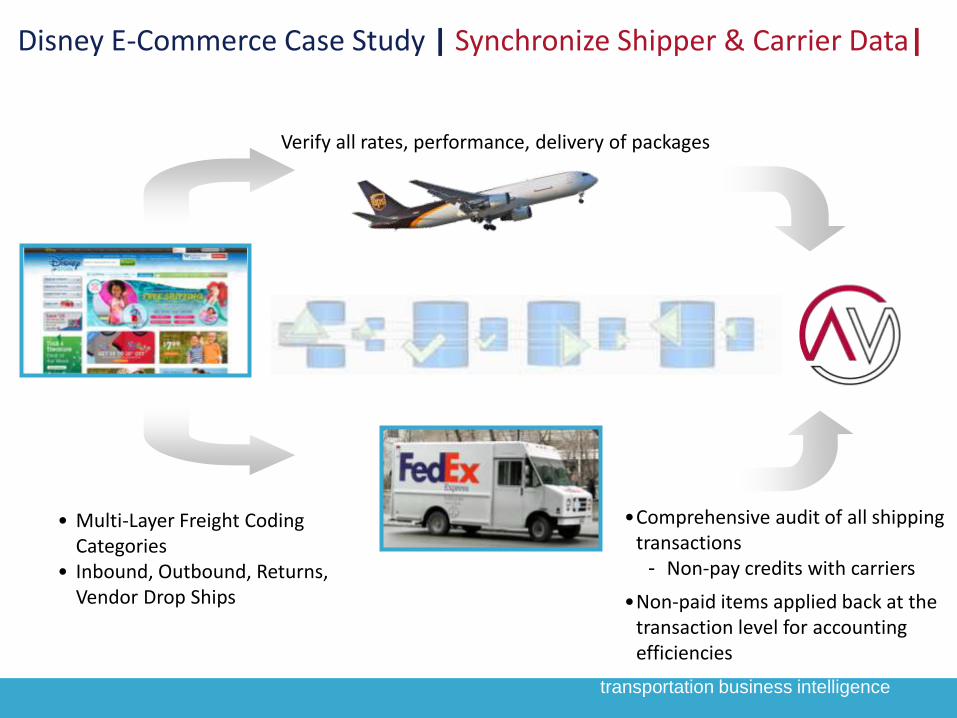
Disney E-Commerce Case Study | Synchronize Shipper & Carrier Data|
Verify all rates, performance, delivery of packages
• Multi-Layer Freight Coding Categories
• Inbound, Outbound, Returns, Vendor Drop Ships
•Comprehensive audit of all shipping transactions
- Non-pay credits with carriers
•Non-paid items applied back at the transaction level for accounting efficiencies
transportation business intelligence
Disney E-Commerce Case Study | Integrate |
Integrate
transportation business intelligence
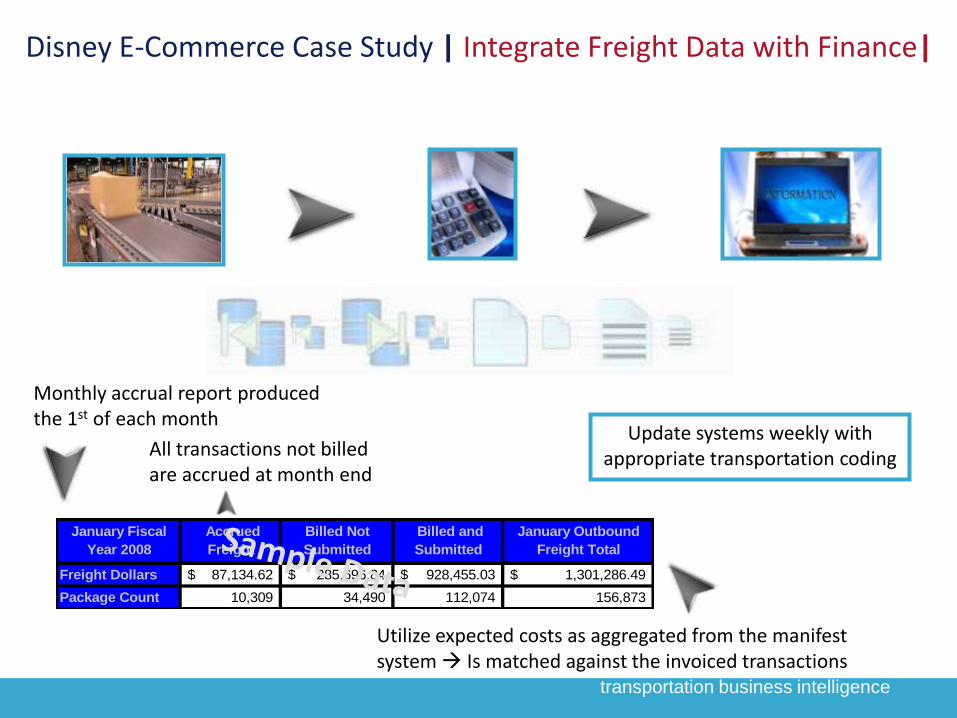
Disney E-Commerce Case Study | Integrate Freight Data with Finance|
Monthly accrual report produced the 1st of each month
All transactions not billed are accrued at month end
Utilize expected costs as aggregated from the manifest system Is matched against the invoiced transactions
Update systems weekly with appropriate transportation coding
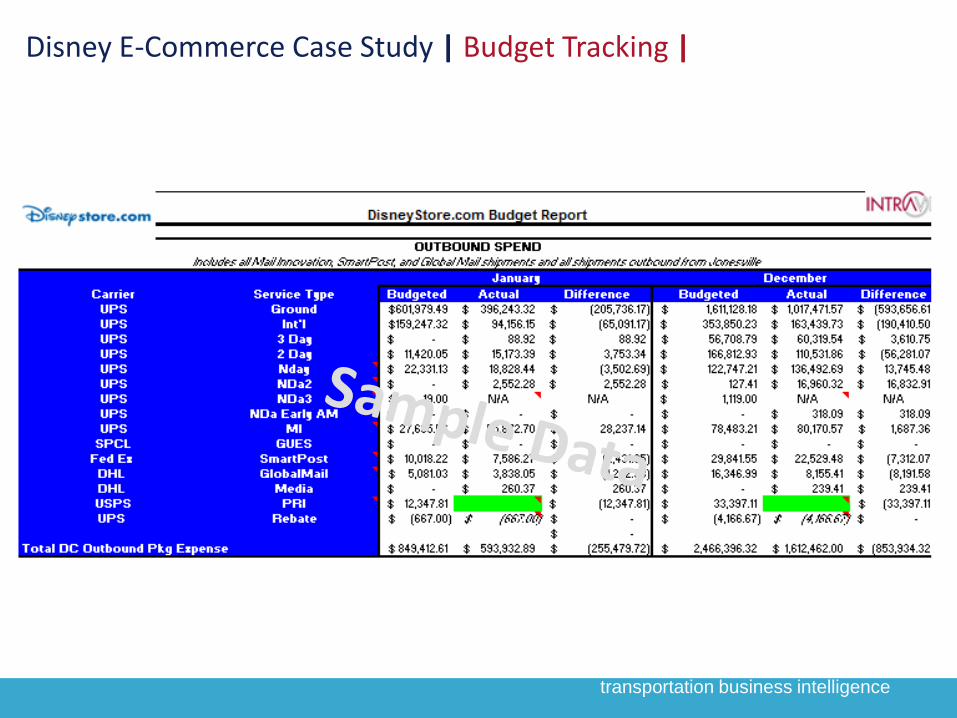
January Fiscal
Year 2008
Accrued
Freight
Billed Not
Submitted
Billed and
Submitted
January Outbound
Freight Total
Freight Dollars 87,134.62$ 285,696.84$ 928,455.03$ 1,301,286.49$
Package Count 10,309 34,490 112,074 156,873
transportation business intelligence
Disney E-Commerce Case Study | Analyze |
Analyze

transportation business intelligence
• Monthly KPI (Key Performance Indicator) Reports provide high level tracking of transportation performance
• Return on Investment tracking of key initiatives
– Address Hygiene software impact on address correction and delivery performance
– Invoice verification and settlement metrics
– Key lane analysis on cost and performance puts Disney E-commerce in an improved position to evaluate parcel alternative programs; including hub drop shipping; consolidator programs
• Expected cost of shipping vs. Actual Billed Cost at a unit number level vs. Shipping and Handling charged to Guests
– Determined were undercharging for key International lanes and therefore producing unprofitable customer orders
Disney E-Commerce Case Study | Data Visibility for Analysis |
transportation business intelligence
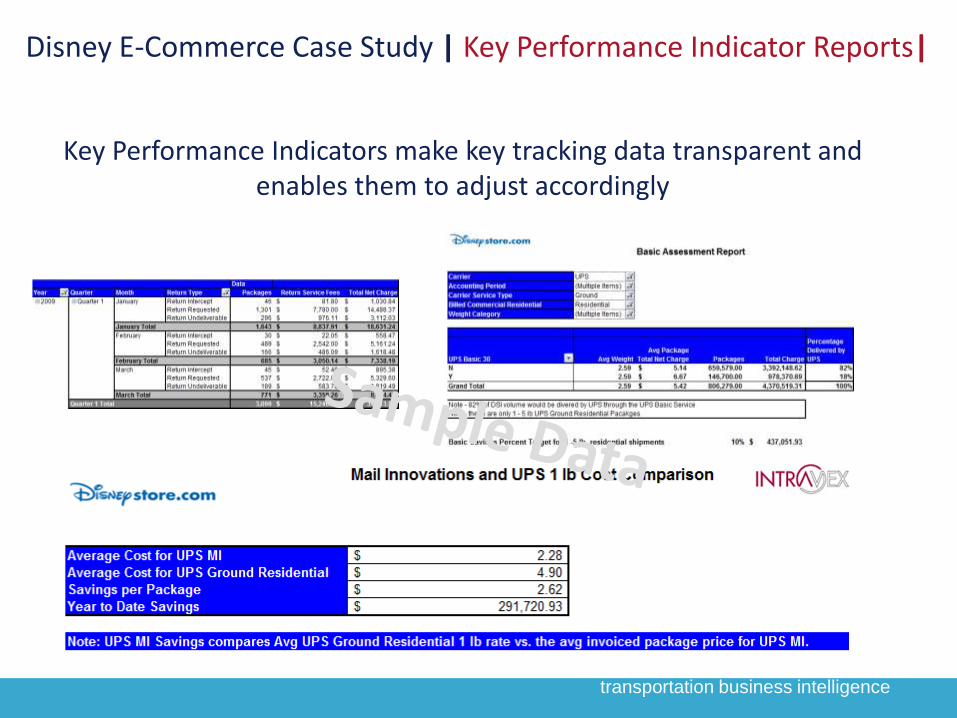
Disney E-Commerce Case Study | Key Performance Indicator Reports|
Key Performance Indicators make key tracking data transparent and enables them to adjust accordingly
transportation business intelligence
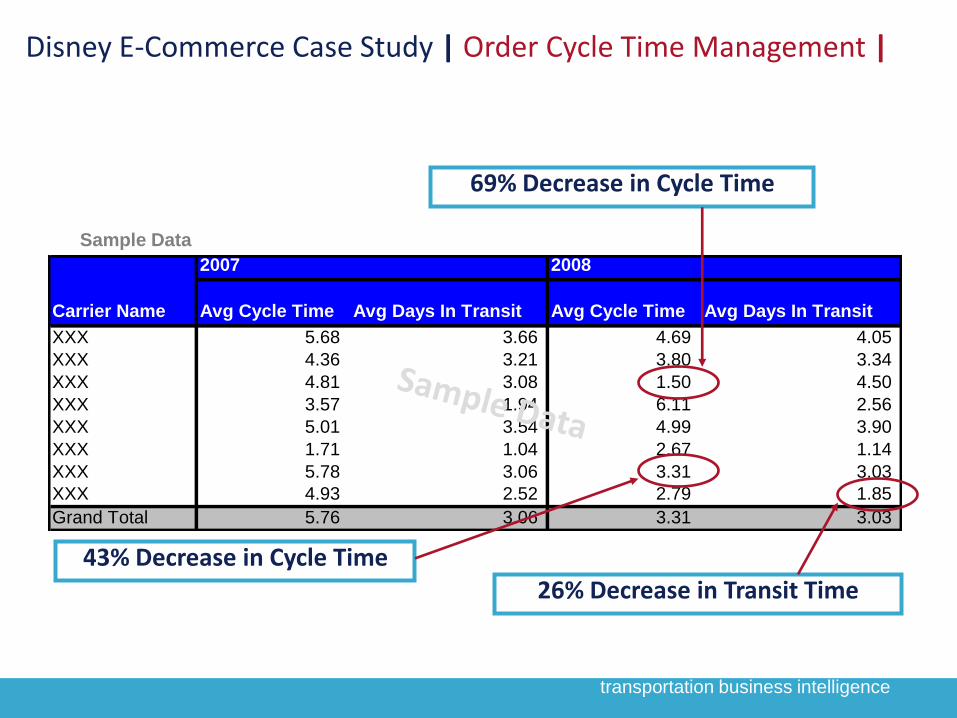
Disney E-Commerce Case Study | Order Cycle Time Management |
2007 2008
Carrier Name Avg Cycle Time Avg Days In Transit Avg Cycle Time Avg Days In Transit
XXX 5.68 3.66 4.69 4.05
XXX 4.36 3.21 3.80 3.34
XXX 4.81 3.08 1.50 4.50
XXX 3.57 1.94 6.11 2.56
XXX 5.01 3.54 4.99 3.90
XXX 1.71 1.04 2.67 1.14
XXX 5.78 3.06 3.31 3.03
XXX 4.93 2.52 2.79 1.85
Grand Total 5.76 3.06 3.31 3.03
69% Decrease in Cycle Time
43% Decrease in Cycle Time 26% Decrease in Transit Time
Sample Data
transportation business intelligence
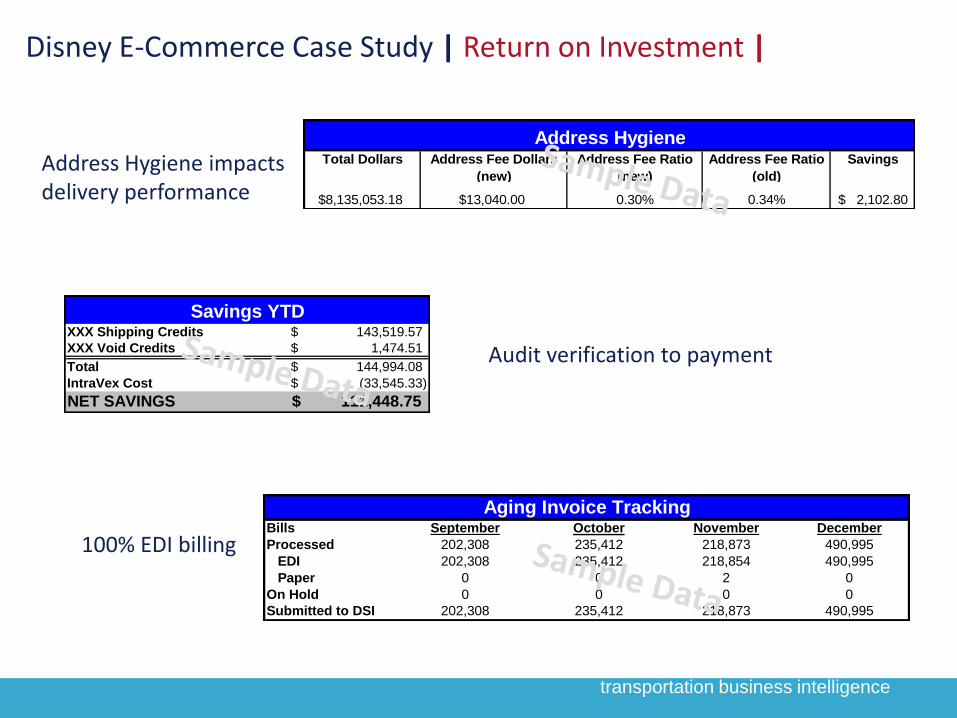
Disney E-Commerce Case Study | Return on Investment |
Address Hygiene impacts delivery performance
Audit verification to payment
100% EDI billingBills September November December
Processed 202,308 218,873 490,995
EDI 202,308 218,854 490,995
Paper 0 2 0
On Hold 0 0 0
Submitted to DSI 202,308 218,873 490,995
October
0
235,412
235,412
235,412
0
Aging Invoice Tracking
Total Dollars Savings
$8,135,053.18 2,102.80$
Address Hygiene
$13,040.00 0.30% 0.34%
Address Fee Dollars
(new)
Address Fee Ratio
(new)
Address Fee Ratio
(old)
XXX Shipping Credits 143,519.57$
XXX Void Credits 1,474.51$
Total 144,994.08$
IntraVex Cost (33,545.33)$
NET SAVINGS 111,448.75$
Savings YTD
transportation business intelligence
Disney E-Commerce Case Study | Budget Tracking |
transportation business intelligence
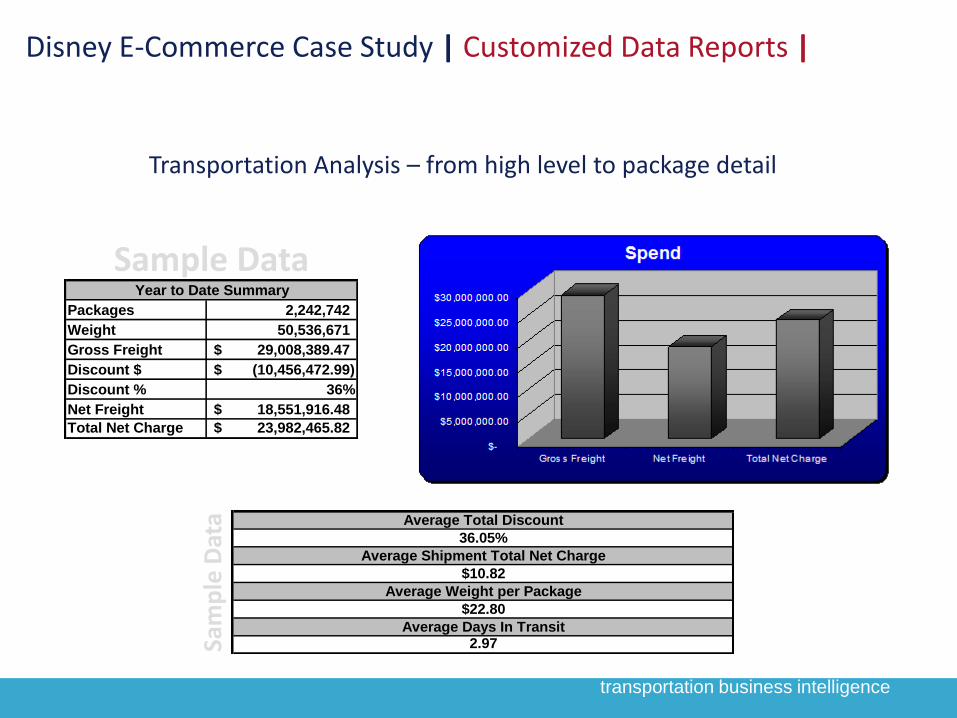
Disney E-Commerce Case Study | Customized Data Reports |
Transportation Analysis – from high level to package detail
Packages 2,242,742
Weight 50,536,671
Gross Freight 29,008,389.47$
Discount $ (10,456,472.99)$
Discount % 36%
Net Freight 18,551,916.48$
Total Net Charge 23,982,465.82$
Year to Date Summary
Average Total Discount
Average Shipment Total Net Charge
$22.80
36.05%
Average Days In Transit2.97
$10.82
Average Weight per Package
Sam
ple
Dat
a
Sample Data
transportation business intelligence
Disney E-Commerce Case Study | Enable |
Enable
transportation business intelligence
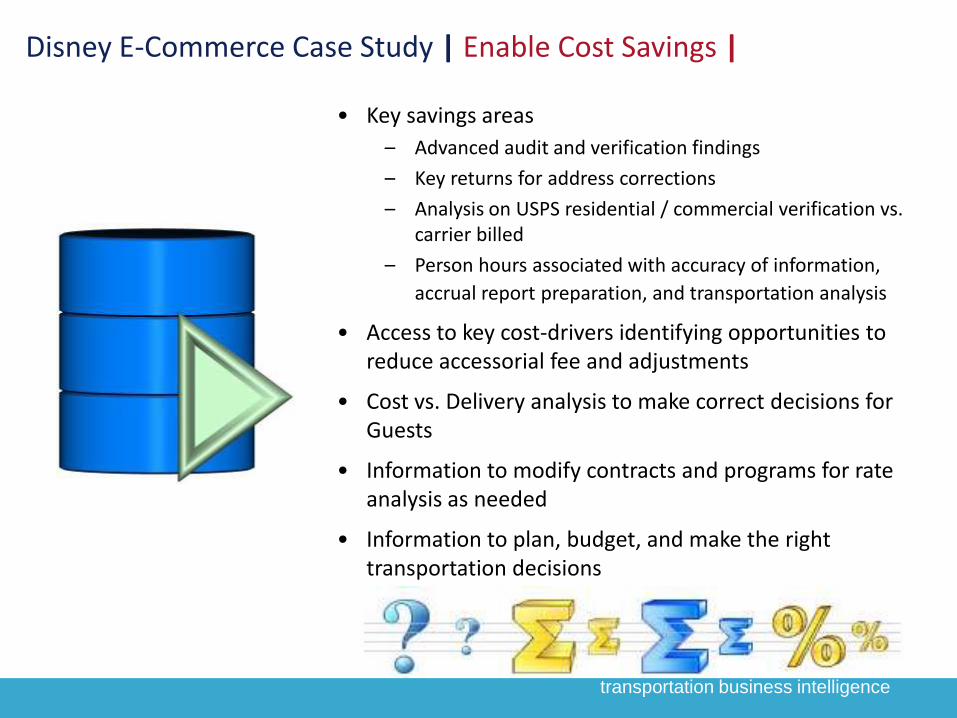
• Key savings areas
– Advanced audit and verification findings
– Key returns for address corrections
– Analysis on USPS residential / commercial verification vs. carrier billed
– Person hours associated with accuracy of information,
accrual report preparation, and transportation analysis
• Access to key cost-drivers identifying opportunities to reduce accessorial fee and adjustments
• Cost vs. Delivery analysis to make correct decisions for Guests
• Information to modify contracts and programs for rate analysis as needed
• Information to plan, budget, and make the right transportation decisions
Disney E-Commerce Case Study | Enable Cost Savings |

transportation business intelligence
Disney E-Commerce Case Study | Non-Disney E-Commerce Analysis |
Non-Disney E-Commerce
Analysis
transportation business intelligence
Disney E-Commerce Case Study | Enabling Deeper Analysis |
Div
isio
n 1
Div
isio
n 2
Div
isio
n 3
Div
isio
n 4
Div
isio
n 5
Div
isio
n 6
Div
isio
n 8
Int.
Div
isio
n
Gra
nd Tota
l
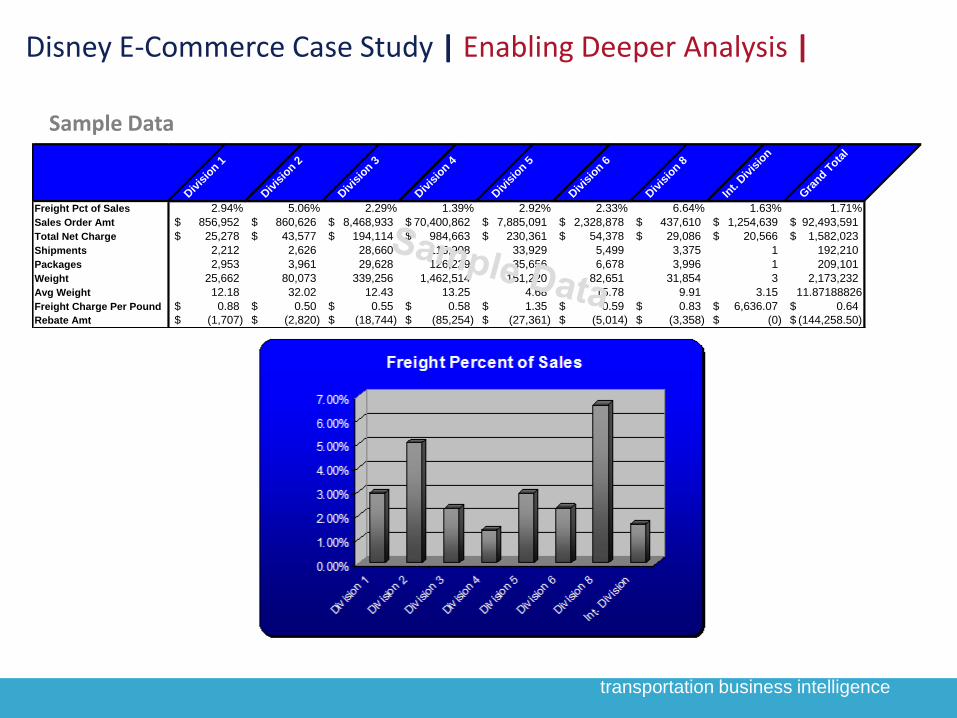
Freight Pct of Sales 2.94% 5.06% 2.29% 1.39% 2.92% 2.33% 6.64% 1.63% 1.71%
Sales Order Amt 856,952$ 860,626$ 8,468,933$ 70,400,862$ 7,885,091$ 2,328,878$ 437,610$ 1,254,639$ 92,493,591$
Total Net Charge 25,278$ 43,577$ 194,114$ 984,663$ 230,361$ 54,378$ 29,086$ 20,566$ 1,582,023$
Shipments 2,212 2,626 28,660 115,908 33,929 5,499 3,375 1 192,210
Packages 2,953 3,961 29,628 126,229 35,656 6,678 3,996 1 209,101
Weight 25,662 80,073 339,256 1,462,514 151,220 82,651 31,854 3 2,173,232
Avg Weight 12.18 32.02 12.43 13.25 4.68 15.78 9.91 3.15 11.87188826
Freight Charge Per Pound 0.88$ 0.50$ 0.55$ 0.58$ 1.35$ 0.59$ 0.83$ 6,636.07$ 0.64$
Rebate Amt (1,707)$ (2,820)$ (18,744)$ (85,254)$ (27,361)$ (5,014)$ (3,358)$ (0)$ (144,258.50)$
Sample Data
transportation business intelligence
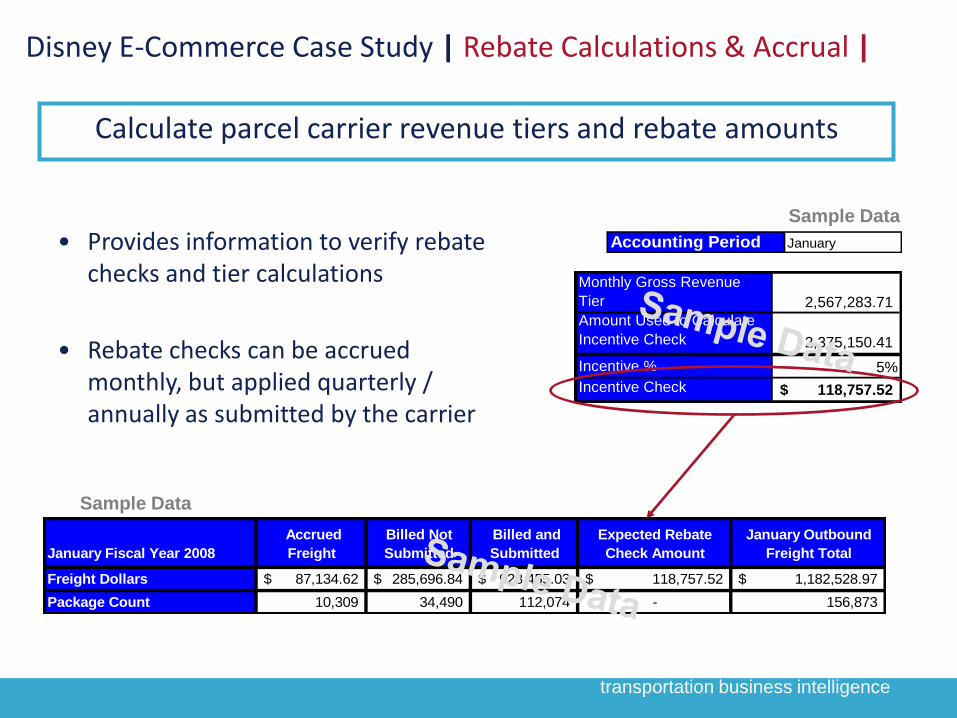
Disney E-Commerce Case Study | Rebate Calculations & Accrual |
• Provides information to verify rebate checks and tier calculations
• Rebate checks can be accrued monthly, but applied quarterly / annually as submitted by the carrier
January Fiscal Year 2008
Accrued
Freight
Billed Not
Submitted
Billed and
Submitted
Expected Rebate
Check Amount
January Outbound
Freight Total
Freight Dollars 87,134.62$ 285,696.84$ 928,455.03$ 118,757.52$ 1,182,528.97$
Package Count 10,309 34,490 112,074 - 156,873
Accounting Period January
Monthly Gross Revenue
Tier 2,567,283.71
Amount Used to Calculate
Incentive Check 2,375,150.41
Incentive % 5%
Incentive Check 118,757.52$
Calculate parcel carrier revenue tiers and rebate amounts
Sample Data
Sample Data
transportation business intelligence
Disney E-Commerce Case Study | Key Take Away |
Complete data capture Tools to convert raw data into intelligent output
• Link transportation and finance departments via data
• Leverage data to structure contracts and programs to mitigate cost increases
• Create a database that houses key performance data as it relates to transportation
• Understand expected vs. actual costs vs. customer shipping and handling
• Delivery performance to customers