bill stankiewicz scope 2010 copy pepsi bottling
DESCRIPTION
Scope conference 2010 in Florida, Bill Stankiewicz attended.www.shipperswarehouse.comTRANSCRIPT
Leveraging Metrics for World Class Performance SCOPE East, April 2010
© 2010 TranSystems, All Rights Reserved 1
Leveraging Metrics for World Class Performance
© 2010 TranSystems. All rights reserved. © 2010 Pepsi Beverages Company. All rights reserved.
John M. Hill
BEFORE WE BEGIN - - -
Samuel Johnson 1709 – 1784
People need to be reminded
more often than they need to be
instructed.
Leveraging Metrics for World Class Performance SCOPE East, April 2010
© 2010 TranSystems, All Rights Reserved 2
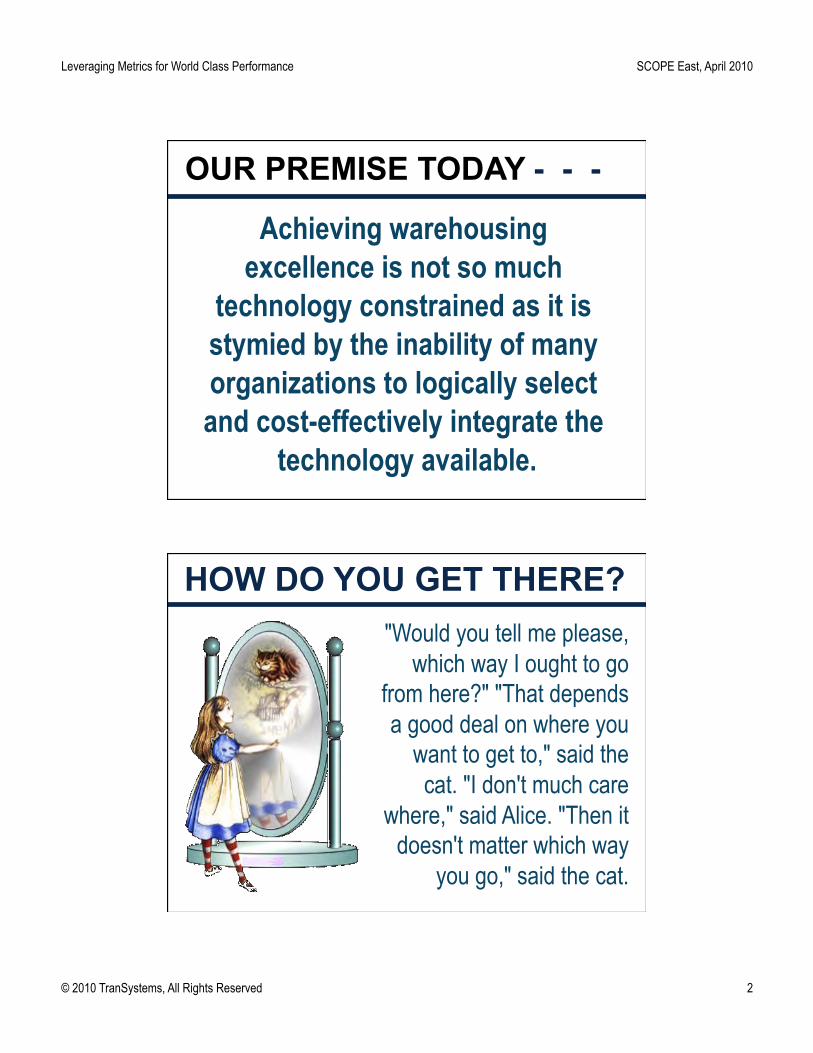
Achieving warehousing excellence is not so much
technology constrained as it is stymied by the inability of many organizations to logically select and cost-effectively integrate the
technology available.
OUR PREMISE TODAY - - -
"Would you tell me please, which way I ought to go
from here?" "That depends a good deal on where you
want to get to," said the cat. "I don't much care
where," said Alice. "Then it doesn't matter which way
you go," said the cat.
HOW DO YOU GET THERE?
Lewis Carroll
Leveraging Metrics for World Class Performance SCOPE East, April 2010
© 2010 TranSystems, All Rights Reserved 3
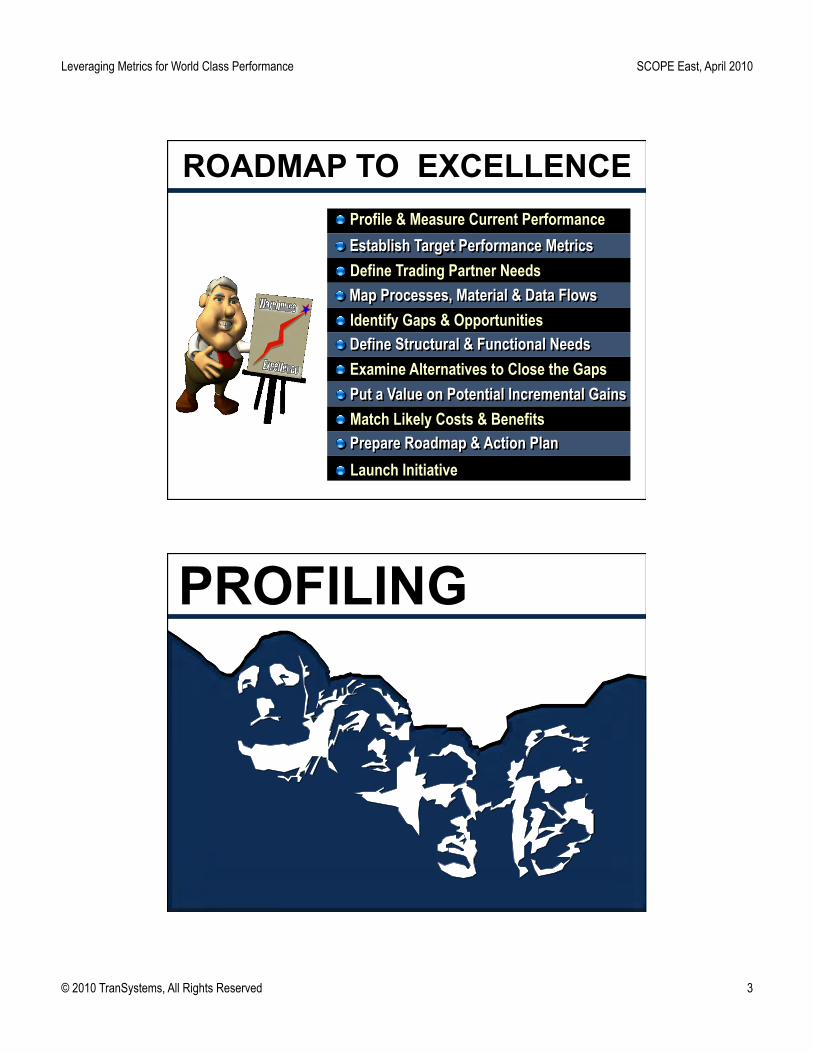
ROADMAP TO EXCELLENCE
! Establish Target Performance Metrics ! Profile & Measure Current Performance
! Map Processes, Material & Data Flows ! Define Trading Partner Needs
! Identify Gaps & Opportunities
! Launch Initiative ! Prepare Roadmap & Action Plan ! Match Likely Costs & Benefits ! Put a Value on Potential Incremental Gains
! Define Structural & Functional Needs ! Examine Alternatives to Close the Gaps
PROFILING
Leveraging Metrics for World Class Performance SCOPE East, April 2010
© 2010 TranSystems, All Rights Reserved 4
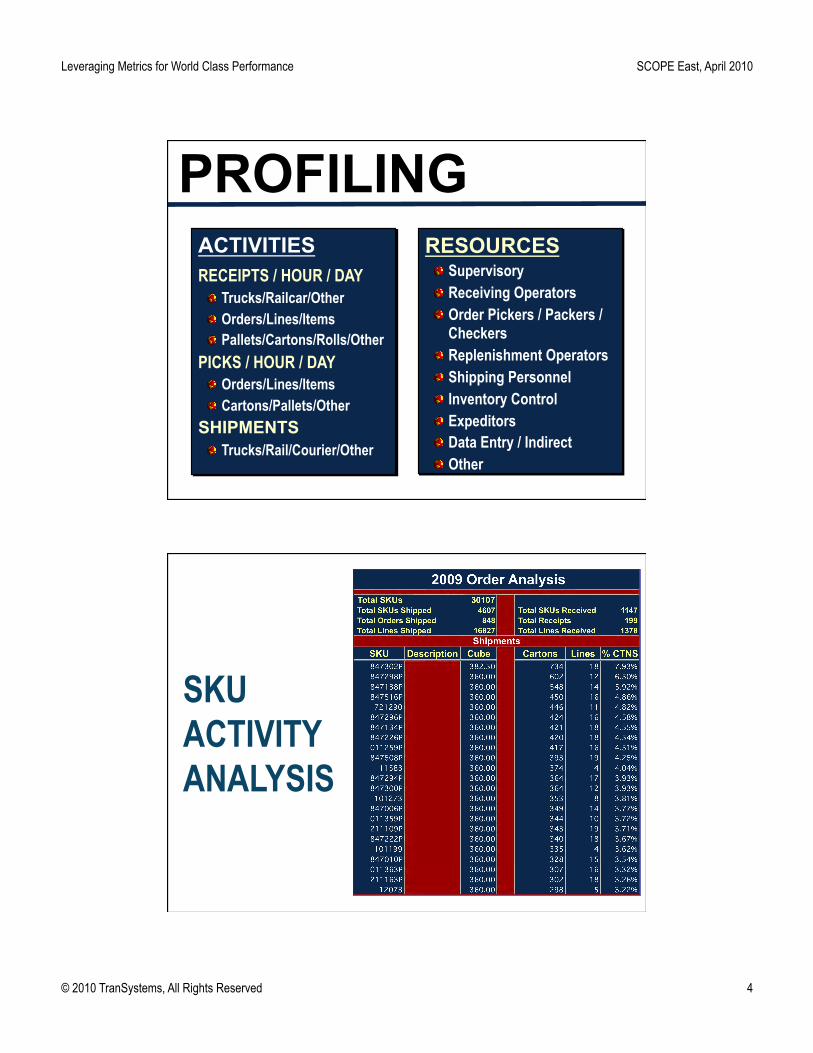
ACTIVITIES
RECEIPTS / HOUR / DAY ! Trucks/Railcar/Other ! Orders/Lines/Items ! Pallets/Cartons/Rolls/Other
PICKS / HOUR / DAY ! Orders/Lines/Items ! Cartons/Pallets/Other
SHIPMENTS ! Trucks/Rail/Courier/Other
RESOURCES ! Supervisory ! Receiving Operators ! Order Pickers / Packers /
Checkers ! Replenishment Operators ! Shipping Personnel ! Inventory Control ! Expeditors ! Data Entry / Indirect ! Other
PROFILING
SKU ACTIVITY ANALYSIS

Leveraging Metrics for World Class Performance SCOPE East, April 2010
© 2010 TranSystems, All Rights Reserved 5
ABC Analysis Summary, based on Total Pieces May 2009 - April 2010
% of SKU's
% Pieces
% Pieces Shipped
# of SKU's
Total Pieces
A+ 0.9% 10.1% 10.1% A+ 36 58,665 A 20.7% 68.8% 68.8% A 822 397,758 B 21.8% 13.9% 13.9% B 867 80,594 C 21.9% 5.5% 5.5% C 869 31,973 D 34.7% 1.6% 1.6% D 1,381 9,021
Total 100.0% 100.0% 100.0% Total 3,975 578,011
B 14%
C 6%
D 2%
A+ 10%
A 68% C
22%
D 34%
A+ 1%
A 21%
B 22%
Pieces (%) SKU's (%)
Cat. Cat.
Velocity Curve - Total Pieces
0% 10% 20% 30% 40% 50% 60% 70% 80% 90%
100%
0% 5% 11% 16% 21% 27% 32% 37% 43% 48% 53% 59% 64% 69% 75% 80% 85% 91% 96% % of SKU's
% o
f Pie
ces
– Cum % Pieces 90% of Picking / 37% of SKUs
80% of Picking Activity / 22% of SKUs
Leveraging Metrics for World Class Performance SCOPE East, April 2010
© 2010 TranSystems, All Rights Reserved 6
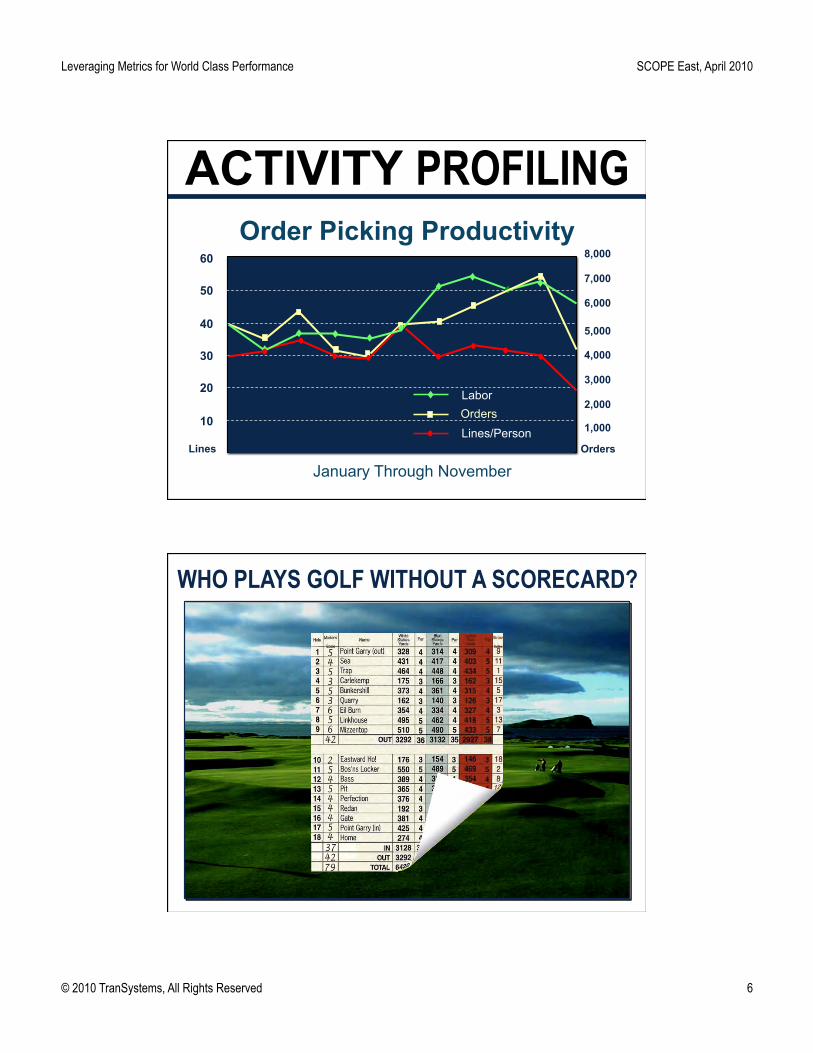
10
20
30
40
50
60
1,000
2,000
3,000
4,000
5,000
6,000
7,000
8,000
Labor Orders
Lines/Person Lines
Order Picking Productivity
January Through November
ACTIVITY PROFILING
WHO PLAYS GOLF WITHOUT A SCORECARD?
Leveraging Metrics for World Class Performance SCOPE East, April 2010
© 2010 TranSystems, All Rights Reserved 7
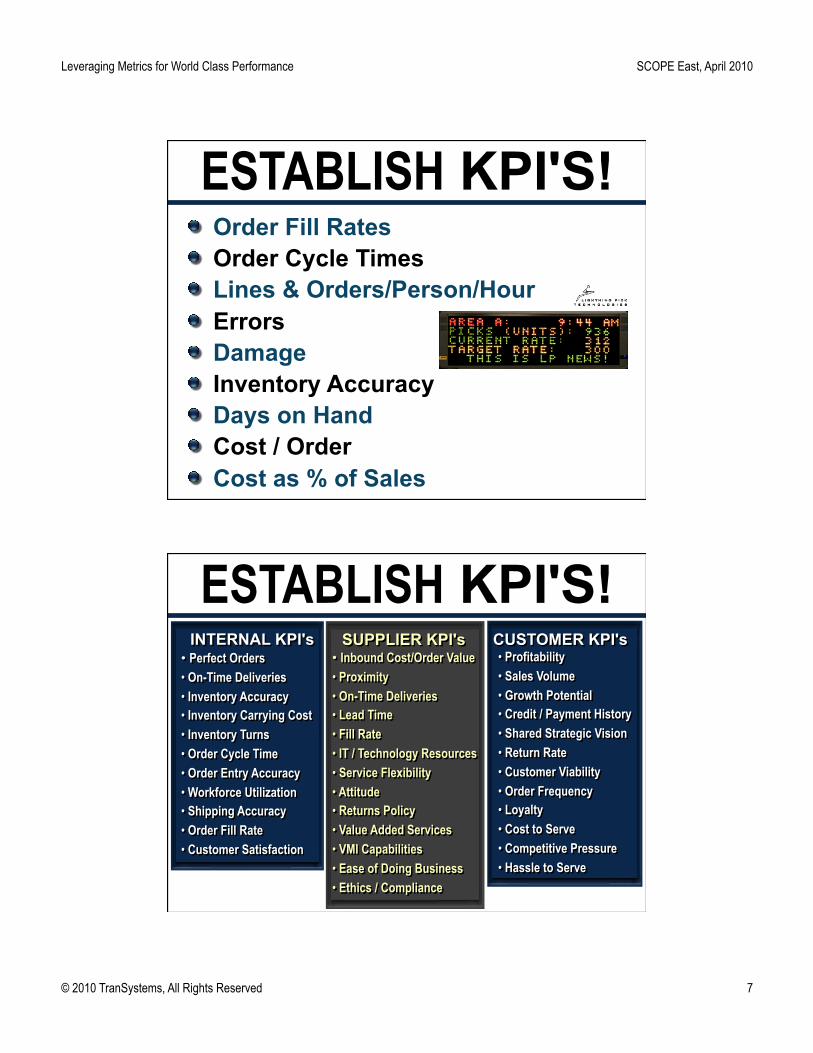
ESTABLISH KPI'S! ! Order Fill Rates ! Order Cycle Times ! Lines & Orders/Person/Hour ! Errors ! Damage ! Inventory Accuracy ! Days on Hand ! Cost / Order ! Cost as % of Sales
ESTABLISH KPI'S! • Perfect Orders • On-Time Deliveries • Inventory Accuracy • Inventory Carrying Cost • Inventory Turns • Order Cycle Time • Order Entry Accuracy • Workforce Utilization • Shipping Accuracy • Order Fill Rate • Customer Satisfaction
INTERNAL KPI's • Profitability • Sales Volume • Growth Potential • Credit / Payment History • Shared Strategic Vision • Return Rate • Customer Viability • Order Frequency • Loyalty • Cost to Serve • Competitive Pressure • Hassle to Serve
CUSTOMER KPI's • Inbound Cost/Order Value • Proximity • On-Time Deliveries • Lead Time • Fill Rate • IT / Technology Resources • Service Flexibility • Attitude • Returns Policy • Value Added Services • VMI Capabilities • Ease of Doing Business • Ethics / Compliance
SUPPLIER KPI's
Leveraging Metrics for World Class Performance SCOPE East, April 2010
© 2010 TranSystems, All Rights Reserved 8
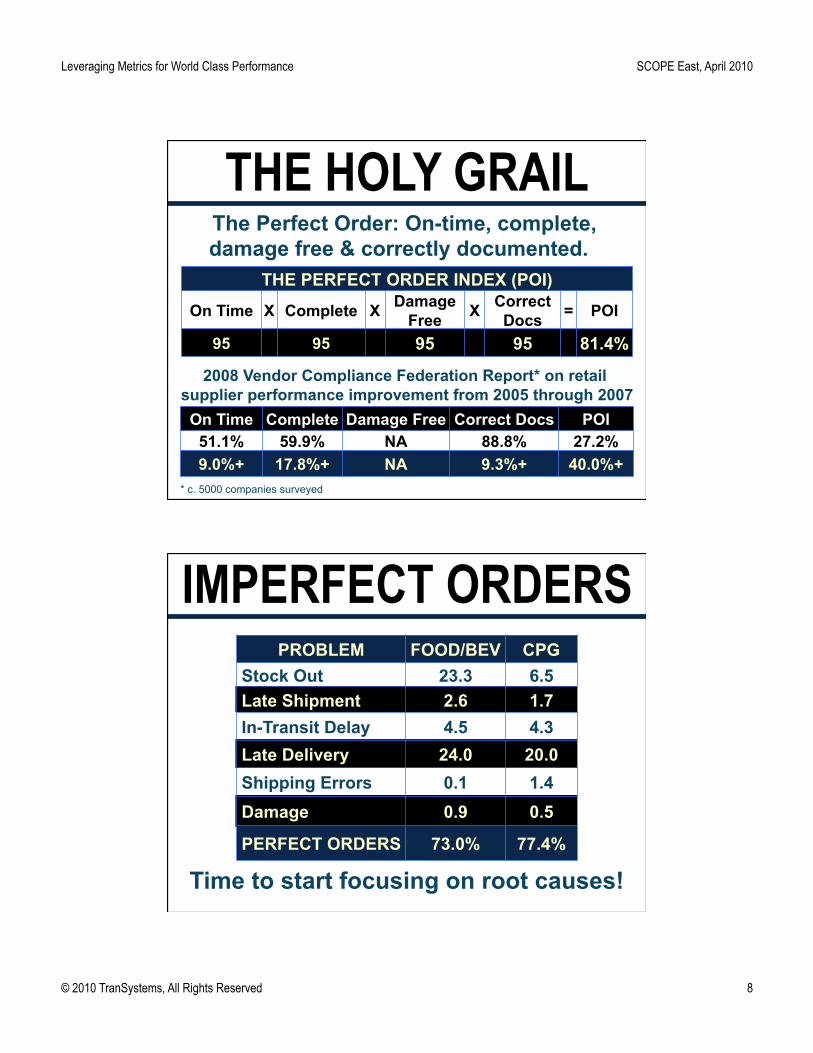
THE HOLY GRAIL
THE PERFECT ORDER INDEX (POI)
On Time X Complete X Damage Free X Correct
Docs = POI
95 95 95 95 81.4%
The Perfect Order: On-time, complete, damage free & correctly documented.
On Time Complete Damage Free Correct Docs POI 51.1% 59.9% NA 88.8% 27.2% 9.0%+ 17.8%+ NA 9.3%+ 40.0%+
2008 Vendor Compliance Federation Report* on retail supplier performance improvement from 2005 through 2007
* c. 5000 companies surveyed
IMPERFECT ORDERS PROBLEM FOOD/BEV CPG
Stock Out 23.3 6.5 Late Shipment 2.6 1.7 In-Transit Delay 4.5 4.3 Late Delivery 24.0 20.0 Shipping Errors 0.1 1.4 Damage 0.9 0.5
PERFECT ORDERS 73.0% 77.4%
Time to start focusing on root causes!
Leveraging Metrics for World Class Performance SCOPE East, April 2010
© 2010 TranSystems, All Rights Reserved 9
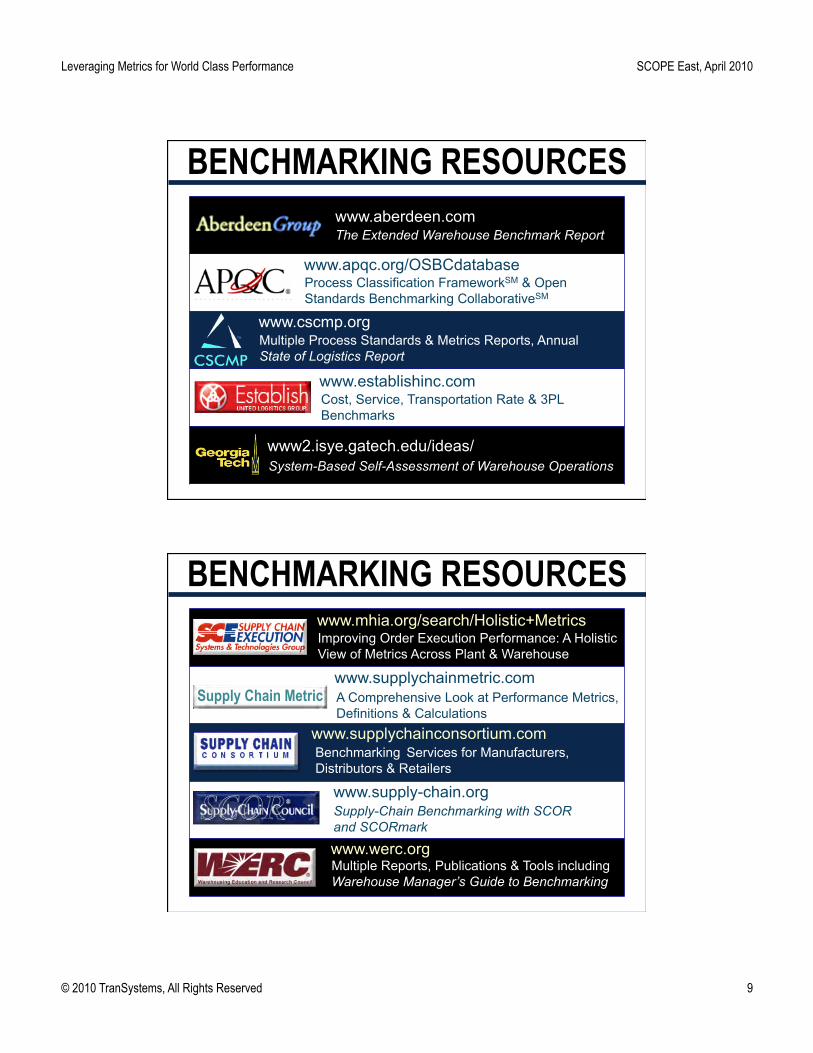
The Extended Warehouse Benchmark Report www.aberdeen.com
www.apqc.org/OSBCdatabase Process Classification FrameworkSM & Open Standards Benchmarking CollaborativeSM
www2.isye.gatech.edu/ideas/ System-Based Self-Assessment of Warehouse Operations
BENCHMARKING RESOURCES
Multiple Process Standards & Metrics Reports, Annual State of Logistics Report
www.cscmp.org
www.establishinc.com Cost, Service, Transportation Rate & 3PL Benchmarks
www.supplychainmetric.com
www.supplychainconsortium.com Benchmarking Services for Manufacturers, Distributors & Retailers
Supply-Chain Benchmarking with SCOR and SCORmark
www.supply-chain.org
www.werc.org Multiple Reports, Publications & Tools including Warehouse Manager’s Guide to Benchmarking
Improving Order Execution Performance: A Holistic View of Metrics Across Plant & Warehouse
www.mhia.org/search/Holistic+Metrics
A Comprehensive Look at Performance Metrics, Definitions & Calculations
Supply Chain Metric
BENCHMARKING RESOURCES
Leveraging Metrics for World Class Performance SCOPE East, April 2010
© 2010 TranSystems, All Rights Reserved 10
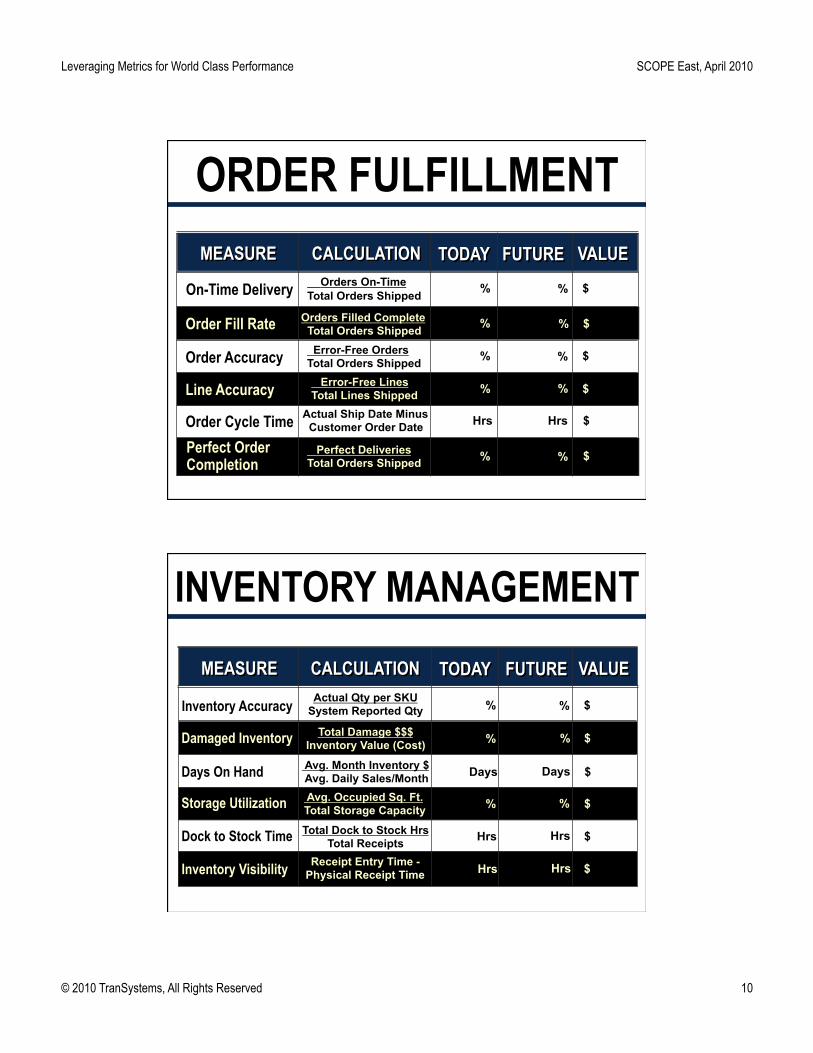
ORDER FULFILLMENT
On-Time Delivery Orders On-Time Total Orders Shipped % % $
Orders Filled Complete Total Orders Shipped Order Fill Rate % % $
Error-Free Orders Total Orders Shipped Order Accuracy % % $
Error-Free Lines Total Lines Shipped Line Accuracy % % $
Actual Ship Date Minus Customer Order Date Order Cycle Time Hrs Hrs $
Perfect Deliveries Total Orders Shipped
Perfect Order Completion % % $
MEASURE CALCULATION TODAY FUTURE VALUE
Inventory Accuracy Actual Qty per SKU System Reported Qty % % $
Total Damage $$$ Inventory Value (Cost) Damaged Inventory % % $
Avg. Occupied Sq. Ft. Total Storage Capacity Storage Utilization % % $
Total Dock to Stock Hrs Total Receipts Dock to Stock Time Hrs Hrs $
Receipt Entry Time - Physical Receipt Time Inventory Visibility Hrs Hrs $
Avg. Month Inventory $ Avg. Daily Sales/Month Days On Hand Days Days $
MEASURE CALCULATION TODAY FUTURE VALUE
INVENTORY MANAGEMENT
Leveraging Metrics for World Class Performance SCOPE East, April 2010
© 2010 TranSystems, All Rights Reserved 11
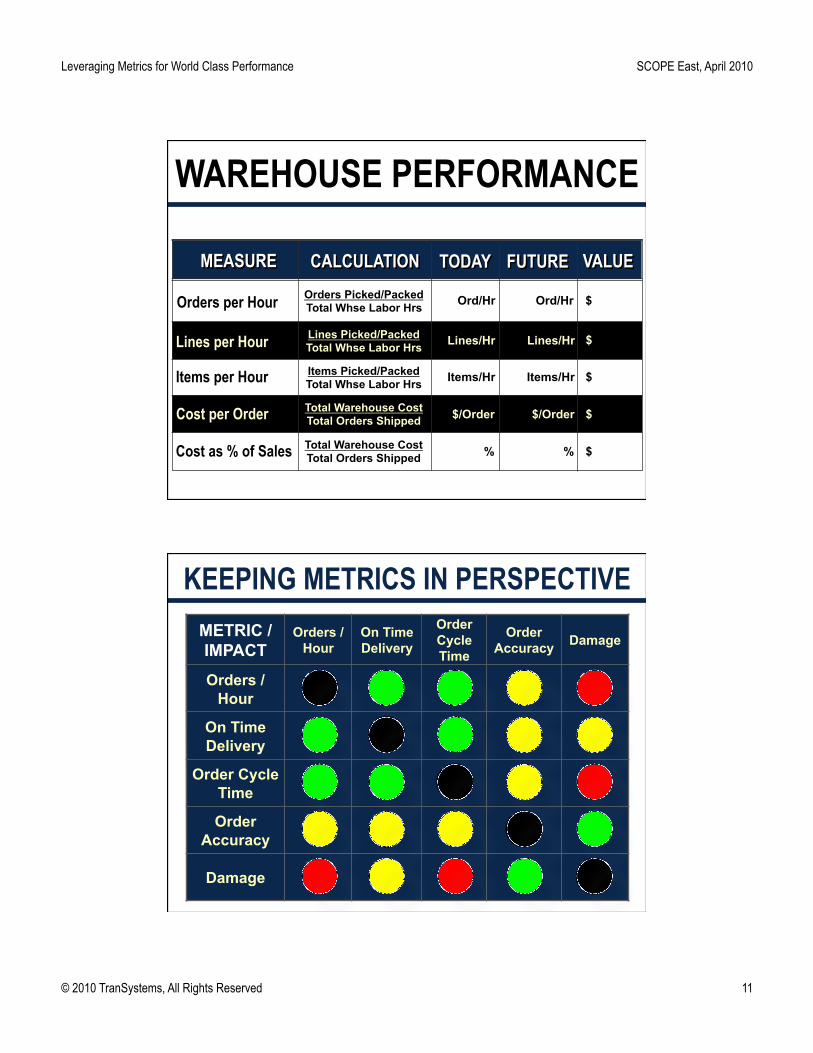
Orders per Hour Orders Picked/Packed Total Whse Labor Hrs
Total Warehouse Cost Total Orders Shipped
Lines per Hour
Items per Hour
Cost per Order
Cost as % of Sales
Ord/Hr
$/Order
% %
$
$
$
$
$
Ord/Hr
Lines/Hr
Items/Hr Items/Hr
Lines/Hr Lines Picked/Packed Total Whse Labor Hrs
Items Picked/Packed Total Whse Labor Hrs
Total Warehouse Cost Total Orders Shipped
$/Order
MEASURE CALCULATION TODAY FUTURE VALUE
WAREHOUSE PERFORMANCE
METRIC / IMPACT
Orders /Hour
On Time Delivery
Order Cycle Time
Order Accuracy Damage
Orders / Hour
On Time Delivery
Order Cycle Time
Order Accuracy
Damage
KEEPING METRICS IN PERSPECTIVE
Leveraging Metrics for World Class Performance SCOPE East, April 2010
© 2010 TranSystems, All Rights Reserved 12
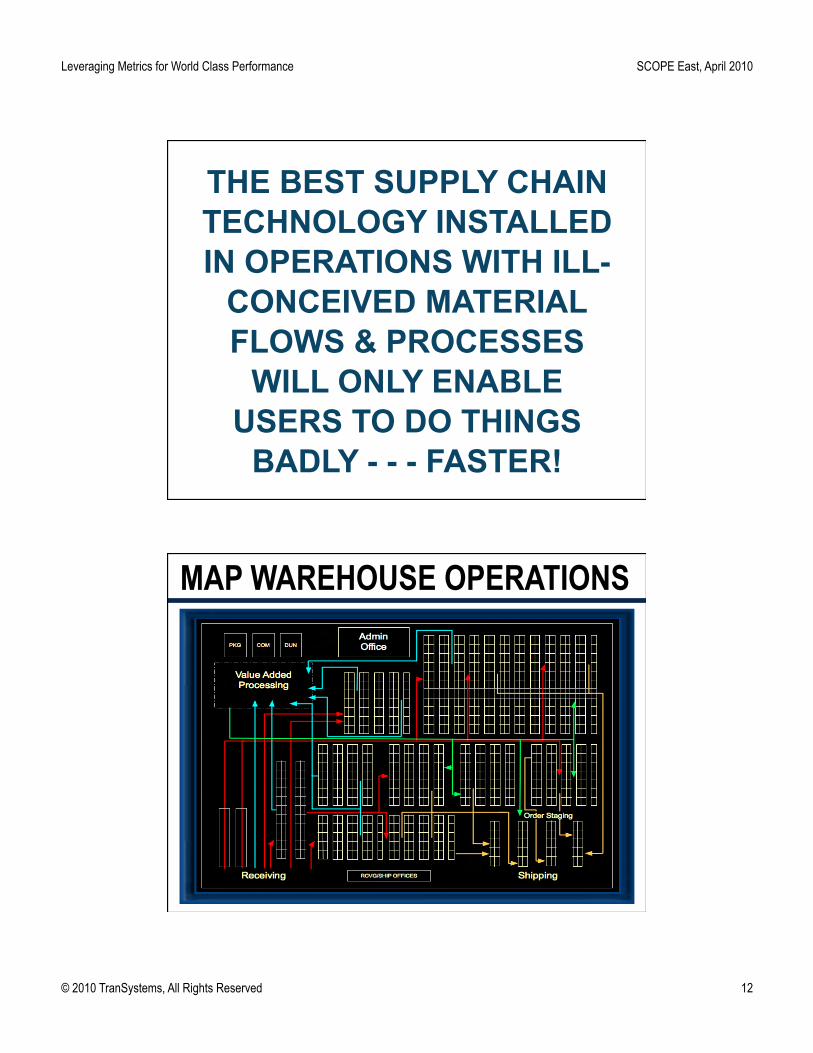
THE BEST SUPPLY CHAIN TECHNOLOGY INSTALLED IN OPERATIONS WITH ILL-
CONCEIVED MATERIAL FLOWS & PROCESSES
WILL ONLY ENABLE USERS TO DO THINGS
BADLY - - - FASTER!
MAP WAREHOUSE OPERATIONS
Leveraging Metrics for World Class Performance SCOPE East, April 2010
© 2010 TranSystems, All Rights Reserved 13
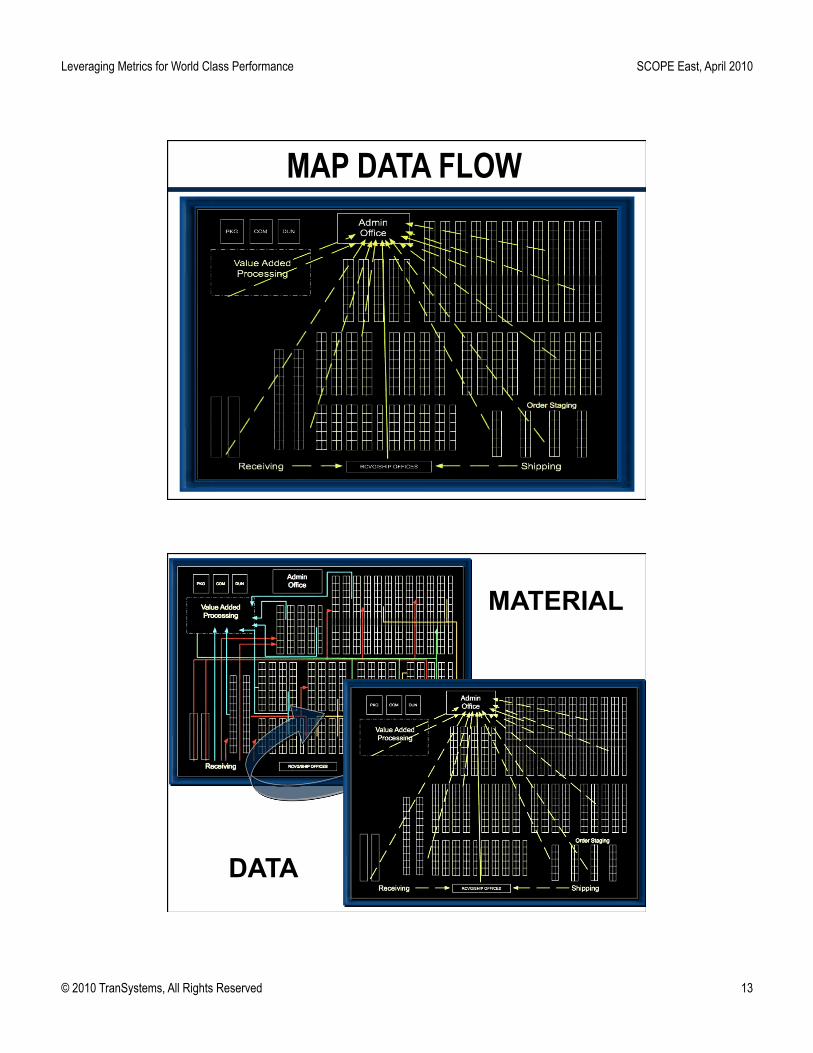
MAP DATA FLOW
MATERIAL
DATA
Leveraging Metrics for World Class Performance SCOPE East, April 2010
© 2010 TranSystems, All Rights Reserved 14
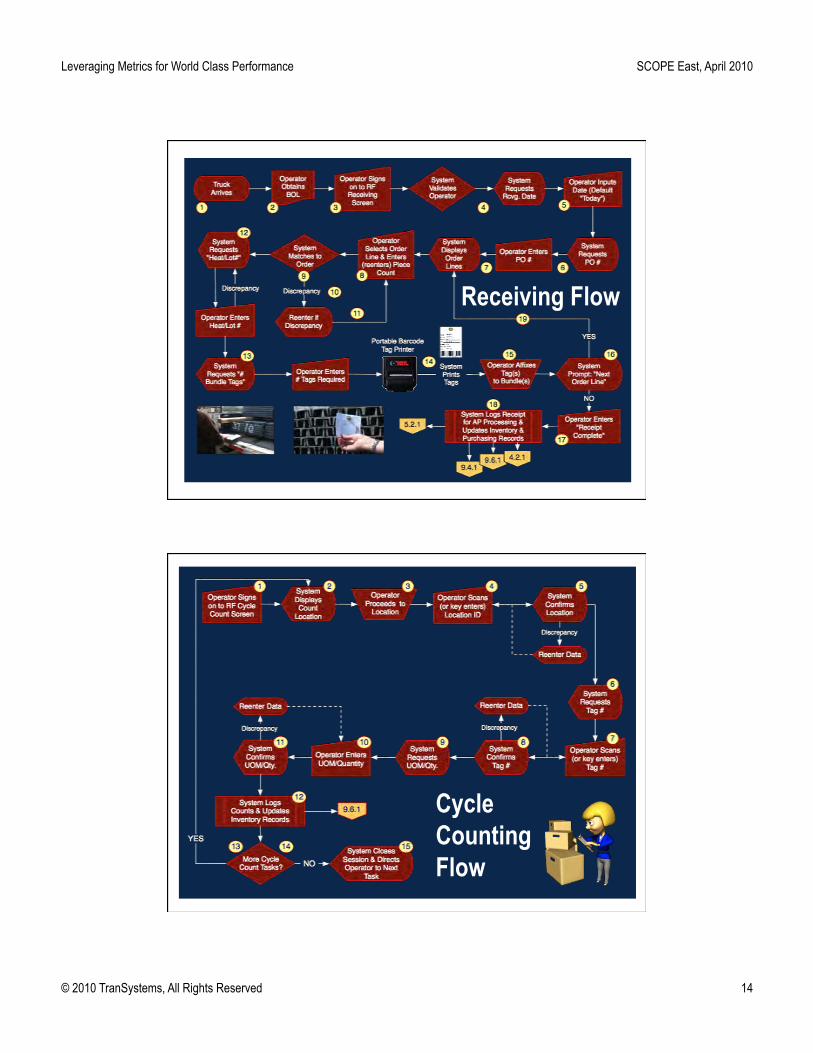
Receiving Flow
Cycle Counting Flow
Leveraging Metrics for World Class Performance SCOPE East, April 2010
© 2010 TranSystems, All Rights Reserved 15
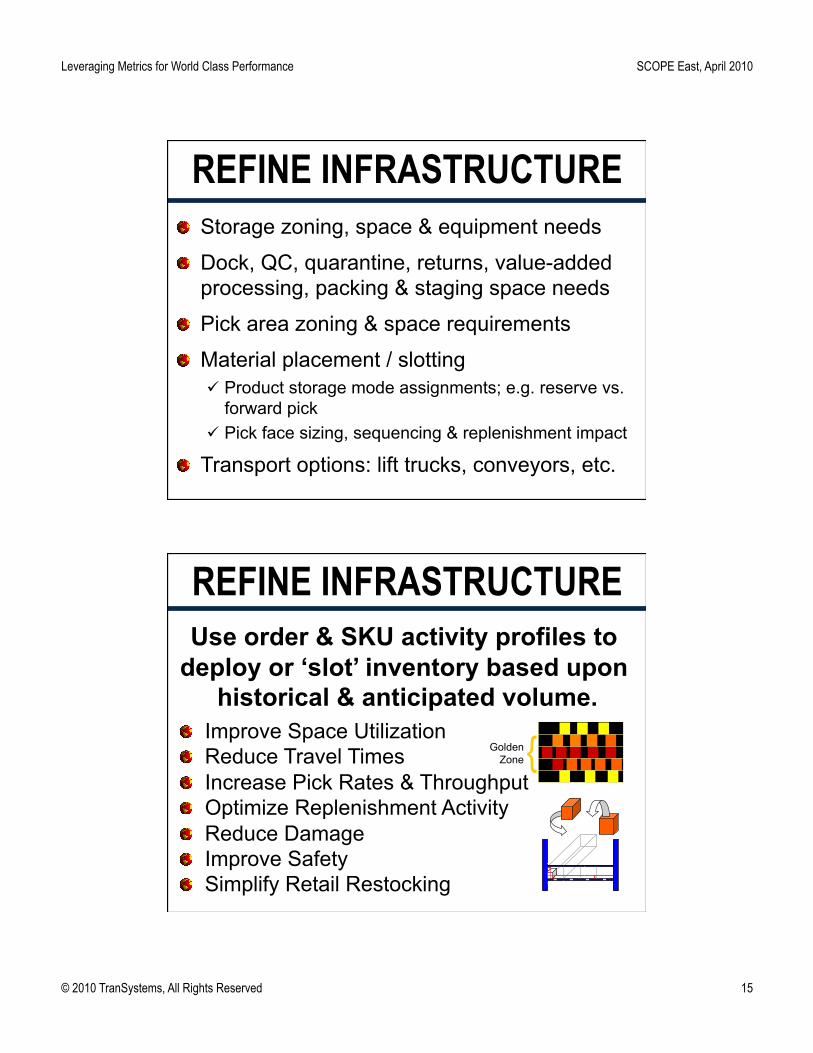
REFINE INFRASTRUCTURE ! Storage zoning, space & equipment needs
! Dock, QC, quarantine, returns, value-added processing, packing & staging space needs
! Pick area zoning & space requirements
! Material placement / slotting Product storage mode assignments; e.g. reserve vs.
forward pick Pick face sizing, sequencing & replenishment impact
! Transport options: lift trucks, conveyors, etc.
! Improve Space Utilization ! Reduce Travel Times ! Increase Pick Rates & Throughput ! Optimize Replenishment Activity ! Reduce Damage ! Improve Safety ! Simplify Retail Restocking
Use order & SKU activity profiles to deploy or ‘slot’ inventory based upon
historical & anticipated volume.
01 04 02 03 01 04 02 03
{Golden Zone
REFINE INFRASTRUCTURE
Leveraging Metrics for World Class Performance SCOPE East, April 2010
© 2010 TranSystems, All Rights Reserved 16
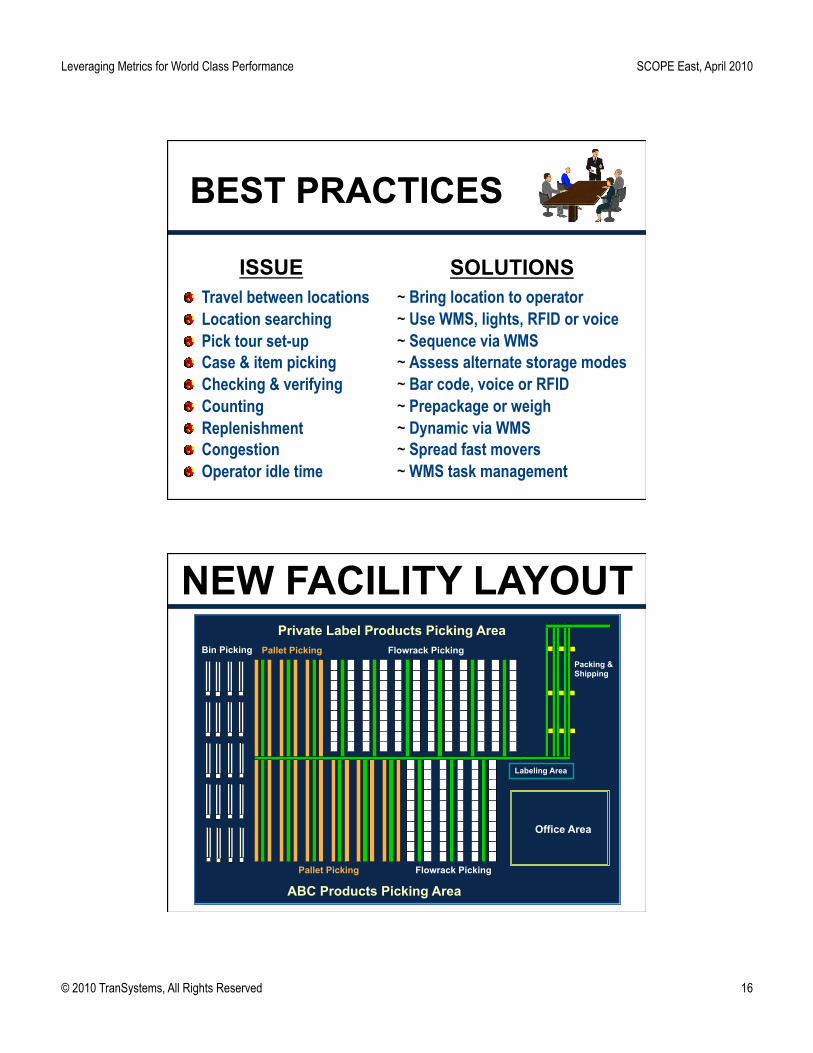
SOLUTIONS ~ Bring location to operator ~ Use WMS, lights, RFID or voice ~ Sequence via WMS ~ Assess alternate storage modes ~ Bar code, voice or RFID ~ Prepackage or weigh ~ Dynamic via WMS ~ Spread fast movers ~ WMS task management
ISSUE ! Travel between locations ! Location searching ! Pick tour set-up ! Case & item picking ! Checking & verifying ! Counting ! Replenishment ! Congestion ! Operator idle time
BEST PRACTICES
NEW FACILITY LAYOUT Bin Picking Pallet Picking Flowrack Picking
Pallet Picking Flowrack Picking
Private Label Products Picking Area
ABC Products Picking Area
Packing & Shipping
Labeling Area
Office Area
Leveraging Metrics for World Class Performance SCOPE East, April 2010
© 2010 TranSystems, All Rights Reserved 17
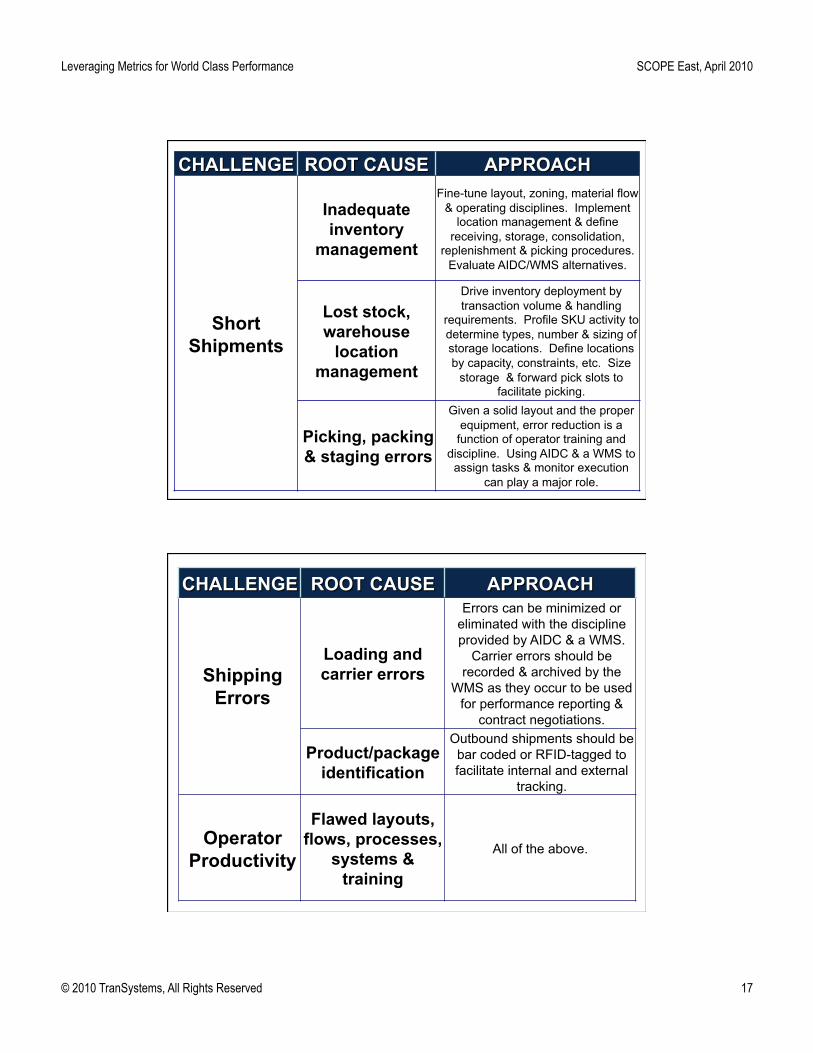
Short Shipments
Inadequate inventory
management
Fine-tune layout, zoning, material flow & operating disciplines. Implement
location management & define receiving, storage, consolidation,
replenishment & picking procedures. Evaluate AIDC/WMS alternatives.
Lost stock, warehouse
location management
Drive inventory deployment by transaction volume & handling
requirements. Profile SKU activity to determine types, number & sizing of storage locations. Define locations by capacity, constraints, etc. Size
storage & forward pick slots to facilitate picking.
Picking, packing & staging errors
Given a solid layout and the proper equipment, error reduction is a
function of operator training and discipline. Using AIDC & a WMS to assign tasks & monitor execution
can play a major role.
Shipping Errors
Loading and carrier errors
Errors can be minimized or eliminated with the discipline provided by AIDC & a WMS.
Carrier errors should be recorded & archived by the
WMS as they occur to be used for performance reporting &
contract negotiations.
Product/package identification
Outbound shipments should be bar coded or RFID-tagged to facilitate internal and external
tracking.
Operator Productivity
Flawed layouts, flows, processes,
systems & training
All of the above.
Leveraging Metrics for World Class Performance SCOPE East, April 2010
© 2010 TranSystems, All Rights Reserved 18
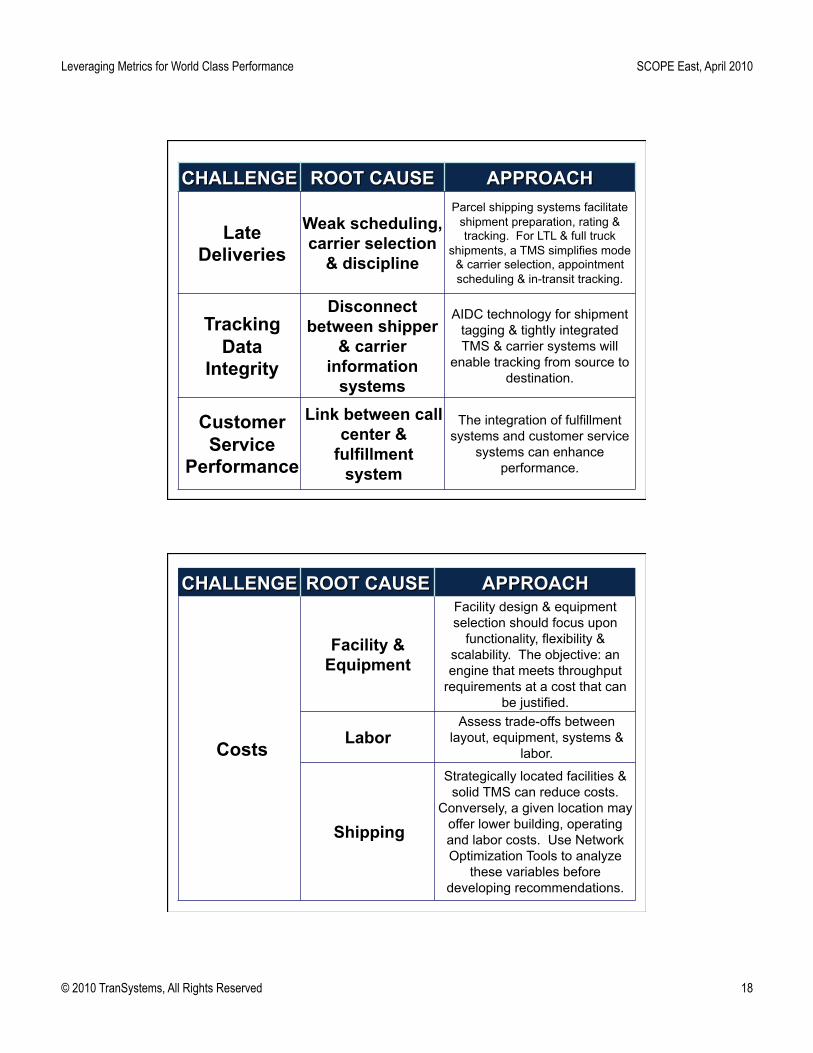
Late Deliveries
Weak scheduling, carrier selection
& discipline
Parcel shipping systems facilitate shipment preparation, rating & tracking. For LTL & full truck
shipments, a TMS simplifies mode & carrier selection, appointment scheduling & in-transit tracking.
Tracking Data
Integrity
Disconnect between shipper
& carrier information
systems
AIDC technology for shipment tagging & tightly integrated TMS & carrier systems will
enable tracking from source to destination.
Customer Service
Performance
Link between call center &
fulfillment system
The integration of fulfillment systems and customer service
systems can enhance performance.
Costs
Facility & Equipment
Facility design & equipment selection should focus upon
functionality, flexibility & scalability. The objective: an engine that meets throughput
requirements at a cost that can be justified.
Labor Assess trade-offs between
layout, equipment, systems & labor.
Shipping
Strategically located facilities & solid TMS can reduce costs.
Conversely, a given location may offer lower building, operating and labor costs. Use Network Optimization Tools to analyze
these variables before developing recommendations.
Leveraging Metrics for World Class Performance SCOPE East, April 2010
© 2010 TranSystems, All Rights Reserved 19
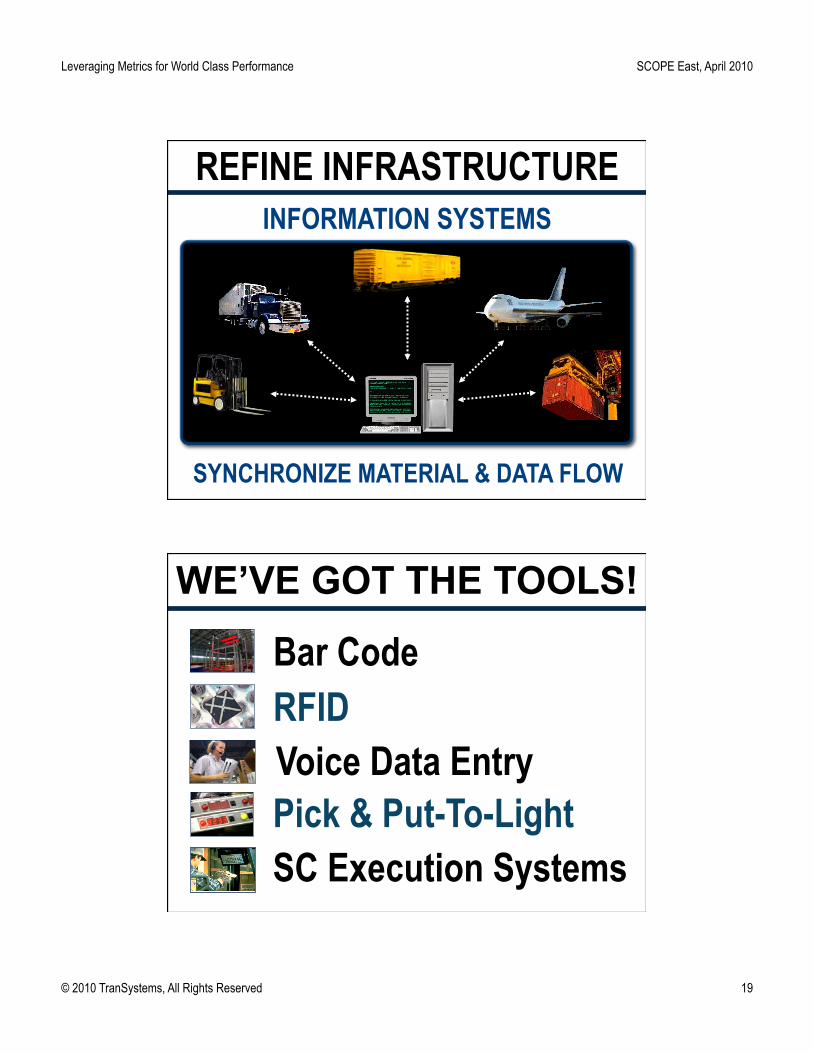
INFORMATION SYSTEMS REFINE INFRASTRUCTURE
SYNCHRONIZE MATERIAL & DATA FLOW
WE’VE GOT THE TOOLS!
Bar Code
SC Execution Systems Pick & Put-To-Light
RFID Voice Data Entry
Leveraging Metrics for World Class Performance SCOPE East, April 2010
© 2010 TranSystems, All Rights Reserved 20
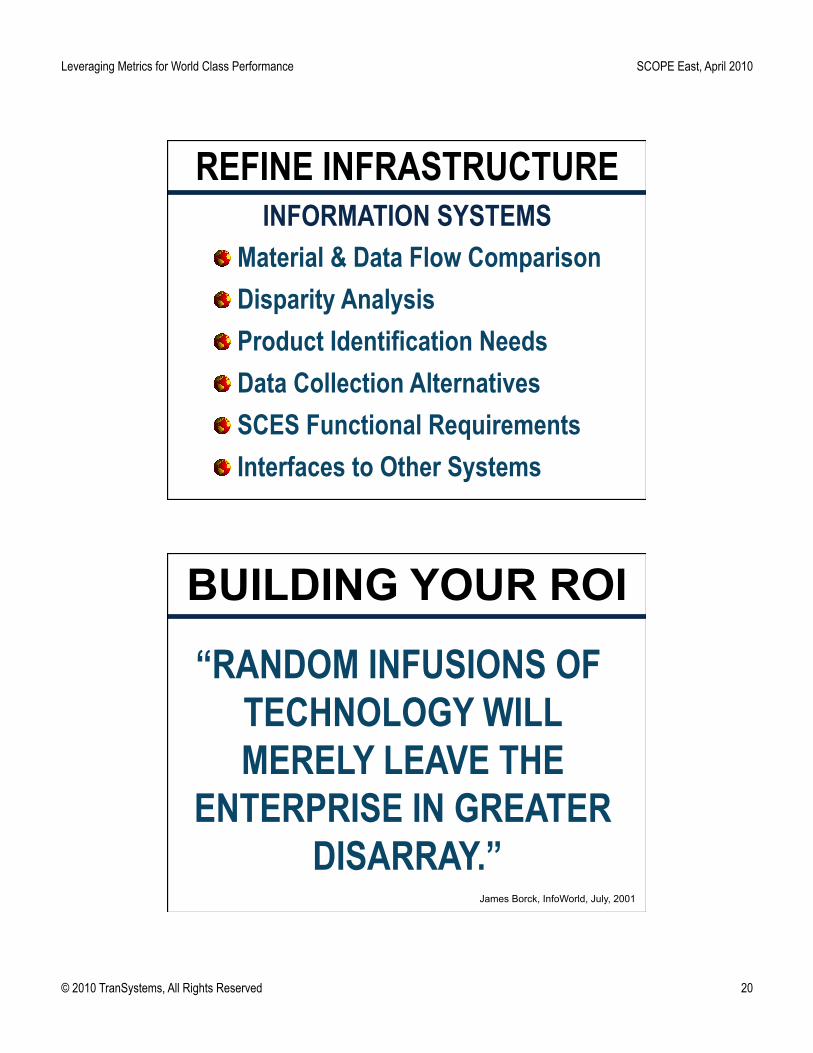
INFORMATION SYSTEMS REFINE INFRASTRUCTURE
! Material & Data Flow Comparison ! Disparity Analysis ! Product Identification Needs ! Data Collection Alternatives ! SCES Functional Requirements ! Interfaces to Other Systems
BUILDING YOUR ROI
“RANDOM INFUSIONS OF TECHNOLOGY WILL MERELY LEAVE THE
ENTERPRISE IN GREATER DISARRAY.”
James Borck, InfoWorld, July, 2001
Leveraging Metrics for World Class Performance SCOPE East, April 2010
© 2010 TranSystems, All Rights Reserved 21
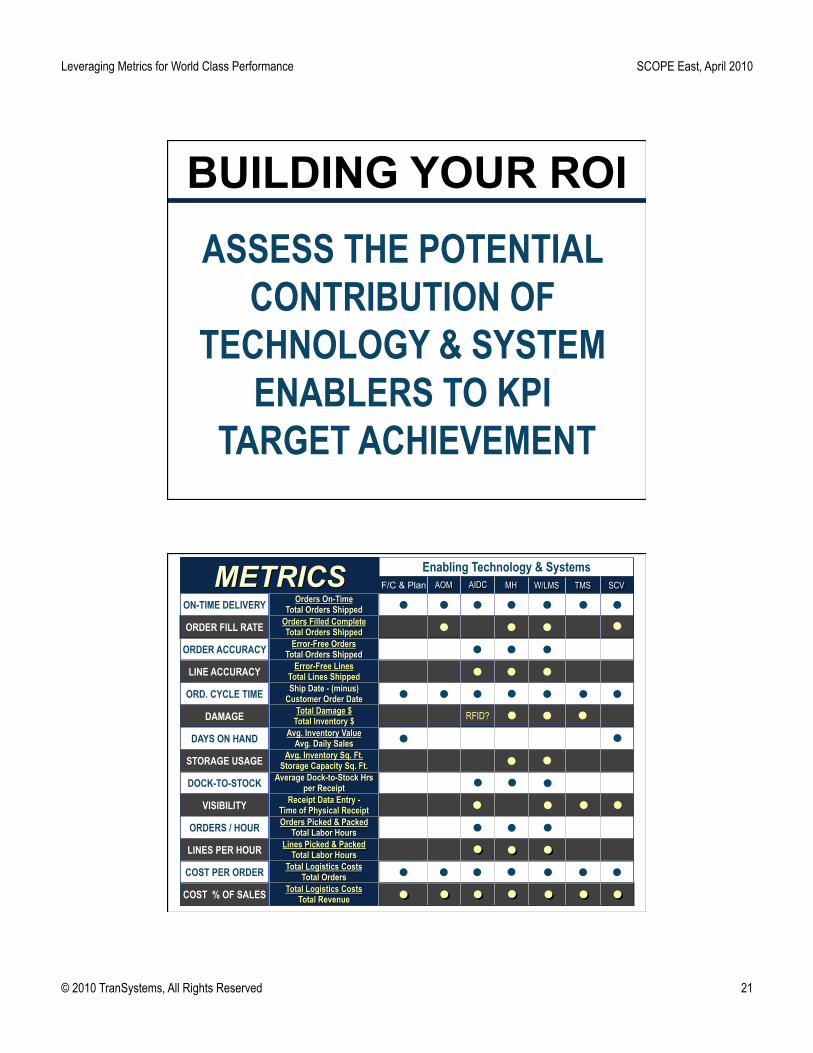
BUILDING YOUR ROI ASSESS THE POTENTIAL
CONTRIBUTION OF TECHNOLOGY & SYSTEM
ENABLERS TO KPI TARGET ACHIEVEMENT
Enabling Technology & Systems
RFID?
AOM AIDC MH W/LMS TMS
COST % OF SALES
COST PER ORDER
LINES PER HOUR
ORDERS / HOUR
VISIBILITY
DOCK-TO-STOCK
STORAGE USAGE
DAYS ON HAND
DAMAGE
ORD. CYCLE TIME
LINE ACCURACY
ORDER ACCURACY
ORDER FILL RATE
ON-TIME DELIVERY
SCV F/C & Plan
Leveraging Metrics for World Class Performance SCOPE East, April 2010
© 2010 TranSystems, All Rights Reserved 22
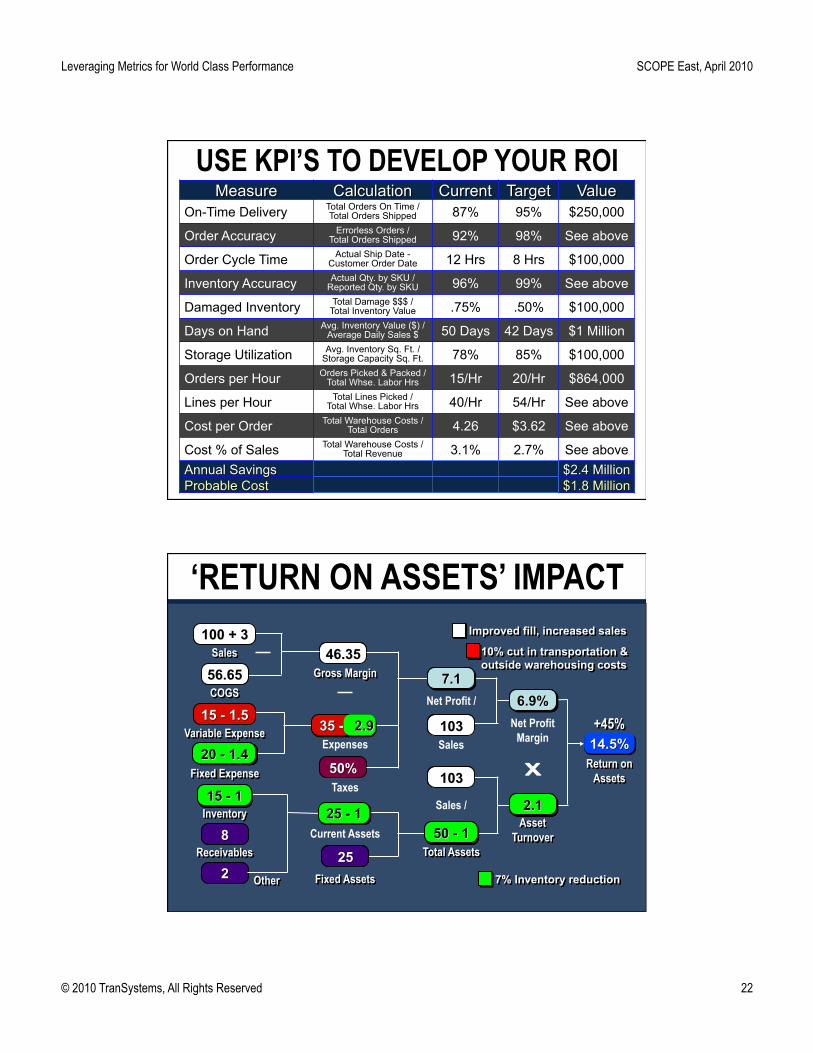
On-Time Delivery Total Orders On Time / Total Orders Shipped 87% 95% $250,000
Order Accuracy Errorless Orders / Total Orders Shipped 92% 98% See above
Order Cycle Time Actual Ship Date - Customer Order Date 12 Hrs 8 Hrs $100,000
Inventory Accuracy Actual Qty. by SKU / Reported Qty. by SKU 96% 99% See above
Damaged Inventory Total Damage $$$ / Total Inventory Value .75% .50% $100,000
Days on Hand Avg. Inventory Value ($) / Average Daily Sales $ 50 Days 42 Days $1 Million
Storage Utilization Avg. Inventory Sq. Ft. / Storage Capacity Sq. Ft. 78% 85% $100,000
Orders per Hour Orders Picked & Packed / Total Whse. Labor Hrs 15/Hr 20/Hr $864,000
Lines per Hour Total Lines Picked / Total Whse. Labor Hrs 40/Hr 54/Hr See above
Cost per Order Total Warehouse Costs / Total Orders 4.26 $3.62 See above
Cost % of Sales Total Warehouse Costs / Total Revenue 3.1% 2.7% See above
USE KPI’S TO DEVELOP YOUR ROI
Return on Assets
+45%
Sales
COGS
Variable Expense
Fixed Expense
Inventory
Receivables
Other
Gross Margin
Expenses
Taxes
Current Assets
Fixed Assets
Net Profit /
Sales
Sales /
Total Assets
Asset Turnover
Net Profit Margin
X!
Improved fill, increased sales
10% cut in transportation & outside warehousing costs
7% Inventory reduction
‘RETURN ON ASSETS’ IMPACT
Leveraging Metrics for World Class Performance SCOPE East, April 2010
© 2010 TranSystems, All Rights Reserved 23
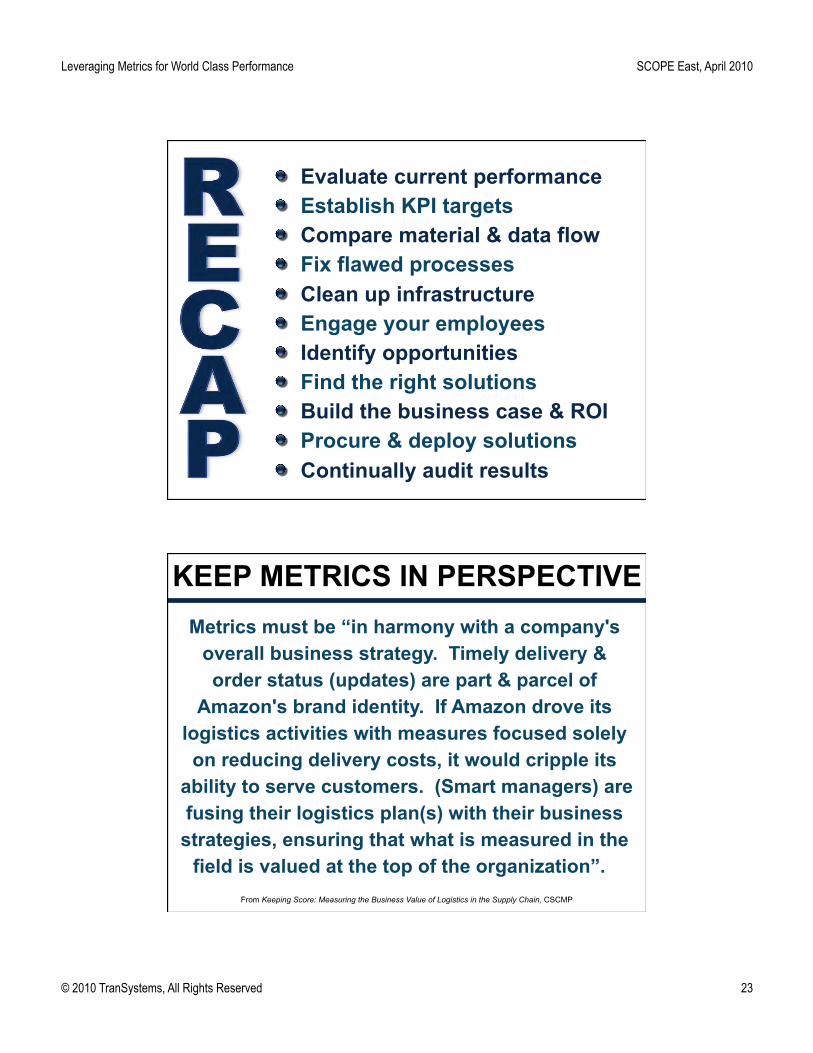
! Evaluate current performance ! Establish KPI targets ! Compare material & data flow ! Fix flawed processes ! Clean up infrastructure ! Engage your employees ! Identify opportunities ! Find the right solutions ! Build the business case & ROI ! Procure & deploy solutions ! Continually audit results
Metrics must be “in harmony with a company's overall business strategy. Timely delivery & order status (updates) are part & parcel of
Amazon's brand identity. If Amazon drove its logistics activities with measures focused solely on reducing delivery costs, it would cripple its
ability to serve customers. (Smart managers) are fusing their logistics plan(s) with their business
strategies, ensuring that what is measured in the field is valued at the top of the organization”.
KEEP METRICS IN PERSPECTIVE
From Keeping Score: Measuring the Business Value of Logistics in the Supply Chain, CSCMP
Leveraging Metrics for World Class Performance SCOPE East, April 2010
© 2010 TranSystems, All Rights Reserved 24
Warehousing is like riding a bicycle –
keep moving forward or you’ll fall
down!
© 2010 TranSystems. All rights reserved.
For More Information: [email protected]
www.transystems.com