benefits realisation management and its influence on...
TRANSCRIPT

http://wrap.warwick.ac.uk
Original citation: Serra, Carlos Eduardo Martins and Kunc, Martin. (2014) Benefits realisation management and its influence on project success and on the execution of business strategies. International Journal of Project Management . ISSN 0263-7863 Permanent WRAP url: http://wrap.warwick.ac.uk/60436 Copyright and reuse: The Warwick Research Archive Portal (WRAP) makes this work of researchers of the University of Warwick available open access under the following conditions. This article is made available under the Creative Commons Attribution-NonCommercial-ShareAlike 3.0 (CC BY-NC-SA 3.0) license and may be reused according to the conditions of the license. For more details see: http://creativecommons.org/licenses/by-nc-sa/3.0/ A note on versions: The version presented in WRAP is the published version, or, version of record, and may be cited as it appears here. For more information, please contact the WRAP Team at: [email protected]
www.elsevier.com/locate/ijproman
Available online at www.sciencedirect.com
ScienceDirect
International Journal of Project Management xx (2014) xxx–xxx
JPMA-01638; No of Pages 14
Benefits Realisation Management and its influence on projectsuccess and on the execution of business strategies
Carlos Eduardo Martins Serra a,⁎, Martin Kunc b
a Independent Consultant, Flat 21 Walpole House, 126 Westminster Bridge Road, London SE1 7UN, UKb Warwick Business School, The University of Warwick, Office E1.07, WBS Social Studies Building, Warwick Business School, Coventry CV4 7AL, UK
Received 11 April 2013; received in revised form 28 January 2014; accepted 13 March 2014
Abstract
Business strategies, which imply organisational change, usually require the development of projects, e.g. IT projects. However, organisations fail inimplementing their strategies even though they employ project, programme and portfolio management techniques. Benefits Realisation Management(BRM) is a set of processes structured to close the gap between strategy planning and execution by ensuring the implementation of the most valuableinitiatives. However, there is no empirical evidence of its effectiveness. This paper presents the results of a survey to practitioners in Brazil, United Kingdomand United States evaluating the impact of BRM practices on project success rate. Our results show BRM practices being positive predictors to projectsuccess on the creation of strategic value for the business. Therefore, these results suggest that BRM practices can be effective to support the successfulexecution of business strategies.© 2014 The Authors. Published by Elsevier Ltd. This is an open access article under the CC BY-NC-SA license(http://creativecommons.org/licenses/by-nc-sa/3.0/).
Keywords: Project management; Benefits realisation; Strategy implementation; Strategy execution; Project success; Project governance
1. Introduction
Industry reports, e.g. The Economist (2009), German ProjectManagement Association (2010) and Price Waterhouse Coopers(2007), suggest that practitioners recognise projects as a structuredway to implement business changes, an opinion also shared byacademics e.g. Buttrick (1997), Kerzner (2009) and Turner (2009).Project success is a vital component of business success (PriceWaterhouse Coopers, 2007) and the global economy. Althoughprojects in an organisational portfolio can address differentobjectives (Gray and Larson, 2006; Jenner, 2010; Kendall andRollins, 2003; Levine, 2005), they are mainly undertaken tosupport the execution of business strategies (Buttrick, 1997).
⁎ Corresponding author. Tel.: +44 7428 225343 (mobile).E-mail addresses: [email protected] (C.E.M. Serra),
[email protected] (M. Kunc).
http://dx.doi.org/10.1016/j.ijproman.2014.03.0110263-7863/00/© 2014 The Authors. Published by Elsevier Ltd. This is an ope(http://creativecommons.org/licenses/by-nc-sa/3.0/).
Please cite this article as: C.E.M. Serra, M. Kunc, 2014. Benefits Realisationstrategies, Int. J. Proj. Manag. http://dx.doi.org/10.1016/j.ijproman.2014.03.01
n acc
Mana1
Therefore, organisations need to ensure the success of theirprojects in order to succeed in executing their strategy and inturning their vision into reality.
In order to be successful, project management teams needto define clearly how to evaluate whether each project issuccessful. However, there is no consensus on the definitionof project success (Prabhakar, 2008; Yu et al., 2005). A recentanalysis of articles published from 1986 to 2004 in theInternational Journal of Project Management and the ProjectManagement Journal has found 30 articles discussing projectsuccess, but with no consensual definition (Ika, 2009). Inparallel, surveys performed in the last twenty years havefound between 60% and 80% of all organisations failing inexecuting their strategies by not delivering the expectedoutcomes of their changing process (Kaplan and Norton,2008).
This paper, analyses success by two different approaches:Project management performance, also called efficiency,which evaluates success mostly based on budget, schedule
ess article under the CC BY-NC-SA license
gement and its influence on project success and on the execution of business
2 C.E.M. Serra, M. Kunc / International Journal of Project Management xx (2014) xxx–xxx
and requirements goals; and project success, which evaluates howwell projects deliver the benefits required by business strategies inorder to meet wider business objectives and to create value(Cooke-Davies, 2002; Serrador, 2013). Despite the clear roleprojects have in implementing business strategies, organisationsare still evaluating projects only by their efficiency and not by thebenefits delivered and a large group of organisations claims thatproject benefits are very hard to measure (Zwikael and Smyrk,2012), especially benefits realised during product operation, oftenlong after project end (Yu et al., 2005).
Recently, some scholars (Bradley, 2010; Jenner, 2010; Meltonet al., 2008) have suggested that Benefits RealisationManagement(BRM) makes the value and the strategic relevance of each projectclear, enabling an increased effectiveness of project governance.More than just governance, ‘strategic governance’ leads organi-sations to work towards the delivery of planned benefits(Gardiner, 2005). Organisations with mature processes of benefitrealisation – and therefore stronger governance – have theirmanagement boards prioritising and supporting mostly thoseprojects which can deliver the most relevant benefits. Byincreasing the effectiveness of project governance, BenefitsRealisation Management can arguably reduce project failure ratesfrom a strategic perspective. However, these practices are notwidely employed yet, or employed as a subset of other projectmanagement processes, and there is scant evidence about itsimpact on project success (Cooke-Davies, 2002). Thus, this paperintends to evaluate the use of Benefits Realisation Managementamong the project management communities of three countries:United Kingdom, United States and Brazil in order to understandits impact on project success rates and evaluate the impact ofprojects on the creation of organisational value (Bryde, 2005; Yuet al., 2005; Zwikael and Smyrk, 2012).
2. Theoretical background
After organisations set their visions and create their strategy, themanagement team creates individual projects or programmes,which are groups of projects managed together (Thiry, 2002), todeliver the business strategy. However, organisations do not haveinfinite resources to invest (Amason, 2011) so they choose thoseprojects that deliver the most valuable results for the implemen-tation of the business strategy (Amason, 2011; Gray and Larson,2006) in the most effective and efficient way (Gray and Larson,2006). Then, organizations use project portfolio managementmethods, such as financial and non-financial appraisal andevaluation models, to select and prioritise the best set of projects(Jenner, 2010).
Once the correct projects are selected, project success can beassessed in two steps usually called appraisal and evaluation. Theappraisal occurs before the beginning of each project in order tosupport the approval of the business case, while the evaluationoccurs at project closure in order to identify project success orfailure (Jenner, 2010; Zwikael and Smyrk, 2011). The appraisalmeasures the relevance of each project and defines expectations,which are inputs for the definition of success criteria. Sinceprojects are investments which usually aim to maximize return,an important part of this step is the financial appraisal (Jenner,
Please cite this article as: C.E.M. Serra, M. Kunc, 2014. Benefits Realisation Manstrategies, Int. J. Proj. Manag. http://dx.doi.org/10.1016/j.ijproman.2014.03.011
2010; Levine, 2005) or feasibility studies (Yu et al., 2005). Later,the evaluation analyses the actual achievements against thosesuccess criteria previously defined in order to identify whetherprojects were successful (Jenner, 2010; Zwikael and Smyrk,2011).
While there are several different models to measure projectsuccess, many authors, such as Baccarini (1999) and Pinto andMantel (1990), agree on two approaches to its assessment:project management performance and delivery of benefits tothe business, clients and stakeholders. In the past, projectsuccess was evaluated mostly based on criteria associated tothe “triple constraint”: cost, schedule and scope (Ika, 2009;Shenhar and Patanakul, 2012; Zwikael and Smyrk, 2011), whichare strongly related to the evaluation of project managementperformance, usually assessed using Key Performance Indica-tors – KPIs – designed to measure the adherence to budgets,schedules and technical specifications (Bryde, 2005). Howev-er, a complete evaluation of success requires a value relatedcomponent (Kerzner, 2011), replacing this evaluation methodfor another focused on the project contribution to the businessstrategy (Patanakul and Shenhar, 2012) including the creationof shareholder value (Ika, 2009; Levine, 2005).
Ika (2009) splits the benefit related component of theassessment into ‘Project/Product Success’ – satisfaction of enduser and benefits to stakeholders and project staff – and‘Strategic Project Management’ – business success, achieve-ment of client's strategic objectives. More recently, Camilleri(2011) divides benefit between ‘project success’ – outcomesand benefits – and ‘Project Corporate Success’ – the achievementof strategic objectives. Zwikael and Smyrk (2011) also separates itinto ‘Ownership Success’ – benefits less dis-benefits and costs –and ‘Investment Success’ — financial return to the organisation.Although these authors have suggested different ways toassess the delivery of benefits and the consequent creation ofstrategic value to the business, this paper suggests that thedelivery of benefits to stakeholders has to be related tobusiness strategies and to the achievement of wider businessobjectives, especially by the financial perspective, consider-ing ‘project success’ as a more comprehensive approach(Cooke-Davies, 2002).
Although there are several criteria available to evaluate projectsuccess, the judgment of success or failure can be taken based on amore situational or subjective basis (Ika, 2009; McLeod et al.,2012). Different perspectives using the same criteria can evaluatethe same project as a success and as a failure. On the other hand, aset of criteria can be suitable to some perspectives but unsuitablefor others. For example, project management success, ownershipsuccess and investment success are assessed by differentperspectives and criteria (Zwikael and Smyrk, 2011). Neverthe-less, project managers are responsible for the alignment ofexpectations among stakeholders in order to define project success(Kerzner, 2011). Interestingly, these same project managers areusually kept apart of the rationale for project selection andprioritisation, so they may not understand the relevance of theirprojects in order to deliver the expected benefit to the business(Melton et al., 2008). Thus, a question remains unanswered forthem: what value do businesses need?
agement and its influence on project success and on the execution of business

3C.E.M. Serra, M. Kunc / International Journal of Project Management xx (2014) xxx–xxx
2.1. What value do businesses need?
Good business strategies are those that deliver stakeholdervalue, which is the organisation's long-term cash generationcapability or the ability to provide value public services, in caseof public sector organisations (Johnson and Scholes, 2002).These business strategies set targets of future value, which aremet by achieving strategic objectives. Since these objectives aremeasurable, the difference between the current situation and thetarget future situation sets the value gap, which is fulfilled by aportfolio of initiatives defined by the organisation in theirstrategic plan (Kaplan and Norton, 2008). As Fig. 1 illustrates,strategic initiatives usually fill the value gap by enabling newcapabilities – or promoting changes – through the outputsdelivered by a set of projects.
Projects are organisational entities which employ resourcesorganised on a new and unique way, for a specific time-frame, toenable positive and clearly defined changes in the business (TurnerandMüller, 2003). These positive changes aim the achievement oforganisational objectives and these strategic improvements in thebusiness are called ‘benefits’. Benefits, which can be seen asimprovements, are increments in the business value from not onlya shareholders' perspective but also customers’, suppliers’, or evensocietal perspectives (Zwikael and Smyrk, 2011). Benefits areusually achieved using programme and project managementtechniques. Therefore, the creation of value for business, by thesuccessful execution of business strategy, strongly depends onprogrammes and projects delivering the expected benefits.
Based on the benefit mapping techniques suggested by Thorp(2007), Ward and Daniel (2006), and Bradley (2010) andpractitioners' guides (Chittenden and Bon, 2006; Jenner, 2012;and OGC, 2007), a conceptual example of benefits realisation,starting from projects and reaching the achievement of businessobjectives, is presented on Fig. 2. Conceptually, the process startson project outputs enabling business changes or directly deliveringintermediate benefits. Business changes create outcomes, which
Fig. 1. Filling th
Please cite this article as: C.E.M. Serra, M. Kunc, 2014. Benefits Realisation Manastrategies, Int. J. Proj. Manag. http://dx.doi.org/10.1016/j.ijproman.2014.03.011
prepare operations to realise benefits. Alternatively, businesschanges can also deliver intermediate benefits, regardless whetherthey are enabled by project outputs or not. They can also cause sideeffects, which are the negative outcomes from change, such asrequirement of additional skills or cost increases. These side effectsand consequences can also realise further intermediate benefits.Intermediate benefits contribute to the achievement of end benefits(Bradley, 2010) and end benefits directly contribute to theachievement of one or more strategic objectives of the organisa-tion. Usually, end benefits are results of changing processescomposed by sets of projects that are managed together as aprogramme (Bradley, 2010), which coordinates work in a synergicway to generate more benefits than projects could do individually(Thiry, 2002).
Therefore, from a strategic perspective, successful projectsdeliver the expected benefits, then creating strategic value tothe business. Careful management of each project ensures thedelivery of outputs, enables outcomes, and then supports therealisation of the right benefits. Although benefits are not theonly criteria to evaluate project success, they are a measure-ment of how valuable a project is. This is the realm of BenefitsManagement Realisation.
3. Research methodology
This research aims to test the relationship between BRMpractices and perceptions of project success. Then, in order toelucidate a phenomenon by testing the relationship betweenvariables, we performed a survey study using questionnairesand data analysis using analytical survey tools (Blaxter et al.,1996).
3.1. Sampling procedures
The sample was selected by stratified random samplingprocedures over a population composed by Project Management
e value gap.
gement and its influence on project success and on the execution of business

Fig. 2. Chain of benefits.
4 C.E.M. Serra, M. Kunc / International Journal of Project Management xx (2014) xxx–xxx
Practitioners who have worked in the area in the last two years, inat least one project that is now concluded and in one of the threecountries under analysis: Brazil, United Kingdom (UK) andUnited States of America (USA). We selected practitioners fromUSA because this is the largest community, the UK to provide aEuropean perspective, while Brazil was included given its statusof emerging market. The sample was stratified, because theassessment of independent strata of the population enablesinter-group analysis (Field, 2009), which could confirm a regularpattern or lead to divergent results (Teddlie and Tashakkori, 2009).Project team members were specifically targeted since they areparticipants in their projects. Even though they may not have acomplete overview; project management teams know the relevanceand priority of project outcomes (Gray and Larson, 2006) and tohave experienced the dynamics of project management, includingroles, techniques and practices.
In order to analyse experiences and to avoid loss of details orveracity, the data structure was defined as cross sectional, referring
Table 1Questions and references. Project success criteria.
Please rate how much you agree with the following statements from three different
Dimension Item NameProject success PS The project was successfulProject managementperformance
PSB The project has satisfactorily met the budget goalsPSS The project has satisfactorily met the schedule goalsPSR The project has satisfactorily delivered the required out
Creation of valuefor the business
PSE Project's outputs have supported the business to producPSU Undesired outcomes were managed and avoidedPSI The project has provided the expected return on investmPSC The project's outcomes adhered to the outcomes plann
* General perception of success. No specific criteria or reference.
Please cite this article as: C.E.M. Serra, M. Kunc, 2014. Benefits Realisation Manstrategies, Int. J. Proj. Manag. http://dx.doi.org/10.1016/j.ijproman.2014.03.011
to one specific event occurred in no more than two years. Thatdecision was made because the memory of respondents iscompromised depending on how long the events under analysishas occurred (Foddy, 1993; Iarossi, 2006). When focusing on asingle event some experiments show that in three years up toaround 50% is irretrievable, but around a period of two years only10% to 30% of the details are irretrievable (Iarossi, 2006).
3.2. Questionnaire design
The quantitative questionnaire was composed by closedquestions requiring respondents to identify perceptions of projectsuccess and BRM practices identified from the literature (seeTables 1 and 2) plus controlling variables. In order to identifyrespondents' perceptions on project success and on how muchBRMpractices had been applied in their previous experience, mostquestions were closed and subjectively responded by rating scales,Likert Scales. Likert scales are suitable to evaluate people's
perspectives (project team, project sponsor, and project customer)
Sources*Zwikael and Smyrk (2011), Camilleri (2011),Ika (2009), Shenhar and Patanakul (2012)
puts (i.e. fulfilled its requisites)e the expected outcomes
ented in the business case
agement and its influence on project success and on the execution of business
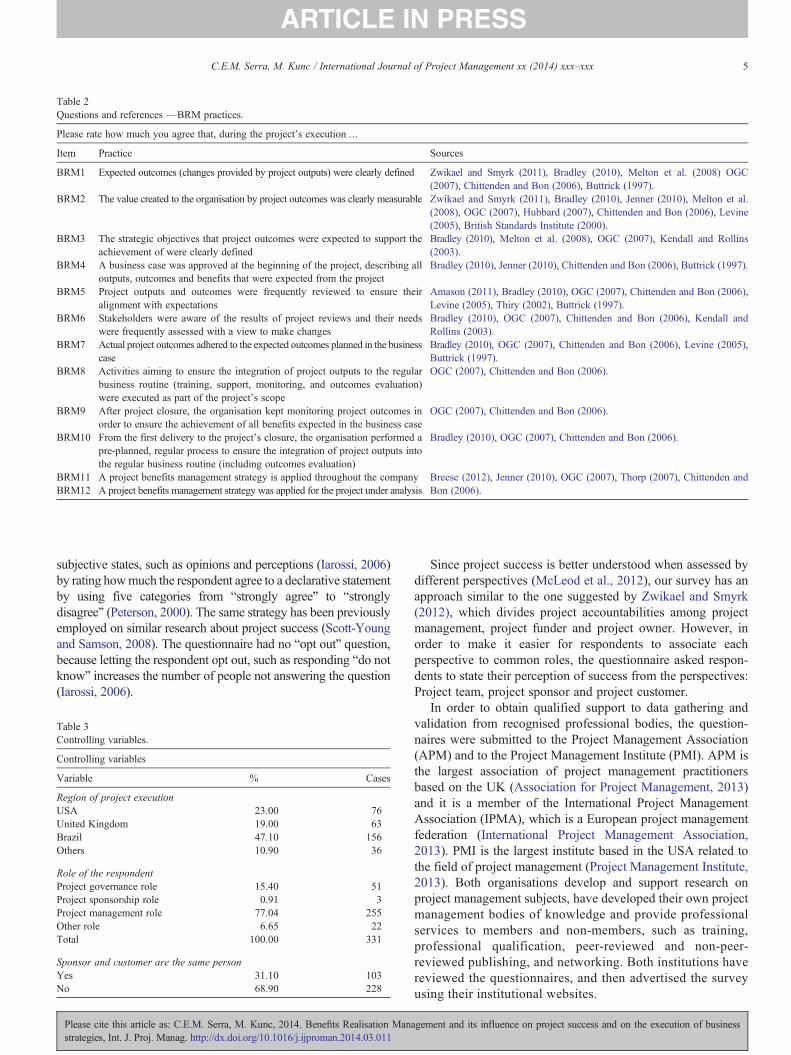
Table 2Questions and references —BRM practices.
Please rate how much you agree that, during the project's execution …
Item Practice Sources
BRM1 Expected outcomes (changes provided by project outputs) were clearly defined Zwikael and Smyrk (2011), Bradley (2010), Melton et al. (2008) OGC(2007), Chittenden and Bon (2006), Buttrick (1997).
BRM2 The value created to the organisation by project outcomes was clearly measurable Zwikael and Smyrk (2011), Bradley (2010), Jenner (2010), Melton et al.(2008), OGC (2007), Hubbard (2007), Chittenden and Bon (2006), Levine(2005), British Standards Institute (2000).
BRM3 The strategic objectives that project outcomes were expected to support theachievement of were clearly defined
Bradley (2010), Melton et al. (2008), OGC (2007), Kendall and Rollins(2003).
BRM4 A business case was approved at the beginning of the project, describing alloutputs, outcomes and benefits that were expected from the project
Bradley (2010), Jenner (2010), Chittenden and Bon (2006), Buttrick (1997).
BRM5 Project outputs and outcomes were frequently reviewed to ensure theiralignment with expectations
Amason (2011), Bradley (2010), OGC (2007), Chittenden and Bon (2006),Levine (2005), Thiry (2002), Buttrick (1997).
BRM6 Stakeholders were aware of the results of project reviews and their needswere frequently assessed with a view to make changes
Bradley (2010), OGC (2007), Chittenden and Bon (2006), Kendall andRollins (2003).
BRM7 Actual project outcomes adhered to the expected outcomes planned in the businesscase
Bradley (2010), OGC (2007), Chittenden and Bon (2006), Levine (2005),Buttrick (1997).
BRM8 Activities aiming to ensure the integration of project outputs to the regularbusiness routine (training, support, monitoring, and outcomes evaluation)were executed as part of the project's scope
OGC (2007), Chittenden and Bon (2006).
BRM9 After project closure, the organisation kept monitoring project outcomes inorder to ensure the achievement of all benefits expected in the business case
OGC (2007), Chittenden and Bon (2006).
BRM10 From the first delivery to the project's closure, the organisation performed apre-planned, regular process to ensure the integration of project outputs intothe regular business routine (including outcomes evaluation)
Bradley (2010), OGC (2007), Chittenden and Bon (2006).
BRM11 A project benefits management strategy is applied throughout the company Breese (2012), Jenner (2010), OGC (2007), Thorp (2007), Chittenden andBon (2006).BRM12 A project benefits management strategy was applied for the project under analysis
5C.E.M. Serra, M. Kunc / International Journal of Project Management xx (2014) xxx–xxx
subjective states, such as opinions and perceptions (Iarossi, 2006)by rating howmuch the respondent agree to a declarative statementby using five categories from “strongly agree” to “stronglydisagree” (Peterson, 2000). The same strategy has been previouslyemployed on similar research about project success (Scott-Youngand Samson, 2008). The questionnaire had no “opt out” question,because letting the respondent opt out, such as responding “do notknow” increases the number of people not answering the question(Iarossi, 2006).
Table 3Controlling variables.
Controlling variables
Variable % Cases
Region of project executionUSA 23.00 76United Kingdom 19.00 63Brazil 47.10 156Others 10.90 36
Role of the respondentProject governance role 15.40 51Project sponsorship role 0.91 3Project management role 77.04 255Other role 6.65 22Total 100.00 331
Sponsor and customer are the same personYes 31.10 103No 68.90 228
Please cite this article as: C.E.M. Serra, M. Kunc, 2014. Benefits Realisation Manastrategies, Int. J. Proj. Manag. http://dx.doi.org/10.1016/j.ijproman.2014.03.011
Since project success is better understood when assessed bydifferent perspectives (McLeod et al., 2012), our survey has anapproach similar to the one suggested by Zwikael and Smyrk(2012), which divides project accountabilities among projectmanagement, project funder and project owner. However, inorder to make it easier for respondents to associate eachperspective to common roles, the questionnaire asked respon-dents to state their perception of success from the perspectives:Project team, project sponsor and project customer.
In order to obtain qualified support to data gathering andvalidation from recognised professional bodies, the question-naires were submitted to the Project Management Association(APM) and to the Project Management Institute (PMI). APM isthe largest association of project management practitionersbased on the UK (Association for Project Management, 2013)and it is a member of the International Project ManagementAssociation (IPMA), which is a European project managementfederation (International Project Management Association,2013). PMI is the largest institute based in the USA related tothe field of project management (Project Management Institute,2013). Both organisations develop and support research onproject management subjects, have developed their own projectmanagement bodies of knowledge and provide professionalservices to members and non-members, such as training,professional qualification, peer-reviewed and non-peer-reviewed publishing, and networking. Both institutions havereviewed the questionnaires, and then advertised the surveyusing their institutional websites.
gement and its influence on project success and on the execution of business
6 C.E.M. Serra, M. Kunc / International Journal of Project Management xx (2014) xxx–xxx
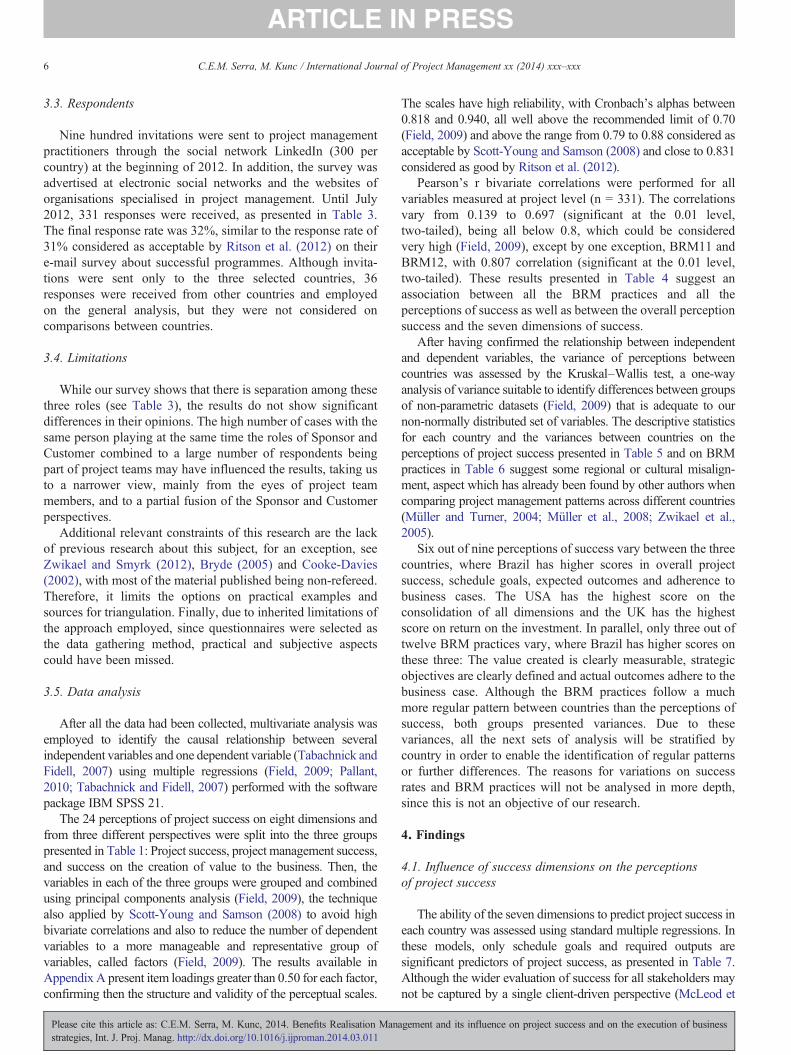
3.3. Respondents
Nine hundred invitations were sent to project managementpractitioners through the social network LinkedIn (300 percountry) at the beginning of 2012. In addition, the survey wasadvertised at electronic social networks and the websites oforganisations specialised in project management. Until July2012, 331 responses were received, as presented in Table 3.The final response rate was 32%, similar to the response rate of31% considered as acceptable by Ritson et al. (2012) on theire-mail survey about successful programmes. Although invita-tions were sent only to the three selected countries, 36responses were received from other countries and employedon the general analysis, but they were not considered oncomparisons between countries.
3.4. Limitations
While our survey shows that there is separation among thesethree roles (see Table 3), the results do not show significantdifferences in their opinions. The high number of cases with thesame person playing at the same time the roles of Sponsor andCustomer combined to a large number of respondents beingpart of project teams may have influenced the results, taking usto a narrower view, mainly from the eyes of project teammembers, and to a partial fusion of the Sponsor and Customerperspectives.
Additional relevant constraints of this research are the lackof previous research about this subject, for an exception, seeZwikael and Smyrk (2012), Bryde (2005) and Cooke-Davies(2002), with most of the material published being non-refereed.Therefore, it limits the options on practical examples andsources for triangulation. Finally, due to inherited limitations ofthe approach employed, since questionnaires were selected asthe data gathering method, practical and subjective aspectscould have been missed.
3.5. Data analysis
After all the data had been collected, multivariate analysis wasemployed to identify the causal relationship between severalindependent variables and one dependent variable (Tabachnick andFidell, 2007) using multiple regressions (Field, 2009; Pallant,2010; Tabachnick and Fidell, 2007) performed with the softwarepackage IBM SPSS 21.
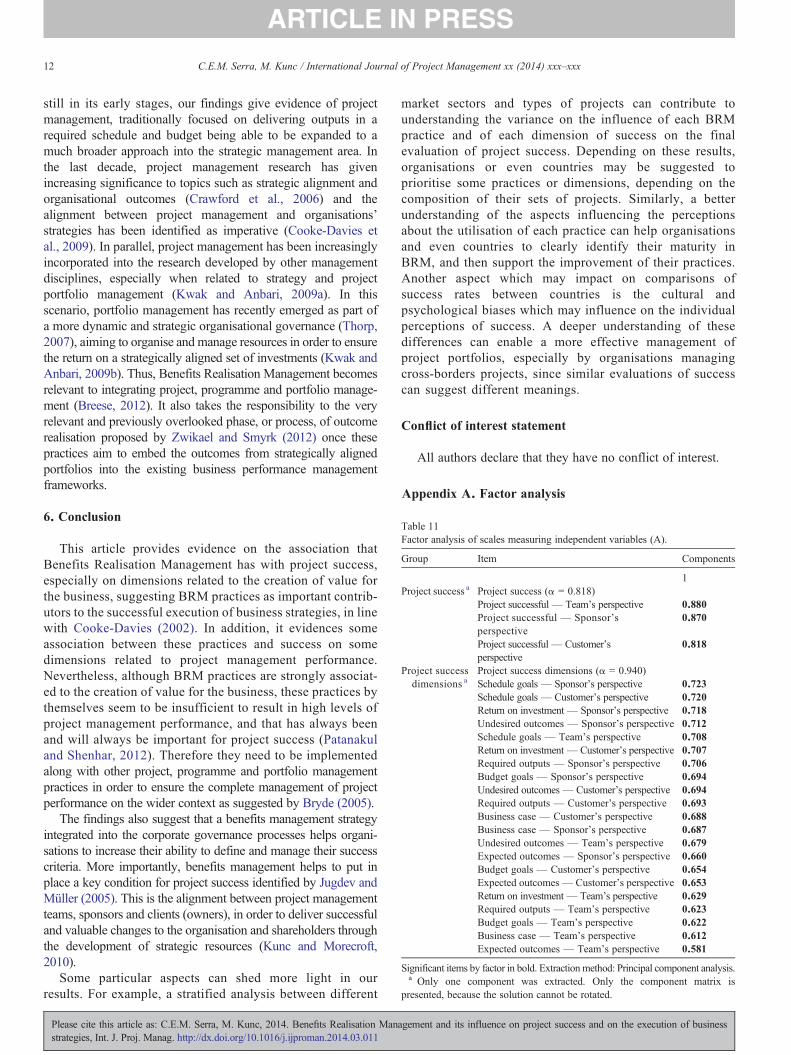
The 24 perceptions of project success on eight dimensions andfrom three different perspectives were split into the three groupspresented in Table 1: Project success, project management success,and success on the creation of value to the business. Then, thevariables in each of the three groups were grouped and combinedusing principal components analysis (Field, 2009), the techniquealso applied by Scott-Young and Samson (2008) to avoid highbivariate correlations and also to reduce the number of dependentvariables to a more manageable and representative group ofvariables, called factors (Field, 2009). The results available inAppendix A present item loadings greater than 0.50 for each factor,confirming then the structure and validity of the perceptual scales.
Please cite this article as: C.E.M. Serra, M. Kunc, 2014. Benefits Realisation Manstrategies, Int. J. Proj. Manag. http://dx.doi.org/10.1016/j.ijproman.2014.03.011
The scales have high reliability, with Cronbach's alphas between0.818 and 0.940, all well above the recommended limit of 0.70(Field, 2009) and above the range from 0.79 to 0.88 considered asacceptable by Scott-Young and Samson (2008) and close to 0.831considered as good by Ritson et al. (2012).
Pearson's r bivariate correlations were performed for allvariables measured at project level (n = 331). The correlationsvary from 0.139 to 0.697 (significant at the 0.01 level,two-tailed), being all below 0.8, which could be consideredvery high (Field, 2009), except by one exception, BRM11 andBRM12, with 0.807 correlation (significant at the 0.01 level,two-tailed). These results presented in Table 4 suggest anassociation between all the BRM practices and all theperceptions of success as well as between the overall perceptionsuccess and the seven dimensions of success.
After having confirmed the relationship between independentand dependent variables, the variance of perceptions betweencountries was assessed by the Kruskal–Wallis test, a one-wayanalysis of variance suitable to identify differences between groupsof non-parametric datasets (Field, 2009) that is adequate to ournon-normally distributed set of variables. The descriptive statisticsfor each country and the variances between countries on theperceptions of project success presented in Table 5 and on BRMpractices in Table 6 suggest some regional or cultural misalign-ment, aspect which has already been found by other authors whencomparing project management patterns across different countries(Müller and Turner, 2004; Müller et al., 2008; Zwikael et al.,2005).
Six out of nine perceptions of success vary between the threecountries, where Brazil has higher scores in overall projectsuccess, schedule goals, expected outcomes and adherence tobusiness cases. The USA has the highest score on theconsolidation of all dimensions and the UK has the highestscore on return on the investment. In parallel, only three out oftwelve BRM practices vary, where Brazil has higher scores onthese three: The value created is clearly measurable, strategicobjectives are clearly defined and actual outcomes adhere to thebusiness case. Although the BRM practices follow a muchmore regular pattern between countries than the perceptions ofsuccess, both groups presented variances. Due to thesevariances, all the next sets of analysis will be stratified bycountry in order to enable the identification of regular patternsor further differences. The reasons for variations on successrates and BRM practices will not be analysed in more depth,since this is not an objective of our research.
4. Findings
4.1. Influence of success dimensions on the perceptionsof project success
The ability of the seven dimensions to predict project success ineach country was assessed using standard multiple regressions. Inthese models, only schedule goals and required outputs aresignificant predictors of project success, as presented in Table 7.Although the wider evaluation of success for all stakeholders maynot be captured by a single client-driven perspective (McLeod et
agement and its influence on project success and on the execution of business
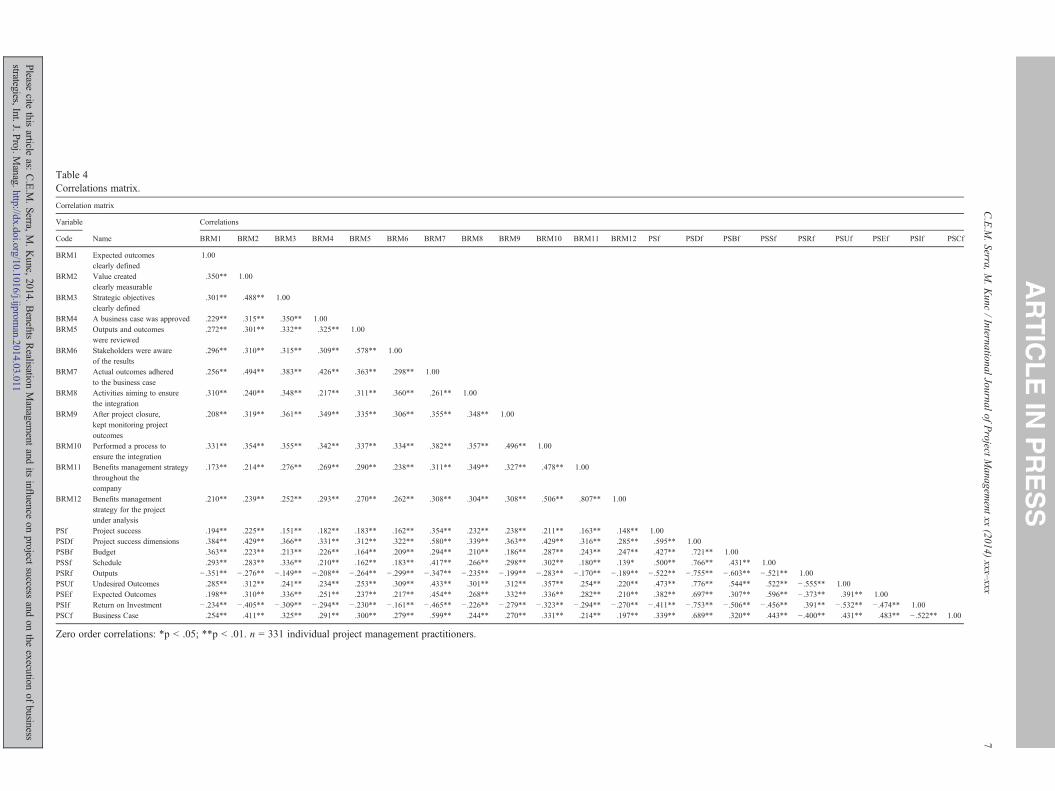
Table 4Correlations matrix.
Correlation matrix
Variable Correlations
Code Name BRM1 BRM2 BRM3 BRM4 BRM5 BRM6 BRM7 BRM8 BRM9 BRM10 BRM11 BRM12 PSf PSDf PSBf PSSf PSRf PSUf PSEf PSIf PSCf
BRM1 Expected outcomesclearly defined
1.00
BRM2 Value createdclearly measurable
.350** 1.00
BRM3 Strategic objectivesclearly defined
.301** .488** 1.00
BRM4 A business case was approved .229** .315** .350** 1.00BRM5 Outputs and outcomes
were reviewed.272** .301** .332** .325** 1.00
BRM6 Stakeholders were awareof the results
.296** .310** .315** .309** .578** 1.00
BRM7 Actual outcomes adheredto the business case
.256** .494** .383** .426** .363** .298** 1.00
BRM8 Activities aiming to ensurethe integration
.310** .240** .348** .217** .311** .360** .261** 1.00
BRM9 After project closure,kept monitoring projectoutcomes
.208** .319** .361** .349** .335** .306** .355** .348** 1.00
BRM10 Performed a process toensure the integration
.331** .354** .355** .342** .337** .334** .382** .357** .496** 1.00
BRM11 Benefits management strategythroughout thecompany
.173** .214** .276** .269** .290** .238** .311** .349** .327** .478** 1.00
BRM12 Benefits managementstrategy for the projectunder analysis
.210** .239** .252** .293** .270** .262** .308** .304** .308** .506** .807** 1.00
PSf Project success .194** .225** .151** .182** .183** .162** .354** .232** .238** .211** .163** .148** 1.00PSDf Project success dimensions .384** .429** .366** .331** .312** .322** .580** .339** .363** .429** .316** .285** .595** 1.00PSBf Budget .363** .223** .213** .226** .164** .209** .294** .210** .186** .287** .243** .247** .427** .721** 1.00PSSf Schedule .293** .283** .336** .210** .162** .183** .417** .266** .298** .302** .180** .139* .500** .766** .431** 1.00PSRf Outputs − .351** − .276** − .149** − .208** − .264** − .299** − .347** − .235** − .199** − .283** − .170** − .189** − .522** − .755** − .603** − .521** 1.00PSUf Undesired Outcomes .285** .312** .241** .234** .253** .309** .433** .301** .312** .357** .254** .220** .473** .776** .544** .522** − .555** 1.00PSEf Expected Outcomes .198** .310** .336** .251** .237** .217** .454** .268** .332** .336** .282** .210** .382** .697** .307** .596** − .373** .391** 1.00PSIf Return on Investment − .234** − .405** − .309** − .294** − .230** − .161** − .465** − .226** − .279** − .323** − .294** − .270** − .411** − .753** − .506** − .456** .391** − .532** − .474** 1.00PSCf Business Case .254** .411** .325** .291** .300** .279** .599** .244** .270** .331** .214** .197** .339** .689** .320** .443** − .400** .431** .483** − .522** 1.00
Zero order correlations: *p b .05; **p b .01. n = 331 individual project management practitioners.
7C.E.M
.Serra,M.Kunc
/International
Journalof
Project
Managem
entxx
(2014)xxx–xxx
Please
citethis
articleas:
C.E.M
.Serra,
M.Kunc,
2014.Benefi
tsRealisation
Managem
entand
itsinfl
uenceon
projectsuccess
andon
theexecution
ofbusiness
strategies,Int.J.Proj.M
anag.http://dx.doi.org/10.1016/j.ijproman.2014.03.011
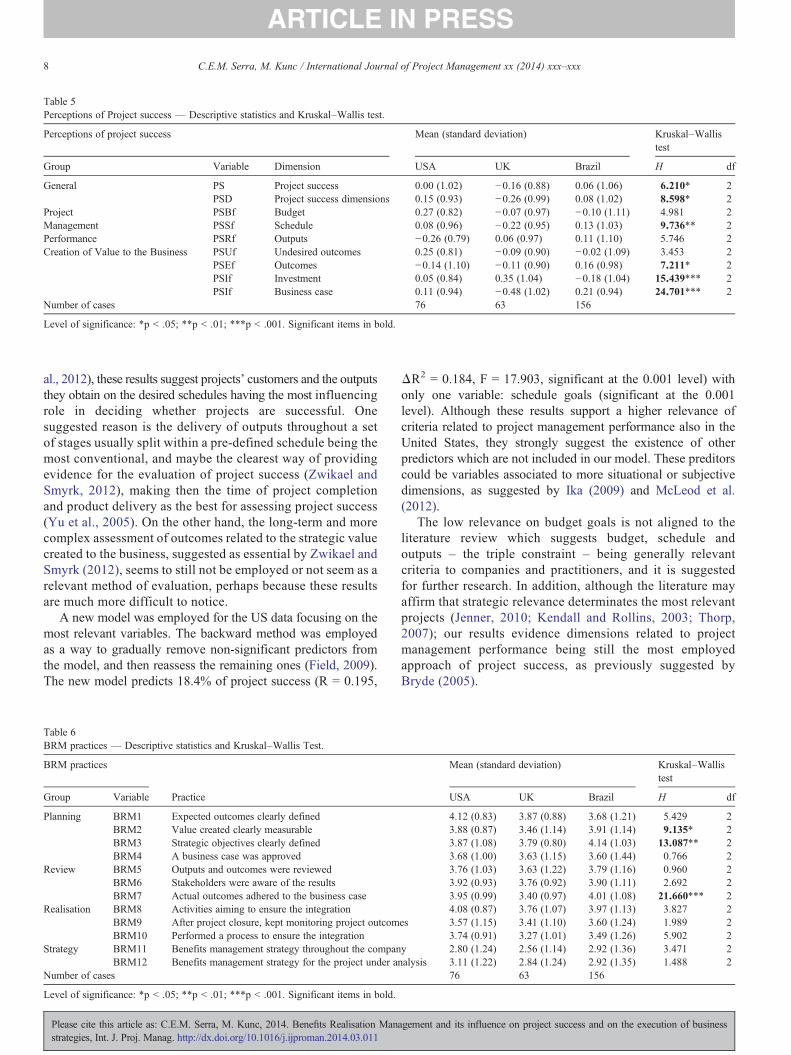
Table 5Perceptions of Project success — Descriptive statistics and Kruskal–Wallis test.
Perceptions of project success Mean (standard deviation) Kruskal–Wallistest
Group Variable Dimension USA UK Brazil H df
General PS Project success 0.00 (1.02) −0.16 (0.88) 0.06 (1.06) 6.210* 2PSD Project success dimensions 0.15 (0.93) −0.26 (0.99) 0.08 (1.02) 8.598* 2
Project PSBf Budget 0.27 (0.82) −0.07 (0.97) −0.10 (1.11) 4.981 2Management PSSf Schedule 0.08 (0.96) −0.22 (0.95) 0.13 (1.03) 9.736** 2Performance PSRf Outputs −0.26 (0.79) 0.06 (0.97) 0.11 (1.10) 5.746 2Creation of Value to the Business PSUf Undesired outcomes 0.25 (0.81) −0.09 (0.90) −0.02 (1.09) 3.453 2
PSEf Outcomes −0.14 (1.10) −0.11 (0.90) 0.16 (0.98) 7.211* 2PSIf Investment 0.05 (0.84) 0.35 (1.04) −0.18 (1.04) 15.439*** 2PSIf Business case 0.11 (0.94) −0.48 (1.02) 0.21 (0.94) 24.701*** 2
Number of cases 76 63 156
Level of significance: *p b .05; **p b .01; ***p b .001. Significant items in bold.
8 C.E.M. Serra, M. Kunc / International Journal of Project Management xx (2014) xxx–xxx
al., 2012), these results suggest projects' customers and the outputsthey obtain on the desired schedules having the most influencingrole in deciding whether projects are successful. Onesuggested reason is the delivery of outputs throughout a setof stages usually split within a pre-defined schedule being themost conventional, and maybe the clearest way of providingevidence for the evaluation of project success (Zwikael andSmyrk, 2012), making then the time of project completionand product delivery as the best for assessing project success(Yu et al., 2005). On the other hand, the long-term and morecomplex assessment of outcomes related to the strategic valuecreated to the business, suggested as essential by Zwikael andSmyrk (2012), seems to still not be employed or not seem as arelevant method of evaluation, perhaps because these resultsare much more difficult to notice.
A new model was employed for the US data focusing on themost relevant variables. The backward method was employedas a way to gradually remove non-significant predictors fromthe model, and then reassess the remaining ones (Field, 2009).The new model predicts 18.4% of project success (R = 0.195,
Table 6BRM practices — Descriptive statistics and Kruskal–Wallis Test.
BRM practices
Group Variable Practice
Planning BRM1 Expected outcomes clearly definedBRM2 Value created clearly measurableBRM3 Strategic objectives clearly definedBRM4 A business case was approved
Review BRM5 Outputs and outcomes were reviewedBRM6 Stakeholders were aware of the resultsBRM7 Actual outcomes adhered to the business case
Realisation BRM8 Activities aiming to ensure the integrationBRM9 After project closure, kept monitoring project outcomBRM10 Performed a process to ensure the integration
Strategy BRM11 Benefits management strategy throughout the companBRM12 Benefits management strategy for the project under an
Number of cases
Level of significance: *p b .05; **p b .01; ***p b .001. Significant items in bold.
Please cite this article as: C.E.M. Serra, M. Kunc, 2014. Benefits Realisation Manstrategies, Int. J. Proj. Manag. http://dx.doi.org/10.1016/j.ijproman.2014.03.011
ΔR2 = 0.184, F = 17.903, significant at the 0.001 level) withonly one variable: schedule goals (significant at the 0.001level). Although these results support a higher relevance ofcriteria related to project management performance also in theUnited States, they strongly suggest the existence of otherpredictors which are not included in our model. These preditorscould be variables associated to more situational or subjectivedimensions, as suggested by Ika (2009) and McLeod et al.(2012).
The low relevance on budget goals is not aligned to theliterature review which suggests budget, schedule andoutputs – the triple constraint – being generally relevantcriteria to companies and practitioners, and it is suggestedfor further research. In addition, although the literature mayaffirm that strategic relevance determinates the most relevantprojects (Jenner, 2010; Kendall and Rollins, 2003; Thorp,2007); our results evidence dimensions related to projectmanagement performance being still the most employedapproach of project success, as previously suggested byBryde (2005).
Mean (standard deviation) Kruskal–Wallistest
USA UK Brazil H df
4.12 (0.83) 3.87 (0.88) 3.68 (1.21) 5.429 23.88 (0.87) 3.46 (1.14) 3.91 (1.14) 9.135* 23.87 (1.08) 3.79 (0.80) 4.14 (1.03) 13.087** 23.68 (1.00) 3.63 (1.15) 3.60 (1.44) 0.766 23.76 (1.03) 3.63 (1.22) 3.79 (1.16) 0.960 23.92 (0.93) 3.76 (0.92) 3.90 (1.11) 2.692 23.95 (0.99) 3.40 (0.97) 4.01 (1.08) 21.660*** 24.08 (0.87) 3.76 (1.07) 3.97 (1.13) 3.827 2
es 3.57 (1.15) 3.41 (1.10) 3.60 (1.24) 1.989 23.74 (0.91) 3.27 (1.01) 3.49 (1.26) 5.902 2
y 2.80 (1.24) 2.56 (1.14) 2.92 (1.36) 3.471 2alysis 3.11 (1.22) 2.84 (1.24) 2.92 (1.35) 1.488 2
76 63 156
agement and its influence on project success and on the execution of business
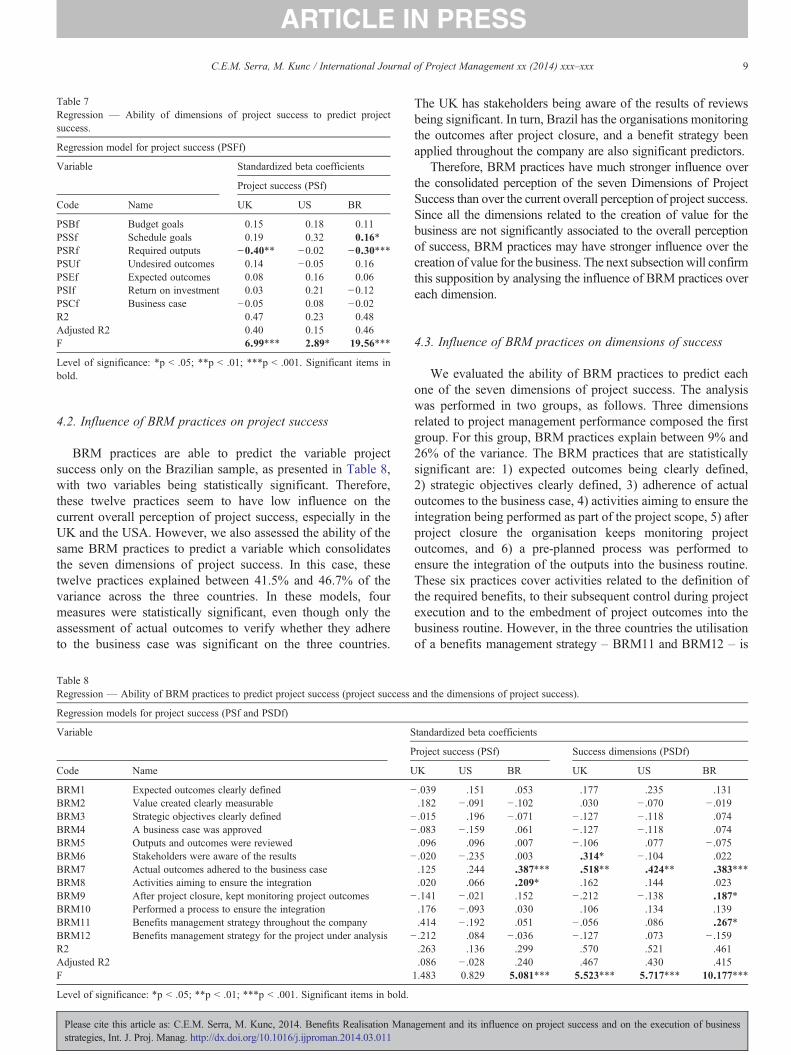
Table 7Regression — Ability of dimensions of project success to predict projectsuccess.
Regression model for project success (PSFf)
Variable Standardized beta coefficients
Project success (PSf)
Code Name UK US BR
PSBf Budget goals 0.15 0.18 0.11PSSf Schedule goals 0.19 0.32 0.16*PSRf Required outputs −0.40** −0.02 −0.30***PSUf Undesired outcomes 0.14 −0.05 0.16PSEf Expected outcomes 0.08 0.16 0.06PSIf Return on investment 0.03 0.21 −0.12PSCf Business case −0.05 0.08 −0.02R2 0.47 0.23 0.48Adjusted R2 0.40 0.15 0.46F 6.99*** 2.89* 19.56***
Level of significance: *p b .05; **p b .01; ***p b .001. Significant items inbold.
9C.E.M. Serra, M. Kunc / International Journal of Project Management xx (2014) xxx–xxx
4.2. Influence of BRM practices on project success
BRM practices are able to predict the variable projectsuccess only on the Brazilian sample, as presented in Table 8,with two variables being statistically significant. Therefore,these twelve practices seem to have low influence on thecurrent overall perception of project success, especially in theUK and the USA. However, we also assessed the ability of thesame BRM practices to predict a variable which consolidatesthe seven dimensions of project success. In this case, thesetwelve practices explained between 41.5% and 46.7% of thevariance across the three countries. In these models, fourmeasures were statistically significant, even though only theassessment of actual outcomes to verify whether they adhereto the business case was significant on the three countries.
Table 8Regression — Ability of BRM practices to predict project success (project success
Regression models for project success (PSf and PSDf)
Variable S
P
Code Name U
BRM1 Expected outcomes clearly defined −BRM2 Value created clearly measurableBRM3 Strategic objectives clearly defined −BRM4 A business case was approved −BRM5 Outputs and outcomes were reviewedBRM6 Stakeholders were aware of the results −BRM7 Actual outcomes adhered to the business caseBRM8 Activities aiming to ensure the integrationBRM9 After project closure, kept monitoring project outcomes −BRM10 Performed a process to ensure the integrationBRM11 Benefits management strategy throughout the companyBRM12 Benefits management strategy for the project under analysis −R2Adjusted R2F
Level of significance: *p b .05; **p b .01; ***p b .001. Significant items in bold.
Please cite this article as: C.E.M. Serra, M. Kunc, 2014. Benefits Realisation Manastrategies, Int. J. Proj. Manag. http://dx.doi.org/10.1016/j.ijproman.2014.03.011
The UK has stakeholders being aware of the results of reviewsbeing significant. In turn, Brazil has the organisations monitoringthe outcomes after project closure, and a benefit strategy beenapplied throughout the company are also significant predictors.
Therefore, BRM practices have much stronger influence overthe consolidated perception of the seven Dimensions of ProjectSuccess than over the current overall perception of project success.Since all the dimensions related to the creation of value for thebusiness are not significantly associated to the overall perceptionof success, BRM practices may have stronger influence over thecreation of value for the business. The next subsection will confirmthis supposition by analysing the influence of BRM practices overeach dimension.
4.3. Influence of BRM practices on dimensions of success
We evaluated the ability of BRM practices to predict eachone of the seven dimensions of project success. The analysiswas performed in two groups, as follows. Three dimensionsrelated to project management performance composed the firstgroup. For this group, BRM practices explain between 9% and26% of the variance. The BRM practices that are statisticallysignificant are: 1) expected outcomes being clearly defined,2) strategic objectives clearly defined, 3) adherence of actualoutcomes to the business case, 4) activities aiming to ensure theintegration being performed as part of the project scope, 5) afterproject closure the organisation keeps monitoring projectoutcomes, and 6) a pre-planned process was performed toensure the integration of the outputs into the business routine.These six practices cover activities related to the definition ofthe required benefits, to their subsequent control during projectexecution and to the embedment of project outcomes into thebusiness routine. However, in the three countries the utilisationof a benefits management strategy – BRM11 and BRM12 – is
and the dimensions of project success).
tandardized beta coefficients
roject success (PSf) Success dimensions (PSDf)
K US BR UK US BR
.039 .151 .053 .177 .235 .131
.182 − .091 − .102 .030 − .070 − .019
.015 .196 − .071 − .127 − .118 .074
.083 − .159 .061 − .127 − .118 .074
.096 .096 .007 − .106 .077 − .075
.020 − .235 .003 .314* − .104 .022
.125 .244 .387*** .518** .424** .383***
.020 .066 .209* .162 .144 .023
.141 − .021 .152 − .212 − .138 .187*
.176 − .093 .030 .106 .134 .139
.414 − .192 .051 − .056 .086 .267*
.212 .084 − .036 − .127 .073 − .159
.263 .136 .299 .570 .521 .461
.086 − .028 .240 .467 .430 .4151.483 0.829 5.081*** 5.523*** 5.717*** 10.177***
gement and its influence on project success and on the execution of business

10 C.E.M. Serra, M. Kunc / International Journal of Project Management xx (2014) xxx–xxx
not associated to these dimensions. More details about eachregression are presented in Table 9.
The four dimensions related to value for business composed thesecond group. In this case, BRM practices explain between 15%and 49% of the variance. Eight practices are statisticallysignificant, evidencing a much stronger association of thesepractices with success on the creation of value to the business. Inthe three countries, the adherence of actual outcomes to thebusiness case is associated to most dimensions, except byundesired outcomes in the US and expected outcomes in the UK.Despite these two exceptions, this result confirms the relevance ofthis practice on the prediction of the dimensions of project success,as presented in Table 8. In addition, the stakeholders being awareof results of project reviews is a practice associated to the return oninvestment across the three countries, which evidences thefrequent realignment of expectations among stakeholders being acritical success factor for strategic project success, as previouslyidentified by Jugdev and Müller (2005). More details about eachregression are presented in Table 10.
5. Discussion
5.1. Project management performance: The more relevantsuccess criteria
The first set of analysis presented in Table 7 reinforces thecurrent idea that organisations and professionals evaluateproject success straight after the delivery stage has finished(Atkinson, 1999) and mostly by criteria related to projectmanagement performance. Bryde (2005) has previouslyidentified and suggested this practice as a narrow way tomeasure success by focusing on short-term measures.
Table 9Regression — Ability of BRM practices to predict success dimensions related to pr
Regression models for project management success dimensions (PSBf, PSSf, PSRf)
Variable Standardized be
Budget (PSBf)
Code Name UK US
BRM1 Expected outcomes clearly defined 0.11 0.24BRM2 Value created clearly measurable −0.01 −0.03BRM3 Strategic objectives clearly defined 0.02 −0.07BRM4 A business case was approved −0.07 0.03BRM5 Outputs and outcomes were reviewed −0.20 −0.05BRM6 Stakeholders were aware of the results 0.37 −0.01BRM7 Actual outcomes adhered to the business case 0.39* 0.03BRM8 Activities aiming to ensure the integration −0.03 0.37*BRM9 After project closure, kept monitoring project outcomes −0.19 0.14BRM10 Performed a process to ensure the integration 0.16 0.00BRM11 Benefits management strategy throughout the company −0.14 0.07BRM12 Benefits management strategy for the project under
analysis−0.01 −0.03
R2 0.27 0.30AdjustedR2
0.09 0.17
F 1.52 2.30*
Level of significance: *p b .05; **p b .01; ***p b .001. Significant items in bold.
Please cite this article as: C.E.M. Serra, M. Kunc, 2014. Benefits Realisation Manstrategies, Int. J. Proj. Manag. http://dx.doi.org/10.1016/j.ijproman.2014.03.011
Besides encouraging project managers to focus on short-term and tactical measures rather than on long-term andstrategic improvements on performance (Bryde, 2005), thisapproach also challenges any attempt to implement BRMpractices. In order to apply Benefits Realisation Management insupport to a successful implementation of business strategies,organisations need to redesign their success criteria to increasethe relevance of dimensions related to the creation of value forthe business. Otherwise, any initiatives aiming to increasesuccess rates of the most strategically oriented projects mayseem unsuccessful, since organisations are still focusing on theevaluation of how successful they are on project managementrather than evaluating how successful their projects are increating value for the business.
5.2. Benefits Realisation Management: drivers to the creationof strategic value
The results presented on Tables 8, 9 and 10 revealed BRMpractices being much more associated to the creation of value tothe business than to project management performance, asCooke-Davies (2002) has previously identified. Due to the lowassociation between the creation of value and the overallperception of success, BRM practices have relatively low abilityto predict the overall perception of project success, in comparisonto the much higher ability they have over a balanced combinationof dimensions. Nevertheless, although the results can be differentbetween countries, the models presented on Tables 9 and 10revealed BRM practices being somehow associated to mostdimensions of success, even to schedule goals and requiredoutputs, which were the only dimensions being significantlyassociated to the overall perception of success, both of which arerelated to success in project management performance.
oject management performance.
ta coefficients
Schedule (PSSf) Outputs (PSRf)
BR UK US BR UK US BR
0.31*** 0.27 0.22 0.11 −0.02 −0.27 −0.18**−0.02 −0.11 −0.21 −0.16 −0.13 0.01 0.04−0.02 0.10 0.43** 0.15 0.00 −0.10 0.130.10 −0.15 −0.16 0.02 0.21 0.13 −0.08
−0.06 −0.22 0.14 −0.18 −0.06 −0.13 0.06−0.02 0.15 −0.24 −0.02 −0.28 −0.04 −0.090.15 0.32 0.51** 0.32*** −0.39* −0.40** −0.20**
−0.09 0.50** −0.09 0.06 0.01 0.04 −0.100.07 −0.29* −0.26 0.21* 0.06 0.27 −0.10
−0.01 −0.08 0.09 0.21* −0.03 −0.10 −0.140.25 0.09 0.12 0.13 −0.07 0.04 −0.010.00 −0.13 0.07 −0.20 0.20 −0.08 −0.02
0.25 0.40 0.38 0.31 0.36 0.35 0.230.18 0.25 0.26 0.25 0.21 0.23 0.16
3.88*** 2.73** 3.15** 5.30*** 2.37** 2.87** 3.49***
agement and its influence on project success and on the execution of business

11C.E.M. Serra, M. Kunc / International Journal of Project Management xx (2014) xxx–xxx
Another relevant finding presented in Table 10 is the practiceadherence of actual outcomes to the ones planned in the businesscase being consistently relevant to predict two dimensions ofsuccess across the three countries: the return on the investmentand, obviously, the business case success. These results evidencebusiness cases being effective tools for the comparison of theresults between project evaluations, performed at project closure
Table 10Regression — Ability of BRM practices to predict success dimensions related to th
Regression models for the creation of value for the business success dimensions (PS
Standardized beta coefficients
Undesired Outcomes (PSUs) Outcomes (PSEs)
Variable Name UK US BR UK US B
BRM1 Expectedoutcomesclearly defined
0.10 0.22 0.05 0.30 −0.06 −
BRM2 Value createdclearlymeasurable
0.02 −0.14 −0.01 0.04 −0.03 −
BRM3 Strategicobjectivesclearly defined
−0.15 −0.02 0.00 0.24 0.23
BRM4 A business casewas approved
−0.12 0.12 −0.05 −0.03 −0.12
BRM5 Outputs andoutcomes werereviewed
−0.16 −0.14 0.01 −0.04 0.05 −
BRM6 Stakeholderswere aware ofthe results ofreviews
0.39* 0.29 0.08 0.00 −0.11
BRM7 Actualoutcomesadhered to thebusiness case
0.56** 0.08 0.29** 0.10 0.33*
BRM8 Activitiesaiming to ensurethe integration
−0.09 0.16 0.08 0.34** 0.12 −
BRM9 After projectclosure, keptmonitoringprojectoutcomes
−0.19 0.04 0.20* −0.16 −0.11
BRM10 Performed aprocess toensure theintegration
0.46** 0.06 0.03 −0.02 0.18
BRM11 Benefitsmanagementstrategythroughout thecompany
−0.35* 0.12 0.31* 0.20 0.10
BRM12 Benefitsmanagementstrategy for theproject underanalysis
0.05 0.05 −0.20 −0.32 0.10 −
R2 0.55 0.37 0.29 0.40 0.29Adjusted
R20.44 0.25 0.23 0.26 0.15
F 5.08*** 3.04** 4.96*** 2.79** 2.14*
Level of significance: *p b .05; **p b .01; ***p b .001. Significant items in bold.
Please cite this article as: C.E.M. Serra, M. Kunc, 2014. Benefits Realisation Manastrategies, Int. J. Proj. Manag. http://dx.doi.org/10.1016/j.ijproman.2014.03.011
stages, to the results of project appraisals, done at project start forthe approval of business cases and updated throughout projectexecution. They also make the relevance of financial appraisals onbusiness cases clear, since these are key elements to supportsuccess on the return on investment.
Although the relevance of these BRM practices oninfluencing the perception of project success seems to be
e creation of value for the business.
Us, PSEs, PSIs, PSCs)
Investment (PSIs) Business Case (PSCs)
R UK US BR UK US BR
0.05 −0.09 −0.26* −0.04 0.09 0.19 −0.01
0.03 −0.12 0.01 −0.12 −0.06 0.05 0.05
0.03 −0.16 −0.11 0.00 0.17 0.22 −0.01
0.01 −0.01 0.12 −0.14 −0.09 −0.21 0.08
0.04 0.12 −0.19 0.03 0.09 0.08 −0.02
0.05 −0.39* 0.39** 0.18* 0.02 −0.09 0.13
0.42*** −0.35* −0.28* −0.22* 0.60*** 0.61*** 0.39***
0.02 −0.12 −0.28* 0.01 0.08 0.02 −0.03
0.19* 0.12 0.13 −0.14 −0.14 −0.11 0.01
0.15 0.11 −0.16 −0.08 0.14 0.11 0.10
0.37** 0.08 −0.10 −0.13 −0.08 −0.01 0.19
0.29* 0.10 −0.17 −0.02 0.04 −0.07 −0.22
0.42 0.42 0.52 0.29 0.59 0.56 0.300.37 0.28 0.42 0.23 0.49 0.47 0.24
8.54*** 3.03** 5.61*** 4.84*** 5.91*** 6.60*** 5.07***
gement and its influence on project success and on the execution of business
Factor analysis of scales measuring independent variables (A).
Group Item Components
1Project success a Project success (α = 0.818)
Project successful— Team's perspective 0.880Project successful — Sponsor'sperspective
0.870
Project successful— Customer'sperspective
0.818
Project successdimensions a
Project success dimensions (α = 0.940)Schedule goals — Sponsor's perspective 0.723Schedule goals — Customer's perspective 0.720Return on investment— Sponsor's perspective 0.718Undesired outcomes — Sponsor's perspective 0.712Schedule goals — Team's perspective 0.708Return on investment— Customer's perspective 0.707Required outputs — Sponsor's perspective 0.706Budget goals — Sponsor's perspective 0.694Undesired outcomes— Customer's perspective 0.694Required outputs — Customer's perspective 0.693Business case — Customer's perspective 0.688Business case — Sponsor's perspective 0.687Undesired outcomes — Team's perspective 0.679Expected outcomes — Sponsor's perspective 0.660Budget goals — Customer's perspective 0.654Expected outcomes— Customer's perspective 0.653Return on investment— Team's perspective 0.629Required outputs — Team's perspective 0.623Budget goals — Team's perspective 0.622Business case — Team's perspective 0.612Expected outcomes — Team's perspective 0.581
Significant items by factor in bold. Extractionmethod: Principal component analysis.a Only one component was extracted. Only the component matrix is
presented, because the solution cannot be rotated.
12 C.E.M. Serra, M. Kunc / International Journal of Project Management xx (2014) xxx–xxx
still in its early stages, our findings give evidence of projectmanagement, traditionally focused on delivering outputs in arequired schedule and budget being able to be expanded to amuch broader approach into the strategic management area. Inthe last decade, project management research has givenincreasing significance to topics such as strategic alignment andorganisational outcomes (Crawford et al., 2006) and thealignment between project management and organisations'strategies has been identified as imperative (Cooke-Davies etal., 2009). In parallel, project management has been increasinglyincorporated into the research developed by other managementdisciplines, especially when related to strategy and projectportfolio management (Kwak and Anbari, 2009a). In thisscenario, portfolio management has recently emerged as part ofa more dynamic and strategic organisational governance (Thorp,2007), aiming to organise and manage resources in order to ensurethe return on a strategically aligned set of investments (Kwak andAnbari, 2009b). Thus, Benefits Realisation Management becomesrelevant to integrating project, programme and portfolio manage-ment (Breese, 2012). It also takes the responsibility to the veryrelevant and previously overlooked phase, or process, of outcomerealisation proposed by Zwikael and Smyrk (2012) once thesepractices aim to embed the outcomes from strategically alignedportfolios into the existing business performance managementframeworks.
6. Conclusion
This article provides evidence on the association thatBenefits Realisation Management has with project success,especially on dimensions related to the creation of value forthe business, suggesting BRM practices as important contrib-utors to the successful execution of business strategies, in linewith Cooke-Davies (2002). In addition, it evidences someassociation between these practices and success on somedimensions related to project management performance.Nevertheless, although BRM practices are strongly associat-ed to the creation of value for the business, these practices bythemselves seem to be insufficient to result in high levels ofproject management performance, and that has always beenand will always be important for project success (Patanakuland Shenhar, 2012). Therefore they need to be implementedalong with other project, programme and portfolio managementpractices in order to ensure the complete management of projectperformance on the wider context as suggested by Bryde (2005).
The findings also suggest that a benefits management strategyintegrated into the corporate governance processes helps organi-sations to increase their ability to define and manage their successcriteria. More importantly, benefits management helps to put inplace a key condition for project success identified by Jugdev andMüller (2005). This is the alignment between project managementteams, sponsors and clients (owners), in order to deliver successfuland valuable changes to the organisation and shareholders throughthe development of strategic resources (Kunc and Morecroft,2010).
Some particular aspects can shed more light in ourresults. For example, a stratified analysis between different
Please cite this article as: C.E.M. Serra, M. Kunc, 2014. Benefits Realisation Manstrategies, Int. J. Proj. Manag. http://dx.doi.org/10.1016/j.ijproman.2014.03.011
market sectors and types of projects can contribute tounderstanding the variance on the influence of each BRMpractice and of each dimension of success on the finalevaluation of project success. Depending on these results,organisations or even countries may be suggested toprioritise some practices or dimensions, depending on thecomposition of their sets of projects. Similarly, a betterunderstanding of the aspects influencing the perceptionsabout the utilisation of each practice can help organisationsand even countries to clearly identify their maturity inBRM, and then support the improvement of their practices.Another aspect which may impact on comparisons ofsuccess rates between countries is the cultural andpsychological biases which may influence on the individualperceptions of success. A deeper understanding of thesedifferences can enable a more effective management ofproject portfolios, especially by organisations managingcross-borders projects, since similar evaluations of successcan suggest different meanings.
Conflict of interest statement
All authors declare that they have no conflict of interest.
Appendix A. Factor analysis
Table 11
agement and its influence on project success and on the execution of business
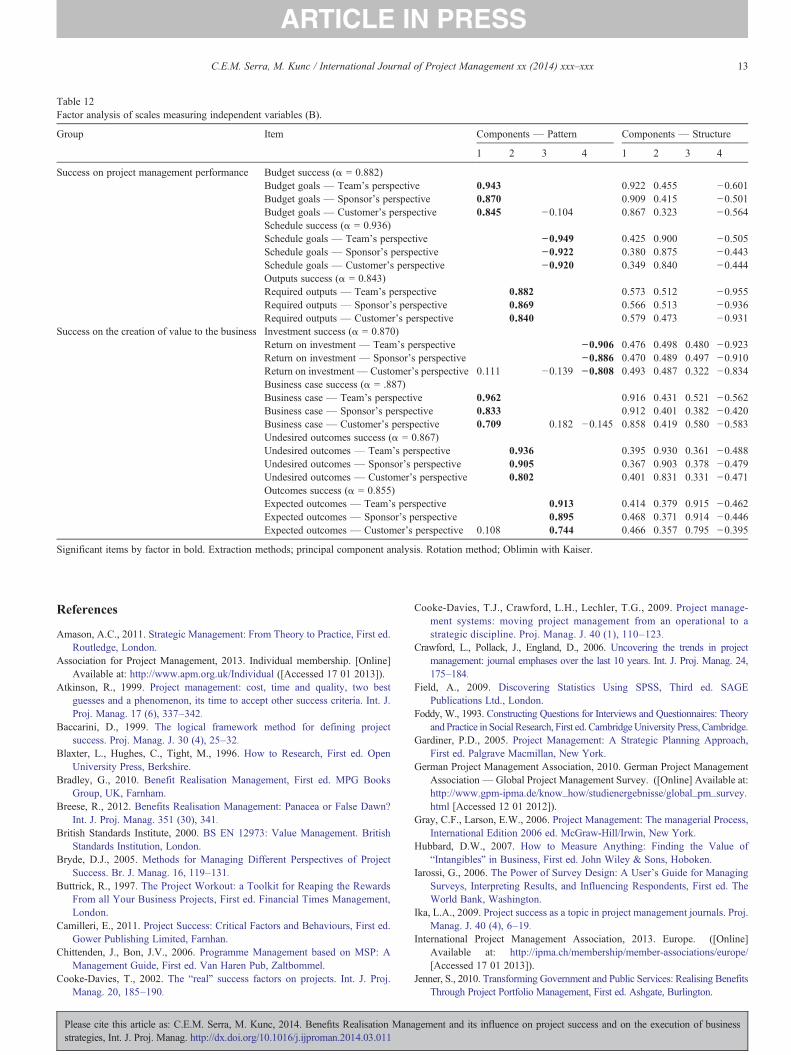
Table 12Factor analysis of scales measuring independent variables (B).
Group Item Components — Pattern Components — Structure
1 2 3 4 1 2 3 4
Success on project management performance Budget success (α = 0.882)Budget goals — Team's perspective 0.943 0.922 0.455 −0.601Budget goals — Sponsor's perspective 0.870 0.909 0.415 −0.501Budget goals — Customer's perspective 0.845 −0.104 0.867 0.323 −0.564Schedule success (α = 0.936)Schedule goals — Team's perspective −0.949 0.425 0.900 −0.505Schedule goals — Sponsor's perspective −0.922 0.380 0.875 −0.443Schedule goals — Customer's perspective −0.920 0.349 0.840 −0.444Outputs success (α = 0.843)Required outputs — Team's perspective 0.882 0.573 0.512 −0.955Required outputs — Sponsor's perspective 0.869 0.566 0.513 −0.936Required outputs — Customer's perspective 0.840 0.579 0.473 −0.931
Success on the creation of value to the business Investment success (α = 0.870)Return on investment — Team's perspective −0.906 0.476 0.498 0.480 −0.923Return on investment — Sponsor's perspective −0.886 0.470 0.489 0.497 −0.910Return on investment— Customer's perspective 0.111 −0.139 −0.808 0.493 0.487 0.322 −0.834Business case success (α = .887)Business case — Team's perspective 0.962 0.916 0.431 0.521 −0.562Business case — Sponsor's perspective 0.833 0.912 0.401 0.382 −0.420Business case — Customer's perspective 0.709 0.182 −0.145 0.858 0.419 0.580 −0.583Undesired outcomes success (α = 0.867)Undesired outcomes — Team's perspective 0.936 0.395 0.930 0.361 −0.488Undesired outcomes — Sponsor's perspective 0.905 0.367 0.903 0.378 −0.479Undesired outcomes — Customer's perspective 0.802 0.401 0.831 0.331 −0.471Outcomes success (α = 0.855)Expected outcomes — Team's perspective 0.913 0.414 0.379 0.915 −0.462Expected outcomes — Sponsor's perspective 0.895 0.468 0.371 0.914 −0.446Expected outcomes — Customer's perspective 0.108 0.744 0.466 0.357 0.795 −0.395
Significant items by factor in bold. Extraction methods; principal component analysis. Rotation method; Oblimin with Kaiser.
13C.E.M. Serra, M. Kunc / International Journal of Project Management xx (2014) xxx–xxx
References
Amason, A.C., 2011. Strategic Management: From Theory to Practice, First ed.Routledge, London.
Association for Project Management, 2013. Individual membership. [Online]Available at: http://www.apm.org.uk/Individual ([Accessed 17 01 2013]).
Atkinson, R., 1999. Project management: cost, time and quality, two bestguesses and a phenomenon, its time to accept other success criteria. Int. J.Proj. Manag. 17 (6), 337–342.
Baccarini, D., 1999. The logical framework method for defining projectsuccess. Proj. Manag. J. 30 (4), 25–32.
Blaxter, L., Hughes, C., Tight, M., 1996. How to Research, First ed. OpenUniversity Press, Berkshire.
Bradley, G., 2010. Benefit Realisation Management, First ed. MPG BooksGroup, UK, Farnham.
Breese, R., 2012. Benefits Realisation Management: Panacea or False Dawn?Int. J. Proj. Manag. 351 (30), 341.
British Standards Institute, 2000. BS EN 12973: Value Management. BritishStandards Institution, London.
Bryde, D.J., 2005. Methods for Managing Different Perspectives of ProjectSuccess. Br. J. Manag. 16, 119–131.
Buttrick, R., 1997. The Project Workout: a Toolkit for Reaping the RewardsFrom all Your Business Projects, First ed. Financial Times Management,London.
Camilleri, E., 2011. Project Success: Critical Factors and Behaviours, First ed.Gower Publishing Limited, Farnhan.
Chittenden, J., Bon, J.V., 2006. Programme Management based on MSP: AManagement Guide, First ed. Van Haren Pub, Zaltbommel.
Cooke-Davies, T., 2002. The “real” success factors on projects. Int. J. Proj.Manag. 20, 185–190.
Please cite this article as: C.E.M. Serra, M. Kunc, 2014. Benefits Realisation Manastrategies, Int. J. Proj. Manag. http://dx.doi.org/10.1016/j.ijproman.2014.03.011
Cooke-Davies, T.J., Crawford, L.H., Lechler, T.G., 2009. Project manage-ment systems: moving project management from an operational to astrategic discipline. Proj. Manag. J. 40 (1), 110–123.
Crawford, L., Pollack, J., England, D., 2006. Uncovering the trends in projectmanagement: journal emphases over the last 10 years. Int. J. Proj. Manag. 24,175–184.
Field, A., 2009. Discovering Statistics Using SPSS, Third ed. SAGEPublications Ltd., London.
Foddy, W., 1993. Constructing Questions for Interviews and Questionnaires: TheoryandPractice in Social Research, First ed. CambridgeUniversity Press, Cambridge.
Gardiner, P.D., 2005. Project Management: A Strategic Planning Approach,First ed. Palgrave Macmillan, New York.
German Project Management Association, 2010. German Project ManagementAssociation— Global Project Management Survey. ([Online] Available at:http://www.gpm-ipma.de/know_how/studienergebnisse/global_pm_survey.html [Accessed 12 01 2012]).
Gray, C.F., Larson, E.W., 2006. Project Management: The managerial Process,International Edition 2006 ed. McGraw-Hill/Irwin, New York.
Hubbard, D.W., 2007. How to Measure Anything: Finding the Value of“Intangibles” in Business, First ed. John Wiley & Sons, Hoboken.
Iarossi, G., 2006. The Power of Survey Design: A User's Guide for ManagingSurveys, Interpreting Results, and Influencing Respondents, First ed. TheWorld Bank, Washington.
Ika, L.A., 2009. Project success as a topic in project management journals. Proj.Manag. J. 40 (4), 6–19.
International Project Management Association, 2013. Europe. ([Online]Available at: http://ipma.ch/membership/member-associations/europe/[Accessed 17 01 2013]).
Jenner, S., 2010. Transforming Government and Public Services: Realising BenefitsThrough Project Portfolio Management, First ed. Ashgate, Burlington.
gement and its influence on project success and on the execution of business

14 C.E.M. Serra, M. Kunc / International Journal of Project Management xx (2014) xxx–xxx
Jenner, S., 2012. Managing Benefits: Optimizing the Return From Investments,1st ed. TSO, London.
Johnson, G., Scholes, K., 2002. Exploring Corporate Strategy, Sixth ed.Prentice Hall, London.
Jugdev, K., Müller, R., 2005. A retrospective look at our evolvingunderstanding of project success. Proj. Manag. J. 36 (4), 19–31.
Kaplan, R.S., Norton, D.P., 2008. The Execution Premium: Linking Strategy toOperations for Competitive Advantage, First ed. Harvard Business SchoolPublishing Corporation, Boston.
Kendall, G.I., Rollins, S.C., 2003. Advanced Project Portfolio Management andthe PMO: Multiplying ROI at Warp Speed, First ed. J. Ross, Boca Raton.
Kerzner, H., 2009. Project Management: A Systems Approach to Planning,Scheduling and Controlling, 10th ed. John Wiley & Sons, Hoboken.
Kerzner, H., 2011. Project Management Metrics, KPIs, and Dashboards: AGuide to Measuring and Monitoring Project Performance, First ed. JohnWiley & Sons, Inc., Hoboken.
Kunc, M., Morecroft, J., 2010. Managerial decision-making and firm performanceunder a resource-based paradigm. Strateg. Manag. J. 31, 1164–1182.
Kwak, Y.H., Anbari, F.T., 2009a. Analyzing project management research:perspectives from topmanagement journals. Int. J. Proj.Manag. 27 (5), 435–446.
Kwak, Y.H., Anbari, F.T., 2009b. Availability-impact analysis of projectmanagement trends: perspectives from allied disciplines. Proj. Manag. J. 40(2), 94–103.
Levine, H.A., 2005. Project Portfolio Management: A Practical Guide toSelecting Projects, Managing Portfolios, and Maximizing Benefits, First ed.Jossey-Bass, San Francisco.
McLeod, L., Doolin, B., MacDonell, S.G., 2012. A perspective-basedunderstanding of project success. Proj. Manag. J. 43 (5), 68–86.
Melton, T., Iles-Smith, P., Yates, J., 2008. Project Benefits Management:Linking Your Project to the Business, First ed. Butterworth-Heinemann,London.
Müller, R., Spang, K., Özcan, S., 2008. Cultural Differences in Decision-making Among Project Teams: Examples From Swedish and GermanProject Teams. Warsaw, Project Management Institute.
Müller, R., Turner, J.R., 2004. Cultural Differences in Project Owner–ManagerCommunication. Project Management Institute, London.
OGC, 2007. Managing Successful Programmes, Third ed. TSO (The StationeryOffice), London.
Pallant, J., 2010. SPSS Survival Manual: A Step By Step Guide to Data AnalysisUsing the SPSS program, Fourth ed. Open University Press, Maidenhead.
Patanakul, P., Shenhar, A.J., 2012. What project strategy really is: the fundamentalbuilding block in strategic project management. Proj. Manag. J. 43 (1), 4–20.
Peterson, R.A., 2000. Constructing Effective Questionnaires, First ed. SagePublications, Thousand Oaks.
Please cite this article as: C.E.M. Serra, M. Kunc, 2014. Benefits Realisation Manstrategies, Int. J. Proj. Manag. http://dx.doi.org/10.1016/j.ijproman.2014.03.011
Pinto, J.K., Mantel, S.J., 1990. The causes of project failure. IEEE Trans. Eng.Manag. 37 (4), 269–276.
Prabhakar, G.P., 2008. What is project success: a literature review. Int. J. Bus.Manag. 3 (9), 3–10 (September).
Price Waterhouse Coopers, 2007. Insights and Trends: Current Programme andProject Management Practices, 1st ed. Price Waterhouse Coopers, London.
Project Management Institute, 2013. About Us. ([Online] Available at: http://www.pmi.org/About-Us.aspx [Accessed 17 01 2013]).
Ritson, G., Johansen, E., Osborne, A., 2012. Successful programs wanted:exploring the impact of alignment. Proj. Manag. J. 43 (1), 21–36.
Scott-Young, C., Samson, D., 2008. Project success and project teammanagement: evidence from capital projects in the process industries. J.Oper. Manag. 26, 749–766.
Serrador, P., 2013. The impact of planning on project success: a literaturereview. J. Mod. Proj. Manag. 1 (2), 28–39.
Shenhar, J.A., Patanakul, P., 2012. What project strategy really is: thefundamental building block in strategic project management. Proj. Manag.J. 43 (1), 4–20 (February).
Tabachnick, B.G., Fidell, L.S., 2007. Using Multivariate Statistics, Fifth ed.Pearson/Allyn & Bacon, Boston.
Teddlie, C., Tashakkori, A., 2009. Foundations of Mixed Methods Research:Integrating Quantitative and Qualitative Approaches in the Social andBehavioral Sciences. SAGE, Los Angeles.
The Economist, 2009. Closing the Gap — The Link Between ProjectManagement excellence and long-term success. The Economist IntelligenceUnit, London.
Thiry, M., 2002. Combining value and project management into an effectiveprogramme management model. Int. J. Proj. Manag. 20, 221–227.
Thorp, J., 2007. The Information Paradox, Revised ed. Fujitsu Consulting Inc.,Toronto.
Turner, J.R., 2009. The Handbook of Project-Based Management — LeadingStrategic Change in Organizations, Third ed. The McGraw-Hill, London.
Turner, J.R., Müller, R., 2003. On the nature of the project as a temporaryorganization. Int. J. Proj. Manag. 21, 1–8.
Ward, J., Daniel, E., 2006. Benefits Management — Delivering Value From IS& IT Investments, 1st ed. John Wiley and Sons, Chichester.
Yu, A.G., Flett, P.D., Bowers, J.A., 2005. Developing a value-centeredproposal for assessing project success. Int. J. Proj. Manag. 23, 428–436.
Zwikael, O., Shimizu, K., Globerson, S., 2005. Cultural differences in projectmanagement capabilities: a field study. Int. J. Proj. Manag. 23, 454–462.
Zwikael, O., Smyrk, J., 2011. Project Management for the Creation ofOrganisational Value, First ed. Springer-Verlag London Limited, London.
Zwikael, O., Smyrk, J., 2012. A general framework for gauging the performance ofinitiatives to enhance organizational value. Br. J. Manag. 23, S6–S22.
agement and its influence on project success and on the execution of business