bank of kigali investor presentation full year 2014 of... · bank of kigali investor presentation...
TRANSCRIPT

Bank of Kigali Investor Presentation Page 1
Bank of Kigali Investor Presentation
Full Year 2014

Bank of Kigali Investor Presentation Page 2
Disclaimer This presentation contains statements that constitute “forward-looking statements”, including, but not limited to, statements relating to the implementation of strategic initiatives and other statements relating to our business development and financial performance. While these forward-looking statements represent our judgments and future expectations concerning the development of our business, a number of risks, uncertainties and other factors could cause actual developments and results to differ materially from our expectations. These factors include, but are not limited to, (1) general market, macroeconomic, government policies, legislative and regulatory trends, (2) movements in local and international currency exchange rates, interest rates and securities markets, (3) competitive pressures, (4) technological developments, (5) changes in the financial position or credit worthiness of our customers, obligors and counterparties and developments in the markets in which they operate, (6) management changes and changes to the Bank’s structure and (7) other key factors that we have indicated could adversely affect our business and financial performance, which are contained elsewhere in this presentation and in our past and future filings and reports, including those filed with the National Bank of Rwanda and the Rwanda Stock Exchange. We are under no obligation (and expressly disclaim any such obligations to) update or alter our forward-looking statements whether as a result of new information, future events, or otherwise.

Bank of Kigali Investor Presentation Page 3
Key Executives
J a m e s G a t e r a C h i e f E x e c u t i v e O f f i c e r E m a i l : j g a t e r a @ b k . r w T e l : + 2 5 0 2 5 2 5 9 3 1 2 1
L a w s o n N a i b o C h i e f O p e r a t i n g O f f i c e r E m a i l : l n a i b o @ b k . r w M o b i l e : + 2 5 0 7 8 8 3 0 2 0 7 6
L a d o G u r g e n i d z e C h a i r m a n o f t h e B o a r d E m a i l : l g u r g e n i d z e @ b k . r w M o b i l e : + 9 9 5 5 9 9 4 7 7 2 7 2 S k y p e : l a d o . g u r g e n i d z e . 2 0 0 8
N a t h a l i e M p a k a A g . C h i e f F i n a n c e O f f i c e r E m a i l : n m p a k a @ b k . r w M o b i l e : + 2 5 0 7 8 8 3 8 0 8 0 4

Bank of Kigali Investor Presentation Page 4
Agenda
1. Key Investment Highlights
2. Country Overview Information
3. Banking Sector Overview
4. Bank Overview
5. Corporate Governance
6. Business Overview
7. Review of Financial Performance in YE 2014 & 2013
8. Strategic Outlook
9. Contact Information
Bank of Kigali Investor Presentation Page 5
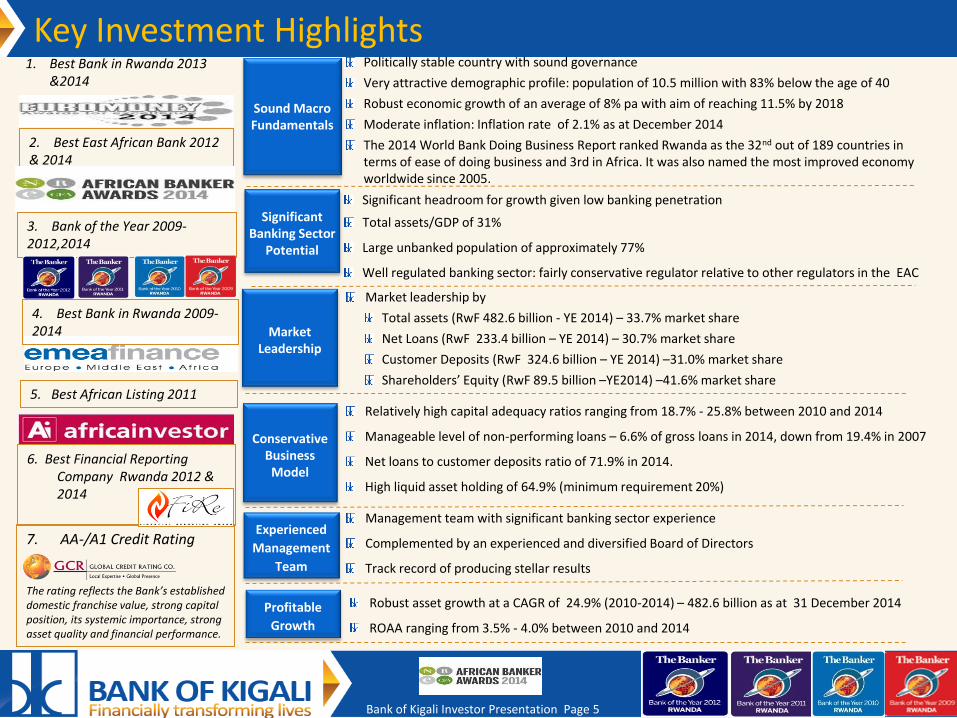
Sound Macro Fundamentals
Politically stable country with sound governance
Very attractive demographic profile: population of 10.5 million with 83% below the age of 40
Robust economic growth of an average of 8% pa with aim of reaching 11.5% by 2018
Moderate inflation: Inflation rate of 2.1% as at December 2014
The 2014 World Bank Doing Business Report ranked Rwanda as the 32nd out of 189 countries in terms of ease of doing business and 3rd in Africa. It was also named the most improved economy worldwide since 2005.
Significant headroom for growth given low banking penetration
Total assets/GDP of 31%
Large unbanked population of approximately 77%
Well regulated banking sector: fairly conservative regulator relative to other regulators in the EAC
Market leadership by
Total assets (RwF 482.6 billion - YE 2014) – 33.7% market share
Net Loans (RwF 233.4 billion – YE 2014) – 30.7% market share
Customer Deposits (RwF 324.6 billion – YE 2014) –31.0% market share
Shareholders’ Equity (RwF 89.5 billion –YE2014) –41.6% market share
Relatively high capital adequacy ratios ranging from 18.7% - 25.8% between 2010 and 2014
Manageable level of non-performing loans – 6.6% of gross loans in 2014, down from 19.4% in 2007
Net loans to customer deposits ratio of 71.9% in 2014.
High liquid asset holding of 64.9% (minimum requirement 20%)
Significant Banking Sector
Potential
Market Leadership
Conservative Business Model
Experienced
Management
Team
Management team with significant banking sector experience
Complemented by an experienced and diversified Board of Directors
Track record of producing stellar results
Profitable
Growth
Robust asset growth at a CAGR of 24.9% (2010-2014) – 482.6 billion as at 31 December 2014
ROAA ranging from 3.5% - 4.0% between 2010 and 2014
Key Investment Highlights
3. Bank of the Year 2009-2012,2014
4. Best Bank in Rwanda 2009-2014
7. AA-/A1 Credit Rating
The rating reflects the Bank’s established domestic franchise value, strong capital position, its systemic importance, strong asset quality and financial performance.
2. Best East African Bank 2012 & 2014
5. Best African Listing 2011
6. Best Financial Reporting Company Rwanda 2012 & 2014
1. Best Bank in Rwanda 2013 &2014

Bank of Kigali Investor Presentation Page 6
COUNTRY OVERVIEW INFORMATION

Bank of Kigali Investor Presentation Page 7
7
Rwanda – Country Profile
Real GDP Growth Rate 2013 4.6%
Real GDP Growth Rate 2014E 6%
Inflation Rate (Dec 2014) 2.1%
Private Sector Credit Growth(2014) 19.6%
Current-account deficit as a % of GDP-2014E 9.5%
External Debt to GDP 29%
Currency Depreciation against USD (Dec 2014) 3.6%
FDI as % of GDP 2.2%
Official Reserves 4.6 months’ imports
Ranked second only to Mauritius as the best destination to do business in
Africa in the World Bank 2014 Doing Business Report.
Since 2005, Rwanda has implemented over 22 business regulation
reforms in the areas measured by the World Bank Doing Business Index.
Today, entrepreneurs can register a new business online in 6 hours
Ranked first in Africa in the 2014 World Bank Country Policy and
Institutional Assessment (CPIA) report. The report shows that Rwanda’s
economic management and structural policies as the most improved in
sub-Saharan Africa. Rwanda was also named the most competitive
economy in East Africa and third in Africa by Global Competitiveness
Index Report 2014
Source: IMF, CIA World Factbook, World Bank, Ministry of Finance and Economic Planning, National Institute of
Statistics of Rwanda and National Bank of Rwanda,
Business Environment
Macro Economic Indicators
National Facts
Area 26,338 sq km
Population 10.5 million
Official Languages Kinyarwanda, French, English
Capital Kigali
Currency Rwandan Franc (RwF)
Credit Rating ‘B +‘ (Fitch Ratings) B/Stable (Standard & Poors)
Nominal GDP (2014E ) US$ 7.6 billion
Nominal GDP Per Capita (2013 ) US$ 693

Bank of Kigali Investor Presentation Page 8
GDP per Capita continues to grow
Healthy GDP growth with moderating inflation
Population Pyramid for Rwanda
Sound Macro Fundamentals
Source: National Institute of Statistics of Rwanda Source: Ministry of Finance and Economic Planning, World Bank
54% of the population is under 19 years.
83% of the population is under 40 years.
3% of the population over 65 years.
Bank of Kigali Investor Presentation Page 9
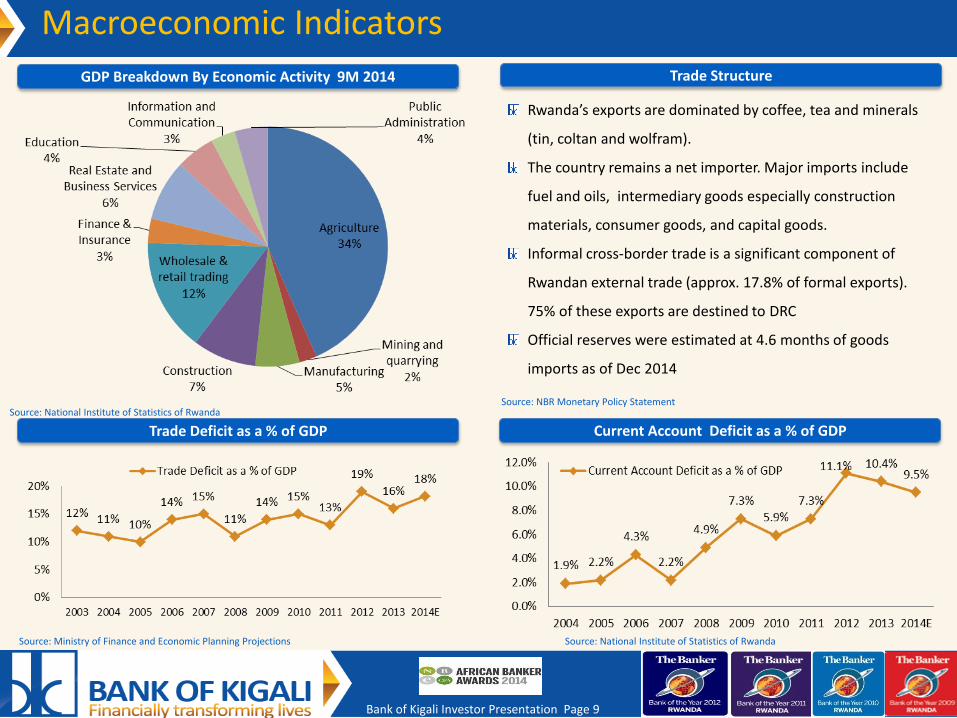
GDP Breakdown By Economic Activity 9M 2014
Current Account Deficit as a % of GDP Trade Deficit as a % of GDP
Macroeconomic Indicators
Source: NBR Monetary Policy Statement
Source: Ministry of Finance and Economic Planning Projections
Rwanda’s exports are dominated by coffee, tea and minerals
(tin, coltan and wolfram).
The country remains a net importer. Major imports include
fuel and oils, intermediary goods especially construction
materials, consumer goods, and capital goods.
Informal cross-border trade is a significant component of
Rwandan external trade (approx. 17.8% of formal exports).
75% of these exports are destined to DRC
Official reserves were estimated at 4.6 months of goods
imports as of Dec 2014
Source: National Institute of Statistics of Rwanda
Source: National Institute of Statistics of Rwanda
Trade Structure
Bank of Kigali Investor Presentation Page 10
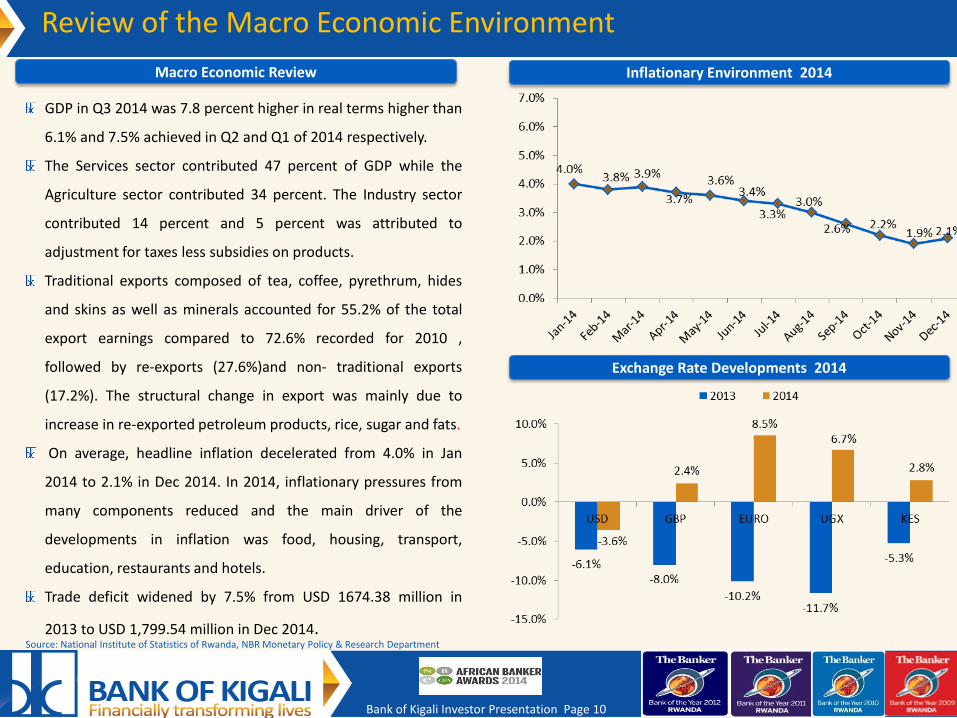
Macro Economic Review
Review of the Macro Economic Environment
GDP in Q3 2014 was 7.8 percent higher in real terms higher than
6.1% and 7.5% achieved in Q2 and Q1 of 2014 respectively.
The Services sector contributed 47 percent of GDP while the
Agriculture sector contributed 34 percent. The Industry sector
contributed 14 percent and 5 percent was attributed to
adjustment for taxes less subsidies on products.
Traditional exports composed of tea, coffee, pyrethrum, hides
and skins as well as minerals accounted for 55.2% of the total
export earnings compared to 72.6% recorded for 2010 ,
followed by re-exports (27.6%)and non- traditional exports
(17.2%). The structural change in export was mainly due to
increase in re-exported petroleum products, rice, sugar and fats.
On average, headline inflation decelerated from 4.0% in Jan
2014 to 2.1% in Dec 2014. In 2014, inflationary pressures from
many components reduced and the main driver of the
developments in inflation was food, housing, transport,
education, restaurants and hotels.
Trade deficit widened by 7.5% from USD 1674.38 million in
2013 to USD 1,799.54 million in Dec 2014.
Inflationary Environment 2014
Exchange Rate Developments 2014
Source: National Institute of Statistics of Rwanda, NBR Monetary Policy & Research Department

Bank of Kigali Investor Presentation Page 11
BANKING SECTOR OVERVIEW

Bank of Kigali Investor Presentation Page 12
2013 Banking Assets/GDP Large Unbanked Population
Economy is moving away from being cash based through the
various financial inclusion initiatives being undertaken by financial
institutions including the launch of agency banking and mobile
money transfer services
Approximately 72% of the population have or use financial
products or mechanisms including those offered by non- bank
formal financial institutions such as SACCOs
(1) Source: EY Eastern Africa 2013 Banking Sector Review & World Bank data (2) Source: EY Eastern Africa 2013 Banking Sector Review & World Bank data (3) Source: African Alliance YE 2013 Uganda Banking Sector Analysis & World Bank data (4) Source: National Bank of Rwanda YE 2013 Monetary Policy Statement (5) Source: Population stats by World Bank
2013 Banking Assets Per Capita5
Significant Banking Sector Potential
(US$)
Source: Finscope Rwanda 2012
Prudential Regulations
31%
31%
36%
71%
Rwanda
Uganda
Tanzania
Kenya
214
178
244
705
Rwanda
Uganda
Tanzania
Kenya

Bank of Kigali Investor Presentation Page 13
Banking Sector Overview
Rwanda Banking System Total Assets
Banking Sector Review Recent Regulatory Reforms To Improve Access To Credit
Enactment of Law on Mortgages, requiring the registration of mortgages
and enabling lenders to foreclose on defaulters
Establishment of Commercial Courts dealing solely with commercial
disputes
Reorganization of the Land Centre which has computerised records and
operations in addition to timely issuance of property titles
Reorganization of the Office of the Registrar General to enhance and fast
track registration of mortgages and foreclosures
Establishment of Credit Reference Bureau to enhance information sharing
among banks and other financial institutions in order to assist with credit
risk assessment
Interest Rate Analysis
As at end of YE 2014 , total CAR stood at 24.2% (YE 2013: 23.1%) well
above the regulatory minimum of 15%. The sector’s liquidity position
stood at 51.7% (YE 2013: 49.5%).
The industry balance sheet measured by total assets grew by 19.3% from
RwF 1,510.7 billion in December 2013 to RwF 1,800 billion at the end of
2014.
The quality of assets improved significantly as the Non-performing loans
(NPLs) to total gross loans reduced to 6.0% as at YE 2014 (YE 2013: 7.0%).
Source: NBR Monetary Policy Statement for the year ended 31 December 2014
Source: NBR Monetary Policy Statement for year ended 31 December 2014

Bank of Kigali Investor Presentation Page 14
Timeline of Foreign Investment In The Rwandan Banking Sector
2004 2007 2008 2009 2010 2011 2012 2014
30% stake in BPR
80% stake in BCR
40% stake in Cogebanque I &M Bank acquires 80% stake in BCR
70% stake in
FINA Bank
* Market share among commercial banks – BK Analysis
2008 2009 2010 2011 2012 2013 2014
Bank of Kigali Market Share by Total Assets* 23.4% 26.4% 27.4% 32.3% 32.0% 35.8% 33.7%

Bank of Kigali Investor Presentation Page 15
Banking Sector Overview Cont’d
Case study: Rwanda– six out of nine banks in Rwanda are owned by regional and Pan African banks and have lost market share to locally-run banks
Market Share By Total Assets in 2008
Page 15
Source: National Bank of Rwanda, 9M 2014 Commercial Banks published Financial Statements
Market Share By Total Assets in 2013
BANK OF KIGALI
Top three “local” banks, 51.7%
Five foreign-controlled banks, 48.3%
Market Share By Total Assets as at 9M 2014
BANK OF KIGALI
BPR
Top three “local” banks, 55%
Six foreign-controlled banks, 45%
BPR
BANK OF KIGALI
BPR
Top three “local” banks, 58.4%
Six foreign-controlled banks, 41.6%

Bank of Kigali Investor Presentation Page 16
Competitive Landscape
Market Share Dynamics
Concentration of Banking Sector Assets Selected Indicators 2014
Source: NBR Supervision Department, BK Company Filings and published financials statements of Banks
Bank of Kigali Growth vs. Commercial Banks’ Growth, CAGR YE 2010 – YE 2014
Source: 9M 2014 Published Financial Statements Source: NBR Monetary Policy Statement , BK YE 2014 Published Financial Statements
YE 2013
Top 5 Banks, 78.5%
Others, 21.5%
Top 5 Banks, 75.7%
Others, 24.3%
9M 2014
Bank of Kigali Investor Presentation Page 17
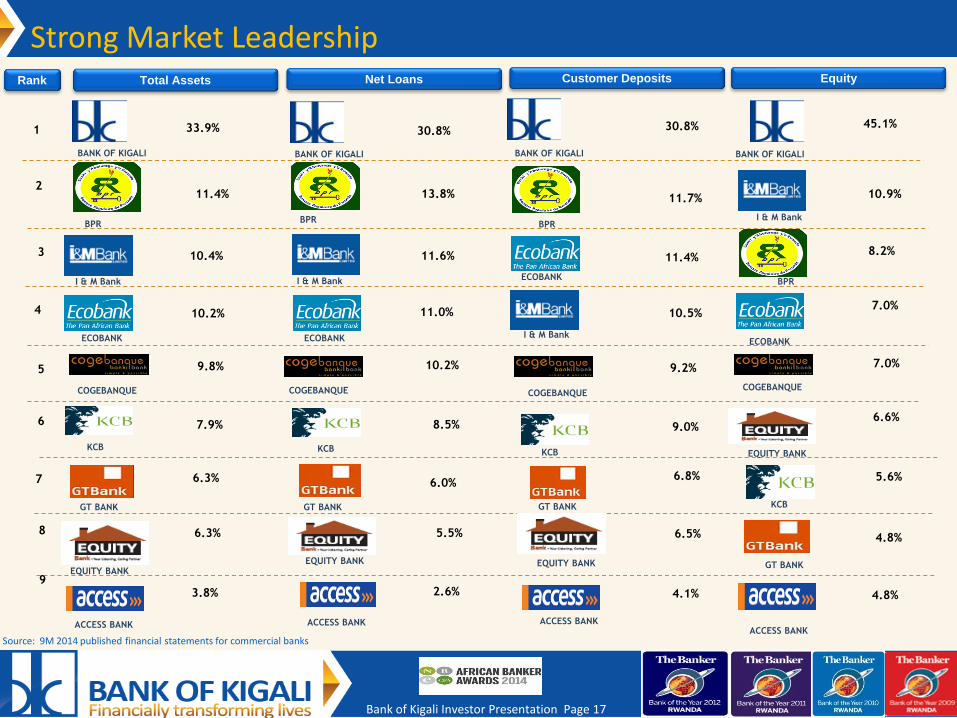
Strong Market Leadership
Source: 9M 2014 published financial statements for commercial banks
Rank Total Assets Net Loans Customer Deposits Equity
33.9%
BANK OF KIGALI
BPR
11.4%
ECOBANK
10.4%
I & M Bank
10.2%
COGEBANQUE
9.8%
GT BANK
6.3%
KCB
7.9%
ACCESS BANK
6.3%
1
2
3
4
5
6
7
8
30.8%
BANK OF KIGALI
30.8%
BANK OF KIGALI
45.1%
BANK OF KIGALI
BPR
13.8%
BPR
11.7%
BPR
10.9%
8.2%
ECOBANK
11.6%
I & M Bank
11.0%
COGEBANQUE
10.2%
ACCESS BANK
5.5%
GT BANK
8.5%
ACCESS BANK
6.5%
COGEBANQUE
9.2%
9.0%
KCB
6.8%
COGEBANQUE
6.6%
GT BANK
5.6%
KCB
7.0%
ACCESS BANK
4.8%
KCB
6.0%
9
EQUITY BANK EQUITY BANK
EQUITY BANK
EQUITY BANK
4.8% 3.8% 2.6% 4.1%
ECOBANK
11.4%
I & M Bank
10.5%
ECOBANK
7.0%
I & M Bank
GT BANK

Bank of Kigali Investor Presentation Page 18
BANK OVERVIEW

Bank of Kigali Investor Presentation Page 19
Background and History
A+ credit rating by GCR (Global Credit
Rating)
Government of Rwanda acquired 50% stake from
Belgolaise becoming 100% shareholder
2006
Established in 1966 as a JV with
Belgolaise S.A
1966
Current management
team assembled
New strategy focusing on the
universal banking business model and
profitable growth adopted
2009
Supervisory Board enhanced &
internationalized
AFD loan signed: ‒ US$ 20 mln ‒ 10 years
AfDB loan signed:
-US$12 mln -10 years
US$62.5 mln Initial Public
Offering of 45% of its shares and listing on the RSE
2010 2011 2013
Signed lines of credit with: • PTA Bank- US$ 10 mln • OFID- US$ 10 mln • EADB- US $10 mln

Bank of Kigali Investor Presentation Page 20
Key Facts
A Snapshot of Bank of Kigali
The leading bank in Rwanda (33.7% market share by total assets as at 31st
December 2014), offering a wide spectrum of commercial banking services
to corporate, SME and retail customers
As at 31st December 2014 the Bank had:
Over 24,000 corporate clients
Over 266,000 retail clients
70 branches
76 ATMs
1,019 employees
Western Union, Money Gram and Express Money services for International
Transfers
20
Branch Network Evolution
Source: Bank of Kigali Audited Financials 2008-2014 ,NBR Supervision Department data
Growth in ATMs, POS Terminals and # of Retail Current accounts

Bank of Kigali Investor Presentation Page 21
CORPORATE GOVERNANCE

Bank of Kigali Investor Presentation Page 22
Sharehold ing Structure & Corporate Governance
The Board has eight independent non-executive directors
(including two non-resident directors with extensive expertise in
international banking practices)
The Board of Directors is appointed by the shareholders and
approved by the Central Bank and meets on a quarterly basis or
more frequently as the business demands
The Board sets the strategy and retains full responsibility for the
direction and control of the Bank as spelled out in the
Memorandum and Articles of Association, the Board Charter and
the BNR Corporate Governance guidelines
The Board sub-committees have clear TORs which underscore the
scope and context of their mandate and performance as approved
by the Board & the BNR Corporate Governance regulation
The Board receives detailed financial information and regular
presentations from the management on the Bank’s business
performance; this enables the Directors to make informed
decisions on governance, strategic, financials and operational
issues.
Shareholding Structure as at 31st December 2014 Corporate Governance
Free float- 45%
Employees and Directors
2% International Institutional
Investors 16.4%
Local Institutional
Investors 8.4%
Other State Owned Entities
0.1%
Regional Institutional
Investors 6.2%
Retail Investors
12.2%
Rwanda Social Security Board
25.1%
Government of Rwanda
29.6%

Bank of Kigali Investor Presentation Page 23
Share Trading Performance
Share Price Performance since start of trading
31 December 2014 Current price, RwF 300 Market Cap, US$ mln 290 Free float 45% Free float in US$ mln 131.7 Average daily traded volume in US$ mln 0.13 Common shares outstanding, mln shares 671.9 12-month high 365 12-month low 170 P/E 2014 (based on current price) 11.66x P/BV 2014 (based on current price) 2.45x
Dividend yield, 2013 4.6% Dividend yield, 2014 (based on price of RwF 300) 5.4% Ticker Code BOK Bloomberg BOK. RW
Rwf/USD Exchange Rate of 694.374 as at 31st December 2014(BNR)
*Capital gains on RSE transactions are exempted from Capital Gains Tax
Recommendation: BUY Target Price: Rwf 390 Last coverage report: March 2014
Analyst Coverage
Recommendation: HOLD Target Price: Rwf 285 Last coverage report: 1 September 2014
100130160190220250280310340370400
3-J
an-1
31
3-J
an-1
32
3-J
an-1
32
-Fe
b-1
31
2-F
eb
-13
22
-Fe
b-1
34
-Mar
-13
14
-Mar
-13
24
-Mar
-13
3-A
pr-
13
13
-Ap
r-1
32
3-A
pr-
13
3-M
ay-1
31
3-M
ay-1
32
3-M
ay-1
32
-Ju
n-1
31
2-J
un
-13
22
-Ju
n-1
32
-Ju
l-1
31
2-J
ul-
13
22
-Ju
l-1
31
-Au
g-1
31
1-A
ug-
13
21
-Au
g-1
33
1-A
ug-
13
10
-Se
p-1
32
0-S
ep
-13
30
-Se
p-1
31
0-O
ct-1
32
0-O
ct-1
33
0-O
ct-1
39
-No
v-1
31
9-N
ov-
13
29
-No
v-1
39
-Dec
-13
19
-Dec
-13
29
-Dec
-13
8-J
an-1
41
8-J
an-1
42
8-J
an-1
47
-Fe
b-1
41
7-F
eb
-14
27
-Fe
b-1
49
-Mar
-14
19
-Mar
-14
29
-Mar
-14
8-A
pr-
14
18
-Ap
r-1
42
8-A
pr-
14
8-M
ay-1
41
8-M
ay-1
42
8-M
ay-1
47
-Ju
n-1
41
7-J
un
-14
27
-Ju
n-1
47
-Ju
l-1
41
7-J
ul-
14
27
-Ju
l-1
46
-Au
g-1
41
6-A
ug-
14
26
-Au
g-1
45
-Se
p-1
41
5-S
ep
-14
25
-Se
p-1
45
-Oct
-14
15
-Oct
-14
25
-Oct
-14
4-N
ov-
14
14
-No
v-1
42
4-N
ov-
14
4-D
ec-1
41
4-D
ec-1
42
4-D
ec-1
4
Price Closing Price Rwf Volume Weighted Average Price Rwf Initial Price Rwf

Bank of Kigali Investor Presentation Page 24
C u sto d i a l S e r v i c e C h a i n
Standard Chartered Mauritius
State Street Bank
Pictet CIE (Africa)
Chase Manhattan Bank Mutual
Northern Trust Company
HSBC Bank PLC Client Safe Custody
RBC Investor Services Trust
Standard Chartered Ghana, Uganda &
Zambia
Cacies Bank Luxembourg & France
Citigroup Global Markets LTD
CITI Custody Bank
Fidelity Central Invest Port LLC
FirstRand Bank Limited
RMB Multimanager
BNP Paribus
Brown Brothers Harriman
Citibank
Credit Suisse
Deutsche Bank
JP Morgan Chase
Morgan Stanley
UBS
Northern Trust
CFC Stanbic
Altree Financial Services
Kenya Commercial
Bank Rwanda

Bank of Kigali Investor Presentation Page 25
BUSINESS OVERVIEW

Bank of Kigali Investor Presentation Page 26
Gross Loan Portfolio Loan Book Segmentation
Overview of the Loan Book
Corporate Loan Book YE 2014
YE 2013
68.5%
31.5%
Corporate Loans Retail Loans
Over 1 Billion, 37.8%
500M-1 Billion, 12.6%
100M-500 Million, 26.7%
50M-100Million, 7.1%
0-50 million, 15.8%
*TWC- Transport, Warehousing and Communication
Top 10 Corporate
Loan, 27.6%
Other Corporate
Loan, 72.4%
75.9%
24.1%
YE 2014

Bank of Kigali Investor Presentation Page 27
Total Deposits Growth
Structure of Deposits, YE 2014 Customer Deposits Concentration
Customer Deposit Base
* depositors with total balances above 5% of shareholders’ equity
Customer Deposit Segmentation
YE 2013
YE 2013 YE 2014
73.4%
26.6%
Corporate Deposits Retail Deposits
29.2%
70.8%
Corporate: RwF 185.9Bn Retail: RwF 73.4Bn
71.1%
28.9%
YE 2014
35.4%
64.6%
Large Depositors Other
86.1%
1.3%
12.6%
CB Demand DepositsCB Collateral DepositsCB Term Deposits
11.0% 5.2%
83.8%
Term Deposits
Savings Deposits
Demand Deposits
Bank of Kigali Investor Presentation Page 28
Description Key Segments as at YE 2014
Number of Corporate Accounts
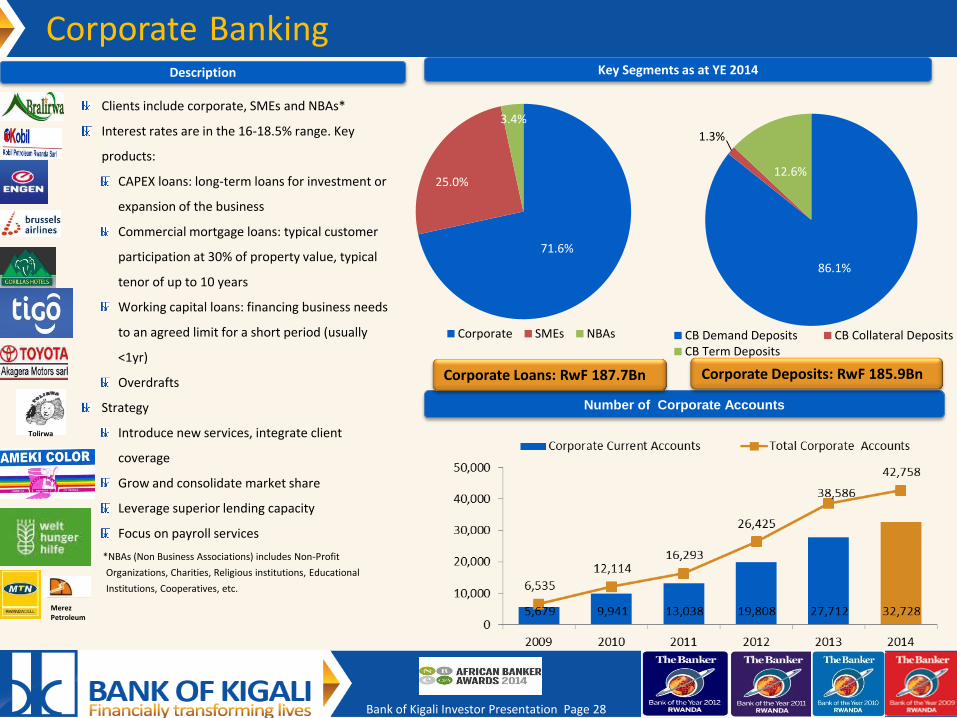
Clients include corporate, SMEs and NBAs*
Interest rates are in the 16-18.5% range. Key
products:
CAPEX loans: long-term loans for investment or
expansion of the business
Commercial mortgage loans: typical customer
participation at 30% of property value, typical
tenor of up to 10 years
Working capital loans: financing business needs
to an agreed limit for a short period (usually
<1yr)
Overdrafts
Strategy
Introduce new services, integrate client
coverage
Grow and consolidate market share
Leverage superior lending capacity
Focus on payroll services
*NBAs (Non Business Associations) includes Non-Profit
Organizations, Charities, Religious institutions, Educational
Institutions, Cooperatives, etc.
Corporate Banking
Merez Petroleum
Tolirwa
Corporate Loans: RwF 187.7Bn Corporate Deposits: RwF 185.9Bn
71.6%
25.0%
3.4%
Corporate SMEs NBAs
86.1%
1.3%
12.6%
CB Demand Deposits CB Collateral DepositsCB Term Deposits

Bank of Kigali Investor Presentation Page 29
Executing The Retail Strategy
Bank of Kigali Investor Presentation Page 30
Description Retail Lending
Number of Retail Accounts
Retail Banking
Source: Bank of Kigali
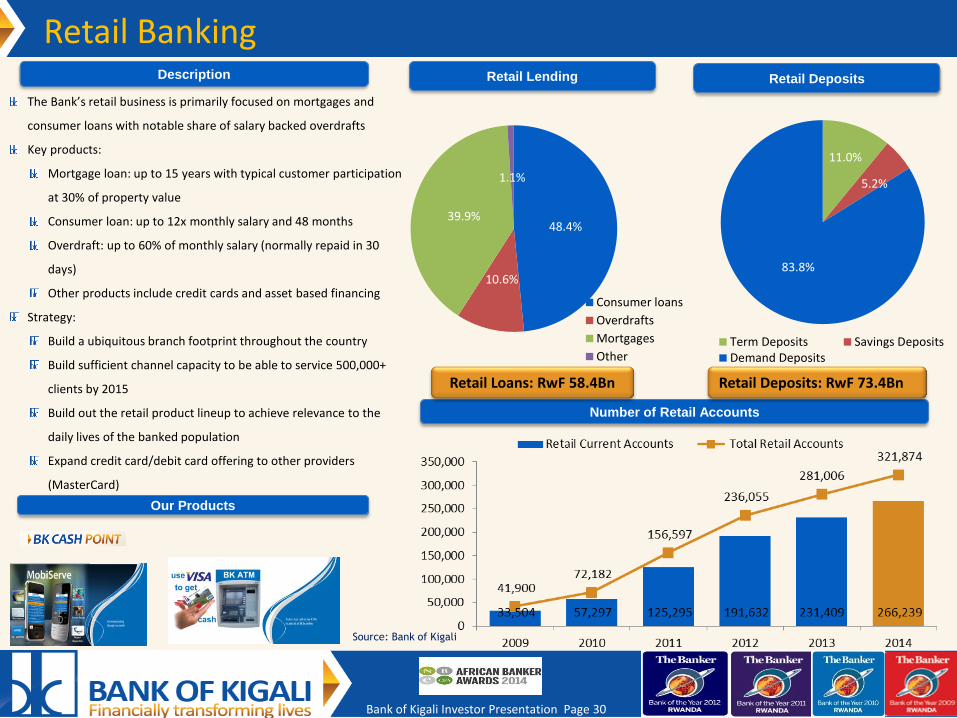
The Bank’s retail business is primarily focused on mortgages and
consumer loans with notable share of salary backed overdrafts
Key products:
Mortgage loan: up to 15 years with typical customer participation
at 30% of property value
Consumer loan: up to 12x monthly salary and 48 months
Overdraft: up to 60% of monthly salary (normally repaid in 30
days)
Other products include credit cards and asset based financing
Strategy:
Build a ubiquitous branch footprint throughout the country
Build sufficient channel capacity to be able to service 500,000+
clients by 2015
Build out the retail product lineup to achieve relevance to the
daily lives of the banked population
Expand credit card/debit card offering to other providers
(MasterCard)
x etc) Our Products
Retail Deposits
Retail Loans: RwF 58.4Bn Retail Deposits: RwF 73.4Bn
11.0%
5.2%
83.8%
Term Deposits Savings DepositsDemand Deposits
48.4%
10.6%
39.9%
1.1%
Consumer loans
Overdrafts
Mortgages
Other

Bank of Kigali Investor Presentation Page 31
Ubiquitous footprint Agency Banking
Growing Our Distribution Network
Agency Banking platform BK Yacu began
operating in Nov 2012.
Expanded the agency banking network to 861
operational agents as at 31st December 2014
Agents are able to perform cash in and cash out
transactions, open customer accounts as well as
send and receive money.
Introduced 20 BK-owned agent kiosks in high
traffic areas
Other Initiatives
A total of 9 mobile vans have been deployed across the country
Launch Airtel Money across all branches
Branch Expansion

Bank of Kigali Investor Presentation Page 32
Growing our Card Business Increasing our Mobile Product Offering
Expanding Our Self Service Products
Key Achievements
Launch of Visa Classic and Visa Gold Credit
Cards
Over 166,000 Visa Electron debit cards
currently in circulation
Union Pay and Diners Club Card Acquiring
Deposit-taking ATMs
Signing of E-commerce contract with Iveri
2015 Targets
Issuing of MasterCard for the mass market
and HNW clients
Mass roll out of credit cards to the retail
segment -10,000 new credit cards by YE 2015
Master card Issuing and Acquiring
Launch of E-commerce platform
Enhancing our mobile banking service
Our mobile banking service Mobiserve allows customers
to perform the following transactions:
Send money to any mobile phone user
regardless of whether they operate a bank
account or not
Purchasing prepaid TV, airtime and electricity
Check Balances and Bank information
Order cheque books
230,636 Mobiserve users as of 31st December 2014.

Bank of Kigali Investor Presentation Page 33
REVIEW OF F INANCIAL PERFORMANCE IN YE 2014

Bank of Kigali Investor Presentation Page 34
Balance Sheet Highlights Total Assets Customer Deposits
Shareholder’s Equity Net Loans

Bank of Kigali Investor Presentation Page 35
Maturity Profile Loans
Customer Deposits
Bank of Kigali Investor Presentation Page 36
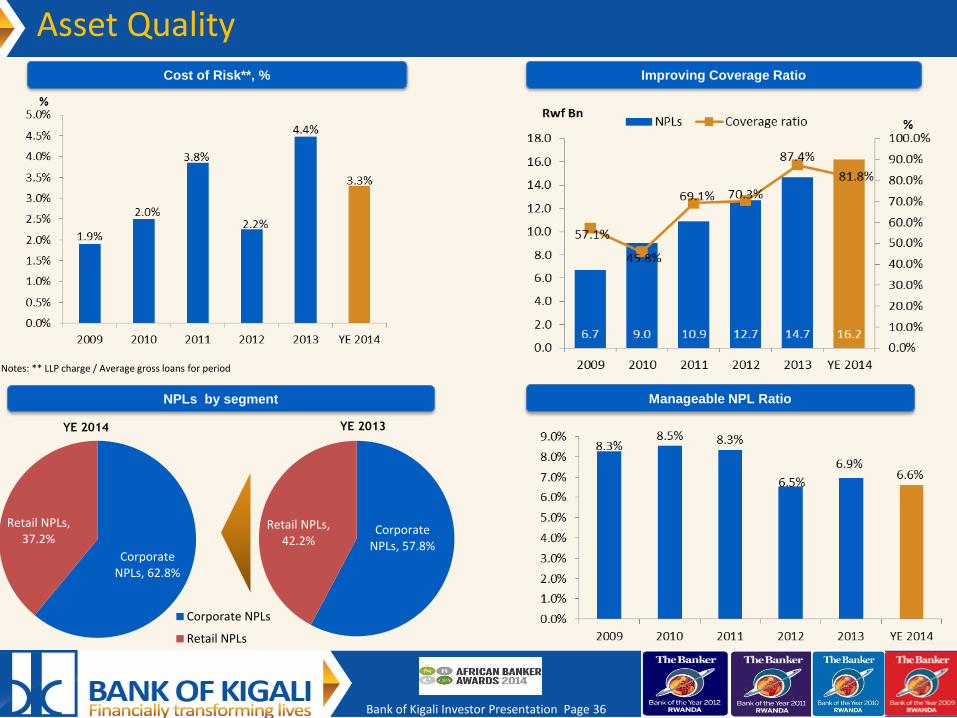
Cost of Risk**, %
Asset Quality
Notes: ** LLP charge / Average gross loans for period
Manageable NPL Ratio
Improving Coverage Ratio
NPLs by segment
YE 2013
Corporate NPLs, 57.8%
Retail NPLs, 42.2%
Corporate NPLs, 62.8%
Retail NPLs, 37.2%
Corporate NPLs
Retail NPLs
YE 2014
Bank of Kigali Investor Presentation Page 37
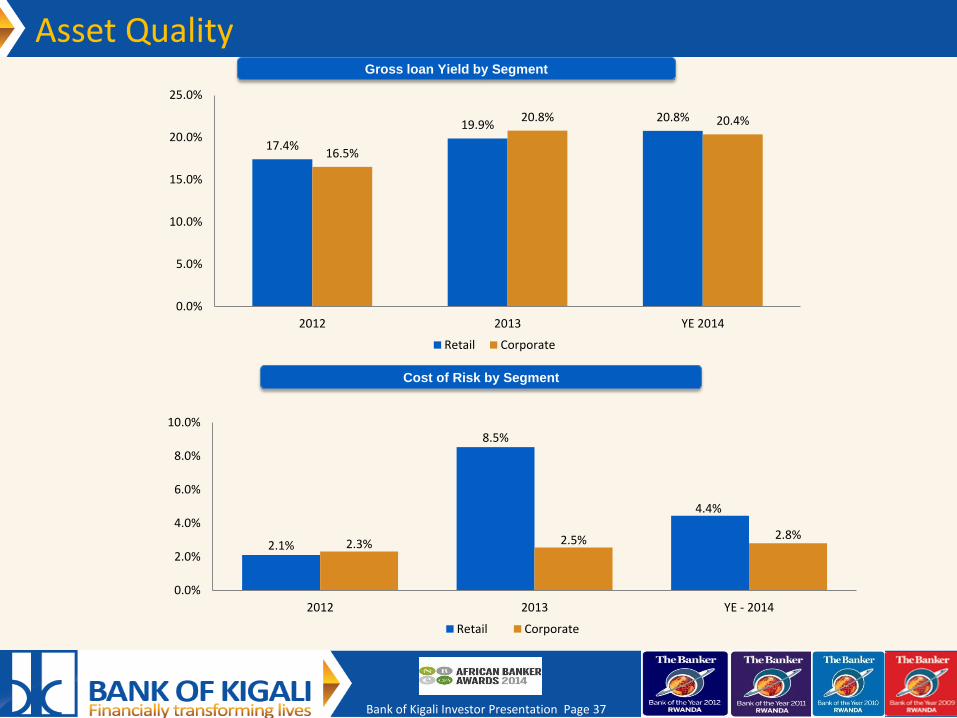
Asset Quality Gross loan Yield by Segment
Cost of Risk by Segment
2.1%
8.5%
4.4%
2.3% 2.5% 2.8%
0.0%
2.0%
4.0%
6.0%
8.0%
10.0%
2012 2013 YE - 2014
Retail Corporate
17.4%
19.9% 20.8%
16.5%
20.8% 20.4%
0.0%
5.0%
10.0%
15.0%
20.0%
25.0%
2012 2013 YE 2014
Retail Corporate

Bank of Kigali Investor Presentation Page 38
Funding Structure, % Significant Potential For Growth In Higher Yielding Assets
Strong Capital And Liquidity Position Highlights
Deposits are the primary source of funding with the share of
customer deposits at 67.2% as at 31st December 2014
Strong growth in deposits has been driven by our branch
expansion as well the introduction of various deposit
mobilizing initiatives such as mobile vans and agency banking
Funding
YE 2013 YE 2014
66.4% 4.1%
16.8%
12.7%
67.2% 3.2%
18.5%
11.1%
Customers Deposits Due to Banks
Shareholders Equity Other

Bank of Kigali Investor Presentation Page 39
YE 2014 Performance Highlights Net Interest Income Net Non-Interest Income Total Operating Income
Total Recurring Operating Costs Profit Before Provisions Net Income
ROAA 4.0%
ROAE 22.9%
Bank of Kigali Investor Presentation Page 40
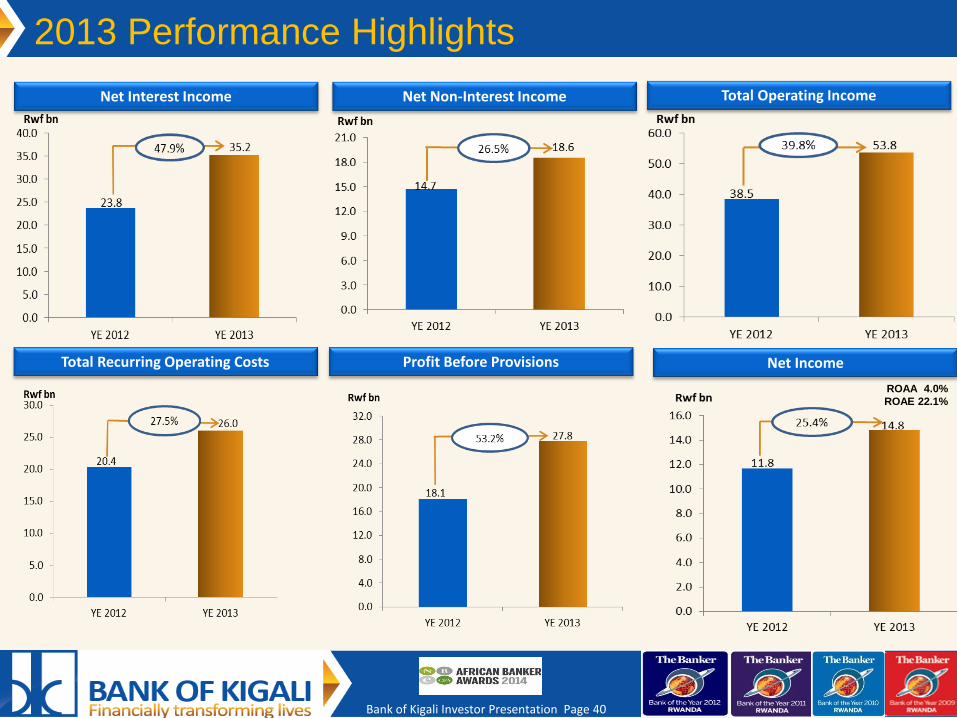
2013 Performance Highlights
Net Interest Income Net Non-Interest Income Total Operating Income
Total Recurring Operating Costs Profit Before Provisions Net Income
ROAA 4.0%
ROAE 22.1%
Bank of Kigali Investor Presentation Page 41
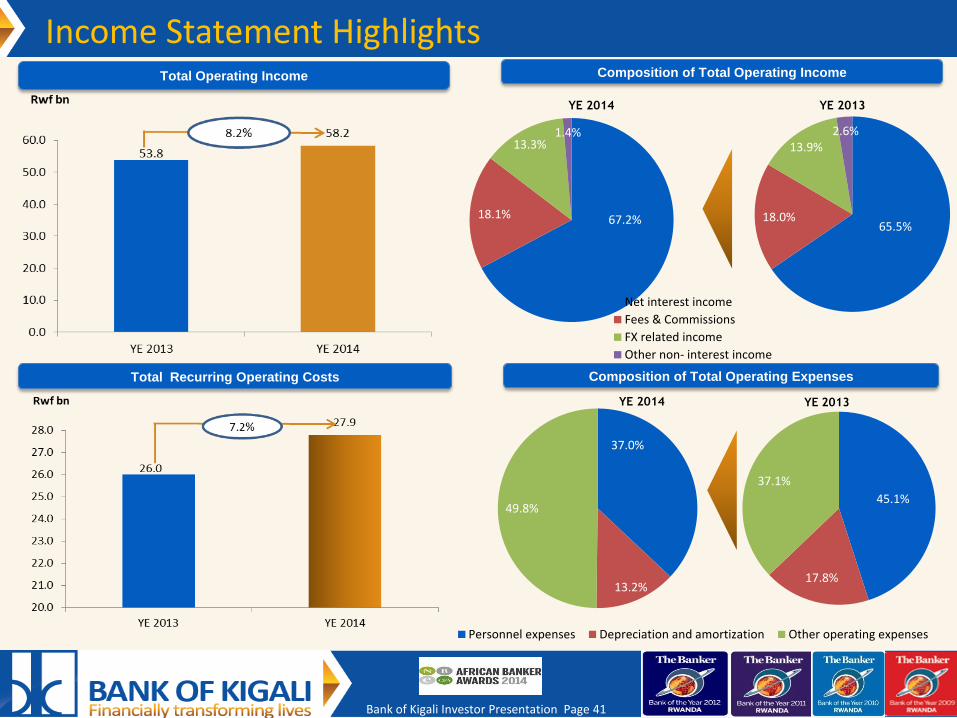
Total Operating Income Composition of Total Operating Income
Total Recurring Operating Costs Composition of Total Operating Expenses
Income Statement Highlights
YE 2013
YE 2013
YE 2014
65.5% 18.0%
13.9% 2.6%
YE 2014
45.1%
17.8%
37.1%
Personnel expenses Depreciation and amortization Other operating expenses
37.0%
13.2%
49.8%
67.2% 18.1%
13.3% 1.4%
Net interest income
Fees & Commissions
FX related income
Other non- interest income
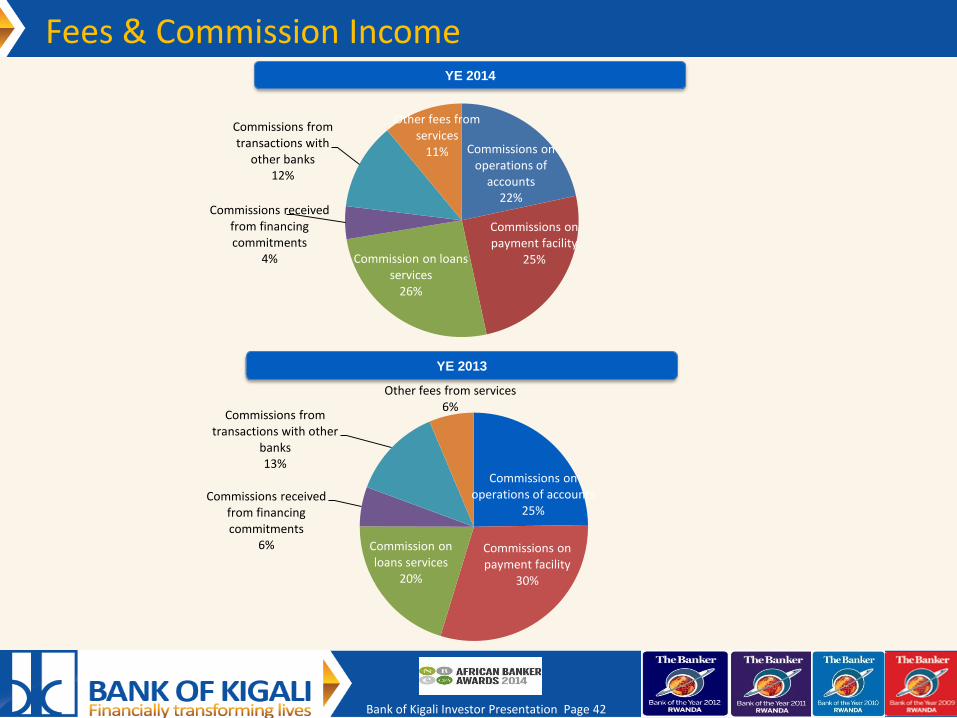
Bank of Kigali Investor Presentation Page 42
YE 2014
Fees & Commission Income
YE 2013
Commissions on operations of accounts
25%
Commissions on payment facility
30%
Commission on loans services
20%
Commissions received from financing commitments
6%
Commissions from transactions with other
banks 13%
Other fees from services 6%
Commissions on operations of
accounts 22%
Commissions on payment facility
25% Commission on loans services
26%
Commissions received from financing commitments
4%
Commissions from transactions with
other banks 12%
Other fees from services
11%
Bank of Kigali Investor Presentation Page 43
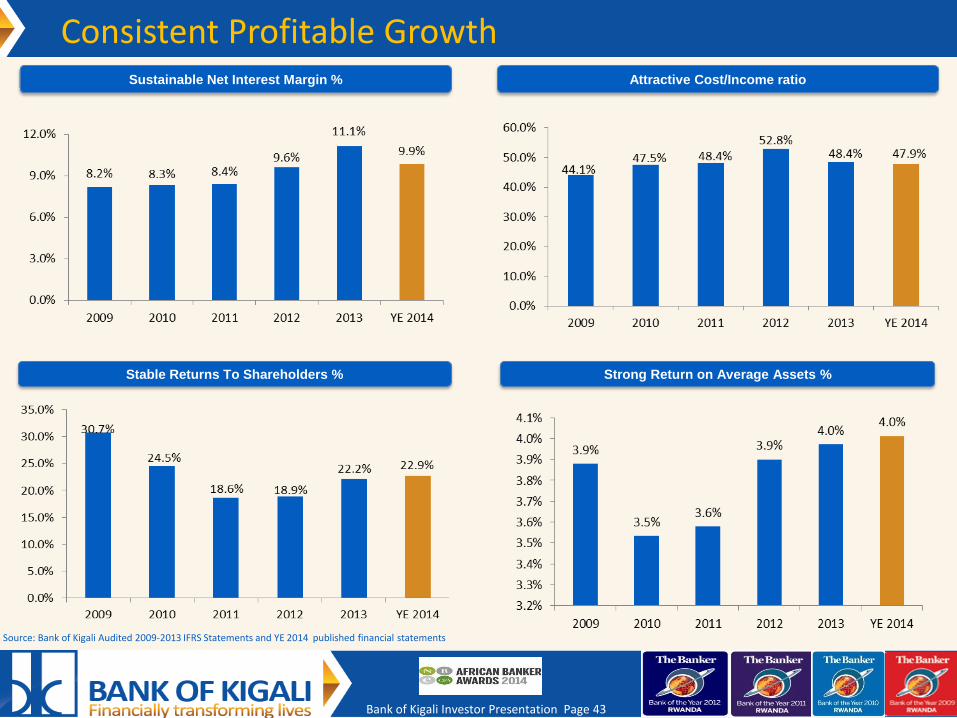
Sustainable Net Interest Margin % Attractive Cost/Income ratio
Stable Returns To Shareholders % Strong Return on Average Assets %
Consistent Profitable Growth
Source: Bank of Kigali Audited 2009-2013 IFRS Statements and YE 2014 published financial statements

Bank of Kigali Investor Presentation Page 44
STRATEGIC OUTLOOK

Bank of Kigali Investor Presentation Page 45
Strategic Outlook Objectives Strategies Action Outcomes
Earnings growth ~22% Return on Average Equity
> 20%
Continuous improvement of risk management policies & procedures
Disciplined capital management, medium term target CAR of 15%-18% and ROAE of 20%+, implying ROAA in the 3.5% range
No profitability sacrifices for the sake of market share gains
Sensible dividend policy as the growth curve flattens out over time
Maintain profitable growth
Customer growth in terms of current
accounts – increase current accounts by
100,000 in 2015
Benefit from first-mover advantage outside the capital city, making it more difficult for the competitors to follow suit Reach out to the unbanked (but bankable) population
Become the bank of choice and convenience for the middle class and youth entering the employment sector Create capacity to service 500,000+ clients
Increase the number of ATMs, POS terminals and cards outstanding Build a modern and scalable mobile banking and Internet banking platforms Alternative client acquisition & service channels (retail chains, co-branded cards, utilities, etc)
Expand the branch network to 75+ branches by YE 2015
“Grow with clients” Valuable source of retail clients through payroll programs Growth of loan book and F&C income
Maximize the product-to-client ratio
Expand retail product offering
Build sufficient channel capacity
Build a ubiquitous branch footprint throughout the country
Flexible, offset, variable-rate, etc. mortgages Full range of consumer loan products Revolving credit cards Payroll & pension-backed loans & overdrafts Modern, multi-currency current accounts with debit cards Ubiquity of ATMs and POS terminals in urban centers and reasonable proximity elsewhere Payment & e-wallet solutions Full range of deposit products
Healthy structure & growth of balance sheet
>20% growth in 2015
Integrated client coverage Leverage the superior lending capacity Cross-selling opportunities Documentary operations & trade finance, FX, other solutions Rep offices in EAC
Private Banking, Securities, Insurance
Leverage the superior access to wholesale funding to complement the deposit funding base Reduce maturity gap
Enable further expansion of long-term lending
Increase the maturity profile of liabilities
Create a universal banking platform
Consolidate the leading position in corporate banking
Further diversification of revenue streams
Increase retail loans penetration
Increase the loan to asset ratio to 60% Diversification of funding base
Expand the share of higher-margin lending Maximise the cross-sell opportunities Grow the share of retail in the loan book up to 30%-40% in the medium term

Bank of Kigali Investor Presentation Page 46
Management Targets
Branch expansion Return on Average Equity Other Selected Management 2015 targets
52.4% 9M 2013
Growth in net income >20% Y-o-Y
Growth in total assets +20% Y-o-Y
Non funded income ratio : 40% of the total
operating income
Reduce NPL ratio to < 5%
Increase number of retail current accounts by
100,000
Bank of Kigali Investor Presentation Page 47
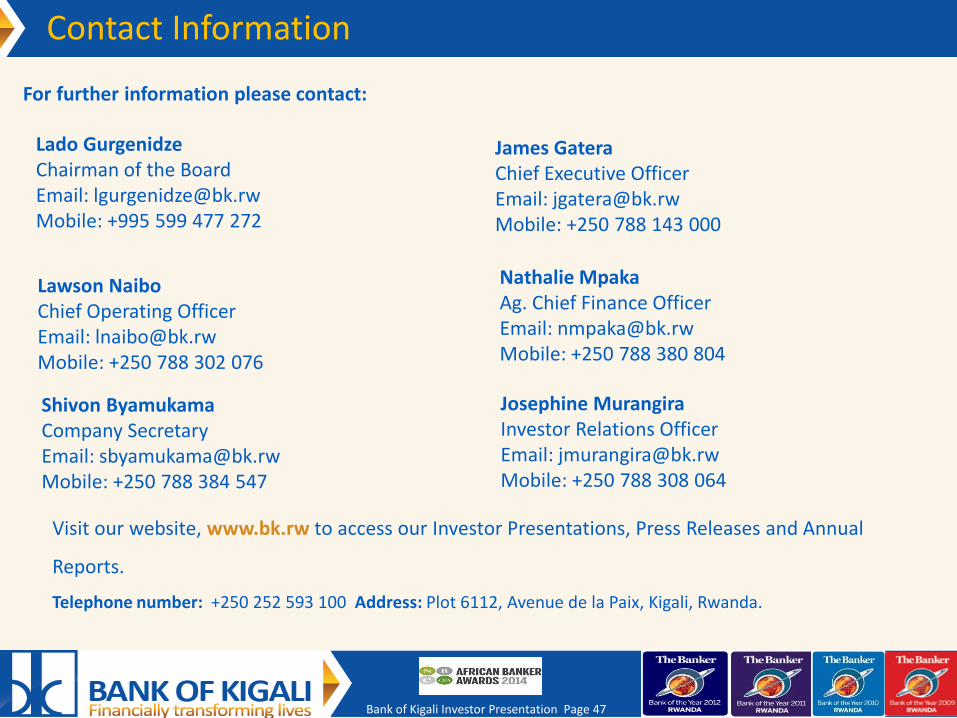
For further information please contact:
Lado Gurgenidze Chairman of the Board Email: [email protected] Mobile: +995 599 477 272
James Gatera Chief Executive Officer Email: [email protected] Mobile: +250 788 143 000
Josephine Murangira Investor Relations Officer Email: [email protected] Mobile: +250 788 308 064
Lawson Naibo Chief Operating Officer Email: [email protected] Mobile: +250 788 302 076
Visit our website, www.bk.rw to access our Investor Presentations, Press Releases and Annual
Reports.
Telephone number: +250 252 593 100 Address: Plot 6112, Avenue de la Paix, Kigali, Rwanda.
Contact Information
Nathalie Mpaka Ag. Chief Finance Officer Email: [email protected] Mobile: +250 788 380 804
Shivon Byamukama Company Secretary Email: [email protected] Mobile: +250 788 384 547