kigali, rwanda - world banksiteresources.worldbank.org/...cost_green_housing_kigali_rwanda.pdf · 1...
TRANSCRIPT
1
INFORMAL HOUSING: REDUCING DISASTER VULNERABILITY THROUGH SAFER CONSTRUCTION
Kigali, Rwanda
WORLD BANK, MARCH 2012
(Funded by TFESSD under Component 2 of “Addressing Climate Change with Low Cost Green Housing”)
2
3
CONTENTS I. HOUSING TYPOLOGIES II. CONSTRUCTION MATERIALS
A. Traditional Palette B. Modern Palette C. Alternative Palette
III. KEY SSUES TO BE ADDRESSED
A. Existing Infrastructure and Population Growth B. Implications of the Masterplan on Informal Settlements
IV. CONCLUSIONS A. Lessons from Mumbai B. Implications on Climate Change
4
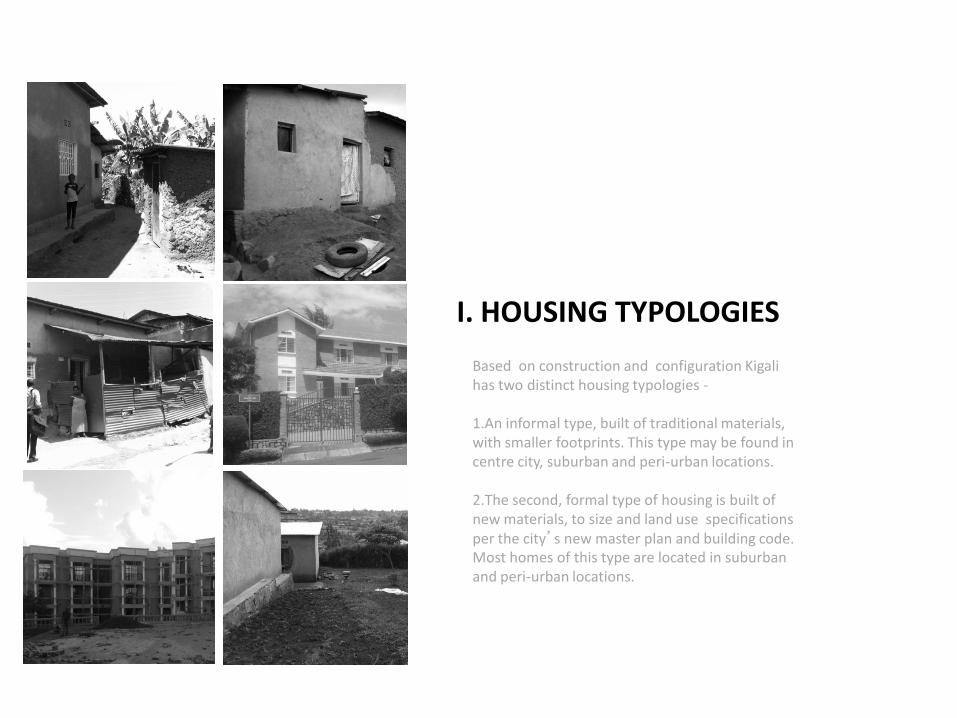
I. HOUSING TYPOLOGIES
Based on construction and configuration Kigali has two distinct housing typologies - 1.An informal type, built of traditional materials, with smaller footprints. This type may be found in centre city, suburban and peri-urban locations.
2.The second, formal type of housing is built of new materials, to size and land use specifications per the city’s new master plan and building code. Most homes of this type are located in suburban and peri-urban locations.
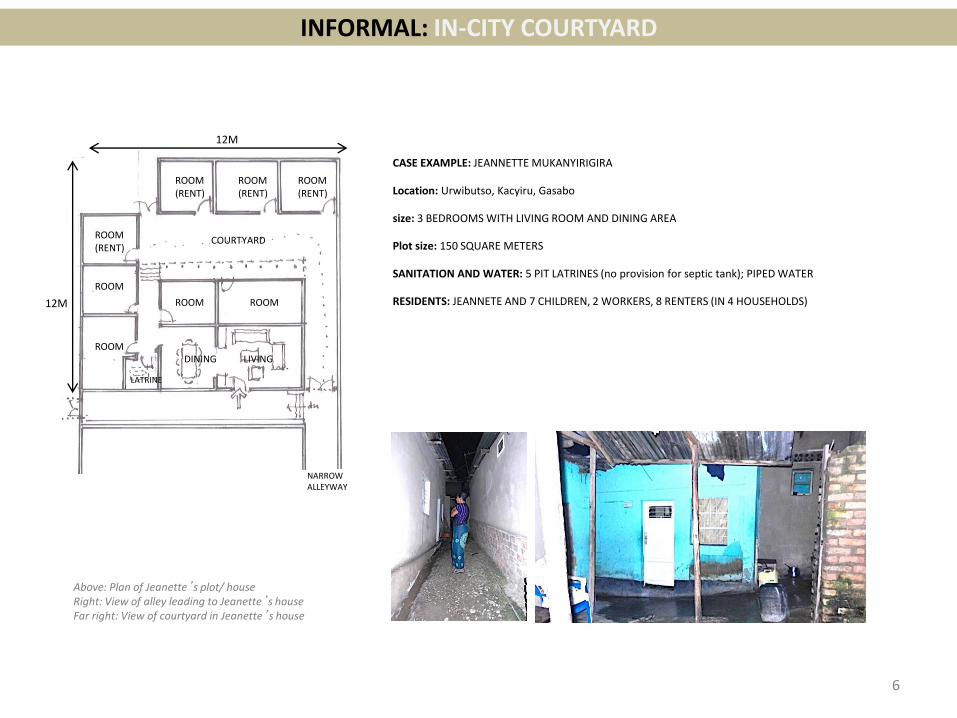
INFORMAL: IN-CITY COURTYARD
6
Above: Plan of Jeanette’s plot/ house Right: View of alley leading to Jeanette’s house Far right: View of courtyard in Jeanette’s house
CASE EXAMPLE: JEANNETTE MUKANYIRIGIRA
Location: Urwibutso, Kacyiru, Gasabo
size: 3 BEDROOMS WITH LIVING ROOM AND DINING AREA
Plot size: 150 SQUARE METERS
SANITATION AND WATER: 5 PIT LATRINES (no provision for septic tank); PIPED WATER
RESIDENTS: JEANNETE AND 7 CHILDREN, 2 WORKERS, 8 RENTERS (IN 4 HOUSEHOLDS)
12M
12M
COURTYARD
LIVING DINING
LATRINE
ROOM
ROOM
ROOM (RENT)
ROOM ROOM
ROOM (RENT)
NARROW ALLEYWAY
ROOM (RENT)
ROOM (RENT)
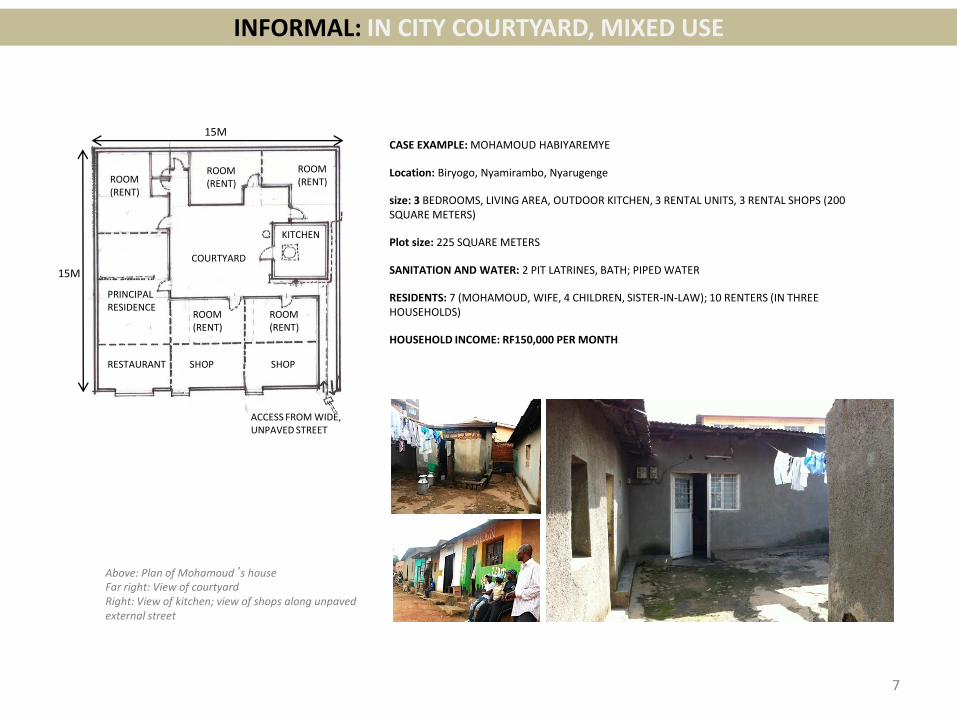
INFORMAL: IN CITY COURTYARD, MIXED USE
7
CASE EXAMPLE: MOHAMOUD HABIYAREMYE
Location: Biryogo, Nyamirambo, Nyarugenge
size: 3 BEDROOMS, LIVING AREA, OUTDOOR KITCHEN, 3 RENTAL UNITS, 3 RENTAL SHOPS (200 SQUARE METERS)
Plot size: 225 SQUARE METERS
SANITATION AND WATER: 2 PIT LATRINES, BATH; PIPED WATER
RESIDENTS: 7 (MOHAMOUD, WIFE, 4 CHILDREN, SISTER-IN-LAW); 10 RENTERS (IN THREE HOUSEHOLDS)
HOUSEHOLD INCOME: RF150,000 PER MONTH
Above: Plan of Mohamoud’s house Far right: View of courtyard Right: View of kitchen; view of shops along unpaved external street
15M
15M
ROOM (RENT)
ROOM (RENT)
PRINCIPAL RESIDENCE
ROOM (RENT)
ROOM (RENT)
ROOM (RENT)
SHOP SHOP RESTAURANT
COURTYARD
KITCHEN
ACCESS FROM WIDE, UNPAVED STREET
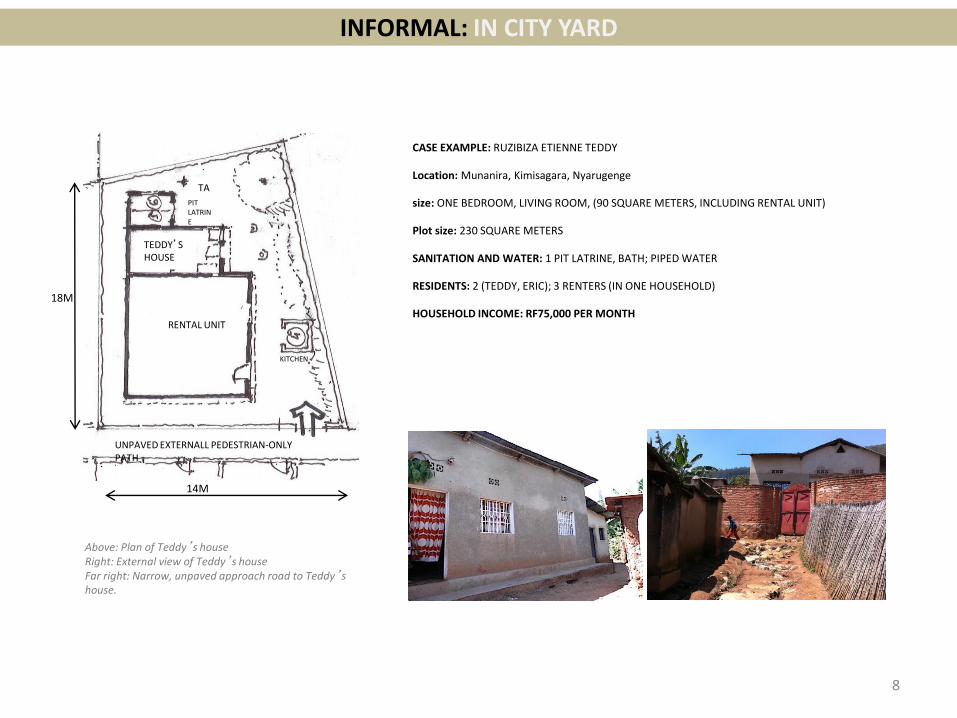
INFORMAL: IN CITY YARD
8
Above: Plan of Teddy’s house Right: External view of Teddy’s house Far right: Narrow, unpaved approach road to Teddy’s house.
CASE EXAMPLE: RUZIBIZA ETIENNE TEDDY
Location: Munanira, Kimisagara, Nyarugenge
size: ONE BEDROOM, LIVING ROOM, (90 SQUARE METERS, INCLUDING RENTAL UNIT)
Plot size: 230 SQUARE METERS
SANITATION AND WATER: 1 PIT LATRINE, BATH; PIPED WATER
RESIDENTS: 2 (TEDDY, ERIC); 3 RENTERS (IN ONE HOUSEHOLD)
HOUSEHOLD INCOME: RF75,000 PER MONTH
18M
14M
UNPAVED EXTERNALL PEDESTRIAN-ONLY PATH
RENTAL UNIT
TEDDY’S HOUSE
TAP PIT
LATRINE
KITCHEN
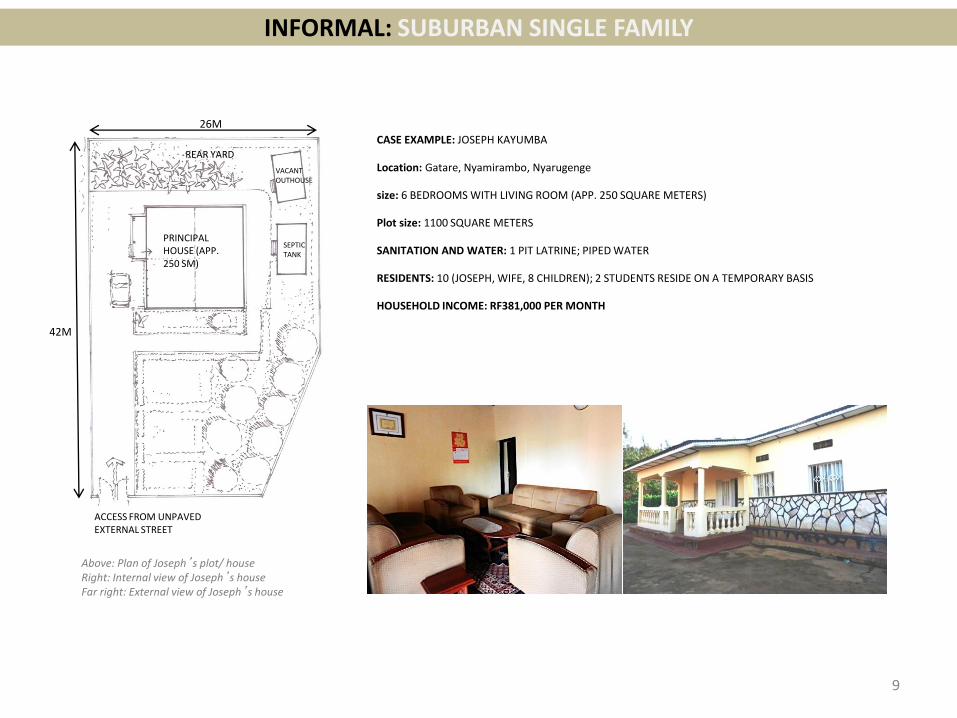
INFORMAL: SUBURBAN SINGLE FAMILY
9
Above: Plan of Joseph’s plot/ house Right: Internal view of Joseph’s house Far right: External view of Joseph’s house
CASE EXAMPLE: JOSEPH KAYUMBA
Location: Gatare, Nyamirambo, Nyarugenge
size: 6 BEDROOMS WITH LIVING ROOM (APP. 250 SQUARE METERS)
Plot size: 1100 SQUARE METERS
SANITATION AND WATER: 1 PIT LATRINE; PIPED WATER
RESIDENTS: 10 (JOSEPH, WIFE, 8 CHILDREN); 2 STUDENTS RESIDE ON A TEMPORARY BASIS
HOUSEHOLD INCOME: RF381,000 PER MONTH
42M
26M
PRINCIPAL HOUSE (APP. 250 SM)
VACANT OUTHOUSE
SEPTIC TANK
ACCESS FROM UNPAVED EXTERNAL STREET
REAR YARD
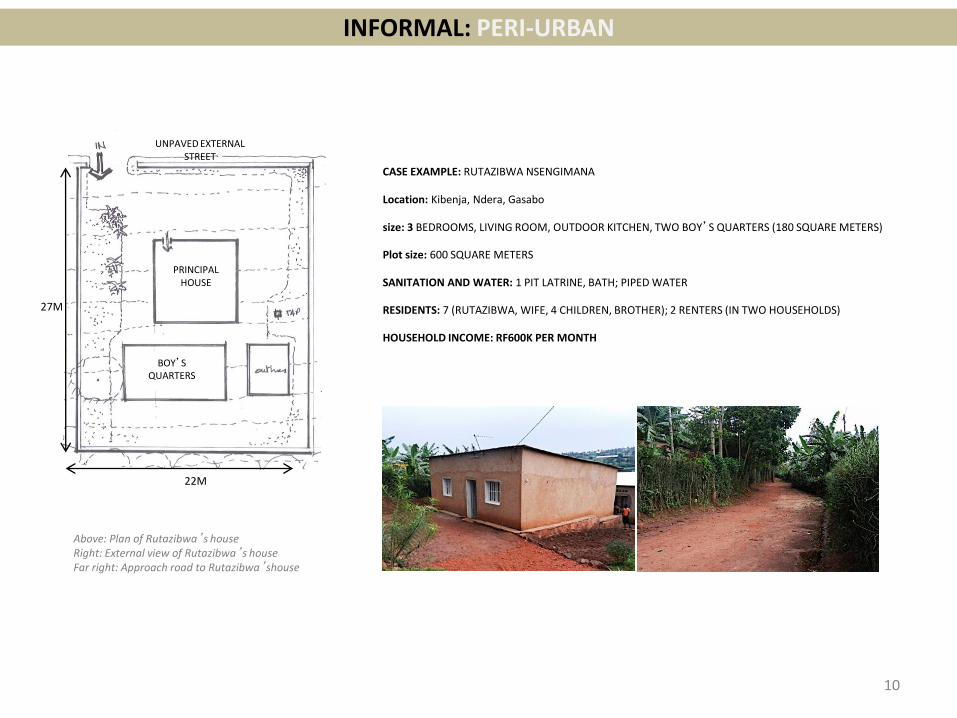
INFORMAL: PERI-URBAN
10
Above: Plan of Rutazibwa’s house Right: External view of Rutazibwa’s house Far right: Approach road to Rutazibwa’shouse
CASE EXAMPLE: RUTAZIBWA NSENGIMANA
Location: Kibenja, Ndera, Gasabo
size: 3 BEDROOMS, LIVING ROOM, OUTDOOR KITCHEN, TWO BOY’S QUARTERS (180 SQUARE METERS)
Plot size: 600 SQUARE METERS
SANITATION AND WATER: 1 PIT LATRINE, BATH; PIPED WATER
RESIDENTS: 7 (RUTAZIBWA, WIFE, 4 CHILDREN, BROTHER); 2 RENTERS (IN TWO HOUSEHOLDS)
HOUSEHOLD INCOME: RF600K PER MONTH
27M
22M
PRINCIPAL HOUSE
BOY’S QUARTERS
UNPAVED EXTERNAL STREET
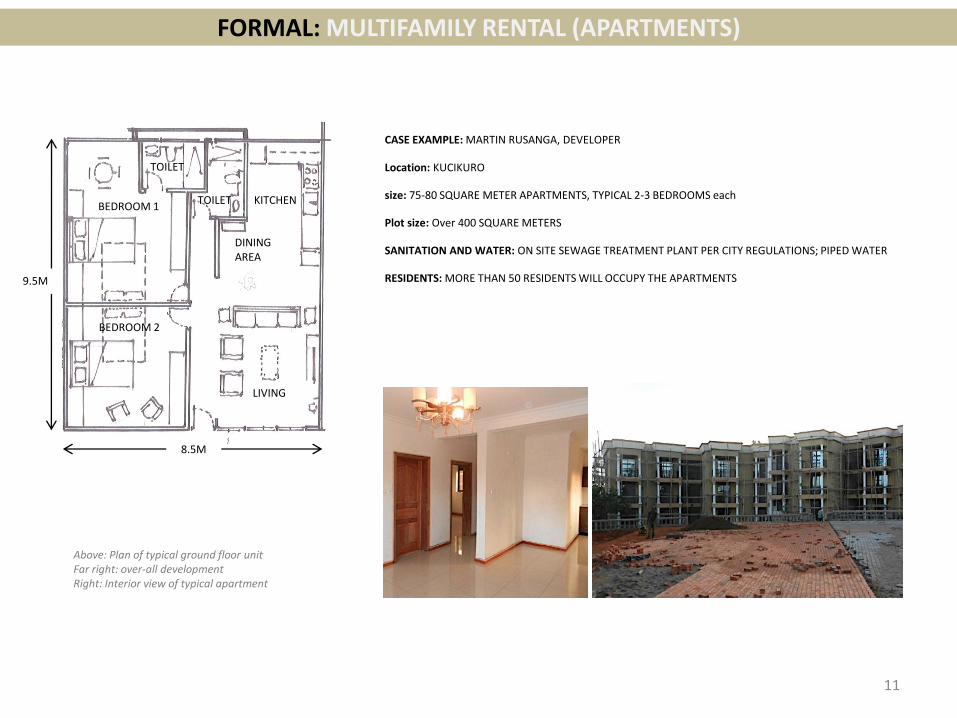
FORMAL: MULTIFAMILY RENTAL (APARTMENTS)
11
CASE EXAMPLE: MARTIN RUSANGA, DEVELOPER
Location: KUCIKURO
size: 75-80 SQUARE METER APARTMENTS, TYPICAL 2-3 BEDROOMS each
Plot size: Over 400 SQUARE METERS
SANITATION AND WATER: ON SITE SEWAGE TREATMENT PLANT PER CITY REGULATIONS; PIPED WATER
RESIDENTS: MORE THAN 50 RESIDENTS WILL OCCUPY THE APARTMENTS
Above: Plan of typical ground floor unit Far right: over-all development Right: Interior view of typical apartment
9.5M
8.5M
LIVING
KITCHEN
DINING AREA
BEDROOM 1
BEDROOM 2
TOILET
TOILET
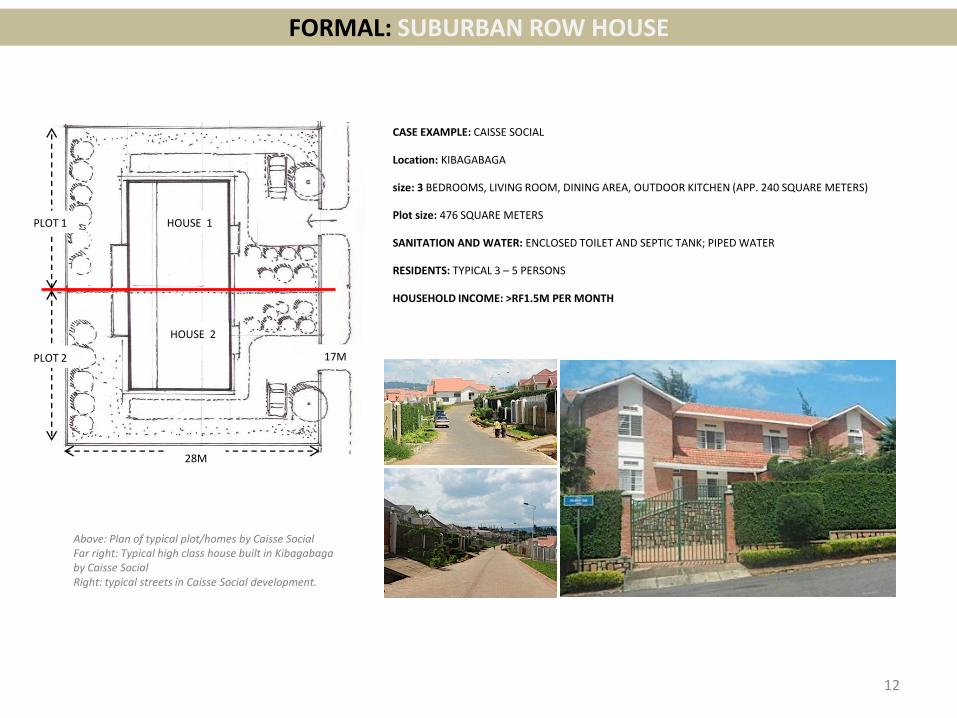
FORMAL: SUBURBAN ROW HOUSE
12
PLOT 1
PLOT 2
28M
17M
HOUSE 1
HOUSE 2
CASE EXAMPLE: CAISSE SOCIAL
Location: KIBAGABAGA
size: 3 BEDROOMS, LIVING ROOM, DINING AREA, OUTDOOR KITCHEN (APP. 240 SQUARE METERS)
Plot size: 476 SQUARE METERS
SANITATION AND WATER: ENCLOSED TOILET AND SEPTIC TANK; PIPED WATER
RESIDENTS: TYPICAL 3 – 5 PERSONS
HOUSEHOLD INCOME: >RF1.5M PER MONTH
Above: Plan of typical plot/homes by Caisse Social Far right: Typical high class house built in Kibagabaga by Caisse Social Right: typical streets in Caisse Social development.
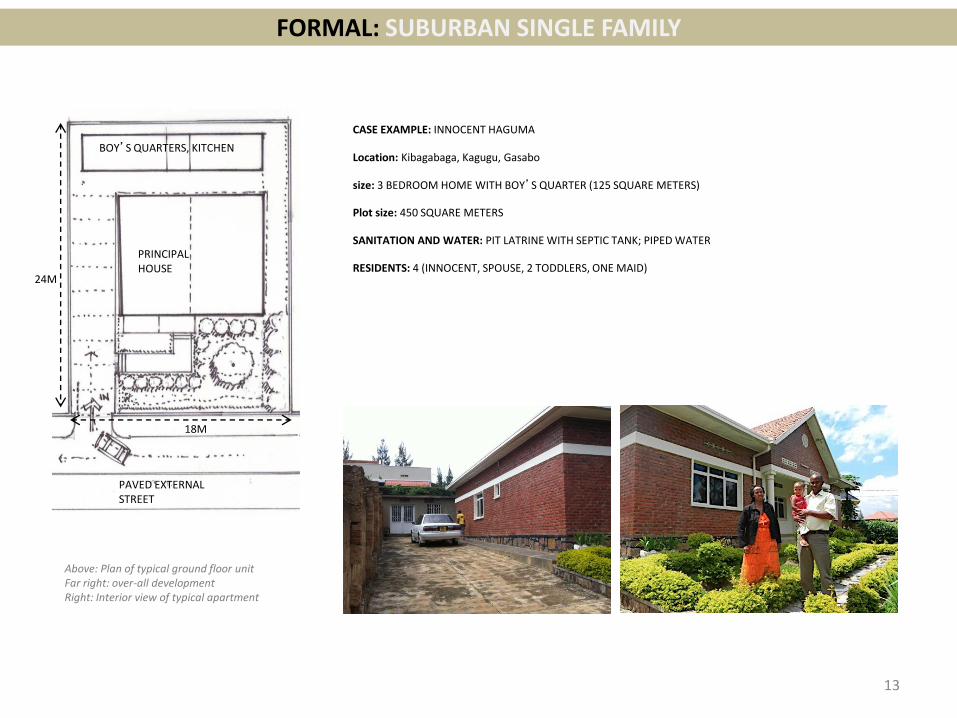
FORMAL: SUBURBAN SINGLE FAMILY
13
CASE EXAMPLE: INNOCENT HAGUMA
Location: Kibagabaga, Kagugu, Gasabo
size: 3 BEDROOM HOME WITH BOY’S QUARTER (125 SQUARE METERS)
Plot size: 450 SQUARE METERS
SANITATION AND WATER: PIT LATRINE WITH SEPTIC TANK; PIPED WATER
RESIDENTS: 4 (INNOCENT, SPOUSE, 2 TODDLERS, ONE MAID)
Above: Plan of typical ground floor unit Far right: over-all development Right: Interior view of typical apartment
PAVED EXTERNAL STREET
24M
18M
PRINCIPAL HOUSE
BOY’S QUARTERS, KITCHEN
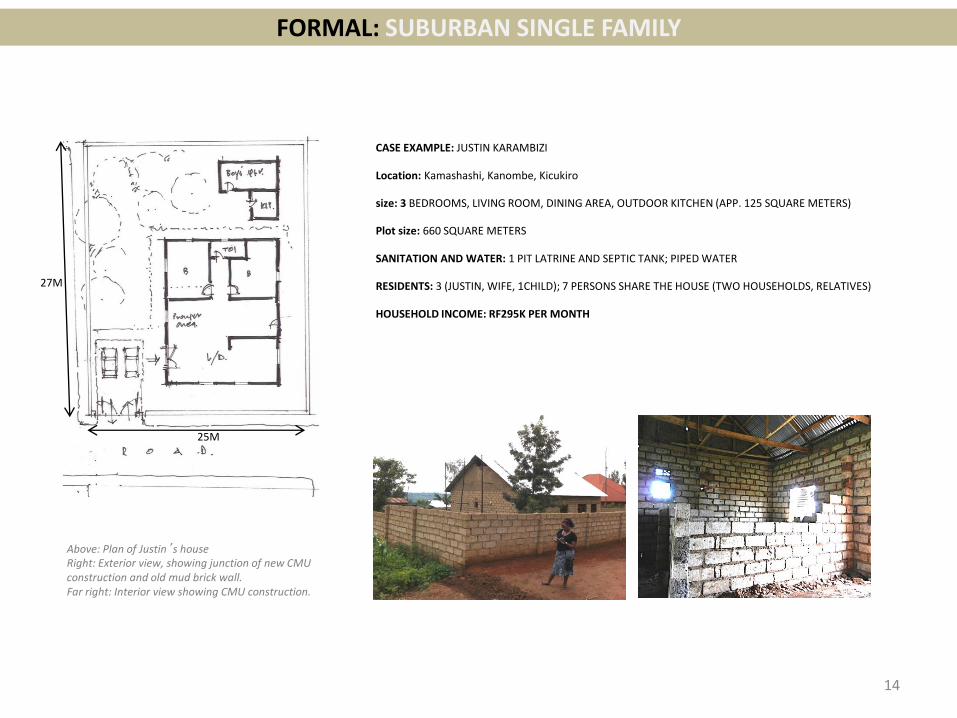
FORMAL: SUBURBAN SINGLE FAMILY
14
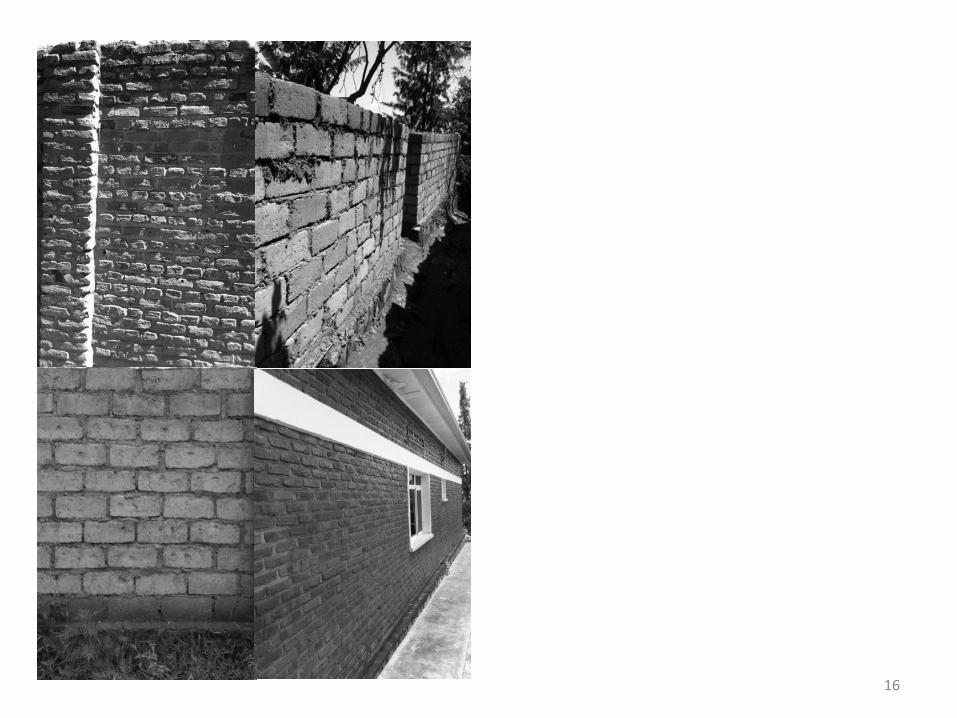
Above: Plan of Justin’s house Right: Exterior view, showing junction of new CMU construction and old mud brick wall. Far right: Interior view showing CMU construction.
CASE EXAMPLE: JUSTIN KARAMBIZI
Location: Kamashashi, Kanombe, Kicukiro
size: 3 BEDROOMS, LIVING ROOM, DINING AREA, OUTDOOR KITCHEN (APP. 125 SQUARE METERS)
Plot size: 660 SQUARE METERS
SANITATION AND WATER: 1 PIT LATRINE AND SEPTIC TANK; PIPED WATER
RESIDENTS: 3 (JUSTIN, WIFE, 1CHILD); 7 PERSONS SHARE THE HOUSE (TWO HOUSEHOLDS, RELATIVES)
HOUSEHOLD INCOME: RF295K PER MONTH
25M
27M
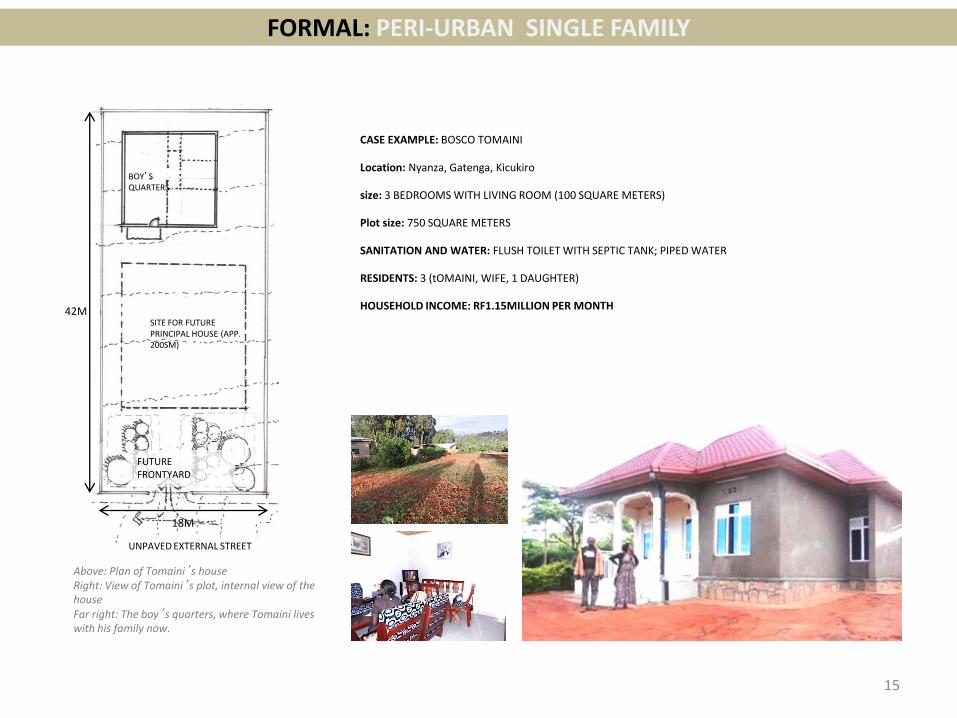
FORMAL: PERI-URBAN SINGLE FAMILY
15
Above: Plan of Tomaini’s house Right: View of Tomaini’s plot, internal view of the house Far right: The boy’s quarters, where Tomaini lives with his family now.
CASE EXAMPLE: BOSCO TOMAINI
Location: Nyanza, Gatenga, Kicukiro
size: 3 BEDROOMS WITH LIVING ROOM (100 SQUARE METERS)
Plot size: 750 SQUARE METERS
SANITATION AND WATER: FLUSH TOILET WITH SEPTIC TANK; PIPED WATER
RESIDENTS: 3 (tOMAINI, WIFE, 1 DAUGHTER)
HOUSEHOLD INCOME: RF1.15MILLION PER MONTH
42M
18M
BOY’S QUARTERS
SITE FOR FUTURE PRINCIPAL HOUSE (APP. 200SM)
FUTURE FRONTYARD
UNPAVED EXTERNAL STREET
16
II. BUILDING MATERIALS
17
There are two prevalent material palettes in use in Kigali - 1.The traditional material palette - most homes that fall within the informal typology are built of this material palette.
2.A formal, mostly imported material palette used to build homes per the specifications of the city’s new master plan and building code.

A. TRADITIONAL PALETTE
Labor skills in the use of these materials are easily available, and most homeowners understand the possibilities and limitations of this material palette. In addition, these materials are affordable for most Kigali households since they are locally sourced. There is a general disaffection with this palette of materials amongst many quarters of policy makers and it is seen as being ‘non-modern’ and regressive. A primary drawback is that homes built of this palette are subject to minor water damage at the base of external walls due to backsplash from driving rain; solutions include using a compressed mud brick with concrete in the mix along the base of the wall, up to 1m in height. In addition, this palette is not suitable for construction of multiple stories.
18
Costs of typical traditional materials used in construction 1. Mud brick 6250/m3 2. Cement screed flooring 5,500/m3 3. Rammed earth walls, with timber struts 2,500/m3 4. Clay roofing tile 6,000/m3 5. Volcanic stone 36,000/m3 6. Timber including bamboo 1,000/piece (app. 3m in length) 7. Mud plaster 6,250/m3
Most informal homes in Kigali have been built of a traditional palette of materials – mud brick, rammed earth, timber, mud plaster, cement screed. Below is a breakdown of typical costs of these materials.
B. FORMAL PALETTE
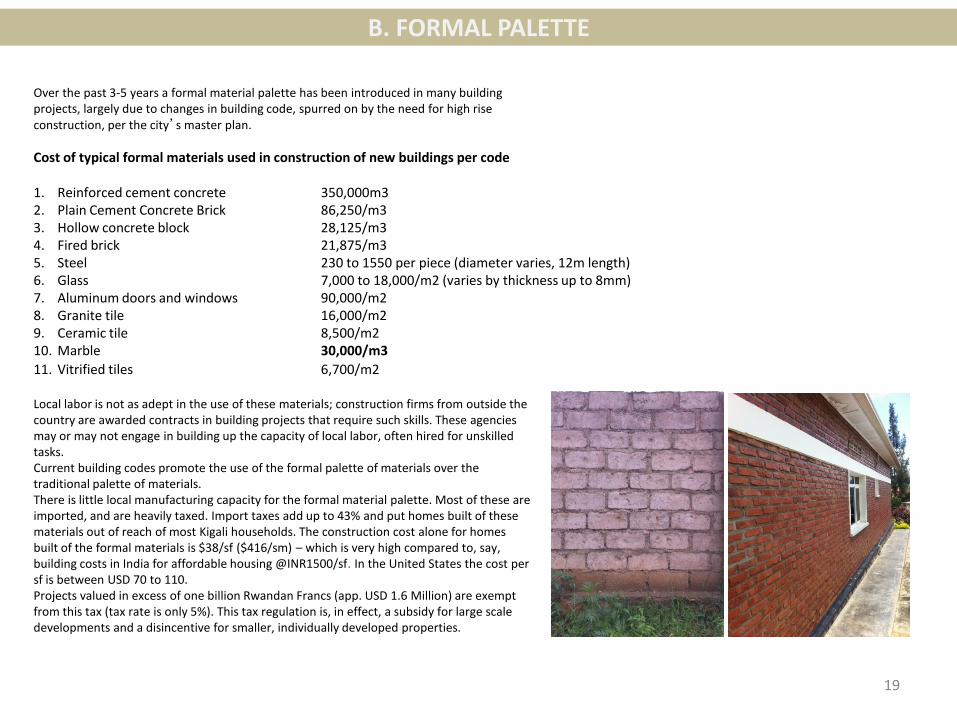
Local labor is not as adept in the use of these materials; construction firms from outside the country are awarded contracts in building projects that require such skills. These agencies may or may not engage in building up the capacity of local labor, often hired for unskilled tasks. Current building codes promote the use of the formal palette of materials over the traditional palette of materials. There is little local manufacturing capacity for the formal material palette. Most of these are imported, and are heavily taxed. Import taxes add up to 43% and put homes built of these materials out of reach of most Kigali households. The construction cost alone for homes built of the formal materials is $38/sf ($416/sm) – which is very high compared to, say, building costs in India for affordable housing @INR1500/sf. In the United States the cost per sf is between USD 70 to 110. Projects valued in excess of one billion Rwandan Francs (app. USD 1.6 Million) are exempt from this tax (tax rate is only 5%). This tax regulation is, in effect, a subsidy for large scale developments and a disincentive for smaller, individually developed properties.
19
Cost of typical formal materials used in construction of new buildings per code 1. Reinforced cement concrete 350,000m3 2. Plain Cement Concrete Brick 86,250/m3 3. Hollow concrete block 28,125/m3 4. Fired brick 21,875/m3 5. Steel 230 to 1550 per piece (diameter varies, 12m length) 6. Glass 7,000 to 18,000/m2 (varies by thickness up to 8mm) 7. Aluminum doors and windows 90,000/m2 8. Granite tile 16,000/m2 9. Ceramic tile 8,500/m2 10. Marble 30,000/m3
11. Vitrified tiles 6,700/m2
Over the past 3-5 years a formal material palette has been introduced in many building projects, largely due to changes in building code, spurred on by the need for high rise construction, per the city’s master plan.
ILLUSTRATIVE COMPARISON – TRADITIONAL Vs. FORMAL
20
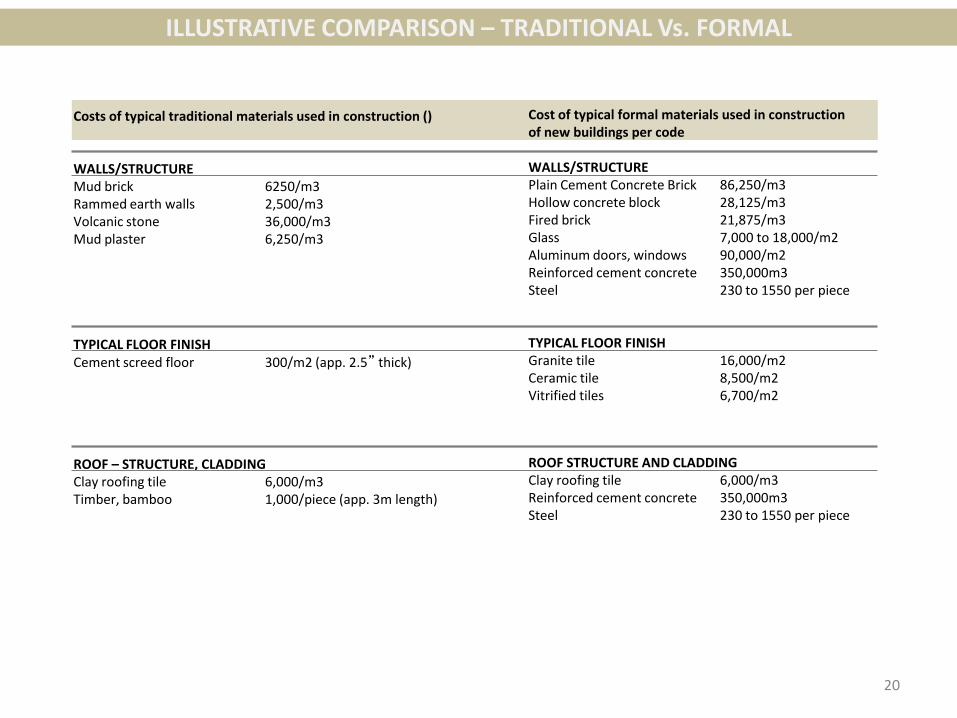
Costs of typical traditional materials used in construction () WALLS/STRUCTURE Mud brick 6250/m3 Rammed earth walls 2,500/m3 Volcanic stone 36,000/m3 Mud plaster 6,250/m3 TYPICAL FLOOR FINISH Cement screed floor 300/m2 (app. 2.5” thick)
ROOF – STRUCTURE, CLADDING Clay roofing tile 6,000/m3 Timber, bamboo 1,000/piece (app. 3m length)
Cost of typical formal materials used in construction of new buildings per code WALLS/STRUCTURE Plain Cement Concrete Brick 86,250/m3 Hollow concrete block 28,125/m3 Fired brick 21,875/m3 Glass 7,000 to 18,000/m2 Aluminum doors, windows 90,000/m2 Reinforced cement concrete 350,000m3 Steel 230 to 1550 per piece TYPICAL FLOOR FINISH Granite tile 16,000/m2 Ceramic tile 8,500/m2 Vitrified tiles 6,700/m2
ROOF STRUCTURE AND CLADDING Clay roofing tile 6,000/m3 Reinforced cement concrete 350,000m3 Steel 230 to 1550 per piece
C. ALTERNATE PALETTE
1. Light Weight concrete: Light weight concrete may be made by partial replacement of cement with rice husk, saw dust, plantain fibers and volcanic cinders. These alternate binder materials are available in Rwanda; however acquiring sufficient quantities per engineering specifications may prove to be challenging.
2. Compressed/Stabilized Earth Block (CEB): Most low cost buildings were constructed using Stabilized earth block. The machines were imported from a South Africa based company called HYDROFORM. The production cost per block will be FRW 50 (Conversion rate 1USD=605 FRW) which includes cost of labor, cement, power and wear and tear of machine. The main raw materials, gravel is freely available. The quality of the block depends on the mix proportion and applied pressure. The main drawback is that the material’s structural strength may be compromised if it comes in contact with water, e.g. during periods of heavy rainfall when backsplash from the ground around an external wall; one way around this drawback is to build the first one meter of a wall with concrete block. The material may be used on single storey construction. CEB cost app. RWF 50 per block (or RWF3125/m3).
21
4. Agro-stone wall panels and doors: Agro-stone has the potential to become a major part of the building products palette. It is made of crushed volcanic rock and agricultural waste. Both are widely available in Rwanda. Magnesium Chloride is used as a binder – this component is not locally available, and needs to be imported. However, the binder is used in small quantities relative to volcanic rock and agro-waste. The labor skills and plant requirements for the material are modest. KIST has conducted various tests for compressive strengths. The material can be used as infill panels within a concrete frame building. Agro stone panels cost app. RWF3600/m2.
5. Styrofoam panels: Schnell, a German manufacturer is actively marketing a Styrofoam panel and has built two homes in Kigali to showcase their product. They are also committed to manufacturing the product locally. However, the merits of building homes of Styrofoam are suspect.
6. Paper-mache: Paper-mache panels use recycled paper as a raw material to make infill wall panels. The material could be limited by the lack of an adequate waste collection and recycling program for paper.
Research efforts for alternate, locally sourced materials are ongoing at KIST (Kigali Institute of Science and Technology); these efforts are, however, constrained by lack of adequate funding. Alternate materials built of local raw materials and requiring local labor skills include the following.
III. KEY ISSUES TO BE ADDRESSED
A. EXISTING INFRASTRUCTURE AND POPULATION GROWTH
23
Kigali’s population is projected to grow at an annual rate of 7% to 8%. Kigali’s informal settlements occupy 62% of the land area of the city, and house 83% of its population. “According to the 2002 census, between 1991 and 2002 Kigali experienced an average annual growth rate of 9%. In the next 25 years over 1 million people are projected to migrate to cities in Rwanda. If current trends Rwanda continue, Kigali will bear the brunt of the urban growth pressure in created by this extremely high rate of urban migration. This phenomenon will continue to tax the existing urban and community infrastructure and availability of developable land within the city boundaries.”
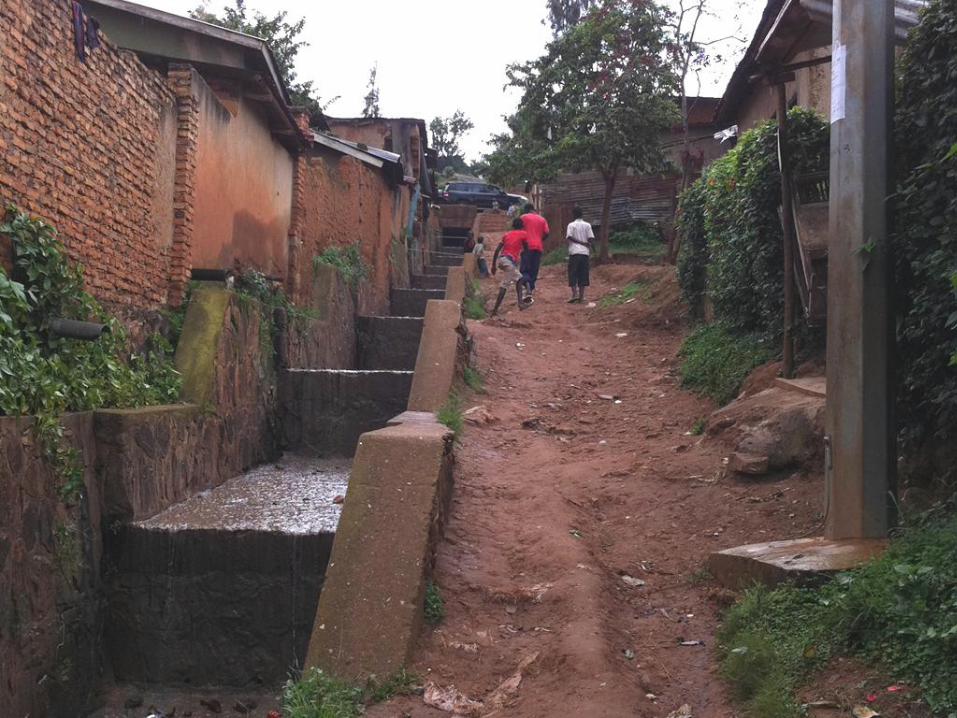
Kigali Conceptual Master Plan, Chapter 2, page 23 On the positive side, Kigali’s water distribution systems appear to be in place: most homes surveyed had a tap connected to a central distribution system. Similarly, electricity is widely available, and distribution systems offer flexible means to modulate usage via a pay-as-you-go meter system. Residents ‘prepay’ for electricity from the city which allows them to have better control over their monthly budgets. Thus, in terms of water and electricity delivery, the city’s infrastructure better than many other comparable cities. However, much remains to be done with respect to sewage/ sanitation, wastewater, and public transportation/ roads. •In the city’ informal settlements, sewage and waste water is largely disposed through open drains that often double up as pedestrian pathways. Untreated waste is likely finding its way in to the city’s ground water and wetlands.
•Kigali’s public transportation system is inadequate and expensive, especially in light of the population growth projections. Major arterial streets are paved, but the majority of local streets are mud roads on steep slopes, and treacherous for motorists and pedestrians during periods of heavy rainfall.
SEWAGE AND WASTEWATER “In the informal settlements, the most profound existing condition is that there is little to no infrastructure for water supply, sanitation and waste water, power, waste management, drainage and storm water management. Access is extremely limited and is largely by way of narrow walkways (usually unpaved) that often double as drainage systems.”
Kigali Conceptual Master Plan, Chapter 2, page 22 Sewage treatment is decentralized, especially in urban areas, where densities are highest. This is likely polluting the ground water; and as the city grows, sewage treatment will become a major environmental concern. Soak pits and pit latrines are a viable solution in lower density conditions; however, as densities increase some amount of treatment is necessary.
For new developments, exceeding 50 persons in population, the city has now mandated the use of a sewage treatment plant. Since this is developer provided, the cost is passed on to consumers of housing thereby further increasing the cost of housing. In addition, sewage treatment plants are imported, and subject to 43% tax, unless the overall project exceeds RF 1 billion – this cost too is passed on to consumers. Waste water treatment, disposal and re-use systems are weak. Most central city communities do not treat or reuse their grey water; concrete gutters are built to direct this water to the wetlands. This has two negative effects: •The concrete gutters are also the pathways for pedestrians. Constant exposure to water creates slippery and hazardous conditions for pedestrians. •The steep slopes of the drains channel the water into the wetlands without allowing for adequate earth-filtration of the grey water (a natural process where water with pollutants in it is filtered slowly by the ground before reaching natural wetlands).
PUBLIC TRANSPORTATION Public transportation consists of a combination of city buses, privately run buses, taxi cabs and two-wheelers operated by private individuals.
Transportation in general is non-integrated, expensive. For example, a cross-town trip (from Kimisagara to the airport, about 6 miles by road) costs RF250 one way – this implies a monthly travel cost of RF10,000 or $16 (RF500/day * 20 days a month). This represents 20% of a RF50,000 monthly income, which is approximately what most low income households earn – this is disproportionally high.
• For example, in Washington DC, the cost of commuting cross-town by bus is app. $1.25; this translates to a monthly travel cost of $50, a much smaller proportion of US incomes, even for low income households.
• Similarly, in Mumbai, India the cost of a similar crosstown bus
ride is app. $0.60; this translates to a monthly travel cost of $12, still a smaller proportion of income (app10% of a $120/mo income), albeit enough to cause some strains.
As the master plan encourages growth outwards (see next section on Master Plan), either through the displacement of families living in central Kigali or through the formation of new households in suburban or peri-urban locations, the quality of streets will be a major determinant of commuting patterns. Central Kigali still remains the economic center of the region - the lack of public transportation and paved roads will likely cause long, uncomfortable commutes for residents travelling in to the city on a daily basis.
24
ROADS Major arterial roads are paved and graded to suitable slopes. However, local and collector roads are not paved or graded to suitable slopes. This often results in hazardous conditions, especially during periods of heavy rainfall.
Large land holders, such as K Sociale build the roads and other common infrastructure for their land parcels (they own a total of 250 hectares or 625 acres). This cost is substantial, adding 20% to 25% to the cost of the homes they build. This pushes up the price of housing even further out of reach of most Kigali households. Such roads are often required to be open to public access; in developments that are geared to affordable housing, such infrastructure could be provided by the city, thereby reducing the cost of the homes.
A. EXISTING INFRASTRUCTURE AND POPULATION GROWTH
B. IMPLICATIONS OF THE MASTERPLAN ON INFORMAL SETTLEMENTS
25
As presented earlier, Kigali’s housing stock constitutes 6 distinct typologies: 1.The court/yard house, typically found in the center city 2.The build-to-lot, also located in the center city 3.The slum, usually located on the fringes of the city’s wetlands or other no-build zones 4.Single family homes, located in suburban settings, such as Kibagabaga 5.Multi-storey apartments, located in central city and suburban locations (e.g. Biryogo and Kucikuro) 6.Peri-urban single family homes , located in the fringe areas of the city and typically include agragrian activities. Much of the existing informal housing stock in Kigali is built of traditional materials – mud, mud brick and timber. These materials are sourced locally, and are within the financial means of most households. Labor that is able to build with these materials is available.
MASTER PLAN, ZONING REGULATIONS, BUILDING CODES Kigali’s new master plan envisions the transformation of Kigali in to a bustling city that is at the center of a new Knowledge Economy in East Africa. To support this vision the city is proposing new zoning regulations and building codes for its building stock. The zoning regulations and codes encourage larger format lots, with deeper setbacks and taller building heights than is prevalent in center city locations. In suburban and peri-urban locations the regulations encourage large single family homes as the primary residential type. Proposed land uses are varied, and many existing residential settlements are slated for redevelopment as hotel and convention districts, office districts, mixed use entertainment districts. The building codes no longer permit the use of the traditional palette of materials that many residents are used to building with and can afford. Instead, the codes encourage the use of formal, engineered materials such as brick, metal, glass and concrete. The master plan, through the zoning and building code regulations, has thus inadvertently created disincentives for incremental additions or improvements to existing properties. The consequence is that long time central city residents are now migrating to suburban and peri-urban locations where housing regulations are more lax, and land/construction costs are lower.
IV. CONCLUSIONS
A. LESSONS FROM MUMBAI AND THEIR LACK OF TRANSFERABILITY TO KIGALI
27
1. Established slum communities more likely to protect their
homes against natural hazards Slum communities in Mumbai are well established, and constitute a high percentage of the city's population; in addition, the choice between relocation and in-situ rehabilitation is still open - decisions regarding the two options are made on a community-specific basis. Therefore, it is reasonable to assume that communities that choose to stay in their current locations are more likely to improve their homes to make them more resilient to natural hazards. In the long term they may chose to redevelop their homes per Slum Redevelopment Authority norms in Mumbai. Even though 83% of Kigali’s population lives in informal settlements, similar assumptions cannot be made, due to the increasing regulation-driven disincentives to stay in the city. 2. Availability of local building materials and skills for informal
construction Mumbai has an established local materials supply chain, either through primary or secondary markets, and incremental improvements by residents of informal housing are affordable. The grass-roots incremental approach that is possible in Mumbai is unlikely to take root in Kigali. This is because Kigali’s building codes do not permit the use of locally available traditional materials, and instead mandate the use of formal materials. These materials are imported and heavily taxed and are effectively beyond the reach of most residents of the city. Therefore, building construction activity is limited to large developers involved in large high-end projects.
3. Tacit approval by local municipal authorities for informal
housing Local municipalities in Mumbai allow a basic typology for informal housing. This is done through implicit—not explicit—regulations: the municipality allows unit sizes of 10'x15' and heights of up to 14’. Essentially new migrants to the city can buy or rent a very basic house/ lot with or without improvements and subsequently alter the house as needs evolve. In Kigali, the zoning regulations and codes are stringent and strictly enforced and additions to existing homes are not permitted (apart from simple painting or minor repairs). For any major improvement, including things such as repairing a roof or adding a room, a permit is required. This permit is only granted if the proposed improvements adhere to the ‘minimum’ standards set forth in the masterplan. 4. Relocation versus redevelopment
Mumbai’s informal settlements house 50% of its population and occupy only 6% of the city’s land area. Given the the high value of the land on which informal housing settlements are located, redevelopment in Mumbai is a highly contested affair and also very politically charged, and usually involves years of negotiations between government officials, developers and slum residents. The viability of alternatives to relocation, such as in-situ upgrading, have to be considered in any redevelopment scheme. In Kigali , informal settlements house 83% of the population on 62% of the city’s land (Kigali Conceptual Master Plan, Chapter 2, page 23). With the bulk of the city’s ‘usable’ land being occupied by informal housing, the likelihood of these settlements being relocated is fairly high, given the city’s stated economic goals. Whether these are forced relocations or voluntary requires a more in-depth review.
B. IMPLICATIONS FOR CLIMATE CHANGE
28
As Kigali grows and its master plan is realized through zoning and building codes, the quality and type of infrastructure it puts in place will have significant impacts – positive or negative – on climate change. •If the city implements an integrated public transportation system to serve future commuting trends, it will go a long way in limiting carbon emissions by cars.
•Centralized and localized sewage treatment techniques will limit the amount of pollutants that enter the city’s ground water and wetlands.
•Pursuing a mixed strategy - of redevelopment and upgrading of existing homes – will enable some percentage of existing residents to remain in center city locations. This will reduce the sprawl-related strain on the city, particularly with regard to expanding its trunk infrastructure.
•Following a similar mixed strategy with building codes – allowing for traditional materials while also introducing greener imported materials – will have a positive impact on climate change, since the embodied energies of materials transported over long distances is significantly higher than materials sourced and produced locally.

Annex: MASTER PLAN REVIEW
29
Master Plan Goals 1. General growth of the city and land uses for a knowledge economy 2. Environmental stewardship – preserve and enhance wetlands 3. Upgrading of existing homes – allow small property owners to benefit from economic growth 4. New development – encourage new housing stock, per formal building codes 5. Transportation – create a regional network of streets 6. Infrastructure – not clear The implementation of the concepts in the master plan is based on sub area plans and zoning regulations. To date 5 areas have been taken up for such studies: •Rebero (illustrative sub area plan) •Kimihurura (illustrative sub area plan) •Kinyinya (illustrative sub area plan) •Masaka (illustrative sub area plan) •Nyarugenge (zoning codes) Sub area plans, primary vision •Rebero will become a hotel district •Kimihurara will accommodate new housing, hotels and a large convention center •Kinyanyi will be a low to medium density township with a town center •Masaka will become a ‘self-contained’ town The sub-area plans thus far do not illustrate an ‘upgrading’ approach where existing high density or low density development is retained.
Zoning and design guidelines, Nyarugenge •Parcel/lot sizes – specifies minimum for residential, ranging from 150sm to 4000sm •FAR – ranges from 0.8 to 2.4 •Ground cover – ranges from 30% for high rise districts to 60% for landed house. •Setbacks – side and rear ranges from 3m to 5m; front setback ranges from 5m to 7m. •Height regulations – 1 storey for low rise districts to 16 stories for high rise districts. •Permitted uses – Primarily residential; does not allow additions and alterations of non-conforming users if there is any material change in the non-conforming use, unless it is per the zoning code. IMPLICATIONS OF THE MASTERPLAN 1.Nyarugenge is to become a new CBD for Kigali; most existing homes must be re-developed per the regulations listed above (not an all-inclusive list). By these definitions, virtually all existing lots are non-conforming, either due to lot size or setback regulations. 2.Proposed FAR and height regulations allow for much higher density than most existing parcel sizes can currently sustain in terms of trunk infrastructure. In addition the streets and other public rights of way required for such densities will have to carved out of existing parcels, since many parcels in neighborhoods such as Kimisagara are currently accessed by narrow pedestrian paths. 3.The most likely outcome will be that existing residents will likely move to suburban or periurban locations, as apparent from the on-going population movement (‘sprawl’). However, infrastructure (utilities and transportation) is not adequate in these places. 4.The city may plan for such re-locations in future sub-area plans – thus far none are available.
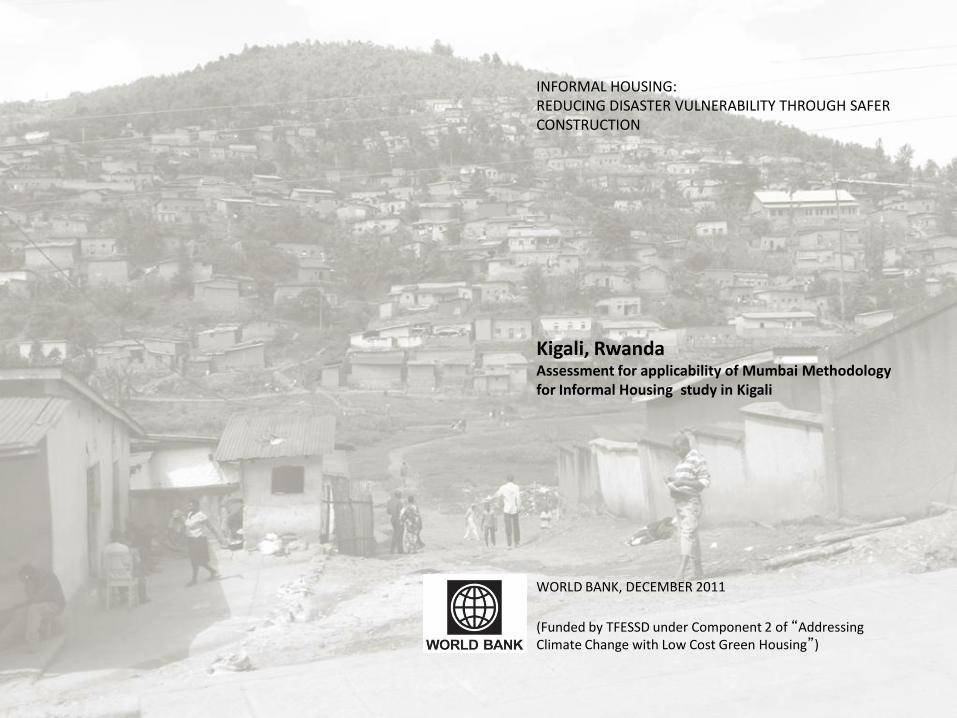
INFORMAL HOUSING: REDUCING DISASTER VULNERABILITY THROUGH SAFER CONSTRUCTION
Kigali, Rwanda Assessment for applicability of Mumbai Methodology for Informal Housing study in Kigali
WORLD BANK, DECEMBER 2011
(Funded by TFESSD under Component 2 of “Addressing Climate Change with Low Cost Green Housing”)