atspm installer wkshp configuration jamie
TRANSCRIPT
CONFIGURATION UTILITYUDOT Automated Traffic Signal Performance Measures
Jamie Mackey, P.E, PTOE
UDOT Statewide Signal Engineer
UDOT ATSPM Train-the-trainer Workshop • Salt Lake City, UT • January 18-19, 2017
Link to Slides
https://goo.gl/VyR9yr
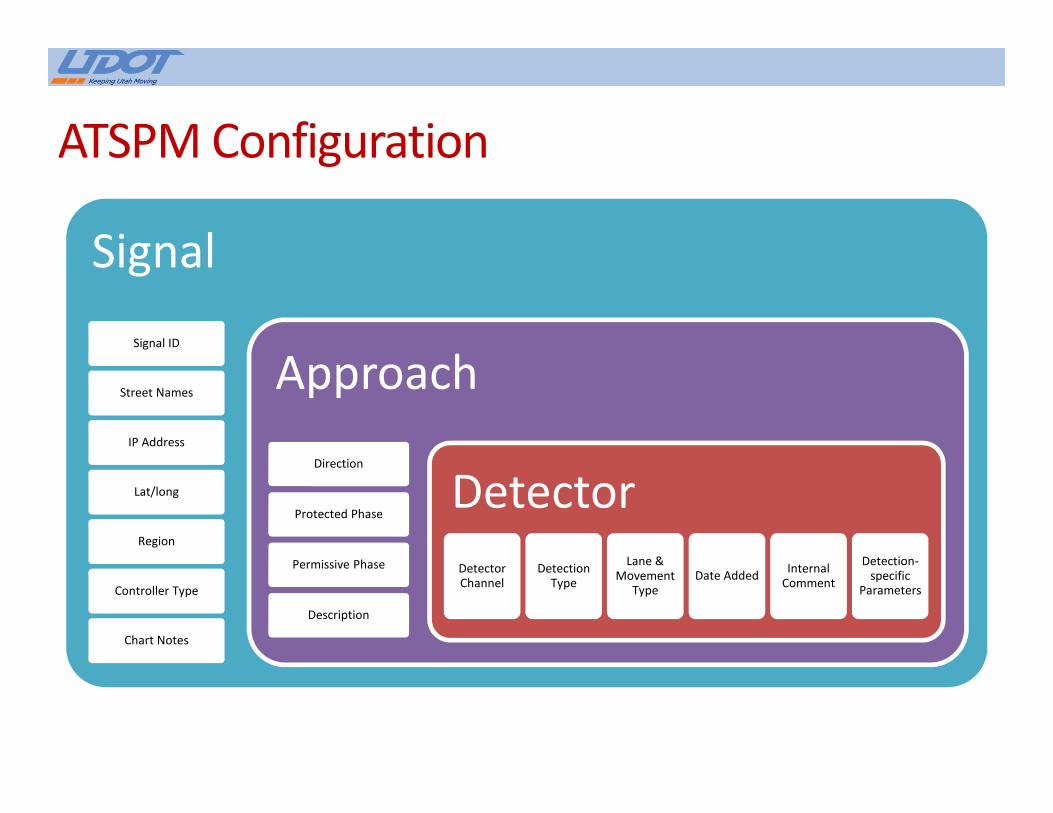
ATSPM Configuration
Signal
Signal ID
Street Names
IP Address
Lat/long
Region
Controller Type
Chart Notes
Approach
Direction
Protected Phase
Permissive Phase
Description
Detector
Detector Channel
Detection Type
Lane & Movement
TypeDate Added
Internal Comment
Detection-specific
Parameters

ATSPM Configuration - Signal
If unchecked, signal will still
show in Signal List. If unchecked
and IP is configured, the system
will still retrieve data.
Expand to create notes that will appear
when displaying a metric for this signal

ATSPM Configuration – Approach
Detector’s primary phase. Usually
the phase for through movement
and the protected phase for P&P
left turns.
Secondary phase for detector.
Usually 0 for through movements
and protected-only left turns.
Input the permissive phase for
P&P left turns.
Approach direction Informational text for
Phase/Direction header
Indicates the number in
Protected Phase is the
overlap number.
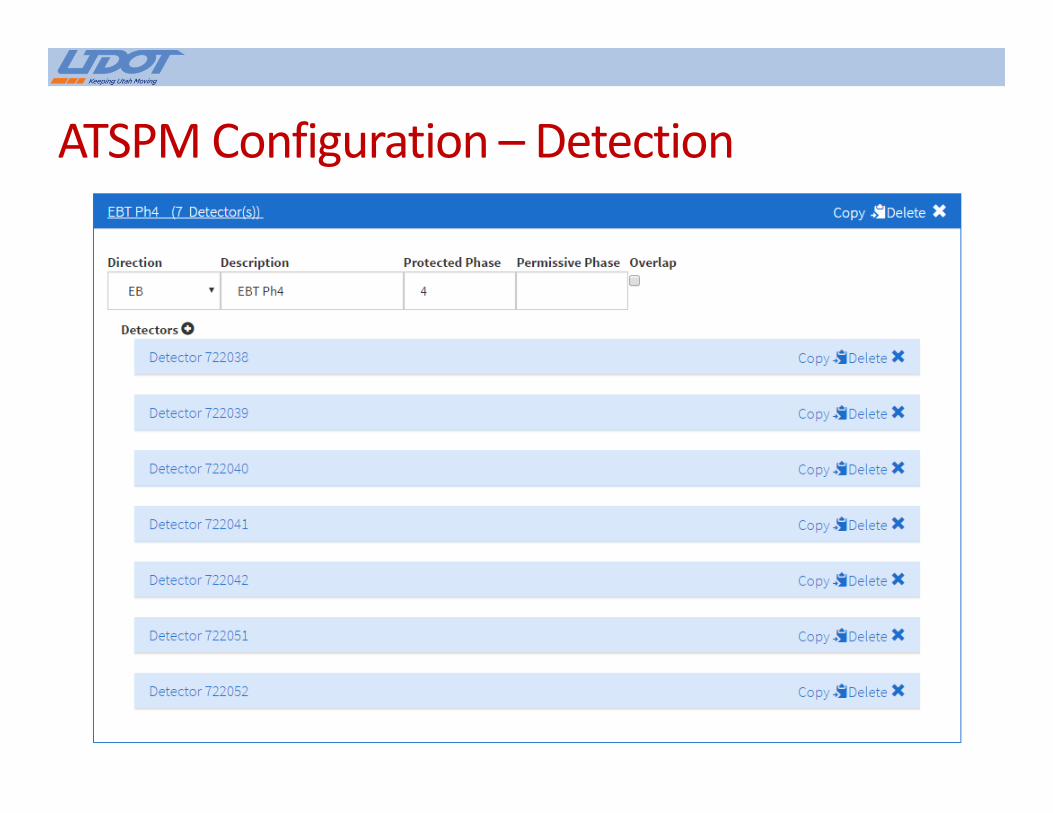
ATSPM Configuration – Detection

ATSPM Configuration – Detection
Internal only
Currently unused
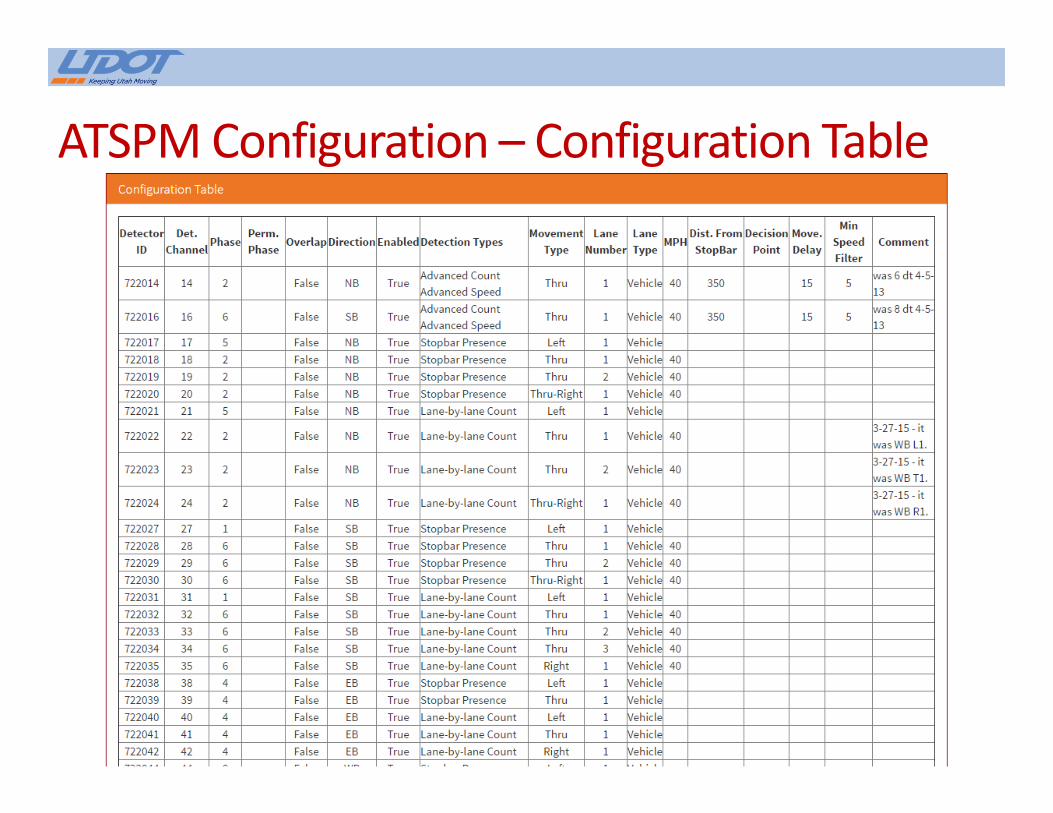
ATSPM Configuration – Configuration Table
DETECTION TYPESUDOT Automated Traffic Signal Performance Measures
Jamie Mackey, P.E, PTOE
UDOT Statewide Signal Engineer
2017 UDOT ATSPM Installer Workshop • Salt Lake City, UT • January 18-19, 2017
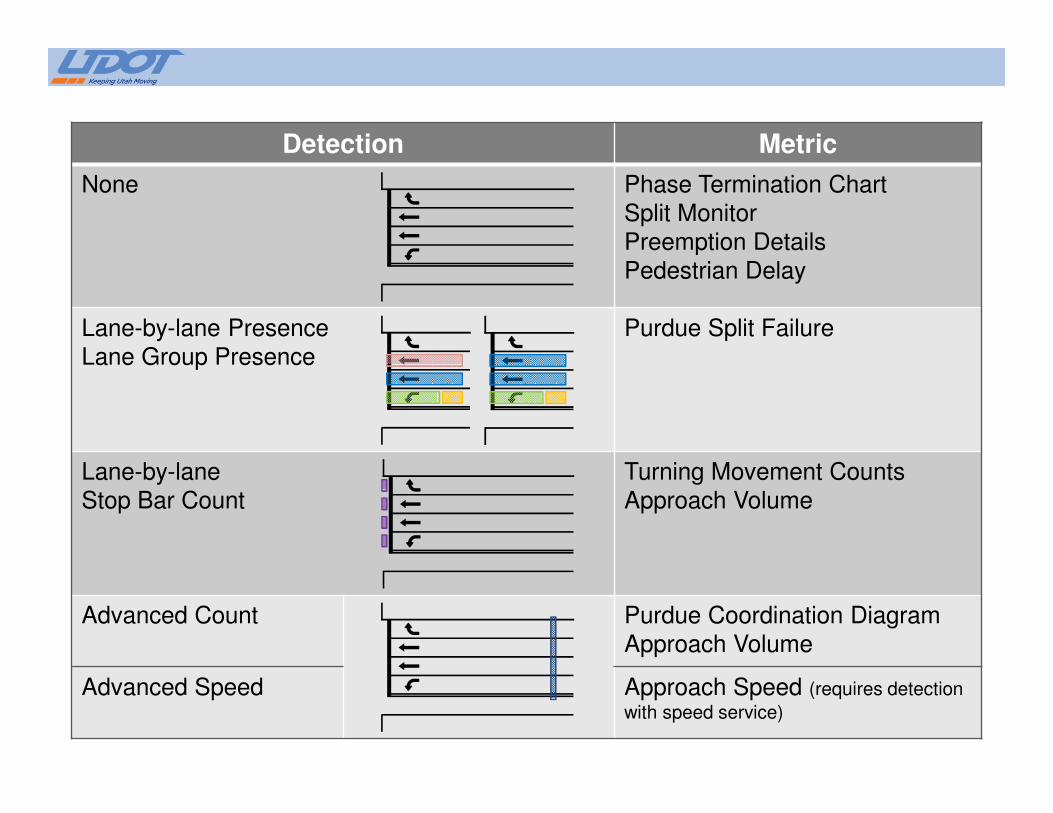
Detection Metric
None Phase Termination Chart
Split Monitor
Preemption Details
Pedestrian Delay
Lane-by-lane Presence
Lane Group Presence
Purdue Split Failure
Lane-by-lane
Stop Bar Count
Turning Movement Counts
Approach Volume
Advanced Count Purdue Coordination Diagram
Approach Volume
Advanced Speed Approach Speed (requires detection
with speed service)
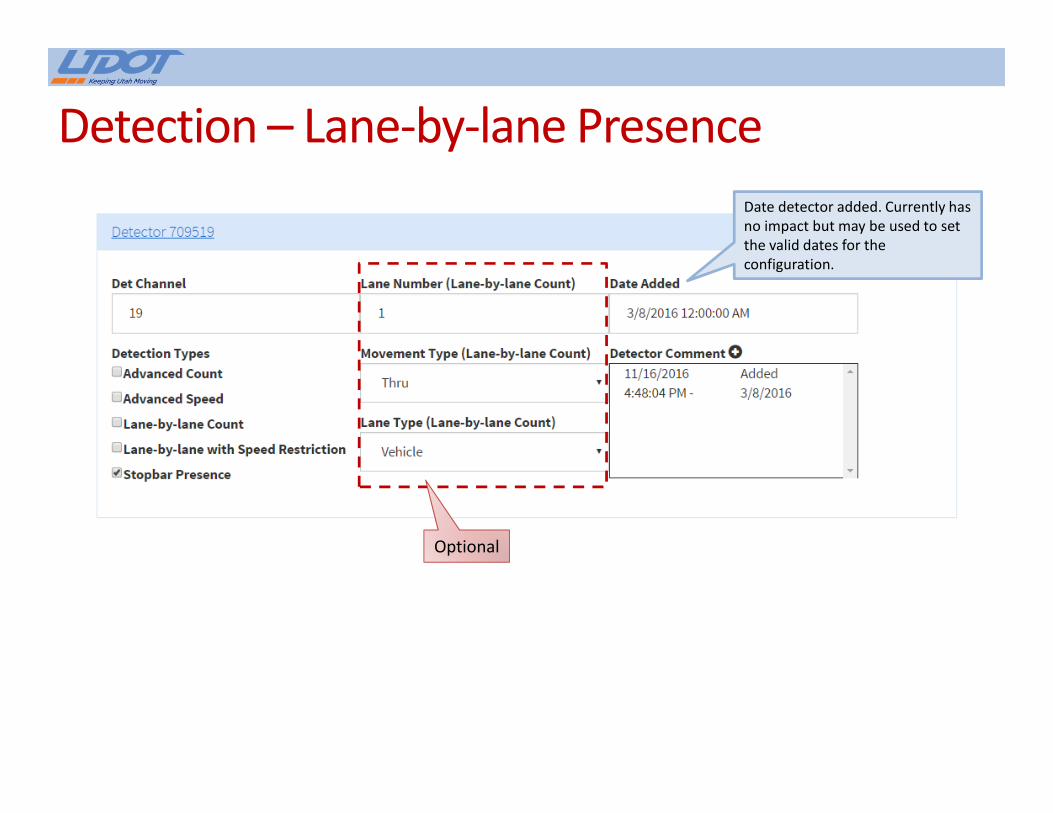
Detection – Lane-by-lane Presence
Optional
Date detector added. Currently has
no impact but may be used to set
the valid dates for the
configuration.

Detection – Lane-by-lane Count

Detection – Lane-by-lane Count w/ Speed Restriction
Optional
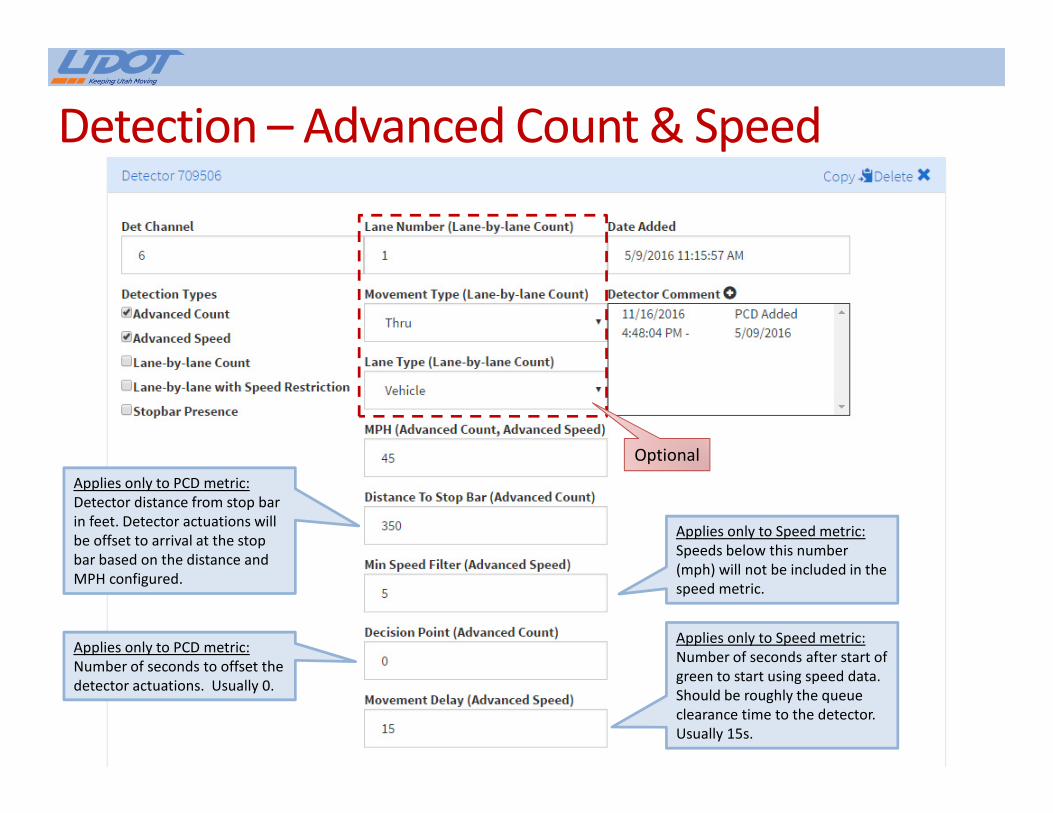
Detection – Advanced Count & Speed
Optional
Applies only to PCD metric:
Detector distance from stop bar
in feet. Detector actuations will
be offset to arrival at the stop
bar based on the distance and
MPH configured.
Applies only to PCD metric:
Number of seconds to offset the
detector actuations. Usually 0.
Applies only to Speed metric:
Number of seconds after start of
green to start using speed data.
Should be roughly the queue
clearance time to the detector.
Usually 15s.
Applies only to Speed metric:
Speeds below this number
(mph) will not be included in the
speed metric.
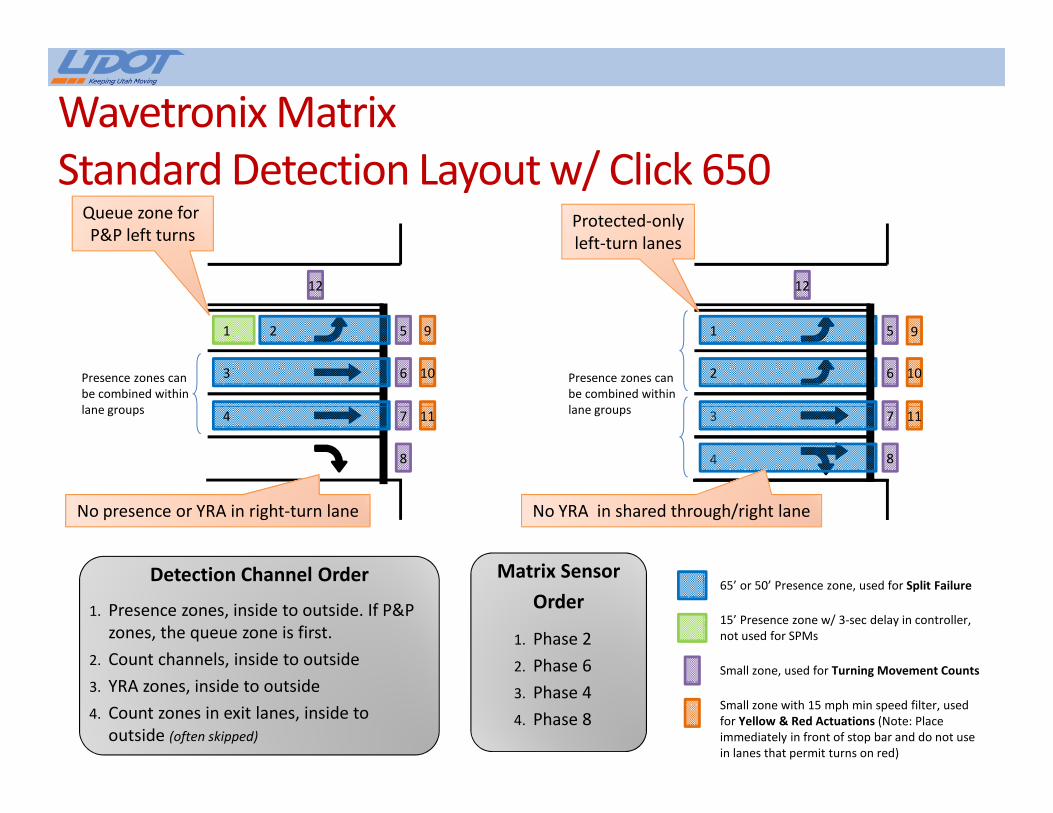
Wavetronix Matrix
Standard Detection Layout w/ Click 650
1 2
3
4
5
6
7
8
9
10
11
Presence zones can
be combined within
lane groups
12
No presence or YRA in right-turn lane
Queue zone for
P&P left turns
Detection Channel Order
1. Presence zones, inside to outside. If P&P
zones, the queue zone is first.
2. Count channels, inside to outside
3. YRA zones, inside to outside
4. Count zones in exit lanes, inside to
outside (often skipped)
65’ or 50’ Presence zone, used for Split Failure
15’ Presence zone w/ 3-sec delay in controller,
not used for SPMs
Small zone, used for Turning Movement Counts
Small zone with 15 mph min speed filter, used
for Yellow & Red Actuations (Note: Place
immediately in front of stop bar and do not use
in lanes that permit turns on red)
91
2
3
5
6
7
8
10
11
Presence zones can
be combined within
lane groups
12
4
Protected-only
left-turn lanes
No YRA in shared through/right lane
Matrix Sensor
Order
1. Phase 2
2. Phase 6
3. Phase 4
4. Phase 8
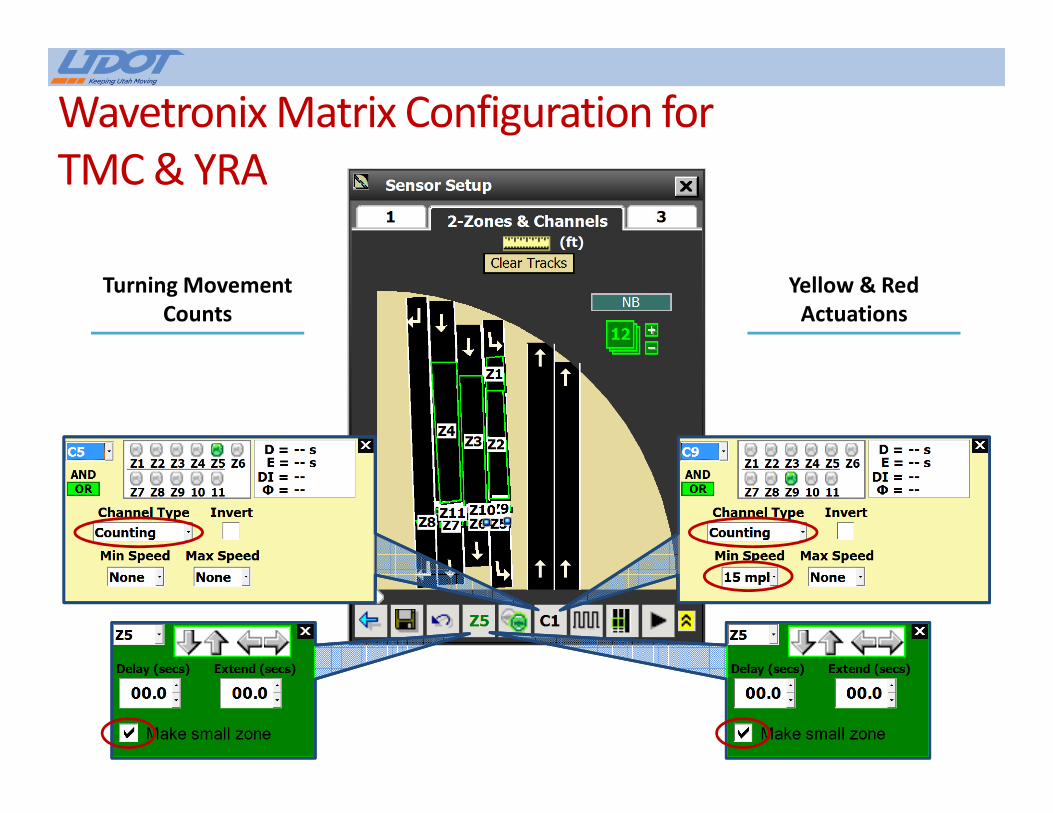
Wavetronix Matrix Configuration for
TMC & YRA
Turning Movement
Counts
Yellow & Red
Actuations
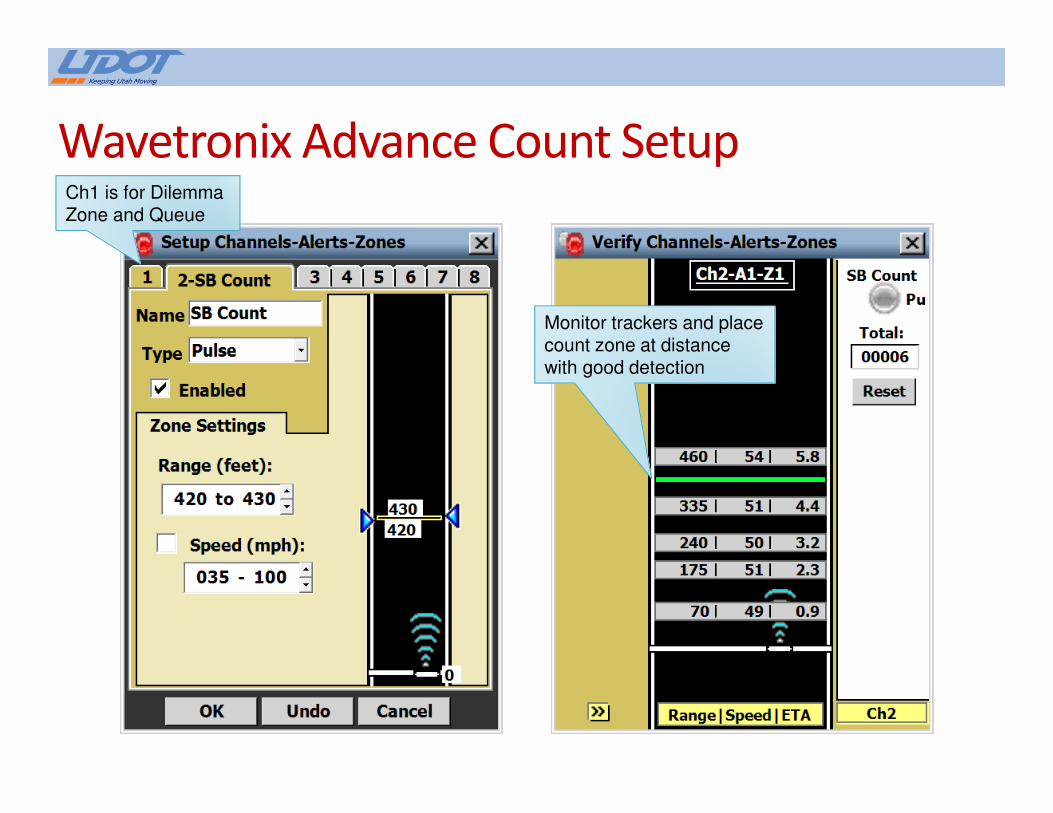
Wavetronix Advance Count SetupCh1 is for Dilemma Zone and Queue
Monitor trackers and placecount zone at distance with good detection
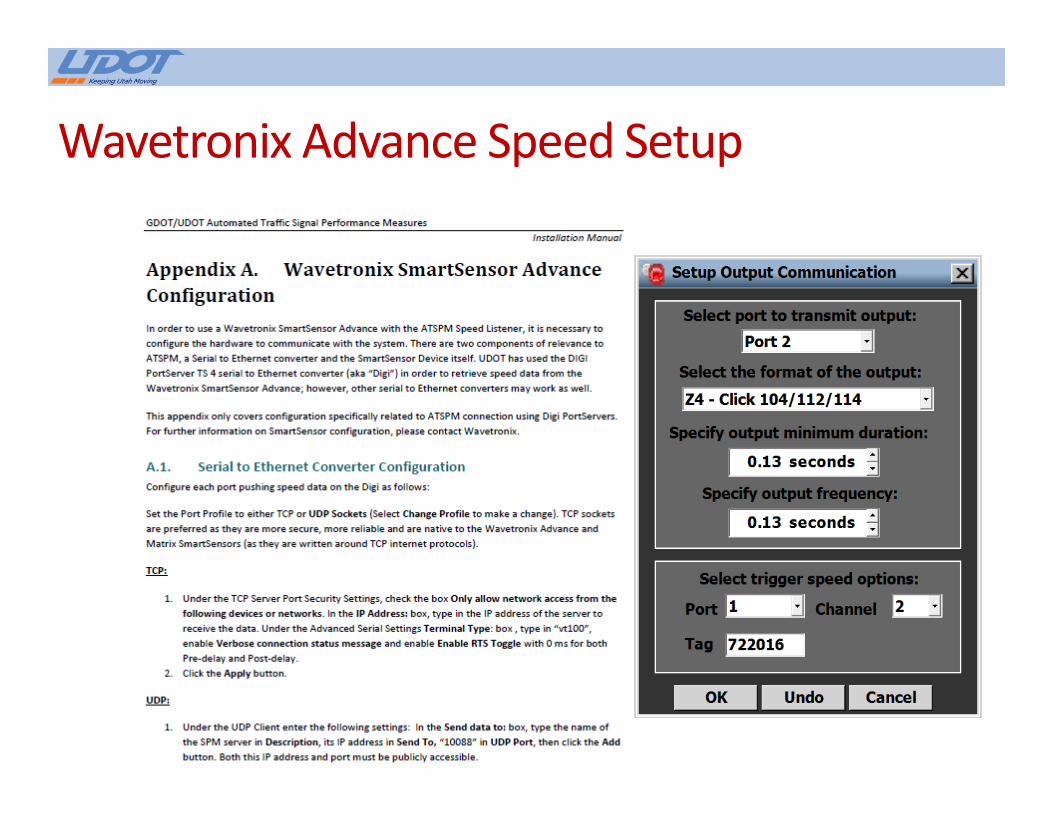
Wavetronix Advance Speed Setup
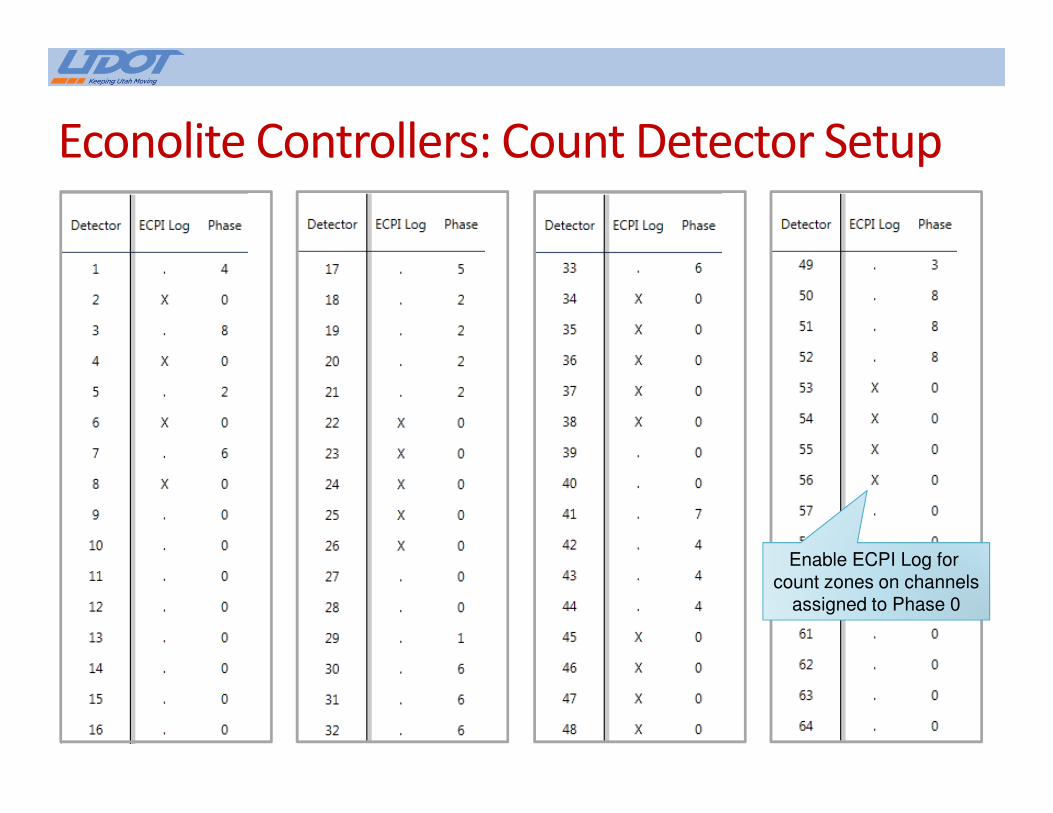
Econolite Controllers: Count Detector Setup
Enable ECPI Log for count zones on channels
assigned to Phase 0
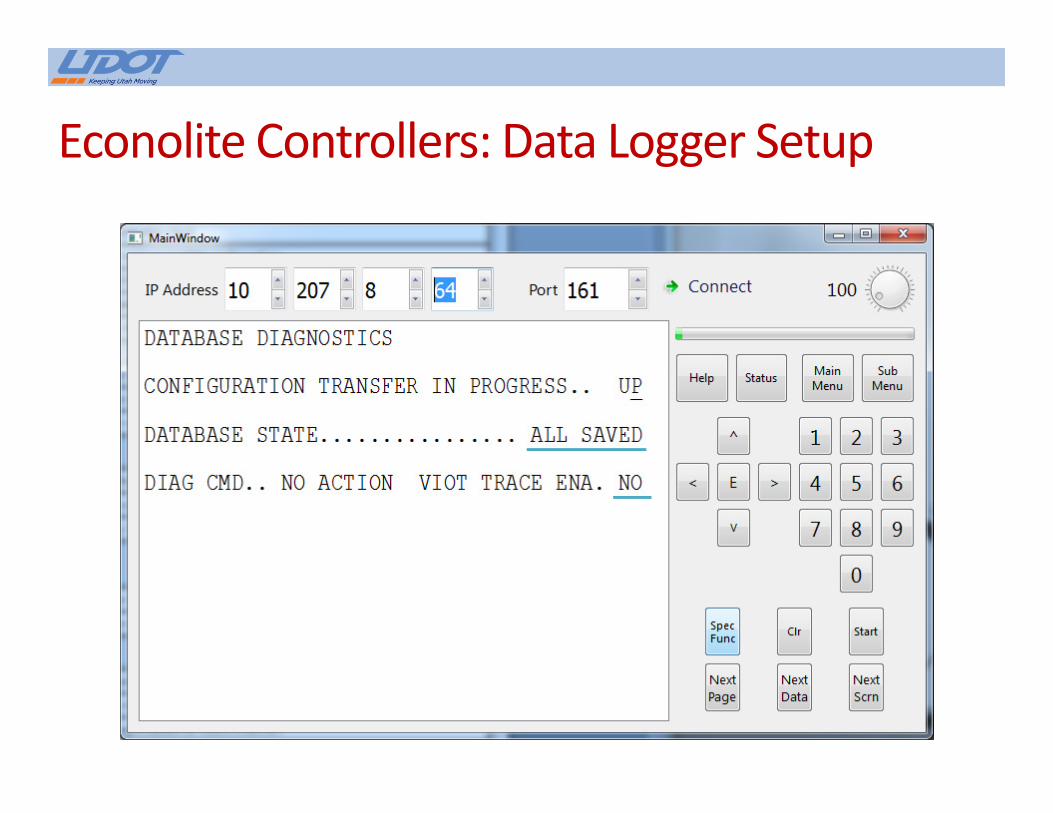
Econolite Controllers: Data Logger Setup

METRICSUDOT Automated Traffic Signal Performance Measures
Jamie Mackey, P.E, PTOE
UDOT Statewide Signal Engineer
2017 UDOT ATSPM Installer Workshop • Salt Lake City, UT • January 18-19, 2017
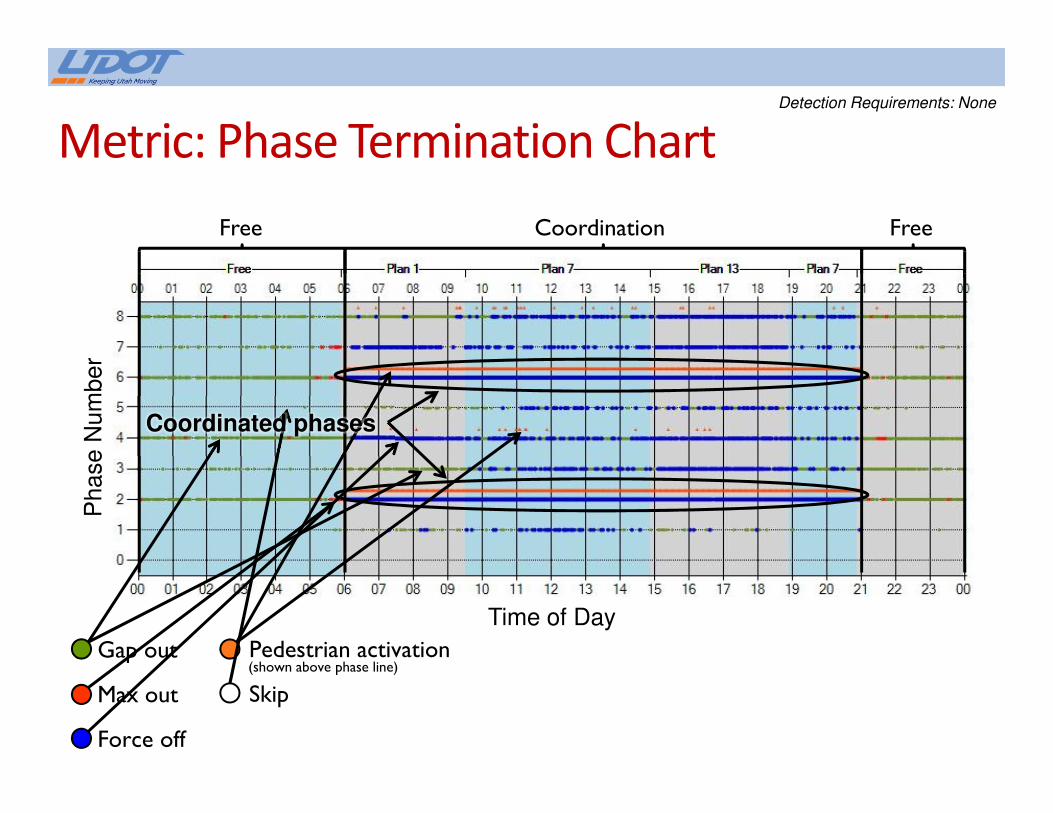
Gap out
Max out
Force off
Pedestrian activation
Skip
(shown above phase line)
Metric: Phase Termination Chart
Free FreeCoordination
Coordinated phases
Phase N
um
ber
Time of Day
Detection Requirements: None

Video detection not working at night
Complaint: Long red at 2 a.m., no other traffic
Metric: Purdue Phase TerminationDetection Requirements: None
Gap out
Max out
Force off
Pedestrian activation
Skip
(shown above phase line)
Minor street through & left turn max out at night only
Before
Detection Requirements: None
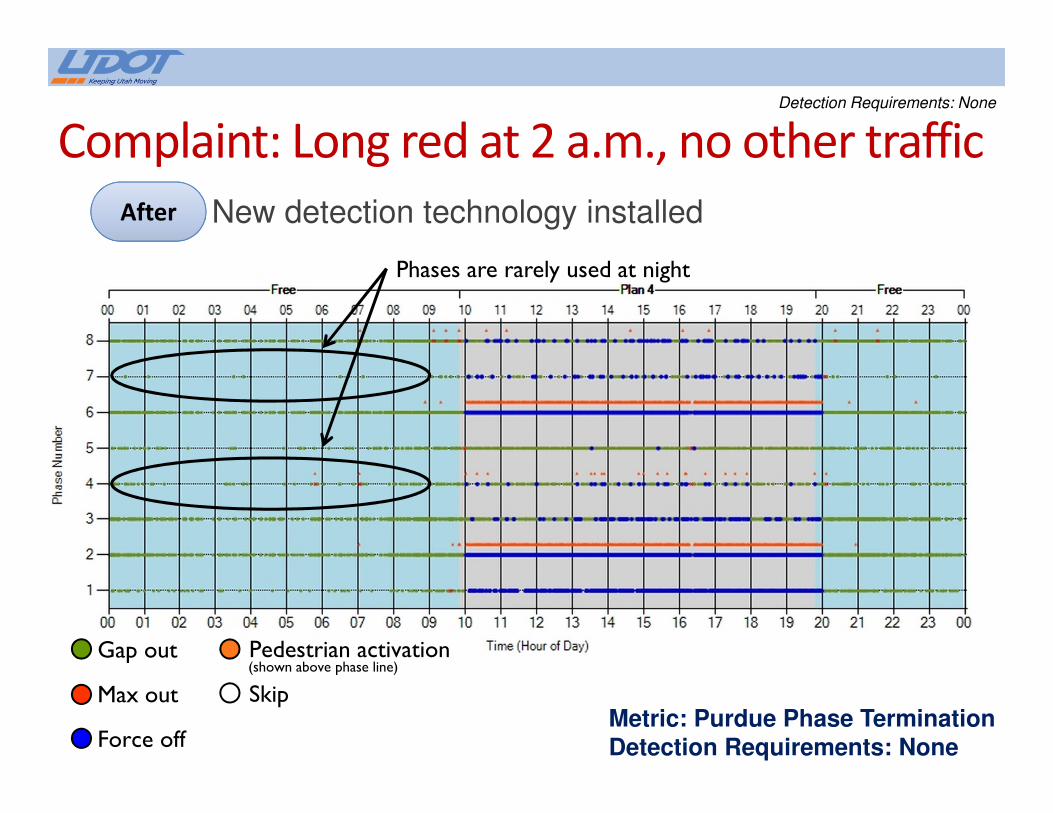
New detection technology installed
Complaint: Long red at 2 a.m., no other traffic
Metric: Purdue Phase TerminationDetection Requirements: None
Phases are rarely used at night
Gap out
Max out
Force off
Pedestrian activation
Skip
(shown above phase line)
After
Detection Requirements: None
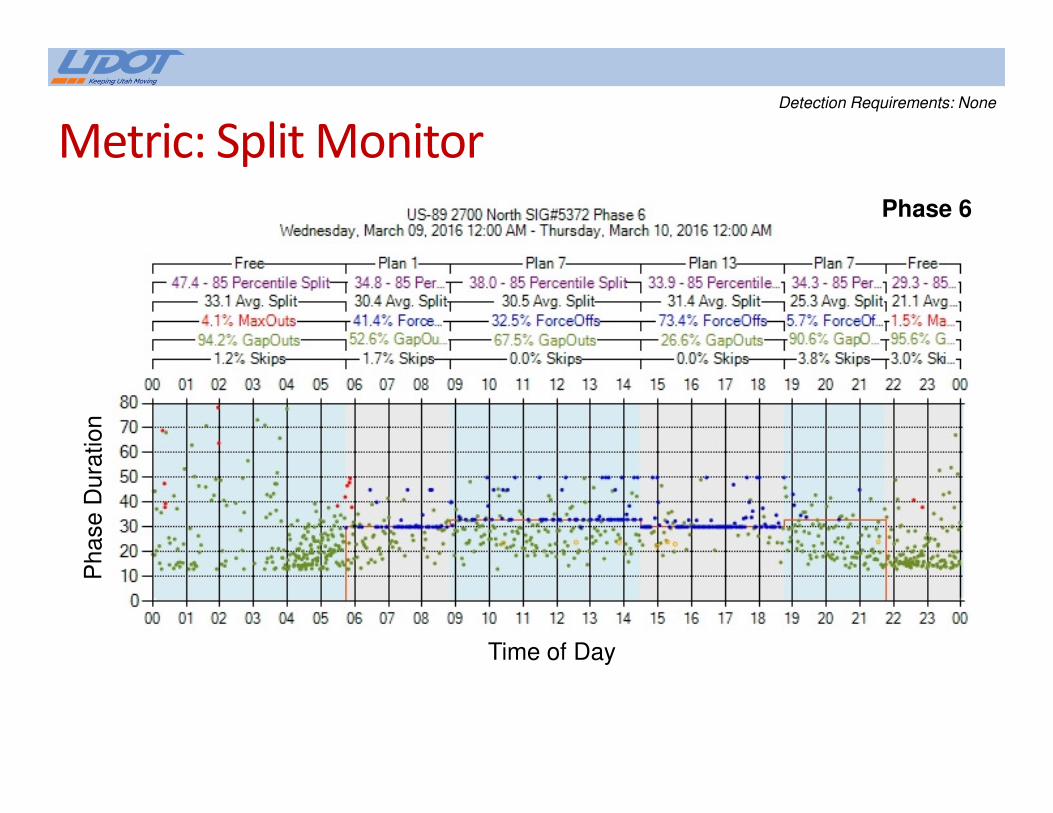
Metric: Split MonitorPhase 6
Phase D
ura
tion
Time of Day
Detection Requirements: None
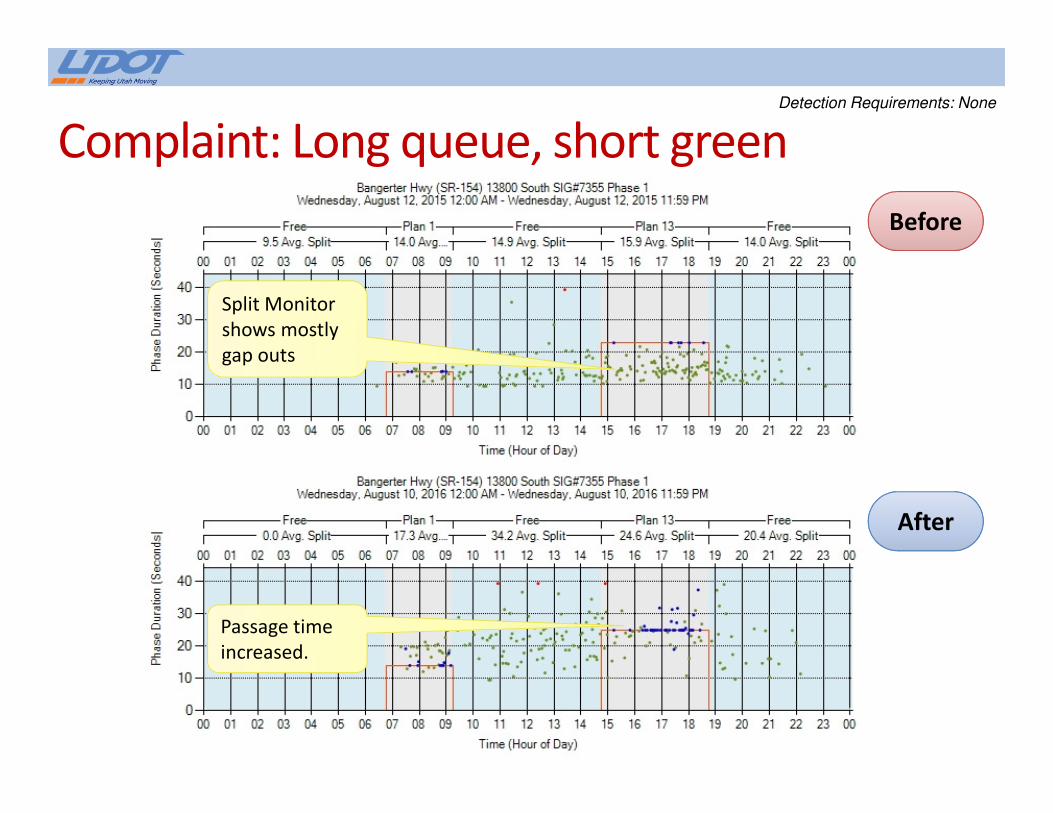
Complaint: Long queue, short green
Split Monitor
shows mostly
gap outs
Passage time
increased.
After
Before
Detection Requirements: None
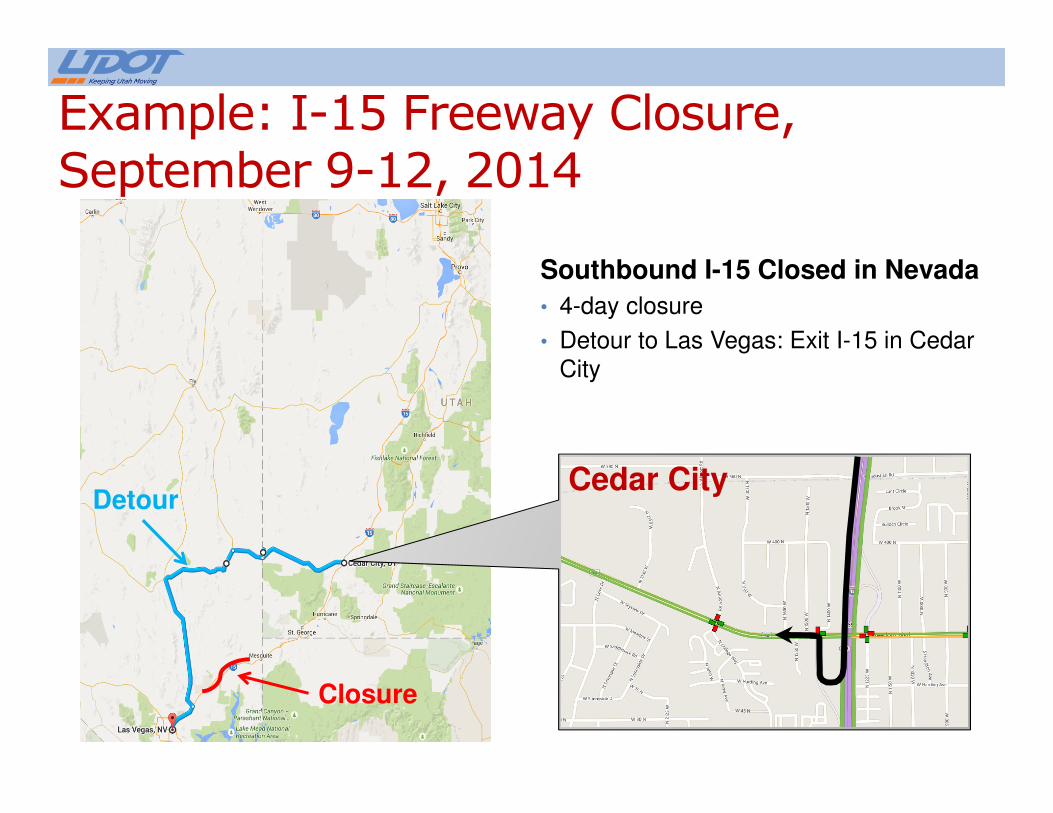
Closure
Example: I-15 Freeway Closure, September 9-12, 2014
Southbound I-15 Closed in Nevada
• 4-day closure
• Detour to Las Vegas: Exit I-15 in Cedar
City
DetourCedar City
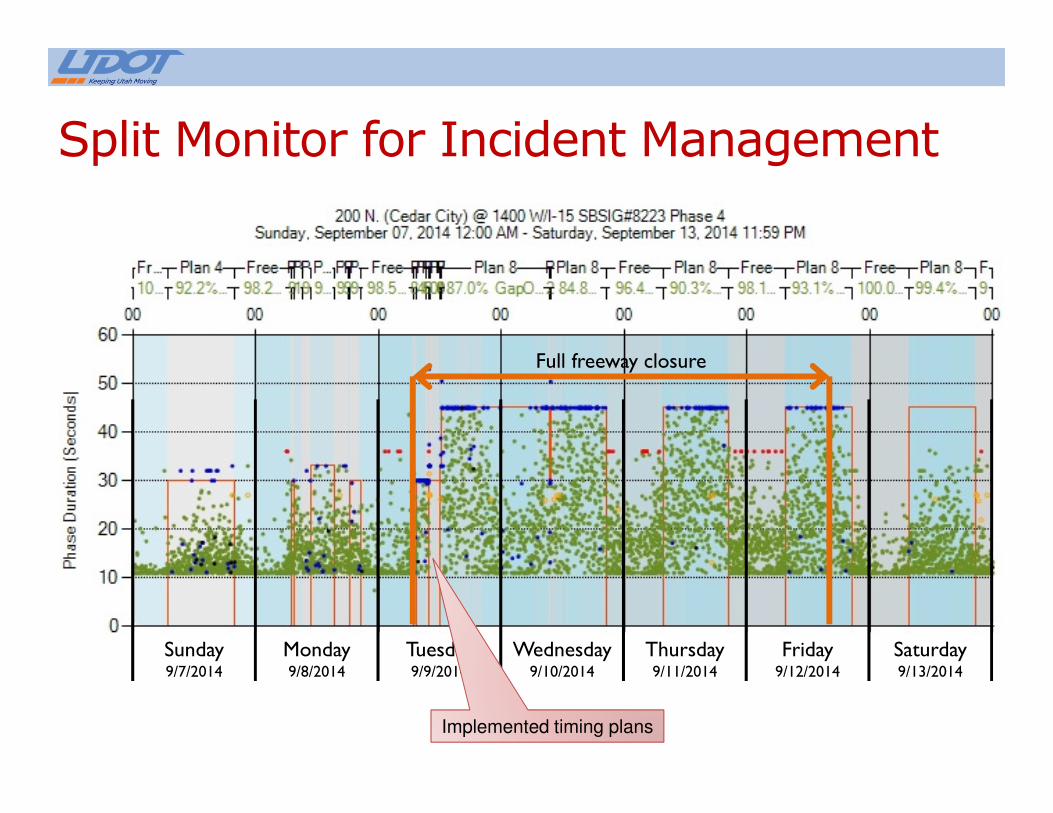
Sunday9/7/2014
Monday9/8/2014
Tuesday9/9/2014
Wednesday9/10/2014
Thursday9/11/2014
Friday9/12/2014
Saturday9/13/2014
Implemented timing plans
Split Monitor for Incident Management
Full freeway closure

Metric: Pedestrian Delay EVENT CODES
45 – Ped Call on
21 – Ped Walk on
Phase 2
Coordinated phase
Phase 4
Side street
Dela
y (
sec)
Time of Day
Time of Day
Dela
y (
sec)
Detection Requirements: None

Metric: Purdue Split Failure
Occupancy (
%)
Time of Day
Detection Requirements: Stop bar presence
Split Fail = GOR & ROR5 ≥ 80%
Green Occupancy Ratio (GOR) = % of time stop bar detector
is ON during GREEN
Red Occupancy Ratio (ROR5) = % of time stop bar detector
is ON during FIRST 5s of GREEN

Metric: Turning Movement Counts
Metric: Turning Movement CountsDetection Requirements: Stop Bar Counters
Volu
me (
VP
H)
Time of Day
Detection Requirements: Stop bar counts
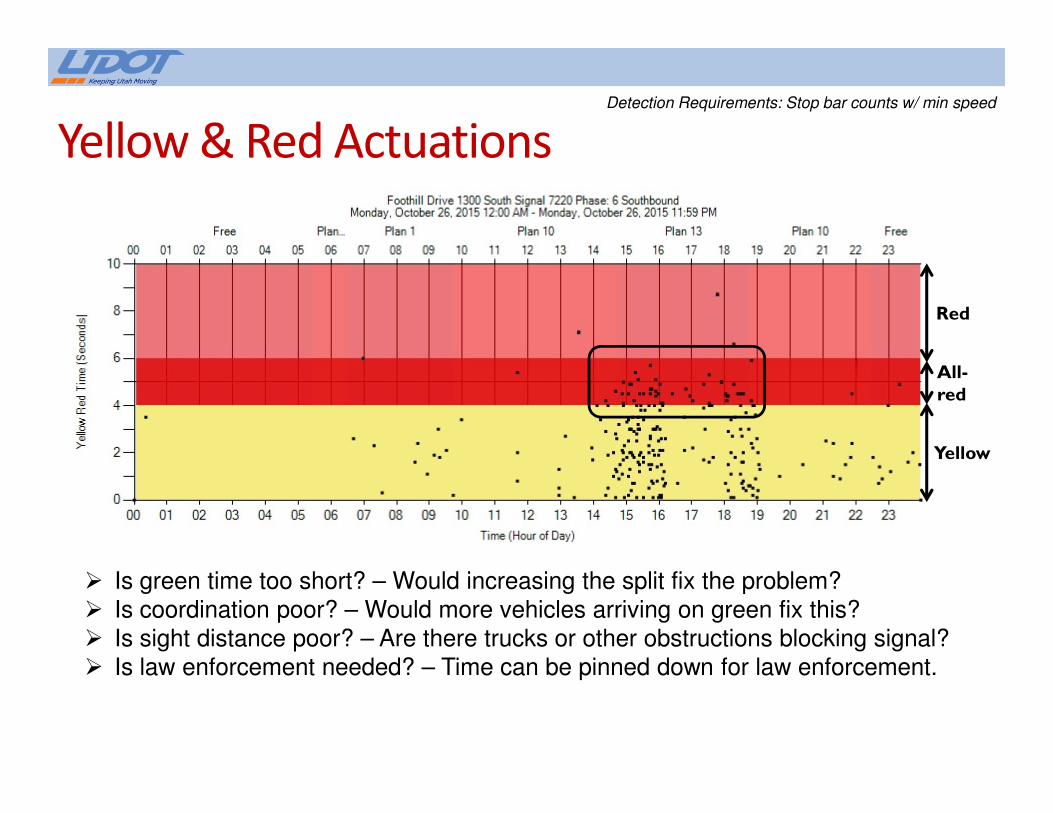
Yellow & Red Actuations
� Is green time too short? – Would increasing the split fix the problem?
� Is coordination poor? – Would more vehicles arriving on green fix this?
� Is sight distance poor? – Are there trucks or other obstructions blocking signal?
� Is law enforcement needed? – Time can be pinned down for law enforcement.
Yellow
All-
red
Red
Detection Requirements: Stop bar counts w/ min speed

Tim
e in C
ycle
(s)
Time of Day
Metric: Purdue Coordination DiagramDetection Requirements: Approach counts
Phase
Green
Phase
Red
Vehicle
arrivals
Queuing past sensor

Optimization Example: Progression Quality
Tim
e in C
ycle
(s)
Time of Day

Metric: Approach VolumeDetection Requirements: Stop bar counts or approach counts
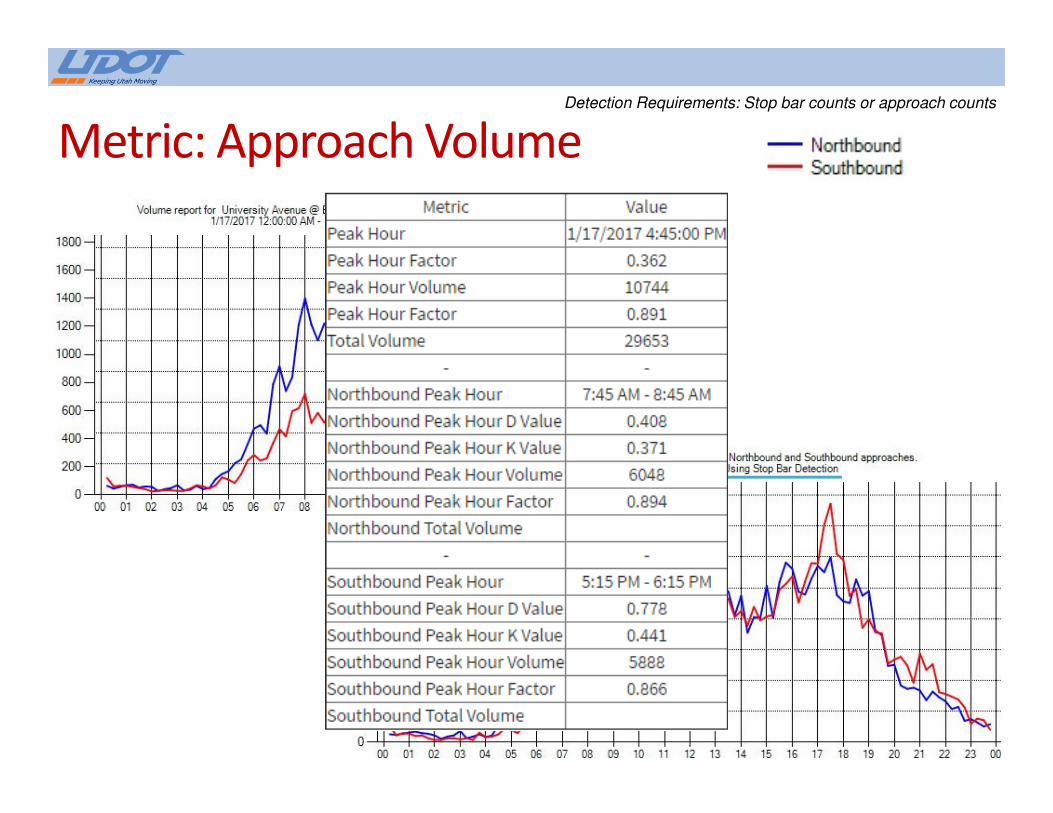
Metric: Approach VolumeDetection Requirements: Stop bar counts or approach counts
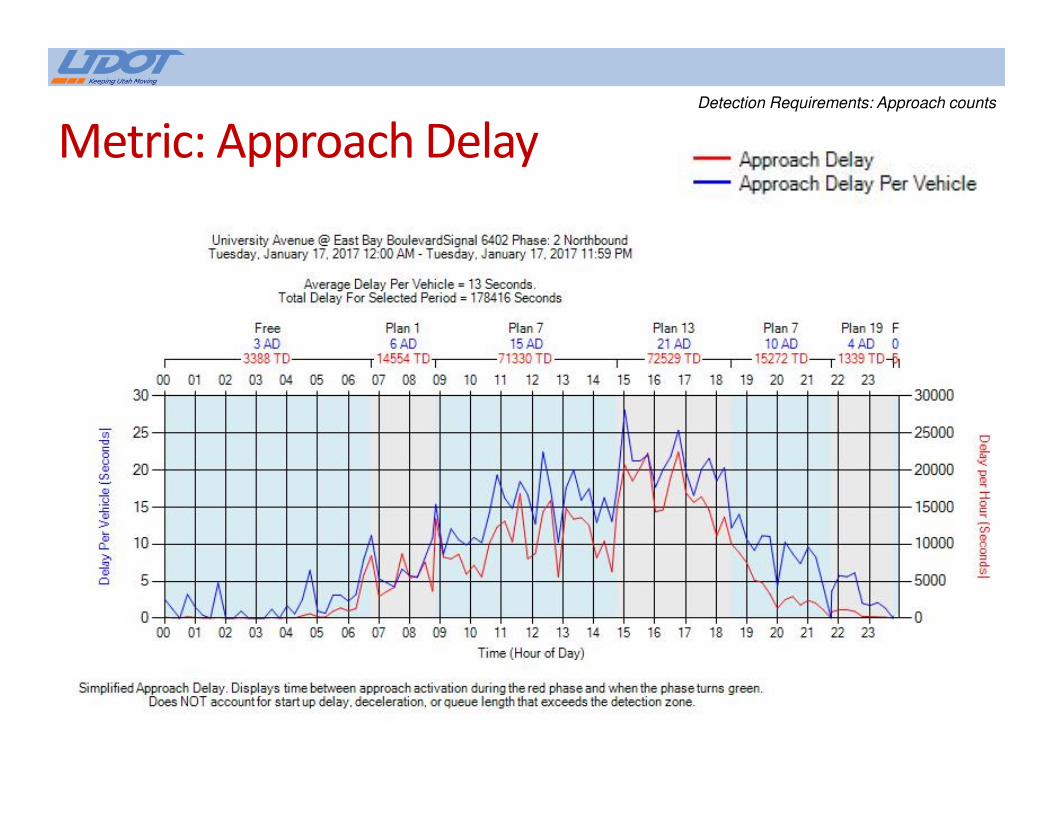
Metric: Approach DelayDetection Requirements: Approach counts
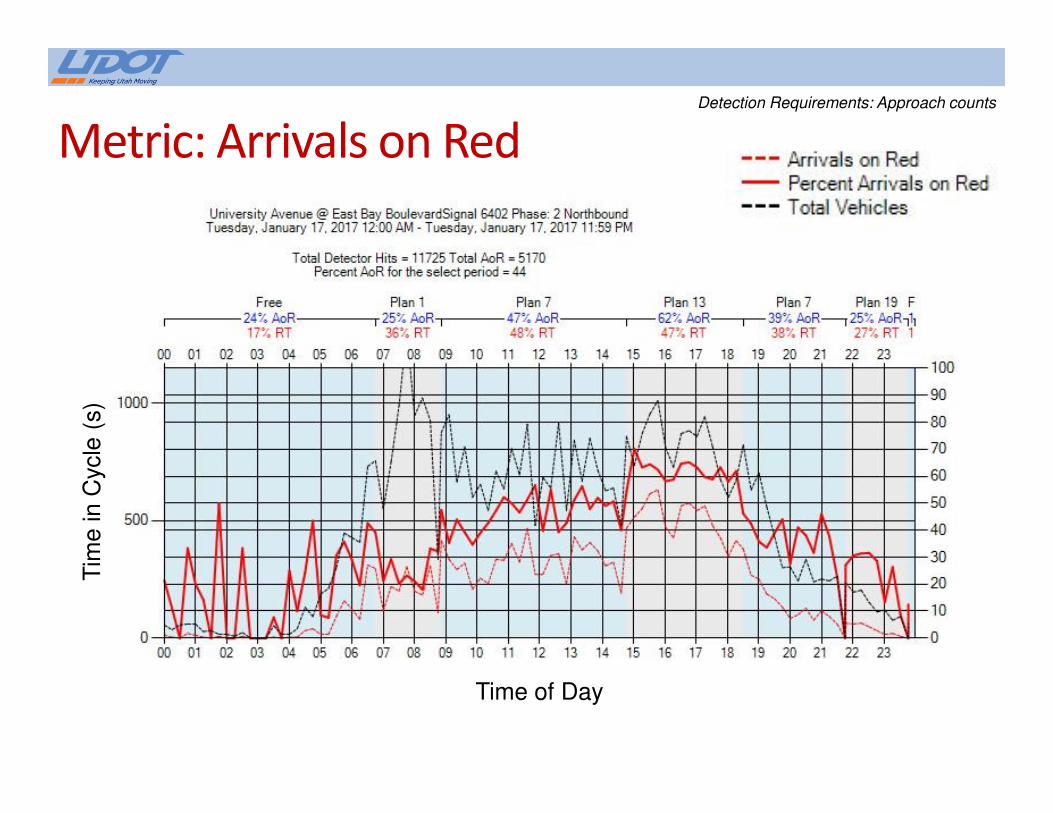
Metric: Arrivals on RedDetection Requirements: Approach counts
Tim
e in C
ycle
(s)
Time of Day
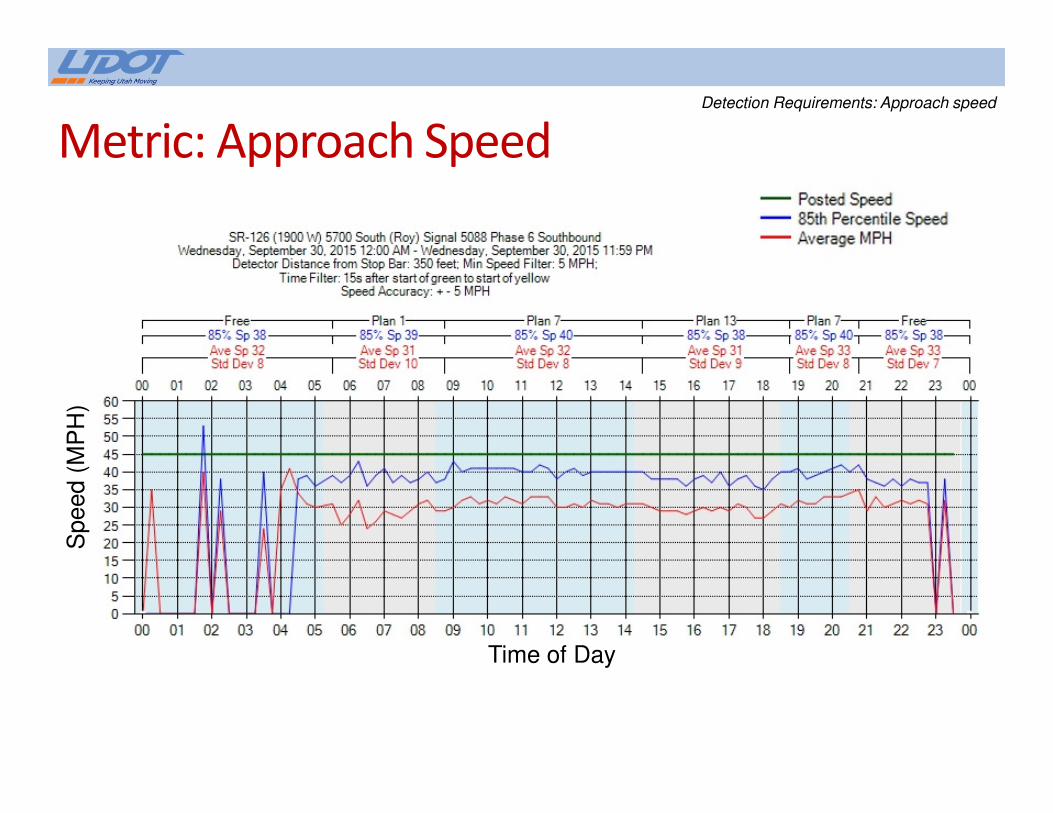
Metric: Approach Speed
Speed (
MP
H)
Time of Day
Detection Requirements: Approach speed
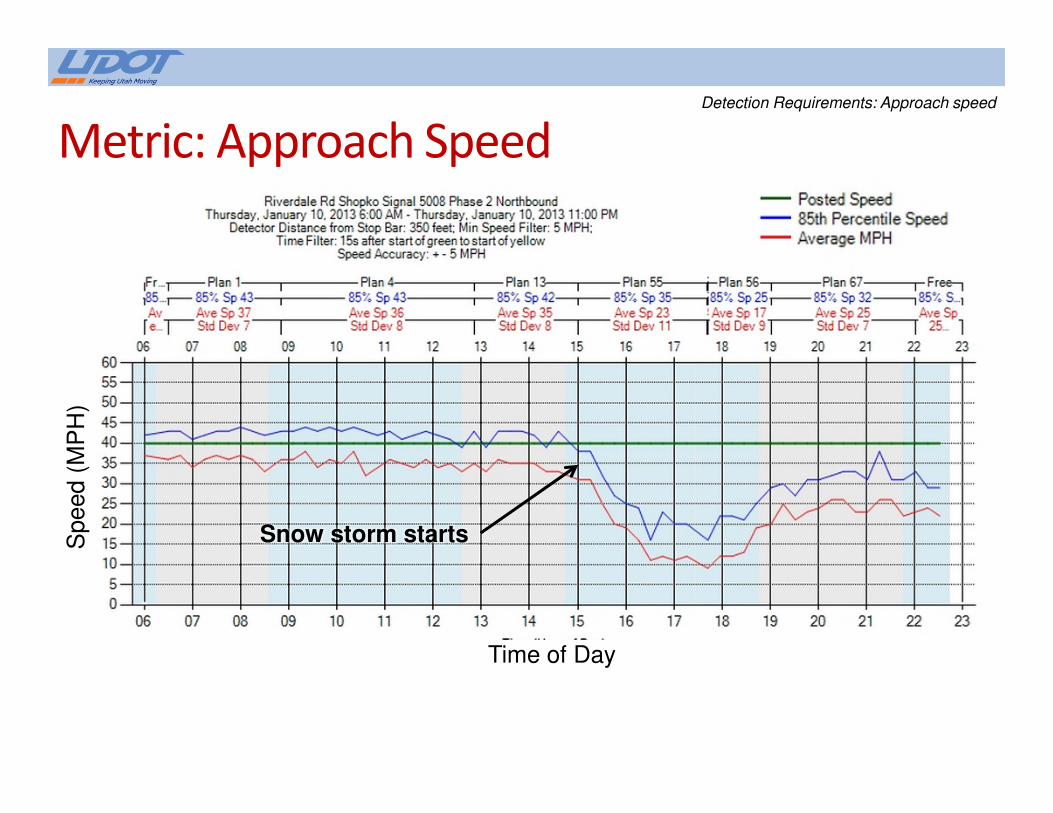
Metric: Approach Speed
Speed (
MP
H)
Time of Day
Snow storm starts
Detection Requirements: Approach speed
ROUTE CONFIGURATIONUDOT Automated Traffic Signal Performance Measures
Jamie Mackey, P.E, PTOE
UDOT Statewide Signal Engineer
2017 UDOT ATSPM Installer Workshop • Salt Lake City, UT • January 18-19, 2017

Route Configuration for Link Pivot
Direction of travel
to next signal
1
2
3
4
5
6
7
8
9
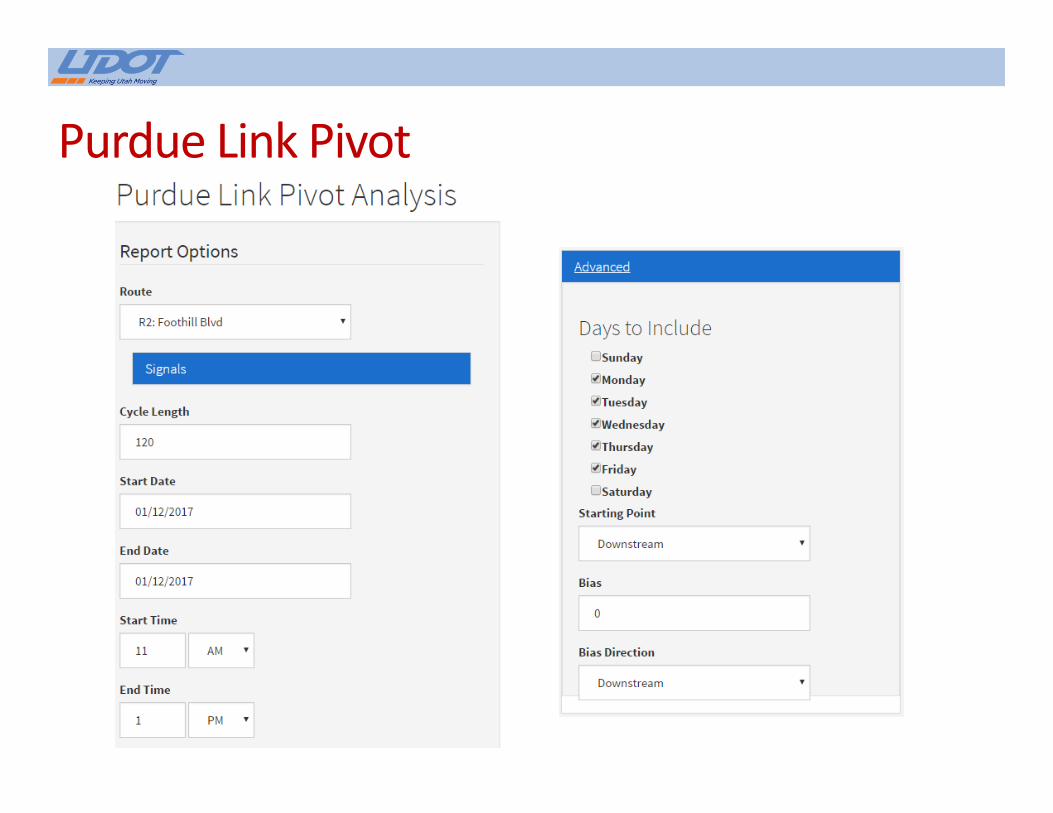
Purdue Link Pivot
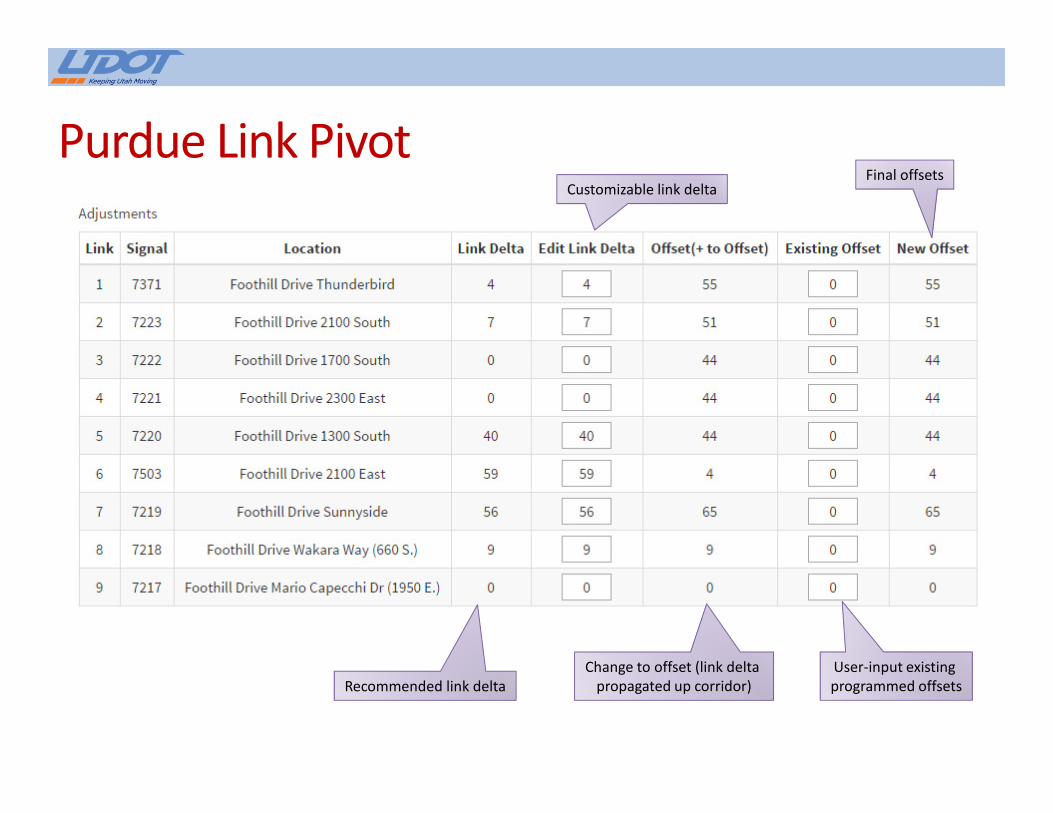
Purdue Link Pivot
Recommended link delta
Customizable link delta
Change to offset (link delta
propagated up corridor)
User-input existing
programmed offsets
Final offsets
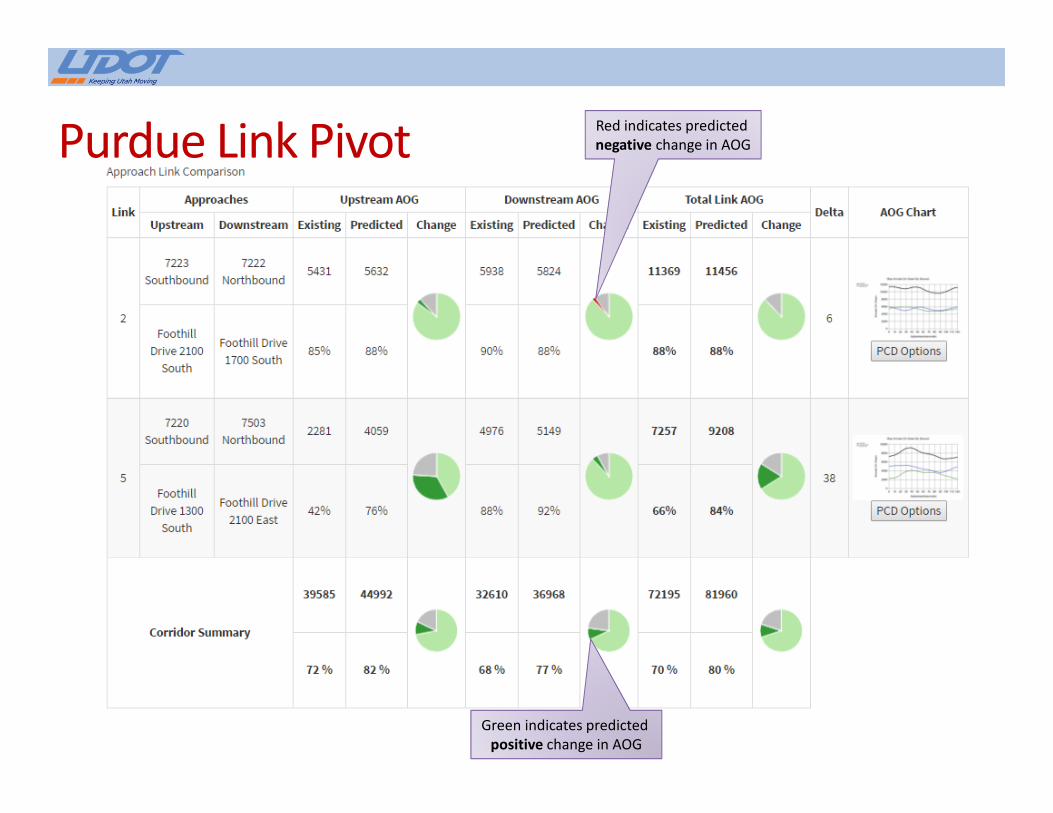
Purdue Link PivotRed indicates predicted
negative change in AOG
Green indicates predicted
positive change in AOG
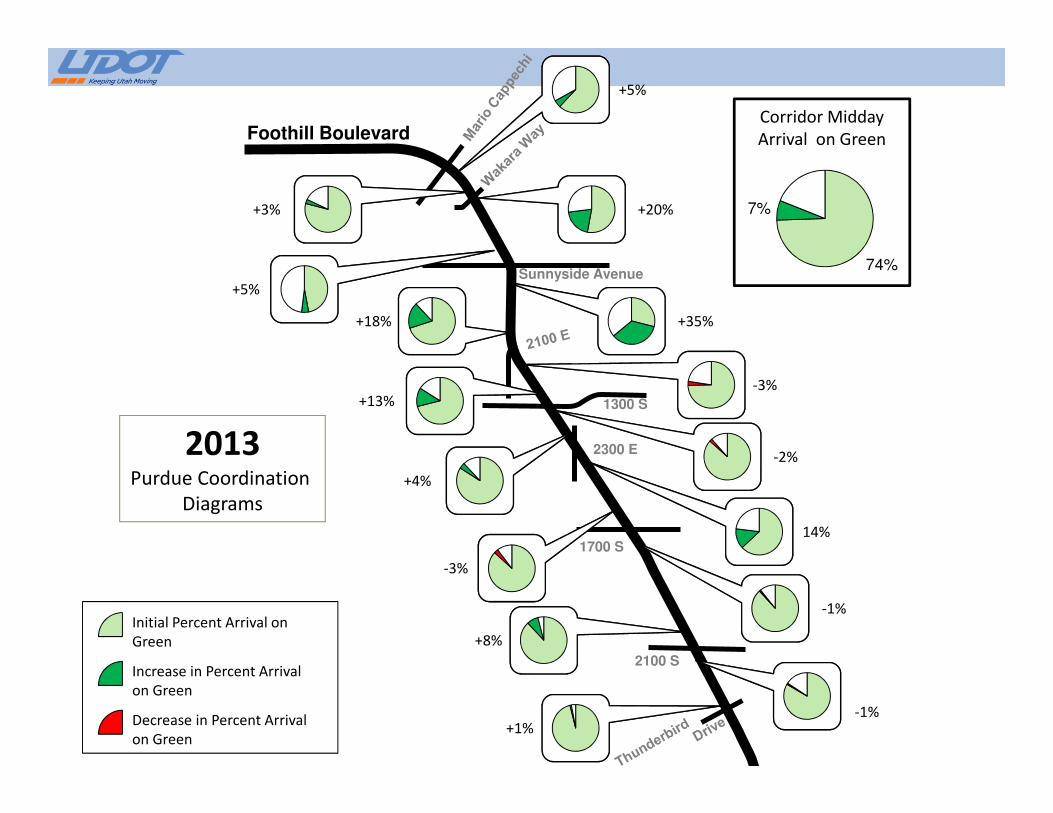
Sunnyside Avenue
1300 S
2300 E
1700 S
2100 S
Foothill Boulevard
+3%
+18%
+13%
+4%
-3%
+8%
+1%
+5%
+20%
+35%
-3%
-2%
-1%
+5%
14%
-1%
Initial Percent Arrival on
Green
Increase in Percent Arrival
on Green
Decrease in Percent Arrival
on Green
Corridor Midday
Arrival on Green
74%
7%
2013Purdue Coordination
Diagrams
ATSPM ALERTSUDOT Automated Traffic Signal Performance Measures
Jamie Mackey, P.E, PTOE
UDOT Statewide Signal Engineer
2017 UDOT ATSPM Installer Workshop • Salt Lake City, UT • January 18-19, 2017
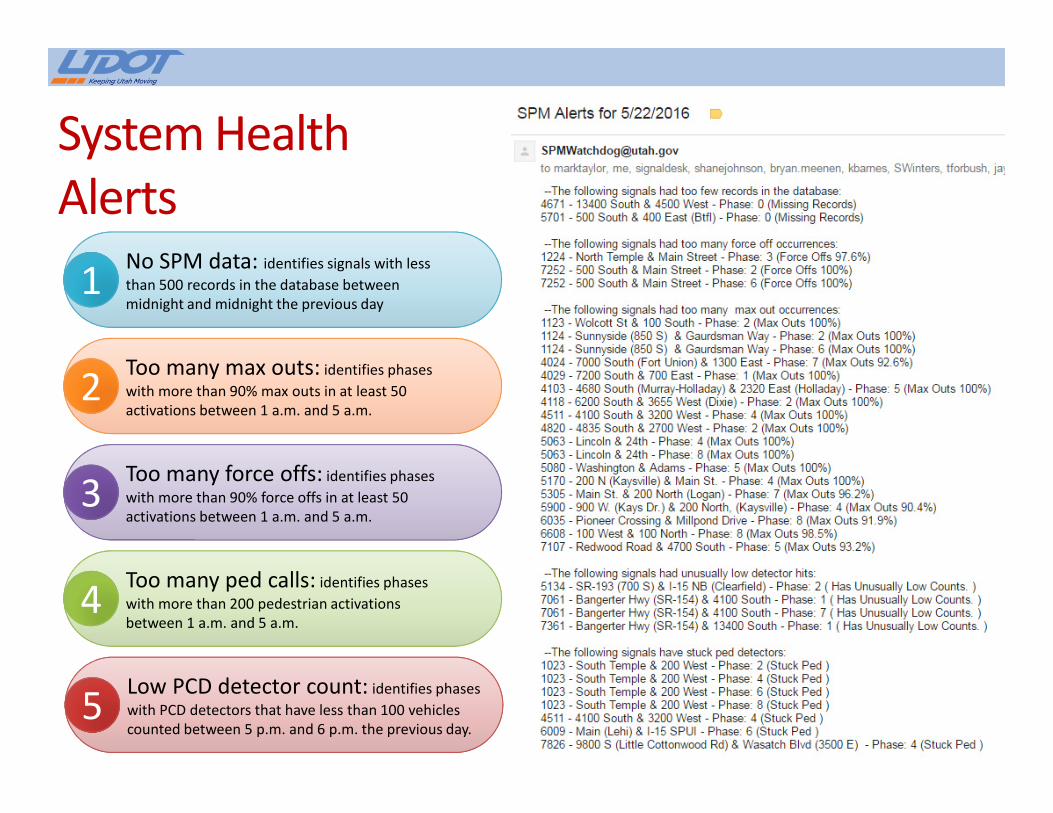
System Health
Alerts
Too many max outs: identifies phases
with more than 90% max outs in at least 50
activations between 1 a.m. and 5 a.m.22
No SPM data: identifies signals with less
than 500 records in the database between
midnight and midnight the previous day11
Too many force offs: identifies phases
with more than 90% force offs in at least 50
activations between 1 a.m. and 5 a.m. 33
Too many ped calls: identifies phases
with more than 200 pedestrian activations
between 1 a.m. and 5 a.m. 44
Low PCD detector count: identifies phases
with PCD detectors that have less than 100 vehicles
counted between 5 p.m. and 6 p.m. the previous day.55

Alert
Evaluation
Check for recalls
Consider whether a bandaid is necessary
Check for constant call on a detector channelToo many max
outs22
Check communication to signal
Check controller clock
Check IP address in SPM configuration
Check VIOT = NO & DB State = All Saved (Econolite MM 9-3-1 SpFn*3)
Try enabling Upload Current
Create a WO to cold start the controller
No ATSPM data11
Should the signal be in coordination?
Is a non-coordinated phase maxing out?
Skip only 2-6 pairs and dummy phases
Too many force
offs33
Check for recalls
Check for constant call on a detector channel
Too many ped
calls44
Is count channel configured correctly in SPM Config Tool?
Is ECPI Log enabled for count channel?
Is the detector working?
Is the detector communicating to the controller?
Try resetting the sensor and VERIFY with Upload Current
Note: Evaluate the VOLUME on the PCD charts, not the phase data
Low PCD
detector count55
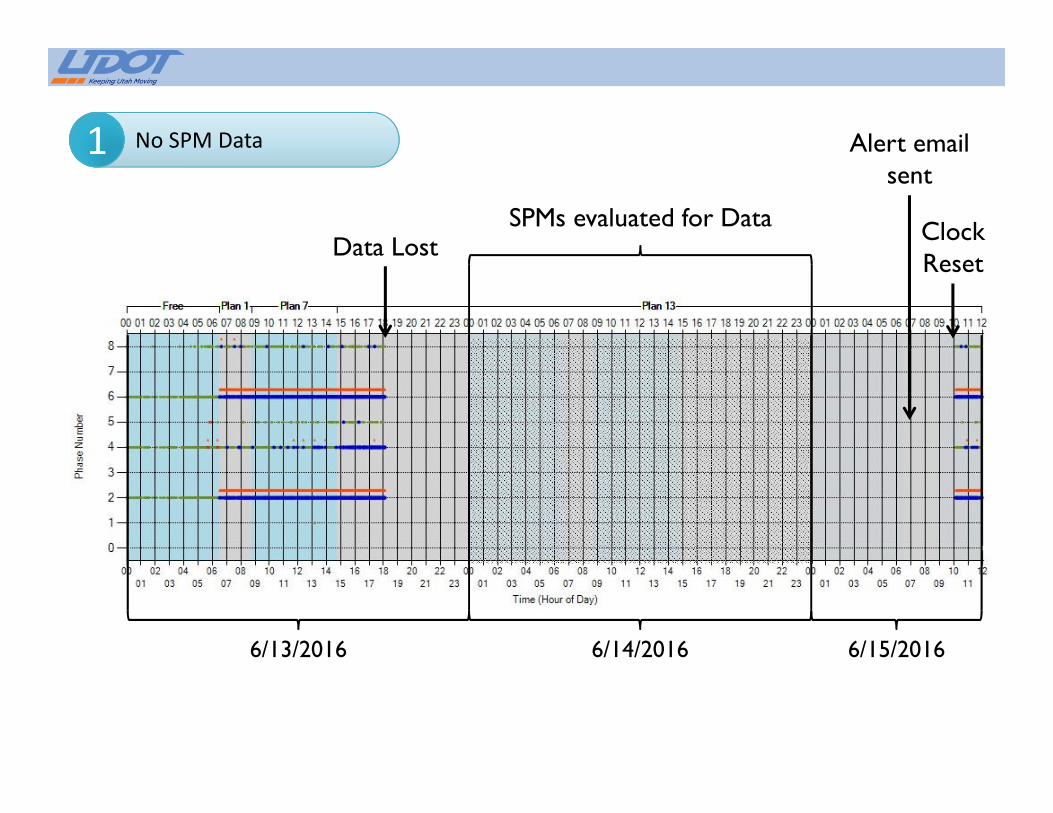
6/13/2016 6/15/2016
SPMs evaluated for Data
Alert emailsent
6/14/2016
Data LostClockReset
No SPM Data11
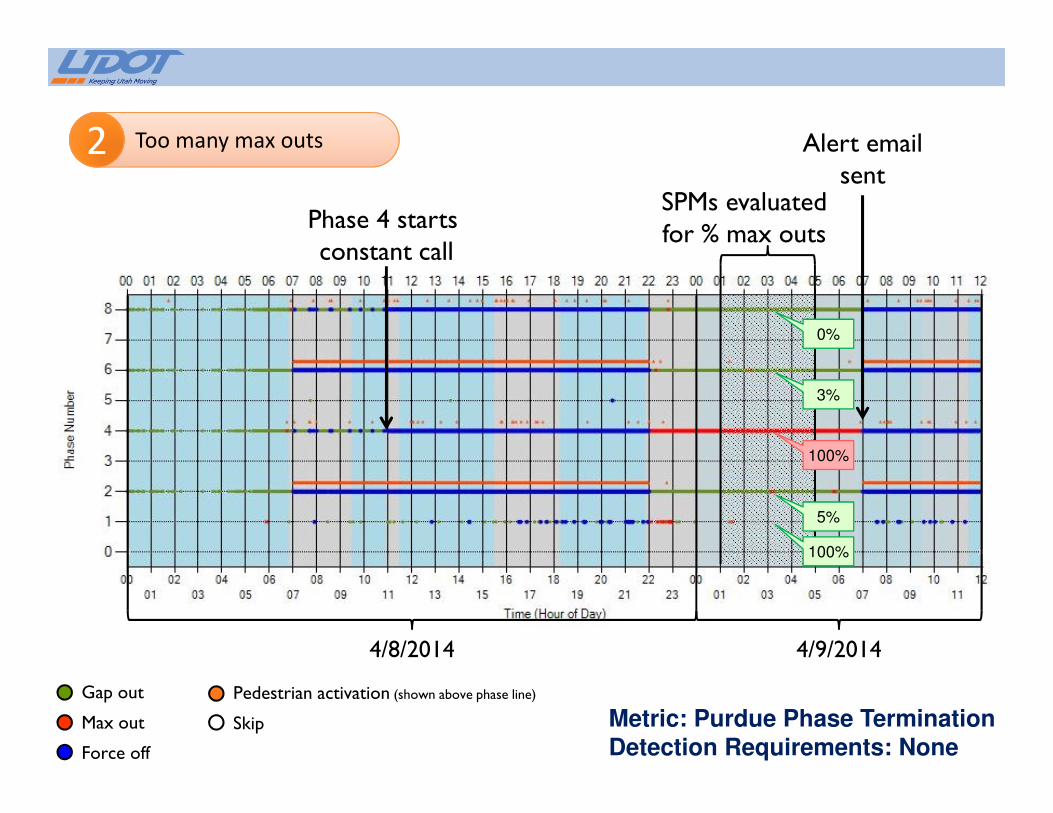
Metric: Purdue Phase TerminationDetection Requirements: None
Phase 4 starts constant call
4/8/2014 4/9/2014
SPMs evaluated for % max outs
Alert emailsent
Gap out
Max out
Force off
Pedestrian activation (shown above phase line)
Skip
Too many max outs22
0%
100%
3%
5%
100%

5/30/2016 6/1/2016
Alert emailsent
5/31/2016
Incident Plans Scheduled
Too many force offs33 Phases evaluated for % Force Offs
0%
0%
0%
100%
100%
2%
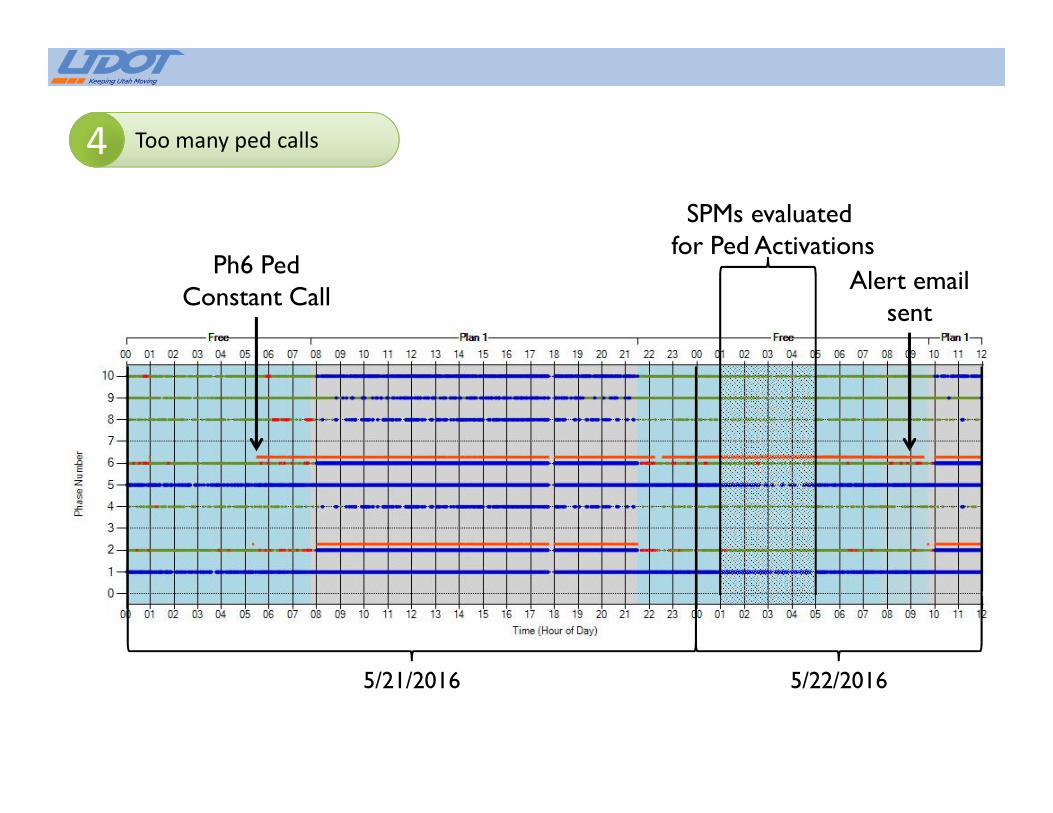
5/21/2016 5/22/2016
SPMs evaluated for Ped Activations
Alert emailsent
Ph6 PedConstant Call
Too many ped calls44
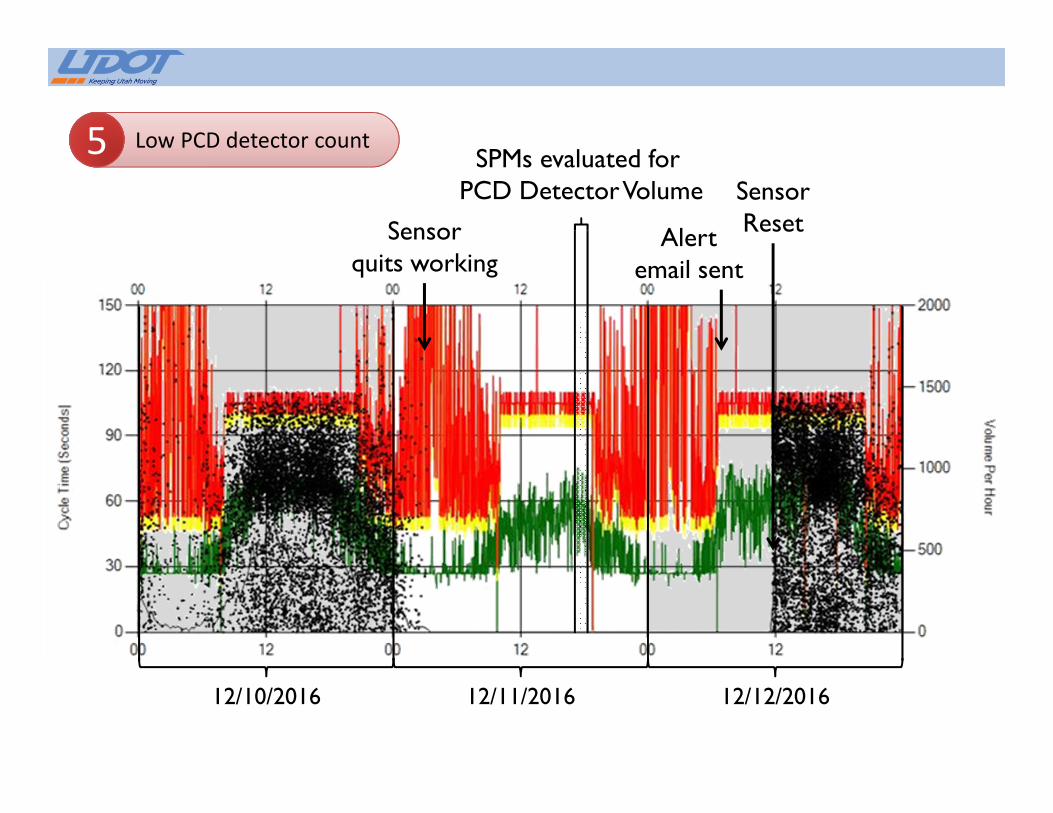
12/10/2016 12/12/2016
Alertemail sent
12/11/2016
SPMs evaluated for PCD Detector Volume Sensor
ResetSensorquits working
Low PCD detector count55
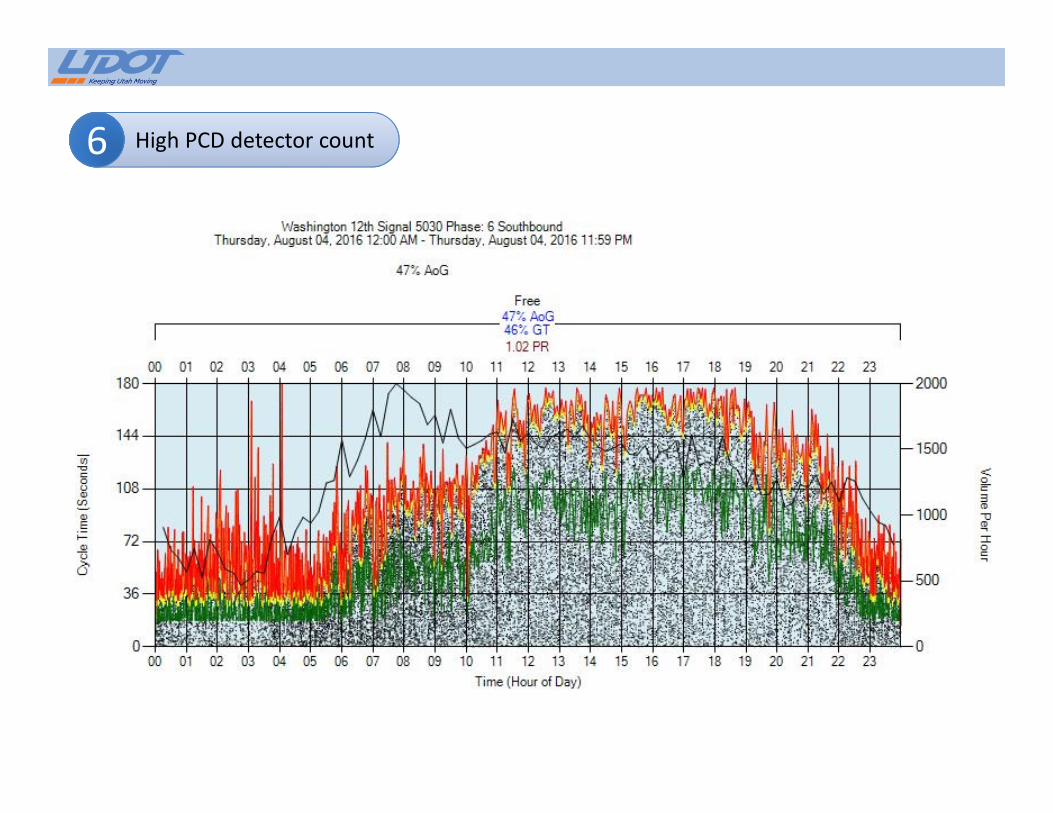
High PCD detector count66
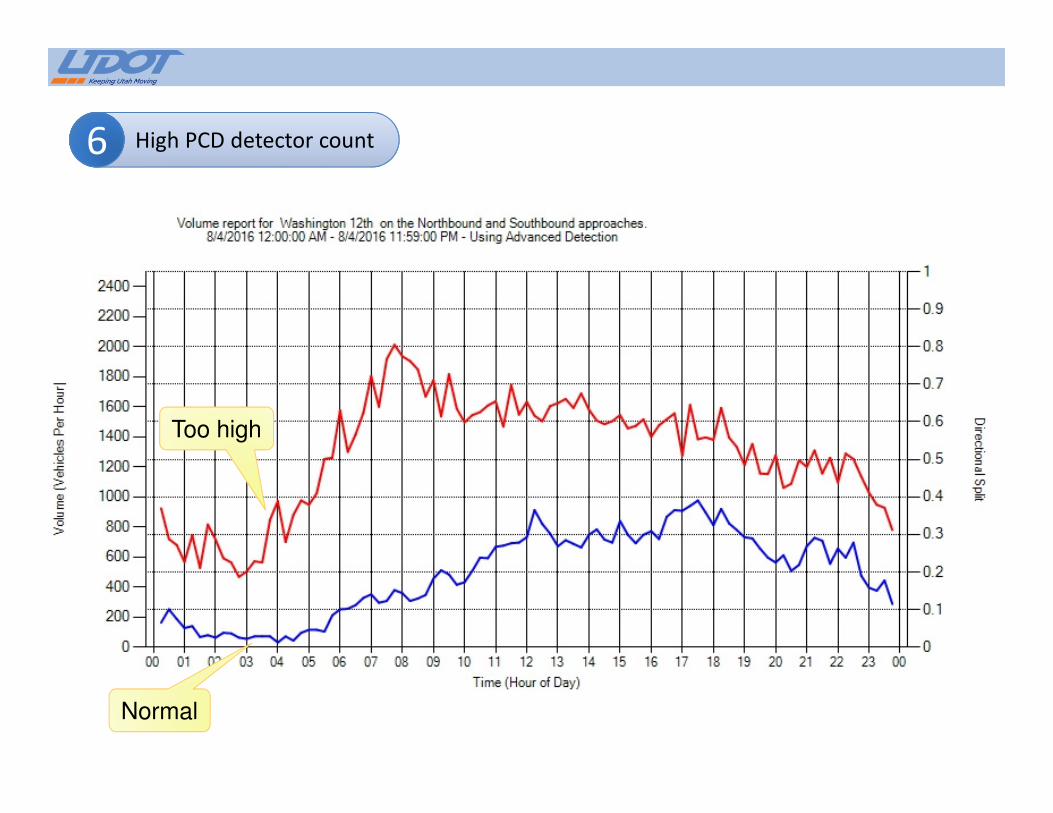
High PCD detector count66
Normal
Too high
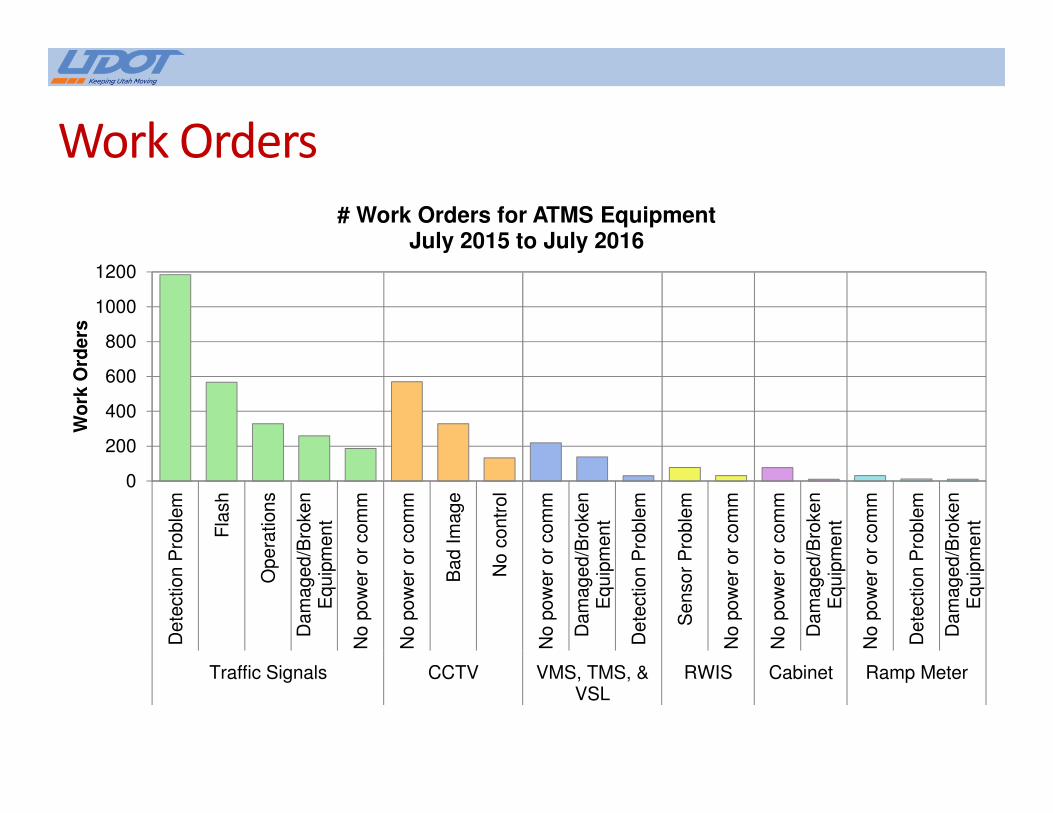
Work Orders
0
200
400
600
800
1000
1200
Dete
ction P
roble
m
Fla
sh
Opera
tions
Dam
aged/B
roken
Equip
ment
No p
ow
er
or
com
m
No p
ow
er
or
com
m
Bad Im
age
No c
ontr
ol
No p
ow
er
or
com
m
Dam
aged/B
roken
Equip
ment
Dete
ction P
roble
m
Sensor
Pro
ble
m
No p
ow
er
or
com
m
No p
ow
er
or
com
m
Dam
aged/B
roken
Equip
ment
No p
ow
er
or
com
m
Dete
ction P
roble
m
Dam
aged/B
roken
Equip
ment
Traffic Signals CCTV VMS, TMS, &VSL
RWIS Cabinet Ramp Meter
Wo
rk O
rders
# Work Orders for ATMS EquipmentJuly 2015 to July 2016

LOG ACTION TAKENUDOT Automated Traffic Signal Performance Measures
Jamie Mackey, P.E, PTOE
UDOT Statewide Signal Engineer
2017 UDOT ATSPM Installer Workshop • Salt Lake City, UT • January 18-19, 2017
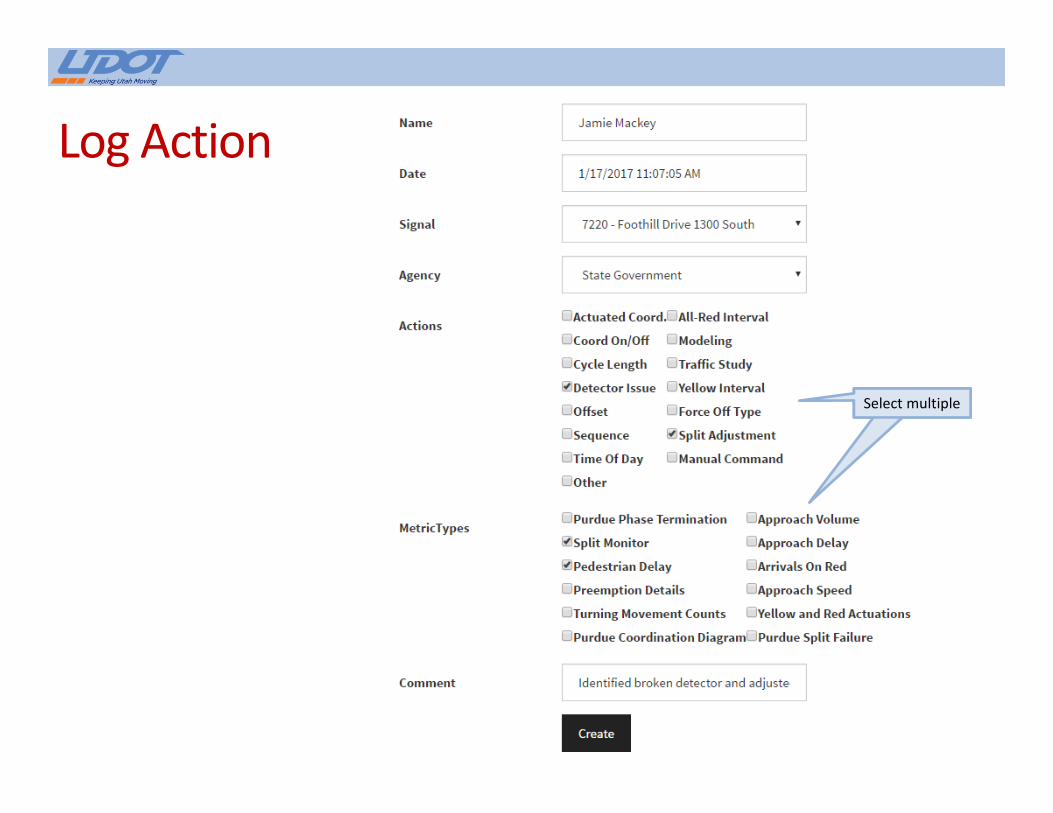
Select multiple
Log Action
Select multiple
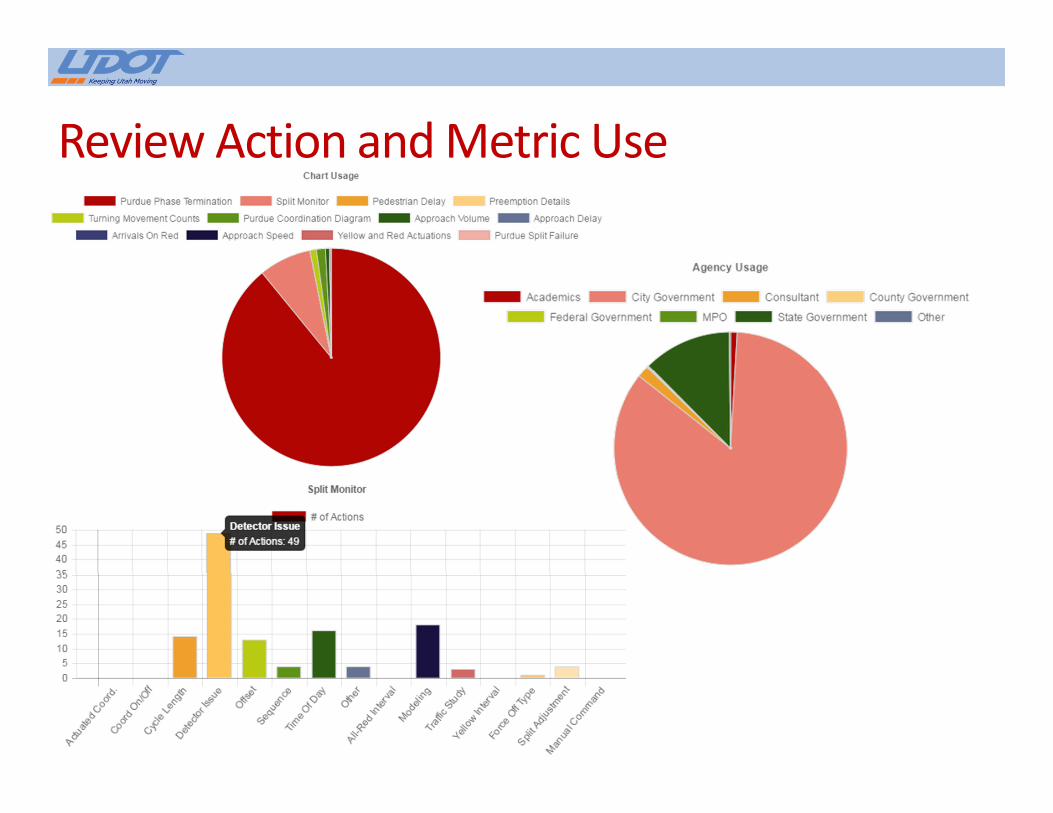
Review Action and Metric Use

Review Metric UseCollected by automatic logger