appendix a indicators used for generating a slum map for ...978-3-319-49418-0/1.pdf · appendix a...
TRANSCRIPT
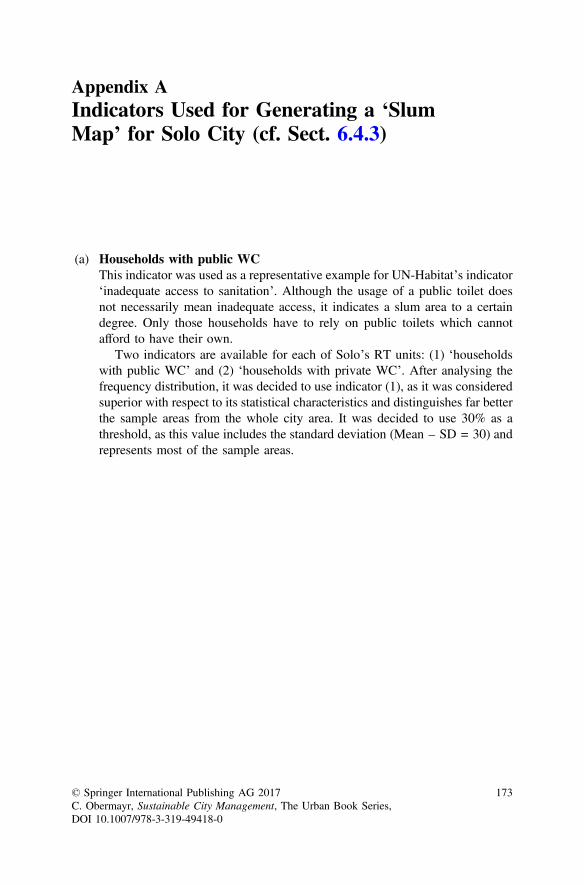
Appendix AIndicators Used for Generating a ‘SlumMap’ for Solo City (cf. Sect. 6.4.3)
(a) Households with public WCThis indicator was used as a representative example for UN-Habitat’s indicator‘inadequate access to sanitation’. Although the usage of a public toilet doesnot necessarily mean inadequate access, it indicates a slum area to a certaindegree. Only those households have to rely on public toilets which cannotafford to have their own.
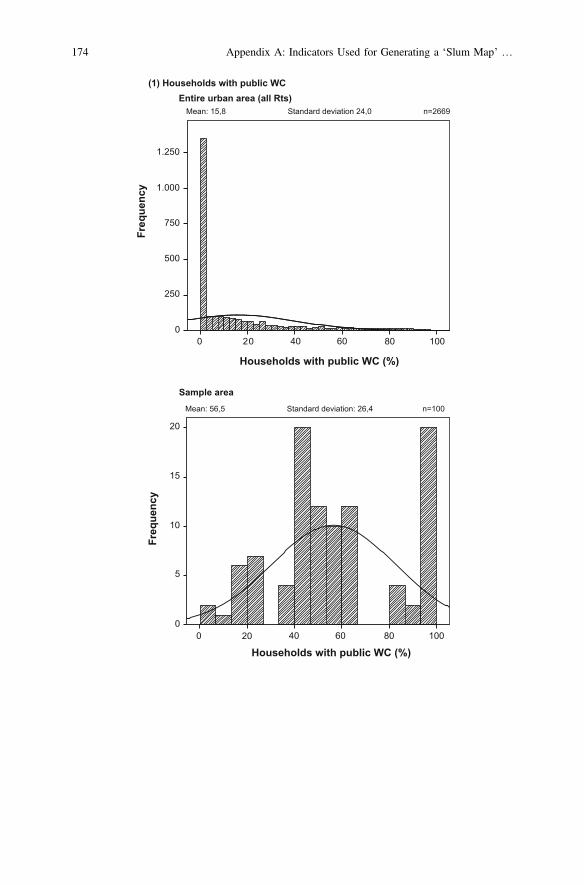
Two indicators are available for each of Solo’s RT units: (1) ‘householdswith public WC’ and (2) ‘households with private WC’. After analysing thefrequency distribution, it was decided to use indicator (1), as it was consideredsuperior with respect to its statistical characteristics and distinguishes far betterthe sample areas from the whole city area. It was decided to use 30% as athreshold, as this value includes the standard deviation (Mean – SD = 30) andrepresents most of the sample areas.
© Springer International Publishing AG 2017C. Obermayr, Sustainable City Management, The Urban Book Series,DOI 10.1007/978-3-319-49418-0
173
0 20
20
40 60 80 100
250
500
750
1.000
1.250
0
Freq
uenc
y
Households with public WC (%)
(1) Households with public WC
Mean: 15,8 Standard deviation 24,0 n=2669Entire urban area (all Rts)
Freq
uenc
y
0 40 60 80 100
Households with public WC (%)
Sample areaMean: 56,5 Standard deviation: 26,4 n=100
5
10
15
20
0
174 Appendix A: Indicators Used for Generating a ‘Slum Map’ …
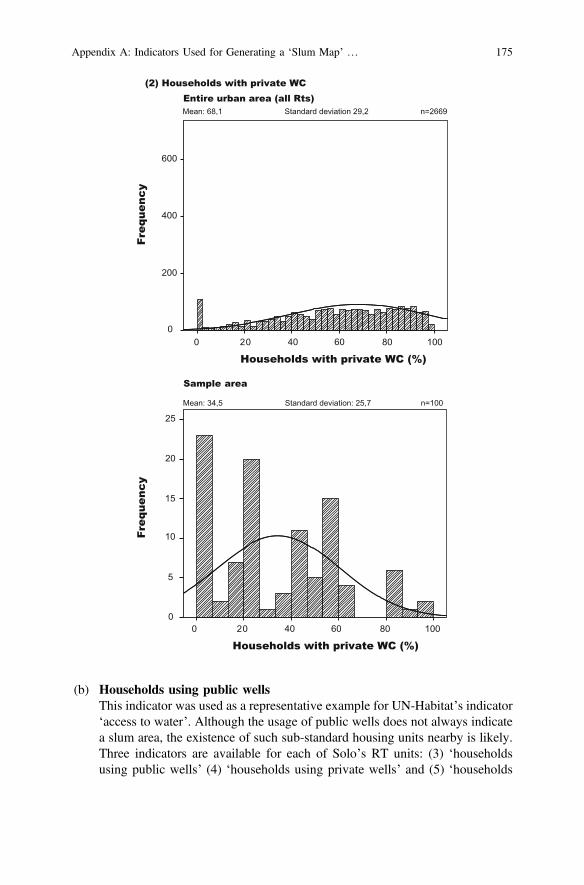
(b) Households using public wellsThis indicator was used as a representative example for UN-Habitat’s indicator‘access to water’. Although the usage of public wells does not always indicatea slum area, the existence of such sub-standard housing units nearby is likely.Three indicators are available for each of Solo’s RT units: (3) ‘householdsusing public wells’ (4) ‘households using private wells’ and (5) ‘households
0 20 40 60 80 100
200
400
600
0
Freq
uenc
y
Households with private WC (%)
(2) Households with private WC
Mean: 68,1 Standard deviation 29,2 n=2669Entire urban area (all Rts)
Freq
uenc
y
0 20 40 60 80 100
Households with private WC (%)
Sample area
Mean: 34,5 Standard deviation: 25,7 n=100
5
10
15
20
0
25
Appendix A: Indicators Used for Generating a ‘Slum Map’ … 175
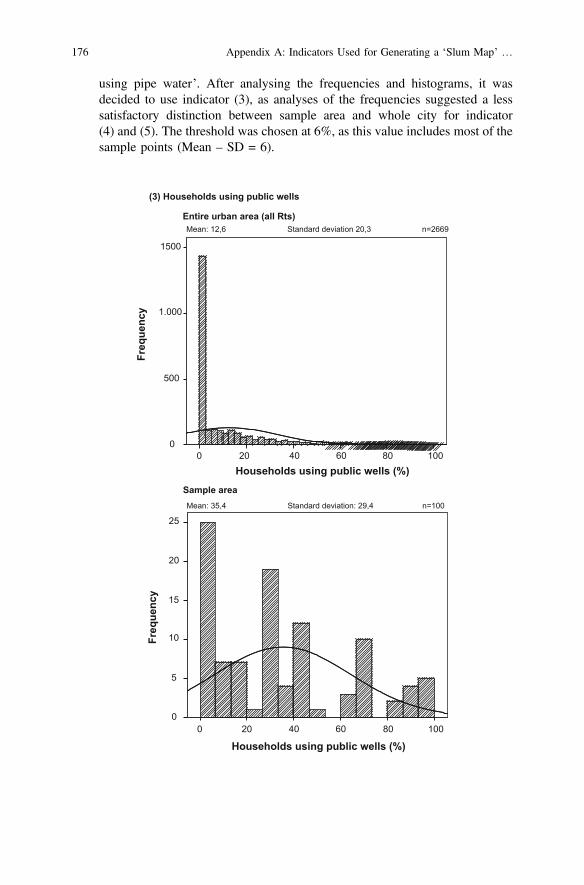
using pipe water’. After analysing the frequencies and histograms, it wasdecided to use indicator (3), as analyses of the frequencies suggested a lesssatisfactory distinction between sample area and whole city for indicator(4) and (5). The threshold was chosen at 6%, as this value includes most of thesample points (Mean – SD = 6).
0 20 40 60 80 100
500
1.000
1500
0
Freq
uenc
y
Households using public wells (%)
(3) Households using public wells
Mean: 12,6 Standard deviation 20,3 n=2669Entire urban area (all Rts)
Freq
uenc
y
0 20 40 60 80 100
Households using public wells (%)
Sample areaMean: 35,4 Standard deviation: 29,4 n=100
5
10
15
20
0
25
176 Appendix A: Indicators Used for Generating a ‘Slum Map’ …

0 40 60 80 100
100
200
400
0
Freq
uenc
y
Households using private wells (%)
(4) Households using private wells
Mean: 42,5 Standard deviation 33,8 n=2669Entire urban area (all Rts)
Freq
uenc
y
300
0 20
20
40 60 80 100
Households using private wells (%)
Sample areaMean: 26,8 Standard deviation: 22,5 n=100
5
10
15
20
0
25
Appendix A: Indicators Used for Generating a ‘Slum Map’ … 177

0 20
20
40 60 80 100
0 40 60 80 100
100
200
400
0
Freq
uenc
y
Households with access to piped water (%)
(5) Households with access to piped water
Mean: 35,5 Standard deviation 31,1 n=2669Entire urban area (all Rts)
Freq
uenc
y
300
Households with access to piped water (%)
Sample areaMean: 25,1 Standard deviation: 21,8 n=100
5
10
15
20
0
25
178 Appendix A: Indicators Used for Generating a ‘Slum Map’ …

(c) Households with land certificateThis indicator was used as a representative example for UN-Habitat’s indicator‘unsecure tenure’. The sample points showed a wide variation of householdswith and without land certificates. Thus, a low value of families with certificatedoes not necessarily classify this area as slum and vice versa. However, itcertainly hints at such an area, as pointed out by UN-Habitat and numerousother scholars.
To include this indicator despite its wide distribution of frequencies, onlythose RT units were chosen, where 5% or less of the households possess a landtitle.
Households with legal tenure (%)
Sample areaMean: 42,4 Standard deviation: 39,2 n=100
10
20
30
0
40
0 20 40 60 80 100
0 20 40 60 80 100
200
400
800
0
Freq
uenc
y
Households with legal tenure (%)
(6) Households with legal tenure
Mean: 76,3 Standard deviation 31,6 n=2669Entire urban area (all Rts)
Freq
uenc
y
600
1.000
1.200
Appendix A: Indicators Used for Generating a ‘Slum Map’ … 179

(d) Population densityThis indicator was used as a representative example for UN-Habitat’s ‘over-crowding’. The assumed correlation of slum areas with high density of pop-ulation, however, may be problematic, as also high apartment blocks withmiddle-class housing units fall into this category. Luckily such areas onlyrarely exist in Solo.
100
200
300
400
500
0
Freq
uenc
y
Population density (people/ha)
(7) Population Density
Mean: 168,3 Standard deviation 139,9 n=2669Entire urban area (all Rts)
Freq
uenc
y
0 200 400 600 800 1.4001.000 1.200
0 200 400 600 800 1.000
Population denisty (people/ha)
Sample areaMean: 383,4 Standard deviation: 216,1 n=100
10
20
30
0
180 Appendix A: Indicators Used for Generating a ‘Slum Map’ …

The sample points showed that the observed slum areas are a lot denserpopulated than other parts of the city. The comparison of the two histograms,however, shows a large overlap of the distribution of the two datasets, makingit difficult to distinguish them. Contributing to this overlap, a threshold ofmore than 200 persons per hectare was chosen.
(e) Poverty degreeThis indicator was used, as it incorporates many dimensions of poverty(quality of housing, income, education etc.) and is used by the Indonesiangovernment to detect poor neighbourhoods. Although UN-Habitat is not usingpoverty for their definition of slum areas, it is regarded as a good hint for slumdistricts, as it goes beyond an infrastructural classification of slums.
The values for the sample points showed a huge difference for the wholecity, making the distinction between the datasets very easy. To catch most ofthe sample area, it was decided to use >17% as a threshold, as this valueincludes the standard deviation (Mean – SD = 17).
Appendix A: Indicators Used for Generating a ‘Slum Map’ … 181

0 20 40 60 80
100
200
300
400
500
0
Freq
uenc
y
Degree of poverty (%)
(8) Degree of poverty
Mean: 15,4 Standard deviation 13,6 n=2669Entire urban area (all Rts)
Freq
uenc
y
100
0 20 40 60 80 100Degree of poverty (%)
Sample areaMean: 28,3 Standard deviation: 10,9 n=100
5
10
15
0
182 Appendix A: Indicators Used for Generating a ‘Slum Map’ …

Appendix BThe Original Questionnaire Usedfor the Household Survey (n = 52)in the New Settlement in Mojosongo
ANGKET (Questionnaire)Penduduk di Relokasi
Informasi Umum
1. Umur (Age) ________
2. Jenis Kelamin (Gender) L (M) P (F)
3. Agama (Religion) Islam Katholic Protestant Hindu Buddhist
Dll (other):____________
4. Pendidikan (Education) SD SMP SMA PT
5. Berapa jumlah ruang yang ada di rumah anda? __________How many rooms does your house have?
6. Berapa luas tanah punya anda (m²)? __________How much land do you own (m²)?
7. Berapa jumlah anak Anda? __________How many children do you have?
8. Apakah anda punya KTP? Do you have a KTP (iden ty card)?
ya, Mojosongo dak, saya dak punya KTP ya, saya punya KTP di Pucang Sawit yes, from Mojosongo no, I do not have a KTP yes, I have a KTP from Pucang Sawit
ya, saya punya KTP di daerah yang lain: ______________________________________ yes, I have a KTP from another region
Informasi (Information)Orang yang menanyai: Interviewer:Tanggal, jam (Date, me):Nomor (Name):
Saya Mahasiswa Geografi dari Austria. Saya membuat Peneli an tentang Program Pemerintahan “Relokasi” dengan dibantu mahasiswa UNS. Angket ini anonim. Terima kasih untuk membalas pertanyaan yang berikut. I’m a student of geography from Austria. With the help of UNS students I perform a research about the program ‘Relocasi’ of the city government. This questionnaire is anonym. Thank you for answering the following questions.
_____________________________________Kecamatan / Kabupaten, Kelurahan / Desa Sub-district / District, Quarter / Village
© Springer International Publishing AG 2017C. Obermayr, Sustainable City Management, The Urban Book Series,DOI 10.1007/978-3-319-49418-0
183

10. Berapa pendapatan per bulan keluarga Anda? How much revenue does your family have per month (Rupiah)?
< 800.000 800.000 – 1.500.000 1.500.000 – 2.500.000
2.500.000-5.000.000 >5.000.000
11. Apa pengeluaran terbesar keluarga Anda se ap bulan? What are the biggest expenditures of your family per month?
Ak vitas Activity
Pengeluaran per bulan Expenditure per month
1
2
3
12. Perbaikan yang anda buat di rumah? (Bisa diisi lebih dari satu)What improvements did you make at your house? (It is possible to mark more than one)
dinding plester (plaster the wall) dibangun lampiran bangunan (constructed an
annex to the house) dibangun beranda (constructed a porch)
dibangun par si/sekat (constructed a partition)
perkerasan dasar (concrete at the floor)
meletakkan ubin (tiles at the floor)
atap baru (new roof)
dll (other) ____________________________________________________
9. Apa kegiatan sehari-hari Anda dan keluarga yang nggal di rumah Anda? What activities do you and the other persons in your household carry out each day?
Siapa? Who?
Kegiatan / Pekerjaan? Activity / Occupation
Di mana? Where?
Menulis anggota keluarga yang nggal disini. (Contoh: ayah, anak etc.) Write down the names of the family members living in this house. For example: father, child etc.
Menulis pekerjaan atau kegiatan anggota keluarga yang nggal disini. Write down the occupation or activity of the family members living in this house.
Menulis di mana anggota keluarga melakukan pekerjaan atau kegiatan. (Kecamatan/Kabupaten dan Kelurahan / Desa) Write down in what area the family members carry out their work or activity.(Kecamatan / Kabupatan and Kelurahan / Desa)
184 Appendix B: The Original Questionnaire Used for the Household Survey …
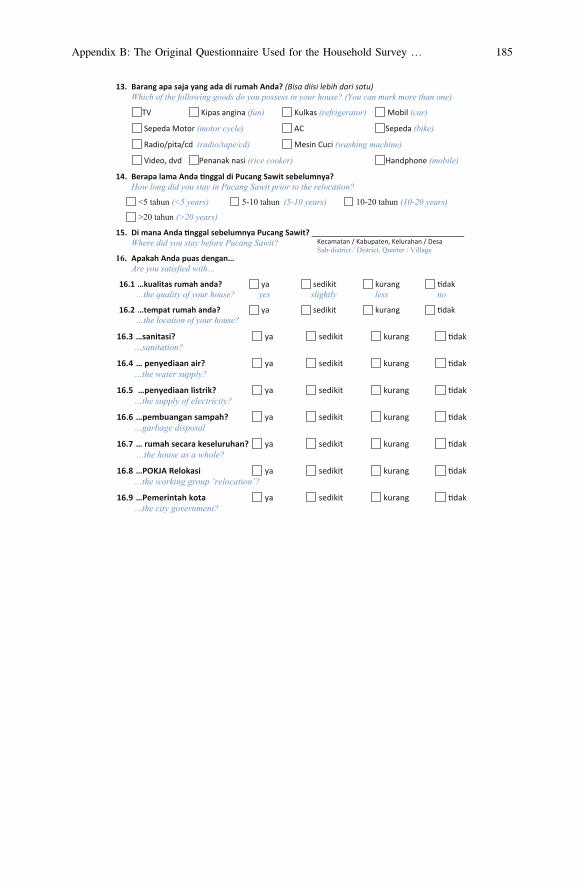
16.3 …sanitasi? ya sedikit kurang dak …sanitation?
16.4 … penyediaan air? ya sedikit kurang dak …the water supply?
16.5 …penyediaan listrik? ya sedikit kurang dak …the supply of electricity?
16.6 …pembuangan sampah? ya sedikit kurang dak …garbage disposal
16.7 … rumah secara keseluruhan? ya sedikit kurang dak …the house as a whole?
16.8 …POKJA Relokasi ya sedikit kurang dak …the working group ‘relocation’?
16.9 …Pemerintah kota ya sedikit kurang dak …the city government?
13. Barang apa saja yang ada di rumah Anda? (Bisa diisi lebih dari satu)Which of the following goods do you possess in your house? (You can mark more than one)
TV Kipas angina (fan) Kulkas (refrigerator) Mobil (car)
Sepeda Motor (motor cycle) AC Sepeda (bike)
Radio/pita/cd (radio/tape/cd) Mesin Cuci (washing machine)
Video, dvd Penanak nasi (rice cooker) Handphone (mobile)
14. Berapa lama Anda nggal di Pucang Sawit sebelumnya? How long did you stay in Pucang Sawit prior to the relocation?
<5 tahun (<5 years) 5-10 tahun (5-10 years) 10-20 tahun (10-20 years)
>20 tahun (>20 years)
15. Di mana Anda nggal sebelumnya Pucang Sawit? ___________________________________Where did you stay before Pucang Sawit?
16. Apakah Anda puas dengan… Are you satisfied with…
16.1 …kualitas rumah anda? ya sedikit kurang dak …the quality of your house? yes slightly less no
16.2 …tempat rumah anda? ya sedikit kurang dak …the location of your house?
___________________________________Kecamatan / Kabupaten, Kelurahan / Desa Sub-district / District, Quarter / Village
Appendix B: The Original Questionnaire Used for the Household Survey … 185

20.5 Air Water
20.6 Biaya hidup Living costs
20.8 Pembuangan sampah Garbage disposal
20.9 Tempat ibadah Places of worship
21. Apakah masalah di pemukiman baru? What are the main problems in the new location?
Sanitatasi (Sanitation) Banjir (Flooding) Transportasi (Transportation)
Sampah (Garbage) Penerimaan oleh tetengga (acceptance by the neighbours)
dll (other)___________________________________________________________________
17. Apakah Anda bisa berpar sipasi dalam… Were you able to participate in…
17.1 …pemilihan lokasi untuk pemukiman? ya sedikit kurang dak…the selection of the location of the settlement?
17.2 …pemilihan rumah di pemukiman? ya sedikit kurang dak…the selection of the house within the settlement?
17.3 …pemilihan tentang strukutur rumah? ya sedikit kurang dak …the appearance and structure of the house?
18. Apakah Pemerintha Kota memper mbangkan Permintaan anda? Did the city government consider your request and wishes?
ya sedikit kurang dak
19. Apakah baru (Mojosongo) atau tempat lama (Pucang Sawit) lebih baik? Is the new (Mojosongo) or the old (Pucang Sawit) place better for living?
tempat baru (the new location) tempat lama (the old location)
20. Perbandingan antara kedua daerah: Di mana (…) lebih baik?Comparison between the two regions: Where is/was (…) better?
No. (…) Pucang Sawit
Mojosongo Sama Same
Tidak tahu I don’t know
20.1 Ukuran rumah Size of the house
20.2 Kualitas rumah Quality of the house
20.3 Transportasi Transportation
20.4 Sanitasi Sanitation
186 Appendix B: The Original Questionnaire Used for the Household Survey …
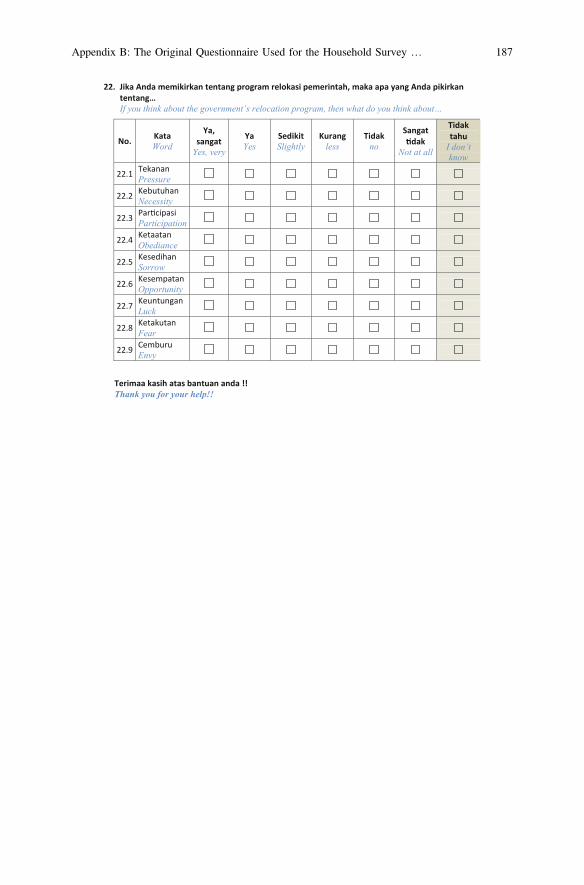
22. Jika Anda memikirkan tentang program relokasi pemerintah, maka apa yang Anda pikirkan tentang… If you think about the government’s relocation program, then what do you think about…
No. Kata Word
Ya, sangat
Yes, very
Ya Yes
Sedikit Slightly
Kurang less
Tidak no
Sangat dak
Not at all
Tidak tahu
I don’t know
22.1 Tekanan Pressure
22.2 Kebutuhan Necessity
22.3 Par cipasi Participation
22.4 Ketaatan Obediance
22.5 Kesedihan Sorrow
22.6 Kesempatan Opportunity
22.7 Keuntungan Luck
22.8 Ketakutan Fear
22.9 Cemburu Envy
Terimaa kasih atas bantuan anda !! Thank you for your help!!
Appendix B: The Original Questionnaire Used for the Household Survey … 187
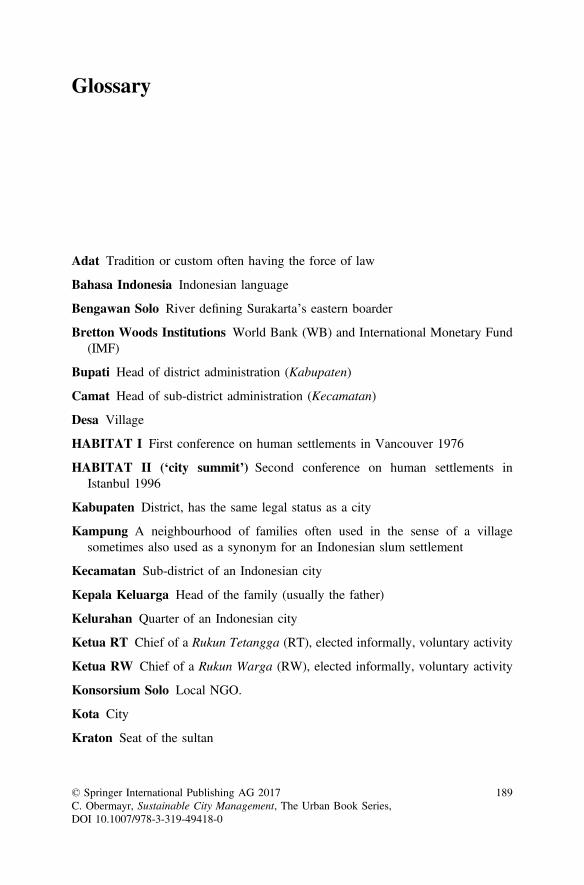
Glossary
Adat Tradition or custom often having the force of law
Bahasa Indonesia Indonesian language
Bengawan Solo River defining Surakarta’s eastern boarder
Bretton Woods Institutions World Bank (WB) and International Monetary Fund(IMF)
Bupati Head of district administration (Kabupaten)
Camat Head of sub-district administration (Kecamatan)
Desa Village
HABITAT I First conference on human settlements in Vancouver 1976
HABITAT II (‘city summit’) Second conference on human settlements inIstanbul 1996
Kabupaten District, has the same legal status as a city
Kampung A neighbourhood of families often used in the sense of a villagesometimes also used as a synonym for an Indonesian slum settlement
Kecamatan Sub-district of an Indonesian city
Kepala Keluarga Head of the family (usually the father)
Kelurahan Quarter of an Indonesian city
Ketua RT Chief of a Rukun Tetangga (RT), elected informally, voluntary activity
Ketua RW Chief of a Rukun Warga (RW), elected informally, voluntary activity
Konsorsium Solo Local NGO.
Kota City
Kraton Seat of the sultan
© Springer International Publishing AG 2017C. Obermayr, Sustainable City Management, The Urban Book Series,DOI 10.1007/978-3-319-49418-0
189

Krismon Abbreviation for Krisis Monetar—monetary crisis referring to the Asiancrisis
Lurah Head of a quarter (Kelurahan) administration
Masyarakat Community
Musrenbang Musyawarah Perencanaan Pembangunan—Multi-stakeholder con-sultation forum for development planning
Perwali Peraturan Walikota—Mayor regulation
Pokja Working group often temporarily established for one-issue members oftenfrom the LPMK
Rukun Tetangga (RT) Smallest administrative unit, usually consisting of 10–20households
Rukun Warga (RW) Second smallest administrative unit, usually consisting of5–10 RTs
190 Glossary