analysis of incentives and disincentives for wheat in kenya · the analysis presented in this...
TRANSCRIPT

ANALYSIS OF INCENTIVES AND DISINCENTIVES
FOR WHEAT IN KENYA
JULY 2013

This technical note is a product of the Monitoring African Food and Agricultural Policies project (MAFAP). It is a technical document intended primarily for internal use as background for the eventual MAFAP Country Report. This technical note may be updated as new data becomes available.
MAFAP is implemented by the Food and Agriculture Organization of the United Nations (FAO) in collaboration with the Organisation for Economic Co-operation and Development (OECD) and national partners in participating countries. It is financially supported by the Bill and Melinda Gates Foundation, the United States Agency for International Development (USAID), and FAO.
The analysis presented in this document is the result of the partnerships established in the context of the MAFAP project with governments of participating countries and a variety of national institutions.
For more information: www.fao.org/mafap
Suggested citation: Monroy L., Mulinge W., Witwer M., 2013. Analysis of incentives and disincentives for wheat in Kenya. Technical notes series, MAFAP, FAO, Rome. © FAO 2013 FAO encourages the use, reproduction and dissemination of material in this information product. Except where otherwise indicated, material may be copied, downloaded and printed for private study, research and teaching purposes, or for use in non-commercial products or services, provided that appropriate acknowledgement of FAO as the source and copyright holder is given and that FAO’s endorsement of users’ views, products or services is not implied in any way. All requests for translation and adaptation rights, and for resale and other commercial use rights should be made via www.fao.org/contact-us/licence-request or addressed to [email protected].
- 2 -

CONTENTS
CONTENTS ............................................................................................................................................... 3
1. PURPOSE OF THE NOTE ................................................................................................................... 4
2. POLICY CONTEXT ............................................................................................................................. 5
a. Production ................................................................................................................................... 5
b. Consumption ............................................................................................................................... 7
c. Marketing and Trade................................................................................................................... 8
d. Description of the Value Chain and Processing .......................................................................... 9
e. Policy Decisions and Measures ................................................................................................. 10
3. DATA REQUIREMENTS, DESCRIPTION AND CALCULATION OF INDICATORS ................................ 12
TRADE STATUS OF THE PRODUCTS ................................................................................................... 12
BENCHMARK PRICES ......................................................................................................................... 12
DOMESTIC PRICES ............................................................................................................................. 12
EXCHANGE RATES ............................................................................................................................. 13
4. ACCESS COSTS ............................................................................................................................... 13
EXTERNALITIES .................................................................................................................................. 15
BUDGET AND OTHER TRANSFERS ..................................................................................................... 15
QUALITY AND QUANTITY ADJUSTMENTS ......................................................................................... 15
5. INTERPRETATION OF THE INDICATORS ......................................................................................... 19
OBSERVED WHOLESALE PRICE GAPS AND RATES ............................................................................. 19
OBSERVED FARM GATE RESULTS ...................................................................................................... 19
ADJUSTED PRICE GAPS AND RATES OF PROTECTION ....................................................................... 20
6. PRELIMINARY CONCLUSIONS AND RECOMMENDATIONS ............................................................ 22
MAIN MESSAGE ................................................................................................................................ 22
PRELIMINARY RECOMMENDATIONS ................................................................................................ 22
LIMITATIONS ..................................................................................................................................... 22
FURTHER INVESTIGATION AND RESEARCH ....................................................................................... 23
Bibliography .......................................................................................................................................... 24
ANNEX I: Methodology Used ................................................................................................................ 25
ANNEX 2: RECENT POLICY DECISIONS AFFECTING WHEAT IN KENYA.................................................. 26
ANNEX 3. MARKET ACCESS COSTS FOR WHEAT ................................................................................... 27
ANNEX 3. DATA AND CALCULATIONS USED IN THE ANALYSIS ............................................................. 29
- 3 -

1. PURPOSE OF THE NOTE This technical note aims to describe the market incentives and disincentives for wheat producers in Kenya. For this purpose, yearly averages of farm gate and wholesale prices are compared with reference prices calculated on the basis of the price of the commodity in the international market. The price gaps between the reference prices and the prices along the value chain indicate to which extent incentives (positive gaps) or disincentives (negative gaps) are present at the farm gate and wholesale level. In relative terms, the price gaps are expressed as Nominal Rates of Protection (NRPs). These key indicators are used by MAFAP to highlight the effects of policy and market development gaps on prices.
The note starts with a brief review of the commodity’s production and consumption as well as trade and policies affecting the commodity. It also provides a detailed description of how the key components of the price analysis have been obtained. Using this data, the MAFAP indicators are then calculated and interpreted in light of existing policies and market characteristics. The analysis is commodity and country specific and covers the period 2005-2010. The indicators have been calculated using available data from different sources for this period and are described in Chapter 3.
The outcomes of this analysis can be used by those stakeholders involved in policy-making for the food and agricultural sector. They can also serve as input for evidence-based policy dialogue at the country or regional level.
This technical note is not to be interpreted as an analysis of the value chain or detailed description of production, consumption or trade patterns. All information related to these areas is presented merely to provide background on the commodity under review, help understand major trends and facilitate the interpretation of the indicators. Additionally, all information presented in this note is preliminary and still subject to review and validation.
- 4 -
2. POLICY CONTEXT Wheat has a unique policy context because of its relevance to food security and the role that trade plays in wheat supply. Wheat is the second most important agricultural commodity in Kenya from a food security view point both in terms of quantity and calories consumed. Muyanga et al. found that Nairobi consumers in 2003 spent 34 percent more on wheat products than they did on maize and more than twice as much as they spent on rice. Although far behind maize, wheat is twice as important as a source of calories for Kenyans as the third most important cereal, rice. Wheat consumption is associated with urbanization and higher incomes and, therefore, has been an increasing component in Kenyan’s diets. Besides its apparent prevalence among higher income consumers, wheat has a convenience factor because bread and other wheat products can be prepared in large-scale establishments and distributed in a form that is easily consumed with little additional preparation.
Wheat has a different policy context because it is a major import. Kenya now imports about five times as much wheat as it produces. Wheat must be imported from world markets at world market prices in contrast to other food security related commodities like maize, beans and rice that may be imported in significant quantities from other East African countries.
a. Production Wheat also is unique in that nearly all production takes place on large- and medium-scale farms, using capital intensive technology. Longmire and Lugogo report on surveys that found that there were only about 1700 smallholder wheat producers in the early 1980s. Similarly, Makanda and Oehmke estimate that smallholders still only accounted for about 15 percent of the area planted to wheat a decade later. In 2002, Nyangito, Ikiara and Ronge commented on the dominance of large-scale farmers, saying they account for 75 percent of the area planted to wheat and 83 percent of production. In 2010, Chemonics International reported that there were 2 000 small-scale (<5ha) and only 20 large-scale (>40ha) wheat farmers under the Cereal Growers Association, with the large-scale farmers responsible for 80 percent of output.
The small number of wheat farmers in Kenya receives effective tariff protection from imports. In comparison, there are an estimated three million maize farmers in Kenya who also receive tariff protection from imports. However, since Kenyan prices (except in 2009) have been lower than the import parity even without tariffs, the tariffs are not affecting Kenyan prices.
The technology on the medium- and large-scale farms is probably not too different from that in Western Europe, with a similar complement of tractors, tillage equipment and combines. Operations, such as combine harvesting, are often contracted. Even small-scale farmers may depend on contractors for tillage and harvesting operations, although the machinery may be smaller.
The main growing regions have been the areas above 1 500 meters in the Nakuru, Uasin Gishu, Trans Nzoia and Laikipia districts. The break-up of some of the large farms in these districts resulted in a switch to maize production or a combination in which wheat is grown as a cash crop and maize is produced for subsistence consumption. However, new wheat growing areas have opened up on land leased from Masai pastoralists in Narok. Makanda and Oehmke report that GOK estimates up to 500 000 ha could be planted to wheat in Narok.
- 5 -
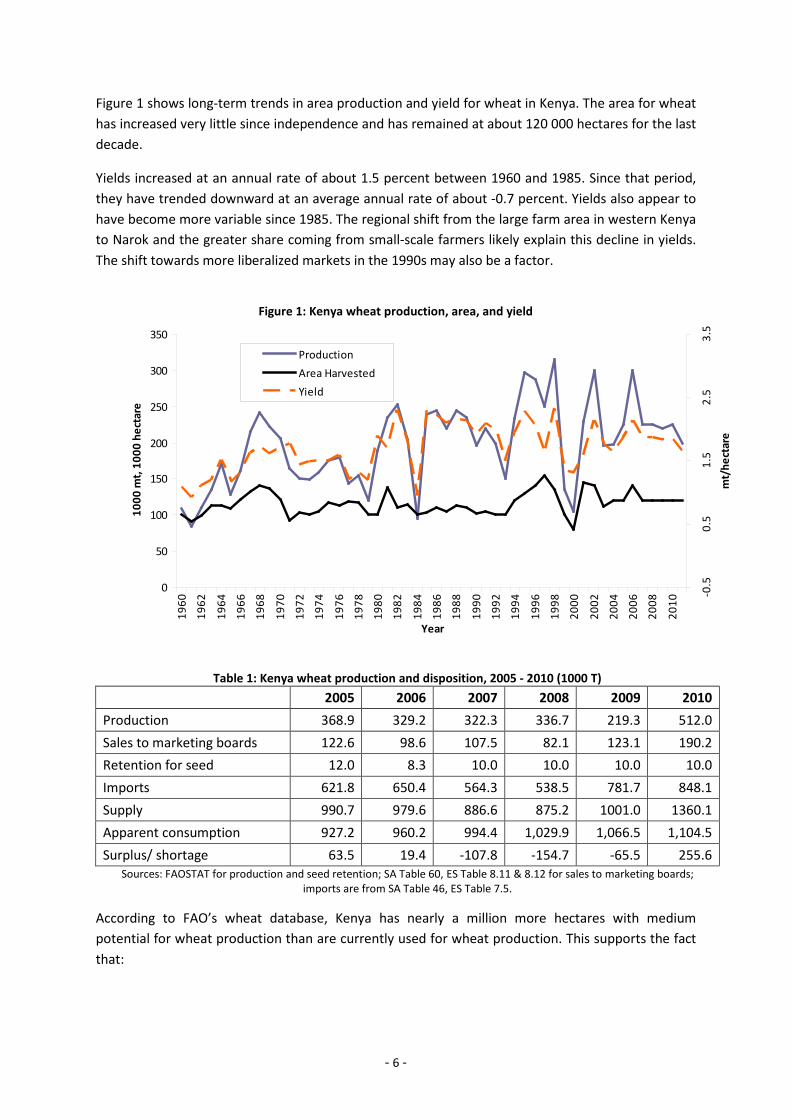
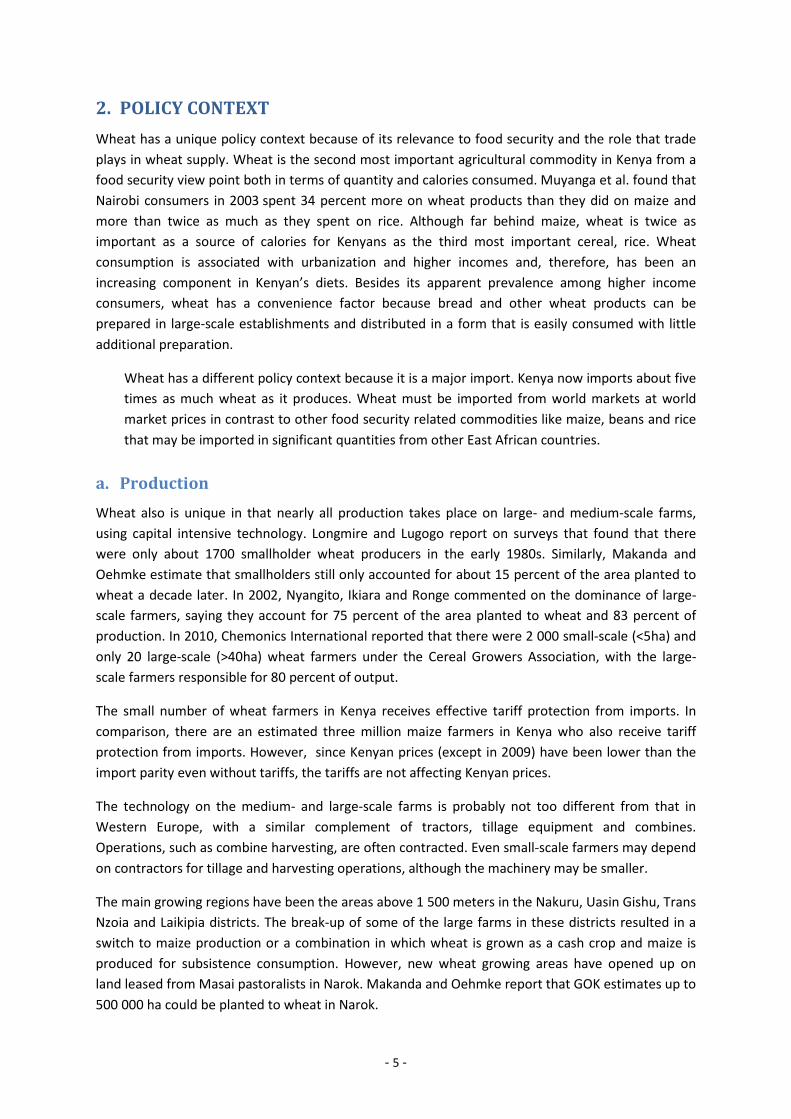
Figure 1 shows long-term trends in area production and yield for wheat in Kenya. The area for wheat has increased very little since independence and has remained at about 120 000 hectares for the last decade.
Yields increased at an annual rate of about 1.5 percent between 1960 and 1985. Since that period, they have trended downward at an average annual rate of about -0.7 percent. Yields also appear to have become more variable since 1985. The regional shift from the large farm area in western Kenya to Narok and the greater share coming from small-scale farmers likely explain this decline in yields. The shift towards more liberalized markets in the 1990s may also be a factor.
Figure 1: Kenya wheat production, area, and yield
Table 1: Kenya wheat production and disposition, 2005 - 2010 (1000 T) 2005 2006 2007 2008 2009 2010 Production 368.9 329.2 322.3 336.7 219.3 512.0 Sales to marketing boards 122.6 98.6 107.5 82.1 123.1 190.2 Retention for seed 12.0 8.3 10.0 10.0 10.0 10.0 Imports 621.8 650.4 564.3 538.5 781.7 848.1 Supply 990.7 979.6 886.6 875.2 1001.0 1360.1 Apparent consumption 927.2 960.2 994.4 1,029.9 1,066.5 1,104.5 Surplus/ shortage 63.5 19.4 -107.8 -154.7 -65.5 255.6
Sources: FAOSTAT for production and seed retention; SA Table 60, ES Table 8.11 & 8.12 for sales to marketing boards; imports are from SA Table 46, ES Table 7.5.
According to FAO’s wheat database, Kenya has nearly a million more hectares with medium potential for wheat production than are currently used for wheat production. This supports the fact that:
0
50
100
150
200
250
300
350
1960
1962
1964
1966
1968
1970
1972
1974
1976
1978
1980
1982
1984
1986
1988
1990
1992
1994
1996
1998
2000
2002
2004
2006
2008
2010
Year
1000
mt,
1000
hec
tare
s
-0.5
0.5
1.5
2.5
3.5
mt/
hect
are
ProductionArea HarvestedYield
- 6 -
“Of all the rainfed wheat producing countries in Africa, Kenya has recorded the largest average yields, at 1.8-2.2 tonnes/ha. It has all the natural resources it needs to achieve self-sufficiency in wheat.”
Of course wheat must compete with other demands for land in Kenya and may well lose out to other more profitable uses. It is not clear that self-sufficiency is an appropriate goal from an economic perspective.
Table 1 shows Kenya wheat production and disposition over the period 2005-2010. Production averaged about 348 thousand tonnes, with about 3 percent of this being retained for seed. Exports were negligible, while imports averaged about 668 thousand tonnes, contributing to an average supply of just over 1 million tonnes. However, Table 1 also shows the extreme variability in supply during this period; production varied from a low of 219 thousand tonnes in 2009 to 512 thousand tonnes in 2010. The low level of production in 2009 is likely related to droughts and civil unrest following the 2007 election. Imports appear to have been somewhat pro-cyclical, with the highest levels occurring in the same year as highest production1.
b. Consumption Figure 2 shows trends in production, trade and apparent consumption from 1960 to 2011. Apparent consumption has been growing at an average annual rate of over 4 percent and shows no sign of slowing. With production largely stagnant, the gap has been met by the elimination of exports in the early 1960s and a continuous increase in imports.
Figure 2: Kenya wheat supply, Imports, exports and apparent consumption
The average per capita intake over the period 2005-2010 is slightly more than 28 kg/person/year, as compared to 91 kg/person/year for maize. The estimate of apparent consumption shown for each year in Table 1 is found by multiplying average per capita intake by the estimated population in each year. This results in the large deficit estimates for 2007 and 2008. Therefore, while the fall in production in 2009 may have been related to the domestic situation, the fall in consumption in the
-200
0
200
400
600
800
1000
1200
1400
1600
1960
1962
1964
1966
1968
1970
1972
1974
1976
1978
1980
1982
1984
1986
1988
1990
1992
1994
1996
1998
2000
2002
2004
2006
2008
2010
Year
1,00
0 m
t
Exports Imports
Supply Consumption
- 7 -

same year may have been a response to the higher cost of imported wheat resulting from the 2007-2008 price spike in global markets.
c. Marketing and Trade As indicated in Figure 2, Kenya meets much of its demand for wheat through imports. Figure 3 shows the most important sources of wheat imports and their average share of Kenya imports from 2006 to 2011. During this period, over half of Kenya’s wheat imports came from Russia and Ukraine, with Argentina and the United States being the third and fourth most important suppliers, respectively. The price of wheat from Australia, however, plays a major role in discussions about parity price, perhaps reflecting more traditional sources of wheat for Kenya.
Figure 3: Average Wheat imports by country of origin, 2006-2011
Source: Global trade atlas
Kenya farmers mostly produce relatively low quality, soft wheat varieties and higher quality, hard wheat varieties in a 75:25 ratio. Millers blend imported hard wheat varieties with soft wheat in a 40:60 ratio to produce a flour quality that meets Kenyan market demands. This implies that a quality adjustment needs to be made in comparing Kenya wheat prices with those of imported wheat.
- 8 -
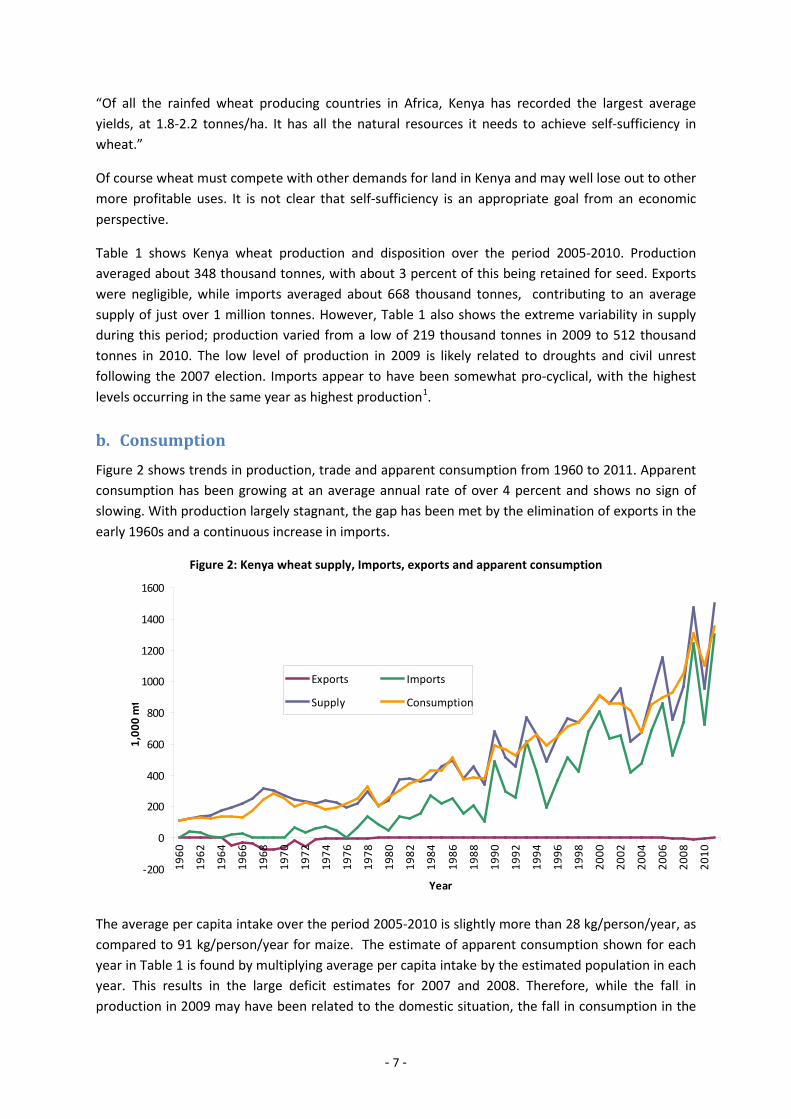
d. Description of the Value Chain and Processing Figure 3 shows a representation of the wheat value chain in Kenya. As indicated in this figure, Kenya exports some flour and products from the bakery industry. Kenya exports to its neighboring countries under market access terms of EAC/COMESA. Currently, this market is relatively small, but Musyoka (2009) provides an evaluation of the potential for future growth.
By-products of the milling industry, flour and pollard, are an important input for the animal feed industry. Milling capacity is located in all the major regions of Kenya.
Government involvement in the value chain currently entails providing support to farmers in the form of research and extension, in regulating and promoting trade and in the form of the National Cereals and Produce Board, which is responsible for maintaining a food reserve and monitoring prices and markets. The NCPB has occasionally been called upon to directly intervene in the markets to respond to exceptionally high prices.
Figure 4: The wheat value chains in Kenya
Both farmer and miller organizations also play a role in the value chain2. The farmers today are represented by the Cereal Growers Association, which is centered on the traditional large farm area in western Kenya, and the Narok Wheat Farmers Association. The millers are represented by the Cereal Millers Association.
- 9 -

e. Policy Decisions and Measures Before 1993, all aspects of wheat marketing were essentially controlled by a government board. In 1979, this authority was vested in the National Cereals and Produce Board (NCPB), which replaced the Maize and Produce Board and the Wheat Board of Kenya without changing the command and control approach to grain marketing.
The NCPB was given monopoly powers to purchase, store, market and generally manage cereal grains and other produce in Kenya. It was empowered to regulate and control the collection, movement, storage, sale, purchase, transportation, marketing, processing, distribution, import, export, and supply of maize, wheat and other scheduled agricultural produce under a controlled price system.
Prices were set ezch year at each level in the value chain. The NCPB bought from farmers and sold to millers at administratively determined prices, while wholesale and retail prices for flour and bread were set by the Office of the Price Controller of the Treasury.
Under the Grains Sector Reform Program, the monopoly powers of NCPB were gradually reduced, culminating in a fully liberalized market in 1993. Between 1996 and 1998, the NCPB Commercialization Project sought to transform the NCPB into a commercially viable entity. The NCPB is now a publicly owned commercial agency that purchases grains for strategic reserves and monitors trade in cereals.
With liberalization of wheat marketing, private sector imports and domestic marketing are no longer proscribed. However, large-scale wheat farmers have long influenced pricing and other aspects of wheat marketing as have the millers. Occasionally, this can directly influence price:
“In the 1996/1997 harvest season, farmers in Uasin Gishu District, a major wheat-growing region, rioted over low producer prices offered by millers and NCPB. The Government forced NCPB to buy the wheat at a higher price than the then prevailing market price.” (Nyangito, Ikiara, and Ronge)
These authors also seem to suggest that domestic wheat producers are able to force the NCPB to pay them an Australia hard, white wheat import parity price for lower quality Kenya soft wheat. It is not clear whether these costs are passed forward to the millers. It is possible that the system operates somewhat like a bilateral monopoly with prices agreed upon between the Cereal Growers Association and the two wheat farmers organizations.
Another important element of the wheat value chain in Kenya is the port and grain handling facilities. Until 2000, Kenya did not have elevators and other specialized grain handling infrastructure. Grain arriving at the port had to be bagged, and grain handling was both labor intensive and expensive, with port handling costs amounting to about USD 35/tonne. Grain Bulk Handlers Ltd. is a private company that began operating modern bulk grain handling facilities in 2000. The company has held a monopoly over bulk grain handling for eight years and continues as the sole bulk grain operating facility. This has lowered costs by USD 8-10 per tonne, but some have argued that increased competition in bulk grain handling at the port would lead to even larger reductions in cost.
- 10 -

Most of the measures that currently have a direct impact on the wheat market now have to do with trade and tariffs. In recent years, Kenya has protected domestic wheat producers with a tariff in the 25 to 35 percent range, although tariffs of 50 percent appear to have been levied in 2000 under a variable levy system operating at that time. Under COMESA, Kenya’s tariffs were harmonized with those of other members at 35 percent for wheat and 60 percent for wheat flour. The East African Community harmonized these rates in its agreement on a common external tariff in 2004. However, members of COMESA and the East African community have agreed to a process to vary these rates as circumstances require. Thus, Kenya reduced its wheat tariff from 35 to 25 percent in response to the wheat price spike of 2007-2008. Tanzania and Uganda also lowered their tariffs on wheat, which were reduced to 10% and zero, respectively, in 2010.
Similar to Tanzania, Kenya’s tariff was reduced further to 10 percent in 2010. This was done by a duty remission scheme in which importers initially paid the 35 percent tariff and then applied for remission. This approach may have been used as a means of limiting the quantity eligible for the lower tariff. This reduction was implemented despite protests by large-scale farmers in Narok.
Finally in 2011, a continuation of the “tariff-abatement” policy was announced. Under the new scheme, registered millers are allowed to import wheat duty free for one year beginning on July 4, 2011.
- 11 -

3. DATA REQUIREMENTS, DESCRIPTION AND CALCULATION OF INDICATORS
To calculate the indicators needed to estimate incentives or disincentives to production (NRP, NRA), as well as the Market Development Gaps (MDGs), several types of data are needed. They were collected and are presented and explained hereafter.
TRADE STATUS OF THE PRODUCTS As mentioned above, Kenya has long been a net wheat importer and there were substantial volumes of wheat imported throughout 2005-10. The estimation of the Nominal Rate of Protection (NRP), therefore, starts with observed CIF prices as the benchmark. The benchmark price is the average Mombasa CIF price for all wheat imports from data in the Global Trade Atlas.
BENCHMARK PRICES The benchmark price is the average Mombasa CIF price for wheat imports from all countries. For 2006-2010, these are based upon prices in US dollars per metric ton in the Global Trade Atlas, which were converted to Kenya shillings per metric ton at the annual average exchange rate for the year provided in the IMF database. The value for 2005 is from the KNBS Statistical Abstract 2010.
DOMESTIC PRICES Farmers in Kenya sell wheat either to the NCPB or directly to millers. Small-scale farmers sell directly to the NCPB, while large-scale farmers may sell to either. When they sell to millers, they deliver wheat directly to the millers in Nairobi. KNBS reported wheat sales to marketing boards (NCPB in this case) averaged 36 percent of the production over the period 2005-10 (see Table 1). Presumably, farmers receive a price that compensates them for the additional costs they must bear in trucking wheat from the farm to Nairobi. The KNBS price for wheat, therefore, can be taken as a near farm gate price reflecting the price they are paid on delivery to NCPB depots near the main growing areas.
Data are not available on the wholesale price paid by the millers. However, the price can be inferred from the border price by adding a margin for the cost of clearing the port and transporting the wheat to Nairobi, or from the price paid by the NCPB by adding a margin for the costs of transporting wheat from their depots near the farms to the millers. The first approach is used here because it is more consistent with the data available on farm level prices and because it makes it possible to evaluate the potential impact of market power and NCPB subsidies in the market. This means in effect that wholesale prices for wheat are calculated by a parity price formula3. The market access costs and exchange rates used in this calculation are described in the next sections, and the resulting wholesale prices are shown in Table 3.
- 12 -

Table 3: Determination of observed wholesale prices Year 2005 2006 2007 2008 2009 2010 Border Price (Ksh/T) 12,796 12,249 16,957 24,112 17,160 19,889 Tariff (%) 35 35 25 25 25 10 Wholesale price (Ksh/T)
19,994 17,733 24,186 29,271 22,493 28,474
EXCHANGE RATES The exchange rate between the Kenya shilling and the United States dollar has been taken from the IMF database on exchange rates. The average of the exchange rate for each year has been calculated from the monthly data reported in that database.
4. ACCESS COSTS Access costs for imported wheat are the sum of port charges and the cost to transport wheat from Mombasa to Nairobi. An estimate of port charges for bulk and bagged wheat is given in Table 4. These are based on recent estimates provided by Grain Bulk Handlers Ltd. (GBHL) together with comparisons of other published estimates for both maize and wheat (see Annex 3 for more details). Port charges used in the estimate of market access costs are USD 24/tonne plus 5.375 percent of the Mombasa C&F price. With a price of imported wheat of about USD 230/tonne (this is the average price of imported wheat over 2005-2010), port charges were estimated to be about USD 36/tonne.
A number of adjustments could be made to port charges, such as selectively reducing fees and Kenya Port Authority charges, but it is difficult to know how much it is possible to further reduce GBHL charges. Consequently, total port charges were reduced by USD 9.50/tonne, which is in line with claims made by GBHL (ca 2008)4.
- 13 -

Table 4: Port charges Cost Item Bulk Bagged Mombasa Price C&F 230 230 KGBH Ltd Stevedoring (Vessel Discharge) 6.5 6.5 Terminal Handling 4.5 4.5 Delivery 1.5 4 Storage (20 days) 5 5 KPA Charges Stevedoring 1.5 1.5 Wharfage 2 2 Other Agency charges 1.69 1.69 Fumigation 1.16 1.16 Subtotal 23.85 26.35 Fees (percent of C&F price) 5.38% 5.38% Fees 12.36 12.36 Total 36.22 38.72
Source: MAFAP estimates
Estimated transportation costs from Mombasa to Nairobi for wheat and maize have been reported by a large number of authors in recent years. They consistently use a number of around USD 34/tonne. Wheat has nearly the same density as maize, so a load of wheat and maize should have very similar transportation costs per tonne.
Transportation costs for large-scale maize farms from the farm gate to Nairobi have been estimated for the maize technical note in this series. The maize transportation costs are representative of costs on the long haul route between Eldoret and Nairobi. The same costs per tonne are used here for wheat.
Adjusted transportation costs are the same as those made for the maize technical note in this series. Two adjustments to market access costs in all transportation segments are based upon World Bank (2009b). The first adjustment is eliminating the portion of costs due to bribes and government fees, which reduces market access costs by 18-20 percent for small farmers. The World Bank (2009b) found that maize transportation is only profitable if trucks are overloaded. Therefore, the second adjustment is eliminating the effect of overloading, which increases market access costs by 12 percent for small farms and 15 percent for large and medium farms. The net result of these adjustments, therefore, is a relatively small gain for small farms and a small loss for large and medium scale farms. The resulting market access costs are provided in Table 5.
- 14 -

Table 5: Access costs Access Costs 2005 2006 2007 2008 2009 2010 Observed Border to wholesale Port Charges 2,549 2,435 2,591 3,047 2,843 3,045 Transport 2,569 2,451 2,289 2,352 2,630 2,694 Total 5,118 4,886 4,879 5,399 5,473 5,739 Farm to wholesale 3,022 2,884 2,693 2,767 3,094 3,169 Adjusted Border to wholesale 4,400 4,201 4,240 4,741 4,738 4,986 Farm to wholesale 3,088 2,961 2,751 2,843 3,124 3,199
Source: MAFAP calculations
EXTERNALITIES The practice of overloading in the trucking industry is assumed to create a negative externality in terms of road maintenance and safety for other road-users. This, however, does not affect the results for access costs as it does not affect observed costs and, therefore, is excluded from the adjusted costs estimate.
BUDGET AND OTHER TRANSFERS The main policy instrument to effect changes in market prices remains the trading activities of the NCPB. It can and does do this through purchasing grain and selling it at prices below procurement costs. This is most obvious in 2008 in the case of maize, when selling prices were actually below the CIF Mombasa cost of the South African grain NCPB was importing.
Even in other years, the NCPB may have deliberately or inadvertently generated a loss on its grain trading activity. The price it is paying wheat producers may be above farm gate parity, generating a subsidy to farmers, or the price it is selling to millers may be below wholesale parity, generating a subsidy to millers. As shown in Table 6, these subsidies are fairly small and may only reflect NCPB domestic market transactions since import maize subsidies are much larger, at least for 2008. Given that these estimates are domestic market subsidies, they do not enter into the calculations, but likely affect the price gaps and NRPs calculated.
Table 6: Budget transfers and Loans to NCPB
units 2005 2006 2007 2008 2009 2010 NCPB Subsidy to markets mKsh na na na 1,003 1,303 750 Allocation to wheat mKsh na na na 113 90 87 Allocation to wheat Ksh/T na na na 336 411 170
Source: MAFAP calculations based on data for 2008-2011 gathered through private communication with the MOA. The data has been allocated to wheat based on its national share in production of NCPB commodities.
QUALITY AND QUANTITY ADJUSTMENTS As described previously, imported wheat is mostly hard wheat, while Kenya produces mostly soft wheat. Even Kenyan soft wheat is reported to be of a lower quality than imported soft wheat. A
- 15 -
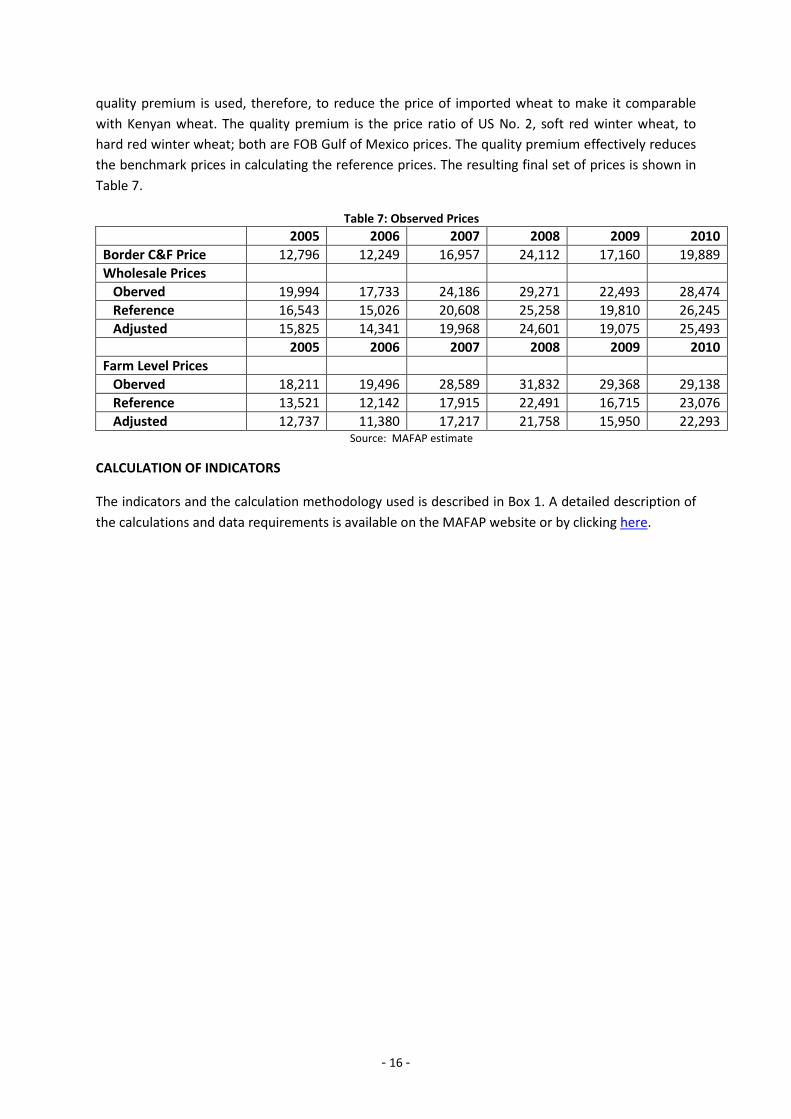
quality premium is used, therefore, to reduce the price of imported wheat to make it comparable with Kenyan wheat. The quality premium is the price ratio of US No. 2, soft red winter wheat, to hard red winter wheat; both are FOB Gulf of Mexico prices. The quality premium effectively reduces the benchmark prices in calculating the reference prices. The resulting final set of prices is shown in Table 7.
Table 7: Observed Prices 2005 2006 2007 2008 2009 2010 Border C&F Price 12,796 12,249 16,957 24,112 17,160 19,889 Wholesale Prices Oberved 19,994 17,733 24,186 29,271 22,493 28,474 Reference 16,543 15,026 20,608 25,258 19,810 26,245 Adjusted 15,825 14,341 19,968 24,601 19,075 25,493 2005 2006 2007 2008 2009 2010 Farm Level Prices Oberved 18,211 19,496 28,589 31,832 29,368 29,138 Reference 13,521 12,142 17,915 22,491 16,715 23,076 Adjusted 12,737 11,380 17,217 21,758 15,950 22,293
Source: MAFAP estimate
CALCULATION OF INDICATORS
The indicators and the calculation methodology used is described in Box 1. A detailed description of the calculations and data requirements is available on the MAFAP website or by clicking here.
- 16 -
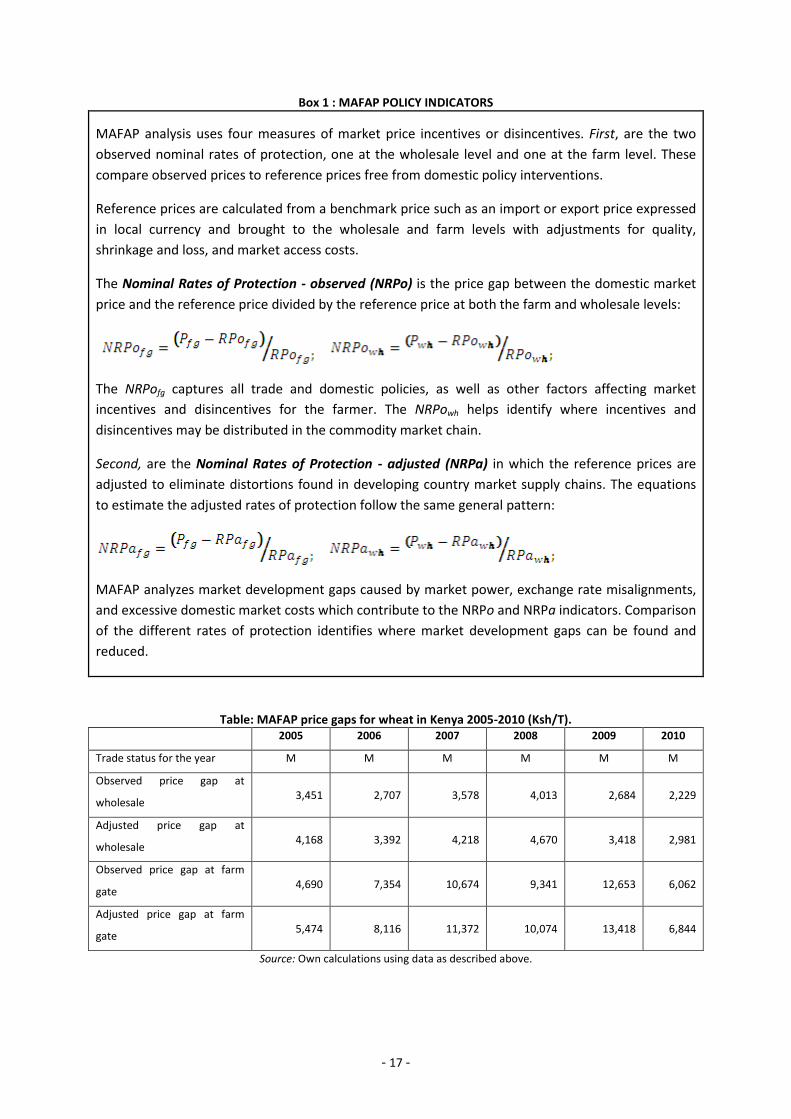
Box 1 : MAFAP POLICY INDICATORS MAFAP analysis uses four measures of market price incentives or disincentives. First, are the two observed nominal rates of protection, one at the wholesale level and one at the farm level. These compare observed prices to reference prices free from domestic policy interventions.
Reference prices are calculated from a benchmark price such as an import or export price expressed in local currency and brought to the wholesale and farm levels with adjustments for quality, shrinkage and loss, and market access costs.
The Nominal Rates of Protection - observed (NRPo) is the price gap between the domestic market price and the reference price divided by the reference price at both the farm and wholesale levels:
The NRPofg captures all trade and domestic policies, as well as other factors affecting market incentives and disincentives for the farmer. The NRPowh helps identify where incentives and disincentives may be distributed in the commodity market chain.
Second, are the Nominal Rates of Protection - adjusted (NRPa) in which the reference prices are adjusted to eliminate distortions found in developing country market supply chains. The equations to estimate the adjusted rates of protection follow the same general pattern:
MAFAP analyzes market development gaps caused by market power, exchange rate misalignments, and excessive domestic market costs which contribute to the NRPo and NRPa indicators. Comparison of the different rates of protection identifies where market development gaps can be found and reduced.
Table: MAFAP price gaps for wheat in Kenya 2005-2010 (Ksh/T). 2005 2006 2007 2008 2009 2010
Trade status for the year M M M M M M
Observed price gap at
wholesale 3,451 2,707 3,578 4,013 2,684 2,229
Adjusted price gap at
wholesale 4,168 3,392 4,218 4,670 3,418 2,981
Observed price gap at farm
gate 4,690 7,354 10,674 9,341 12,653 6,062
Adjusted price gap at farm
gate 5,474 8,116 11,372 10,074 13,418 6,844
Source: Own calculations using data as described above.
- 17 -

Table: MAFAP nominal rates of protection (NRP) for wheat in Kenya 2005-2010 (%). 2005 2006 2007 2008 2009 2010
Trade status for the year M M M M M M
Observed NRP at wholesale 20.86% 18.02% 17.36% 15.89% 13.55% 8.49% Adjusted NRP at wholesale 26.34% 23.65% 21.12% 18.98% 17.92% 11.70%
Observed NRP at farm gate 34.69% 60.57% 59.58% 41.53% 75.70% 26.27% Adjusted NRP at farm gate 42.97% 71.32% 66.05% 46.30% 84.12% 30.70%
Source: Own calculations using data as described above.
Table: MAFAP market development gaps for wheat in Kenya 2005-2010 (Tzsh per Mt). 2005 2006 2007 2008 2009 2010
Trade status for the year M M M M M M International markets gap (IRG) - - - - - - Exchange policy gap (ERPG) - - - - - - Access costs gap to point of competition (ACGwh)
717.76 684.96 639.52 657.17 734.84 752.71
Access costs gap to farm gate (ACGfg)
65.72 76.93 58.61 75.50 30.30 30.02
ND: No data available for calculation Source: Own calculations using data as described above.
- 18 -

5. INTERPRETATION OF THE INDICATORS
OBSERVED WHOLESALE PRICE GAPS AND RATES Figure 4 shows the price gaps at the wholesale and farm level, while Figure 5 shows the Nominal Rates of Protection (NRPs), which may be easier to interpret since they present the price gaps in relative terms.
The price gaps at wholesale level vary between KSH 2 200 and KSH 4 000 per tonne over the period 2005-10. The rate of protection at wholesale should generally be smaller than the tariff, in the absence of all other factors. The rate of protection at the border is the tariff divided by the benchmark price. In the absence of other distortions, the price gap at wholesale should also be the amount of the tariff; however, at wholesale the divisor is the sum of the benchmark price and market access costs from the border to the wholesale market. Therefore, the larger divisor at the wholesale should result in a NRP lower than the tariff5. In this case, this translates to a nominal rate of protection declining from about 20 percent in 2005 to about 8.5 percent in 2010.
OBSERVED FARM GATE RESULTS As shown in Figure 5, the observed rates of protection are significantly higher at the farm level. Part of this is due to the natural pattern that tariffs typically have across the marketing chain. If prices in a value chain are determined from an import benchmark price and are competitive throughout, then the NRP calculated at wholesale should be lower than the one calculated at either the border or the farm gate because of the effect of market access costs. These changes reflect the relative size of the divisor at these three points in the value chain. The price gap should be the same at all levels.
In the case of Kenya wheat, however, the observed price gap at the farm gate is much larger in all years than the observed price gap at wholesale. This is especially the case in the four years 2006-2009. The huge differences in price gaps seem to start in 2007, although they were already high in 2006. The surge in global prices in 2007-08 may have been a factor in securing these high prices for wheat farmers in Kenya. However, the price gap ratio in 2009 is nearly five times the gap at wholesale, which implies that farmers are being overpaid because they are getting a price that includes the tariff and much more.
There are two possible reasons why farmers are being overpaid. First, it may be possible that farmers do indeed have some sort of market power and are able to extract high prices from the system. According to one observer, Kenya wheat producers insist on:
“Using the import parity pricing of Hard wheat from Australia or Argentina, yet Hard wheat and Soft wheat are two separate products. Even the quality level of imported Soft wheat is higher than that of the locally produced Soft wheat. Furthermore, local producers rarely meet the recommended moisture content of 13 percent that allows easy separation of the germ from the endosperm.” (Nyangito, Ikiara, and Ronge)
Nearly all Kenyan imports during this period were from Russia and Ukraine at prices considerably below those of Australia white wheat. If the price paid by farmers is in fact determined by some sort
- 19 -

of formula, this might explain the big difference seen in the price gaps. The second reason is that the NCPB may simply over-estimate the opportunity cost prices that millers will need to pay and, as a result, are establishing prices higher than they need. The price gaps as a share of price result in an even higher observed NRPs at the farm level, as shown in Figure 5.
Figure 5:Wheat price gaps: observed and adjusted, farm and wholesale
Figure 6: Wheat NRPs: observed and adjusted, farm and wholesale
ADJUSTED PRICE GAPS AND RATES OF PROTECTION The adjusted price gaps and Nominal Rates of Protection are also shown in Figures 4 and 5. As described previously, it was only possible to estimate two types of market development gaps directly – those related to port handling charges and those related to road transportation.
- 20 -

Port charges were reduced to a somewhat arbitrary amount of USD 9.50/tonne, as suggested by Grain Bulk Handlers Ltd., the company that processes grain through the port. This is about one fourth of port charges. There is also a small adjustment in transportation charges due to the removal of the effect of bribes and fees as well as overloading of trucks. Since these charges offset each other, the overall impact of the adjustment is almost entirely due to lower port charges.
The lower port costs reduce market access costs between the port and Nairobi by about 12-14 percent and reduce wholesale reference prices by 3-4 percent, depending on the year. This has the opposite effect on the price gap, which increases 16-34 percent. Both of these effects combine to increase the nominal rate of protection at wholesale by 19-38 percent.
The same changes in gaps are passed on to the farm gate with different changes in percentage terms because of the different bases. Results at the farm level are summarized in Figure 6. This shows Kenya wheat farmers benefiting at large because of both the tariffs and either market power or NCPB policy, which allows them to get prices above parity. Without these two effects, farmers would receive much lower prices. The market development gaps at the port raise the cost of imports and provide an additional small amount of protection to farmers.
Figure 7: Wheat farm gate prices: observed, reference and adjusted
- 21 -
6. PRELIMINARY CONCLUSIONS AND RECOMMENDATIONS
MAIN MESSAGE For over 50 years, Kenya has long provided protection to wheat farmers in Kenya even though many of them are large-scale commercial farms. Overall, the number of large-scale farmers involved in wheat production is relatively small, while the number of small-scale farmers continues to grow. However, the number of small-scale farmers still seems to be relatively low, still amounting to only about 2 000 farms.
Government support to wheat farmers could perhaps have been justified at one time because most of the wheat was consumed by relatively rich Kenyans and the hotel and restaurant industries serving the needs of relatively wealthy Kenyans. However, in the recent rebasing of the consumer price index, the income share spent on wheat and wheat products by low income Kenyans in Nairobi is 10.68 percent of their total expenditure on food, compared to 11.46 percent for maize. Even in other urban areas, Kenyans are spending nearly as large a share of their food budget on wheat and wheat products as they do on maize and maize products – 9.69 percent versus 13.48 percent. A tariff on wheat is a tariff on poor consumers and, as MAFAP analysis has shown, it affects prices.
Kenya’s policy of explicit protection seems to be coming to an end with the reduction in the tariff to 10 percent in 2010 and the further reduction to zero announced in the July 2011 budget (see Annex 2 for a description of recent policy decisions affecting wheat). However, farm gate prices in recent years have been even higher than justified by the tariffs in effect. Other policy measures that have produced this result could also be reformed so that Kenyan wheat farmers’ prices in the future are based upon the full opportunity costs to the Kenyan economy.
PRELIMINARY RECOMMENDATIONS Maintain the zero tariff on wheat imports announced in the 2011 budget speech. If wheat farmers cannot produce wheat competitively, then market forces should guide them to other crops, such as maize, where Kenyan prices are well below the opportunity costs of imports from world markets. This will benefit consumers and encourage export of processed wheat products.
Further investigation of the causes of the high prices for wheat at the farm gate is warranted so that other price supports for wheat or undue market influence may be eliminated.
LIMITATIONS All conclusions provided are contingent on the quality of the data. Data at all levels are weak and somewhat dated, and wholesale price data for millers are completely lacking. The information available on subsidies in the system is also weak, but this should improve when the analysis of expenditure data is available.
- 22 -

FURTHER INVESTIGATION AND RESEARCH There are a number of areas where further research is needed. This includes deterring actual wholesale prices in Nairobi and further work on defining market access costs. Market access for road transportation has been based upon a single 2008 World Bank study. Further validation of these results would be extremely useful. Comparative work on port costs would also be extremely useful, especially those relating to bulk handling. It would also be useful to carry the analysis forward by examining the effect on consumers and comparing these results with those for other staple foods in Kenya and other countries in the region.
This preliminary draft was prepared by Cameron Short (FAO). Supplementary data and information were provided by the MAFAP team Nairobi (Kenya). Preliminary comments, inputs and suggestions were provided by Jean Balié (FAO), Keith Wiebe (FAO) and Jesús Barreiro-Hurle (FAO).
- 23 -

Bibliography
Chemonics International Inc., “Staple Foods Value Chain Analysis Country Report – Kenya,” January 2010. FAO Wheat Database, “Kenya production potential, ” Source: http://www.fao.org/ag/AGP/AGPC/doc/ field/Wheat/africa/Kenya/kenyaagec.htm Jan. 23, 2011 Grain Bulk Handlers Ltd., “Grain Bulk Handlers Profile,” Ca2008 Grain Bulk Handlers Ltd., “GBHL Tariff Sheet effective 1st January 2011,” December 2011. Jim Longmire and Juma Lugogo, “The Economics of Small-Scale Wheat Production Technologies for Kenya,” CIMMYT Economics Working Paper 89/01. David W. Makanda and James F, Oehmke, “Promise And Problem in the Development of, Kenya's Wheat Agriculture,” mimeo, Department of Agricultural Economics, Michigan State University, East Lansing. Philip M. Musyoka, “Wheat Import Demand and Welfare Effects of Import Controls in Kenya,” KIPPRA Discussion Paper No. 100, 2009 Milu Muyanga, T.S. Jayne, G. Argwings-Kodhek, Joshua Ariga, “Staple Food Consumption Patterns in Urban Kenya: Trends and Policy Implications,” Tegemeo Working Paper No. 16 Hezron Nyangito, Moses M. Ikiara, Eric E. Ronge, “Performance of Kenya’s Wheat Industry and Prospects for Regional Trade in Wheat Products, KIPPRA Discussion Paper No. 17, November 2002 PKF Consulting Ltd, “Grain Production in Kenya,”, the Export Processing Zones Authority, 2005.
- 24 -

ANNEX I: Methodology Used
A guide to the methodology used by MAFAP can be downloaded from the MAFAP website or by clicking here.
- 25 -

ANNEX 2: RECENT POLICY DECISIONS AFFECTING WHEAT IN KENYA
- 26 -

ANNEX 3. MARKET ACCESS COSTS FOR WHEAT
Table 7: Port costs for wheat imports in 1999
Item Argentina KSH/ton
USA KSH/ton
Australia KSH/ton
Argentina USD/ton
USA USD/ton
Australia USD/ton
C&F Mombasa 9,772 10,334 11,459 138.95 146.95 162.94 Tariff 3,896 3,896 3,896 55.40 55.40 55.40 Port Costs 2,501 2,531 2,591 35.56 35.99 36.85 Landed into store Mombasa 16,169 16,761 17,947 229.91 238.34 255.19 Road haulage to Nairobi 2,261 2,261 2,261 32.16 32.16 32.16 Landed Nairobi 18,430 19,023 20,208 262.07 270.50 287.35 Proportional to C&F 5.375% 5.375% 5.375% 5.375% 5.375% 5.375% Fixed Port Costs 1,976 1,976 1,976 28.09 28.09 28.09 Unavoidable Fixed Port Costs 201 201 201 2.85 2.85 2.85 Avoidable Fixed Port Costs 1,775 1,775 1,775 25.24 25.24 25.24
SOURCE: Hezron Nyangito, Moses M Ikiara, Eric E. Ronge, “Performance of Kenya’s Wheat Industry and Prospects for Regional Trade in Wheat Products, KIPPRA Discussion Paper No. 17, November 2002
- 27 -

Table 8: Estimates of Margins in Major Portions of Grain Supply Chains
Source USD/T KSH/T Port Charges Agriculture import surges study Apr 2000 39.93 2,991 Nyoro Kiiru & Jayne May 2001 27.86 1,950 Nyoro, Kirimi & Jayne 2003 35.63 2,672 Kirimi: Trends in … Jul 2009 37.62 2,927 Kirimi: Trends in … Jul 2009 34.12 2,654 Transport Mombasa to Nairobi Nyangito, Ikiara and Ronge 1999 32.16 2,261 Chemonics Inc. 2010 Agriculture import suges study Apr 2000 32.50 2,434 Nyoro Kiiru & Jayne May 2001 47.62 3,333 Nyoro, Kirimi & Jayne 2003 32.50 2,438 RATIN in Ke MOA Feb 2009 33.00 2,625 Kirimi: Trends in … Jul 2009 33.56 2,611 RATIN web site Aug 2011 33.00 3,062 Transport Surplus Area to Nairobi Kitali: Nyoro, Kirimi & Jayne 2003 33.33 2,500 Kitali: Nyoro 2001 42.54 3,342 Eldoret: Nyoro 2001 36.03 2,831
- 28 -

ANNEX 3. DATA AND CALCULATIONS USED IN THE ANALYSIS
Name of product WheatInternational currency US$ Local currency Ksh
Year 2005 2006 2007 2008 2009 2010DATA Unit Symbol trade status m m m m m m
Benchmark Price1 Observed US$/TON Pb(int$) 169.36 169.89 251.90 348.56 221.84 251.02
1b Adjusted US$/TON Pba 169.36 169.89 251.90 348.56 221.84 251.02 Exchange Rate
2 Observed Ksh/TON ERo 75.55 72.10 67.32 69.18 77.35 79.23 2b Adjusted Ksh/TON ERa 75.55 72.10 67.32 69.18 77.35 79.23
Access costs border - point of competition3 Observed Ksh/TON ACowh 5,117.91 4,886.19 4,879.48 5,398.59 5,473.09 5,739.13
3b Adjusted Ksh/TON ACawh 4,400.15 4,201.23 4,239.96 4,741.43 4,738.25 4,986.42 4 Domestic price at point of competition Ksh/TON Pdwh 19,993.66 17,732.63 24,186.37 29,270.84 22,493.14 28,474.16
Access costs point of competition - farm gate5 Observed Ksh/TON ACofg 3,022.16 2,884.03 2,692.71 2,767.01 3,094.08 3,169.33
5b Adjusted Ksh/TON ACafg 3,087.88 2,960.96 2,751.32 2,842.51 3,124.38 3,199.35 6 Farm gate price Ksh/TON Pdfg 18,211.00 19,495.50 28,589.00 31,832.40 29,368.30 29,137.60 7 Externalities associated with production Ksh/TON E8 Budget and other product related transfers Ksh/TON BOT - - - - - -
Quantity conversion factor (border - point of competition) Fraction QTwh 1.00 1.00 1.00 1.00 1.00 1.00 Quality conversion factor (border - point of competition) Fraction QLwh 0.89 0.83 0.93 0.82 0.84 1.03 Quantity conversion factor (point of competition - farm gate) Fraction QTfg 1.00 1.00 1.00 1.00 1.00 1.00 Quality conversion factor (point of competition - farm gate) Fraction QLfg 1.00 1.00 1.00 1.00 1.00 1.00
29
ENDNOTES
1 Strangely, there is a positive correlation of 0.29 between imports and production over the period 1960 – 2010. 2 The Kenya Farmers Association (KFA) was formed in the colonial era to give (large) farmers bargaining power on the input markets. It became involved in extending credit to farmers and acquiring subsidiaries, including Agricultural Machinery Ltd., the Kenya Seed Company and the Crop Protection Chemicals Ltd. The company experienced serious financial problems in 1995. More recently, the KFA is unable to meet its debt obligations and is looking to divest assets and\or obtain a government bailout of about Ksh1.3 billion. 3 The formula used is : Powh = (Pb * ERo + ACowh ) * QLwh See Annex 3 for variable definitions. 4 For comparison purposes, port charges for exporting wheat from the port of Thunder Bay in Canada over this period were between Cda$11-12/T. This includes costs for receiving, elevating and loading. Grain elevating companies in Thunder Bay have much greater scale economies but also higher unit costs in some other areas. 5 In other words, the rates of protection follow quite closely the patterns in the tariffs as shown in Table 6, by construction.
30