analysis of incentives and disincentives for sugar in the · pdf file ·...
TRANSCRIPT
ANALYSIS OF INCENTIVES AND DISINCENTIVES
FOR SUGAR IN THE UNITED REPUBLIC OF TANZANIA
OCTOBER 2012
This technical note is a product of the Monitoring African Food and Agricultural Policies project (MAFAP). It is a technical document intended primarily for internal use as background for the eventual MAFAP Country Report. This technical note may be updated as new data becomes available.
MAFAP is implemented by the Food and Agriculture Organization of the United Nations (FAO) in collaboration with the Organisation for Economic Co-operation and Development (OECD) and national partners in participating countries. It is financially supported by the Bill and Melinda Gates Foundation, the United States Agency for International Development (USAID), and FAO.
The analysis presented in this document is the result of the partnerships established in the context of the MAFAP project with governments of participating countries and a variety of national institutions.
For more information: http://www.fao.org/mafap
Suggested citation: Nkonya, N. & Barreiro-Hurle, J. 2012. Analysis of incentives and disincentives for sugar in the United Republic of Tanzania. Technical notes series, MAFAP, FAO, Rome. © FAO 2013 FAO encourages the use, reproduction and dissemination of material in this information product. Except where otherwise indicated, material may be copied, downloaded and printed for private study, research and teaching purposes, or for use in non-commercial products or services, provided that appropriate acknowledgement of FAO as the source and copyright holder is given and that FAO’s endorsement of users’ views, products or services is not implied in any way. All requests for translation and adaptation rights, and for resale and other commercial use rights should be made via www.fao.org/contact-us/licence-request or addressed to [email protected]. FAO information products are available on the FAO website (www.fao.org/publications) and can be purchased through [email protected].
2

SUMMARY OF THE NOTE Product: Sugar cane Period analyzed: 2005 – 2010 Trade status: Import in all years Sugarcane is an important commercial crop in The United Republic of Tanzania URT) which is
transformed into sugar in several plants throughout the country. During the last five years, cane production in URT has seen an extension in acreage and
production. As compared to 2005, cane production has increased by 17 percent from 2.3 million tonnes to 2.7 million tonnes. During the same period, the area under cane production has increased by 15 percent from 20 000 ha to 23 000.
URT is a net importer of sugar in global term, importing on average 64 percent of domestic apparent consumption.
The analysis undertaken shows no difference between observed and adjusted nominal rates of protection.
Our results show that sugar farmers are heavily taxed in URT, this taxation is mainly due to inefficiencies in the sugar milling industry and/or excessive power by the sugar mills.
Moreover, consumers are also heavily taxed, even when the Government changes the tariff policy for sugar on an ad-hoc basis.
Actions to be taken to reduce disincentives could include 1) improvement of the milling technology and capacity utilization and 2) further liberalization of the sugar market. Moreover, liberalizing sugar trade would allow consumers to get lower prices.
-40.00%
-30.00%
-20.00%
-10.00%
0.00%
10.00%
20.00%
2005 2006 2007 2008 2009 2010
Disin
cent
ives
In
cent
ives
Observed NRP at farm gate Adjusted NRP at farm gate
3

CONTENTS
SUMMARY OF THE NOTE ......................................................................................................................... 3
CONTENTS ............................................................................................................................................... 4
1. PURPOSE OF THE NOTE ................................................................................................................... 5
2. COMMODITY CONTEXT ................................................................................................................... 6
PRODUCTION ....................................................................................................................................... 6
CONSUMPTION/UTILIZATION ............................................................................................................. 8
MARKETING AND TRADE ................................................................................................................... 13
DESCRIPTION OF THE VALUE CHAIN AND PROCESSING .................................................................... 15
POLICY DECISIONS AND MEASURES .................................................................................................. 17
3. DATA REQUIREMENTS, DESCRIPTION AND CALCULATION OF INDICATORS ................................. 22
TRADE STATUS OF THE PRODUCTS ................................................................................................... 22
BENCHMARK PRICES .......................................................................................................................... 22
DOMESTIC PRICES ............................................................................................................................. 23
EXCHANGE RATES .............................................................................................................................. 25
ACCESS COSTS ................................................................................................................................... 25
EXTERNALITIES .................................................................................................................................. 29
BUDGET AND OTHER TRANSFERS ..................................................................................................... 29
QUALITY AND QUANTITY ADJUSTMENTS .......................................................................................... 29
SUMMARY TABLE FOR DATA DESCRIPTION ...................................................................................... 30
CALCULATION OF INDICATORS .......................................................................................................... 32
4. INTERPRETATION OF THE INDICATORS ......................................................................................... 35
5. PRELIMINARY CONCLUSIONS AND RECOMMENDATIONS ............................................................ 36
MAIN MESSAGE ................................................................................................................................. 36
PRELIMINARY RECOMMENDATIONS ................................................................................................. 36
LIMITATIONS ..................................................................................................................................... 36
FURTHER INVESTIGATION AND RESEARCH ....................................................................................... 36
BIBLIOGRAPHY ....................................................................................................................................... 37
ANNEX I: Methodology Used ................................................................................................................. 38
ANNEX II: Data and calculations used in the analysis ........................................................................... 39
............................................................................................................................................................... 39
4
1. PURPOSE OF THE NOTE This technical note aims to describe the market incentives and disincentives for sugar cane producers in URT. The note is a technical document and serves as input for the MAFAP Country Report.
For this purpose, yearly averages of farm-gate and wholesale prices are compared with reference prices calculated on the basis of the price of the commodity in the international market. The price gaps between the reference prices and the prices along the value chain indicate to which extent incentives (positive gaps) or disincentives (negative gaps) are present at the farm-gate and wholesale level. In relative terms, the price gaps are expressed as Nominal Rates of Protection (NRP). These key indicators are used by MAFAP to highlight the effects of policy and market development gaps on prices.
The note starts with a brief review of the commodity’s production and consumption as well as trade and policies affecting the commodity. It also provides a detailed description of how the key components of the price analysis have been obtained. Using this data, the MAFAP indicators are then calculated and interpreted in light of existing policies and market characteristics. The analysis is commodity and country specific and covers the period 2005-2010. The indicators have been calculated using available data from different sources for this period and are described in Chapter 3.
The outcomes of this analysis can be used by those stakeholders involved in policy-making for the food and agricultural sector. They can also serve as input for evidence-based policy dialogue at the country or regional level.
This technical note is not to be interpreted as an analysis of the value chain or detailed description of production, consumption or trade patterns. All information related to these areas is presented merely to provide background on the commodity under review, help understand major trends and facilitate the interpretation of the indicators.
Additionally, all information presented in this note is preliminary and still subject to review and validation.
5
2. COMMODITY CONTEXT Sugarcane is an important commercial crop in URT which is transformed into sugar in several plants throughout the country. Most sugarcane is grown by smallholders, in estates owned by the sugar processing factories as well as contract growers. The sugar industry in URT has an important socio-economic impact in terms of employment and economic activity. It provides direct employment to about 14 000 people and is the outlet for the produce of over 30 000 farming households. Considering an average of 2-3 economically active adults per household; this industry provides secondary employment to over 80 000 people. In addition, it provides cane farmers with total earnings of about 4 billion Tanzanian Shillings (TzSh) annually (approx. 2.7 million USD). Last, sugar industry related activities provide about 12.3 billion Tshs to Government revenue (i.e. 1.7 percent of total tax revenue).
URT stands a good chance of becoming sugar self-sufficient and net exporter of the essential product if there are strategic moves to attract more investors in the local sugar sub-sector. Apart from increasing sugar supply in the market and stabilizing prices, increased investments would create employment and support implementation of the governments’ ambitious Kilimo Kwanza (Agriculture First) Initiative. Experts believe that increased acreage under sugarcane and improved productivity technologies would significantly raise sugar production in the country.
PRODUCTION Sugarcane production
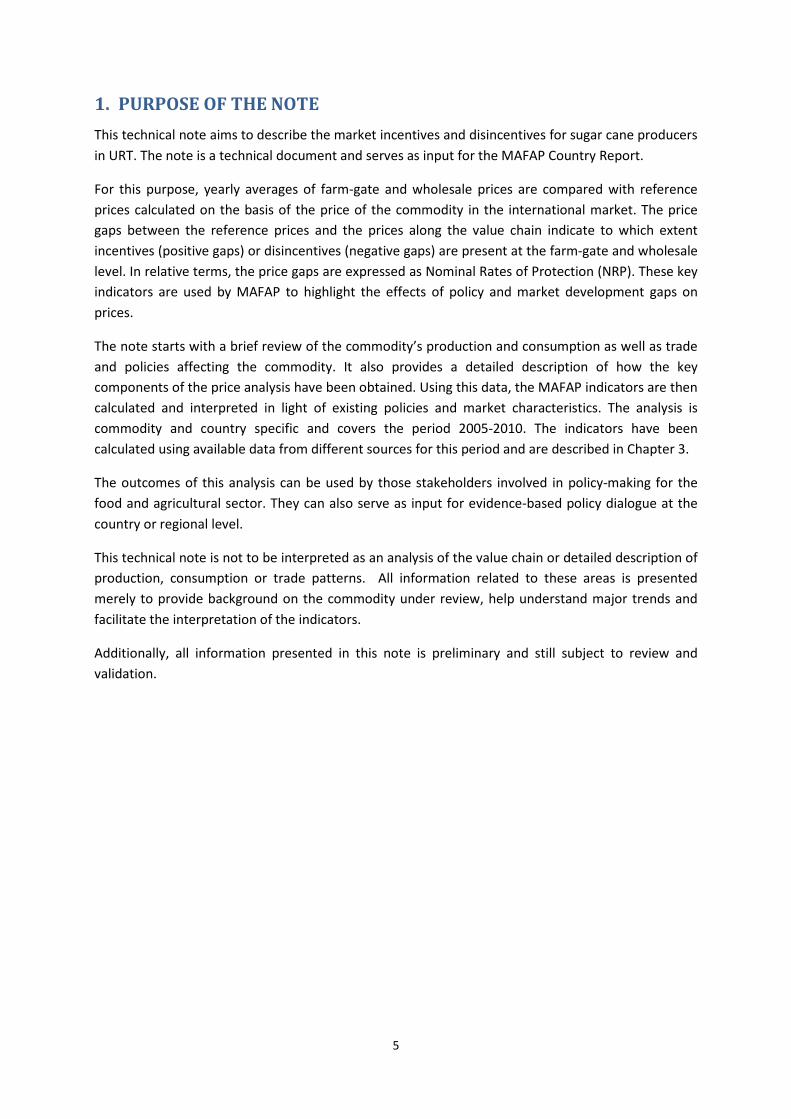
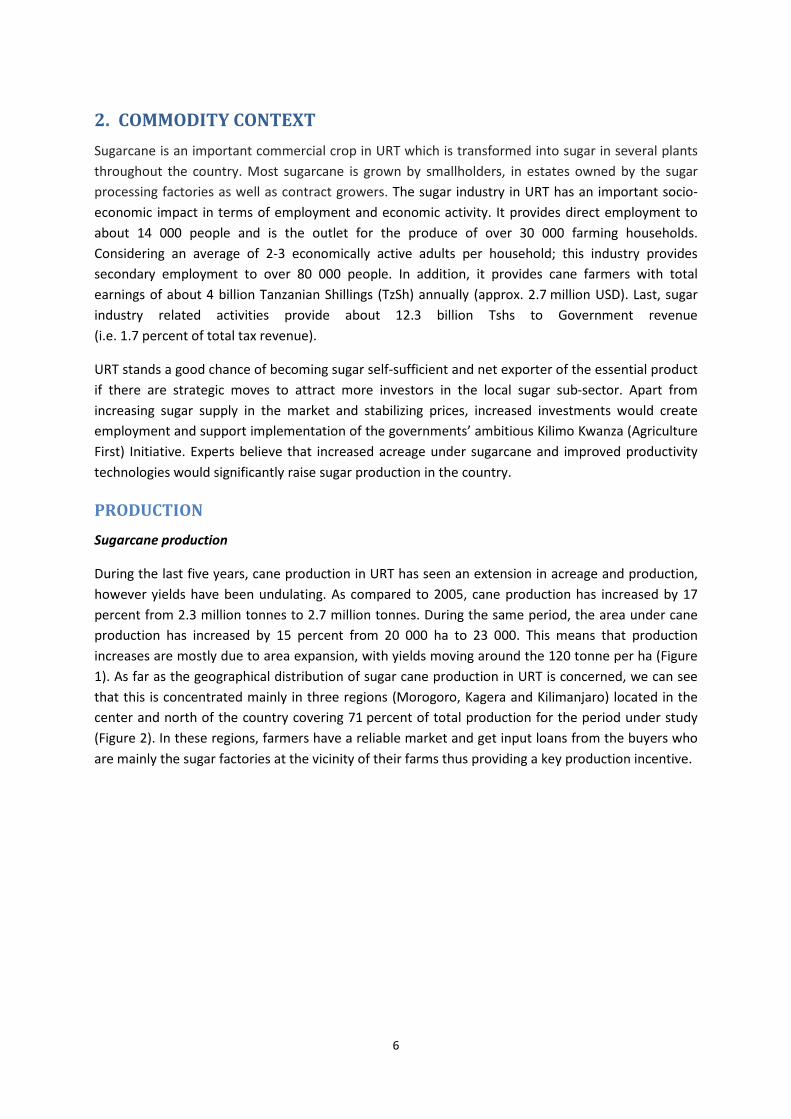
During the last five years, cane production in URT has seen an extension in acreage and production, however yields have been undulating. As compared to 2005, cane production has increased by 17 percent from 2.3 million tonnes to 2.7 million tonnes. During the same period, the area under cane production has increased by 15 percent from 20 000 ha to 23 000. This means that production increases are mostly due to area expansion, with yields moving around the 120 tonne per ha (Figure 1). As far as the geographical distribution of sugar cane production in URT is concerned, we can see that this is concentrated mainly in three regions (Morogoro, Kagera and Kilimanjaro) located in the center and north of the country covering 71 percent of total production for the period under study (Figure 2). In these regions, farmers have a reliable market and get input loans from the buyers who are mainly the sugar factories at the vicinity of their farms thus providing a key production incentive.
6
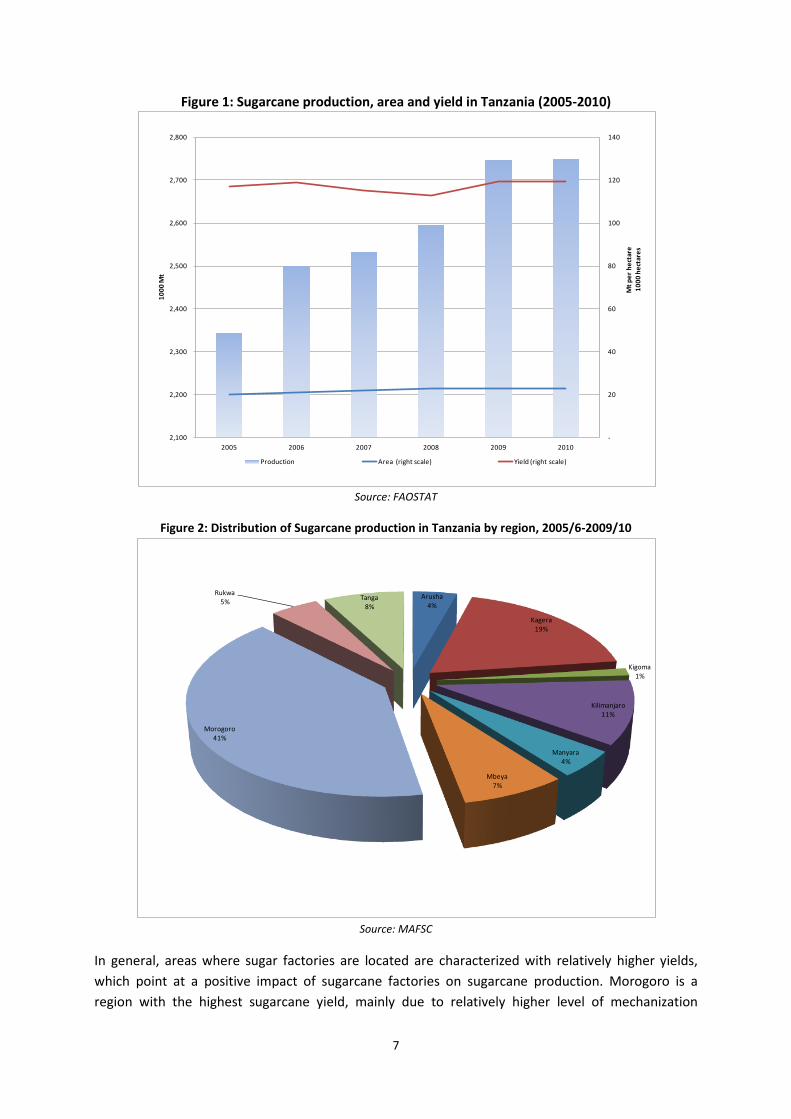
Figure 1: Sugarcane production, area and yield in Tanzania (2005-2010)
Source: FAOSTAT
Figure 2: Distribution of Sugarcane production in Tanzania by region, 2005/6-2009/10
Source: MAFSC
In general, areas where sugar factories are located are characterized with relatively higher yields, which point at a positive impact of sugarcane factories on sugarcane production. Morogoro is a region with the highest sugarcane yield, mainly due to relatively higher level of mechanization
2,100
2,200
2,300
2,400
2,500
2,600
2,700
2,800
-
20
40
60
80
100
120
140
2005 2006 2007 2008 2009 2010
1000
Mt
Mt p
er h
ecta
re10
00 h
ecta
res
Production Area (right scale) Yield (right scale)
Arusha4%
Kagera19%
Kigoma1%
Kilimanjaro11%
Manyara4%
Mbeya7%
Morogoro41%
Rukwa5% Tanga
8%
7

technologies (Figure 3). For example both Mtibwa and Kilombero sugar farms are fully installed with sprinkler irrigated systems. Besides, there is a reliable market for contract farmers and outgrowers. The factory owner gives contract with a clearly stated price at the end of the cropping season. Farmers also get soft loans for inputs. This shows that when marketing conditions are reliable, producers respond to incentives with reliable production.
Figure 3: Regional comparison of average sugar cane yield (2005 to 2010)
Source: MAFSC
CONSUMPTION/UTILIZATION Sugarcane processing
The sugar industry is one of the largest agro-processing industries in URT. It contributes approximately 35 percent of the gross output of the food-manufacturing sector and some 7 to 10 percent of total manufacturing value added (NDC - National Development Cooperation, 1992). There are four companies involved in raw sugar production: two located in Morogoro Region (Kilombero Sugar Company (KSC) and Mtibwa Sugar Estate (MSE)); one in Kilimanjaro region (Tanganyika Planting Company (TPC)); and one in Kagera region (Kagera Sugar Limited (KSL)) (Figure 12). All companies are under the control of domestic capital except for KSC which is owned by the South African corporation Illovo. The use of sugarcane production of each company and its share on total Tanzania’s production is reflected in Figure 4.
18
161
36
183
71
272
91 90
-
50
100
150
200
250
300
Arusha Kagera Kigoma Kilimanjaro Manyara Morogoro Rukwa Tanga
Mt p
er h
ecta
re
National Average 117 Mt/Ha
8
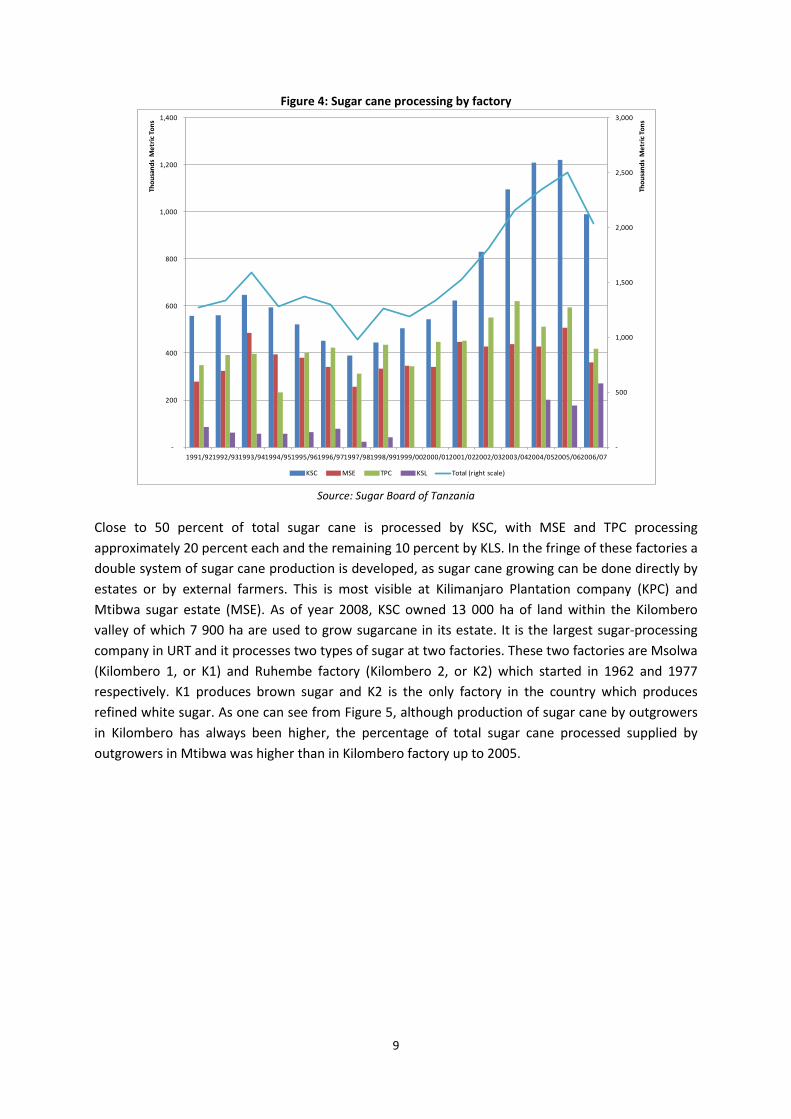
Figure 4: Sugar cane processing by factory
Source: Sugar Board of Tanzania
Close to 50 percent of total sugar cane is processed by KSC, with MSE and TPC processing approximately 20 percent each and the remaining 10 percent by KLS. In the fringe of these factories a double system of sugar cane production is developed, as sugar cane growing can be done directly by estates or by external farmers. This is most visible at Kilimanjaro Plantation company (KPC) and Mtibwa sugar estate (MSE). As of year 2008, KSC owned 13 000 ha of land within the Kilombero valley of which 7 900 ha are used to grow sugarcane in its estate. It is the largest sugar-processing company in URT and it processes two types of sugar at two factories. These two factories are Msolwa (Kilombero 1, or K1) and Ruhembe factory (Kilombero 2, or K2) which started in 1962 and 1977 respectively. K1 produces brown sugar and K2 is the only factory in the country which produces refined white sugar. As one can see from Figure 5, although production of sugar cane by outgrowers in Kilombero has always been higher, the percentage of total sugar cane processed supplied by outgrowers in Mtibwa was higher than in Kilombero factory up to 2005.
-
500
1,000
1,500
2,000
2,500
3,000
-
200
400
600
800
1,000
1,200
1,400
1991/921992/931993/941994/951995/961996/971997/981998/991999/002000/012001/022002/032003/042004/052005/062006/07
Thou
sand
s M
etric
Ton
s
Thou
sand
s M
etric
Ton
s
KSC MSE TPC KSL Total (right scale)
9
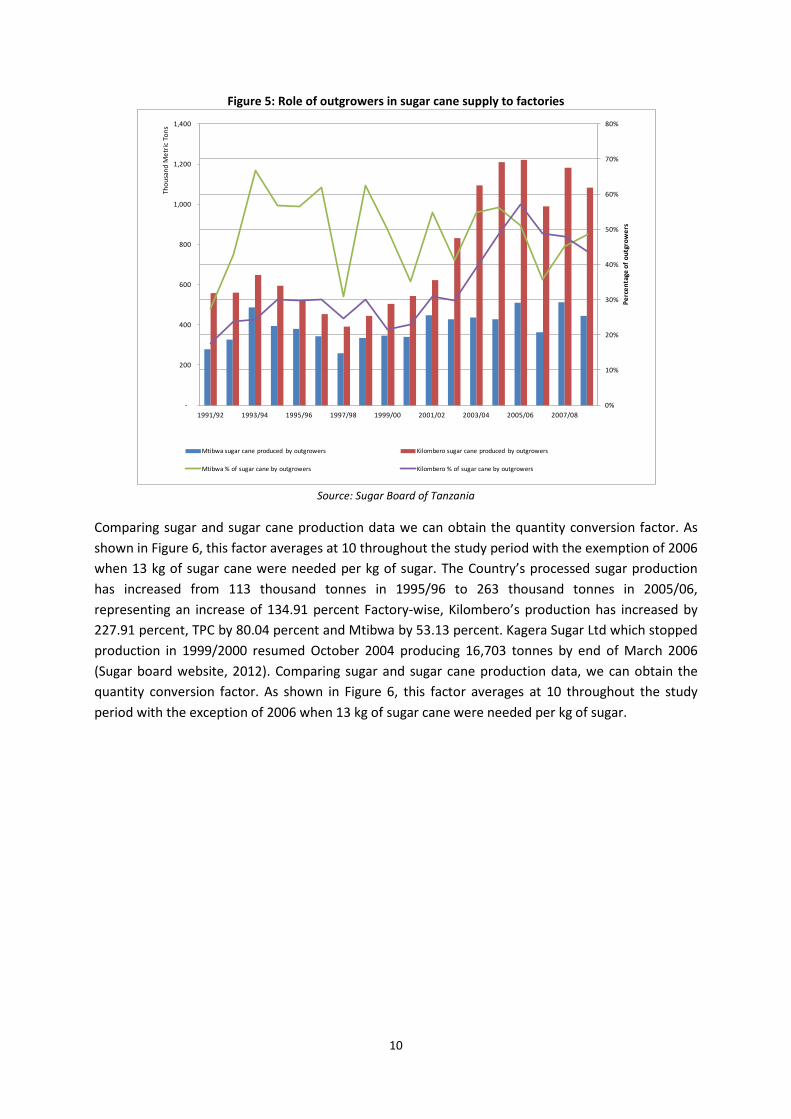
Figure 5: Role of outgrowers in sugar cane supply to factories
Source: Sugar Board of Tanzania
Comparing sugar and sugar cane production data we can obtain the quantity conversion factor. As shown in Figure 6, this factor averages at 10 throughout the study period with the exemption of 2006 when 13 kg of sugar cane were needed per kg of sugar. The Country’s processed sugar production has increased from 113 thousand tonnes in 1995/96 to 263 thousand tonnes in 2005/06, representing an increase of 134.91 percent Factory-wise, Kilombero’s production has increased by 227.91 percent, TPC by 80.04 percent and Mtibwa by 53.13 percent. Kagera Sugar Ltd which stopped production in 1999/2000 resumed October 2004 producing 16,703 tonnes by end of March 2006 (Sugar board website, 2012). Comparing sugar and sugar cane production data, we can obtain the quantity conversion factor. As shown in Figure 6, this factor averages at 10 throughout the study period with the exception of 2006 when 13 kg of sugar cane were needed per kg of sugar.
-
200
400
600
800
1,000
1,200
1,400
0%
10%
20%
30%
40%
50%
60%
70%
80%
1991/92 1993/94 1995/96 1997/98 1999/00 2001/02 2003/04 2005/06 2007/08
Thou
sand
Met
ric T
ons
Perc
enta
ge o
f out
grow
ers
Mtibwa sugar cane produced by outgrowers Kilombero sugar cane produced by outgrowers
Mtibwa % of sugar cane by outgrowers Kilombero % of sugar cane by outgrowers
10
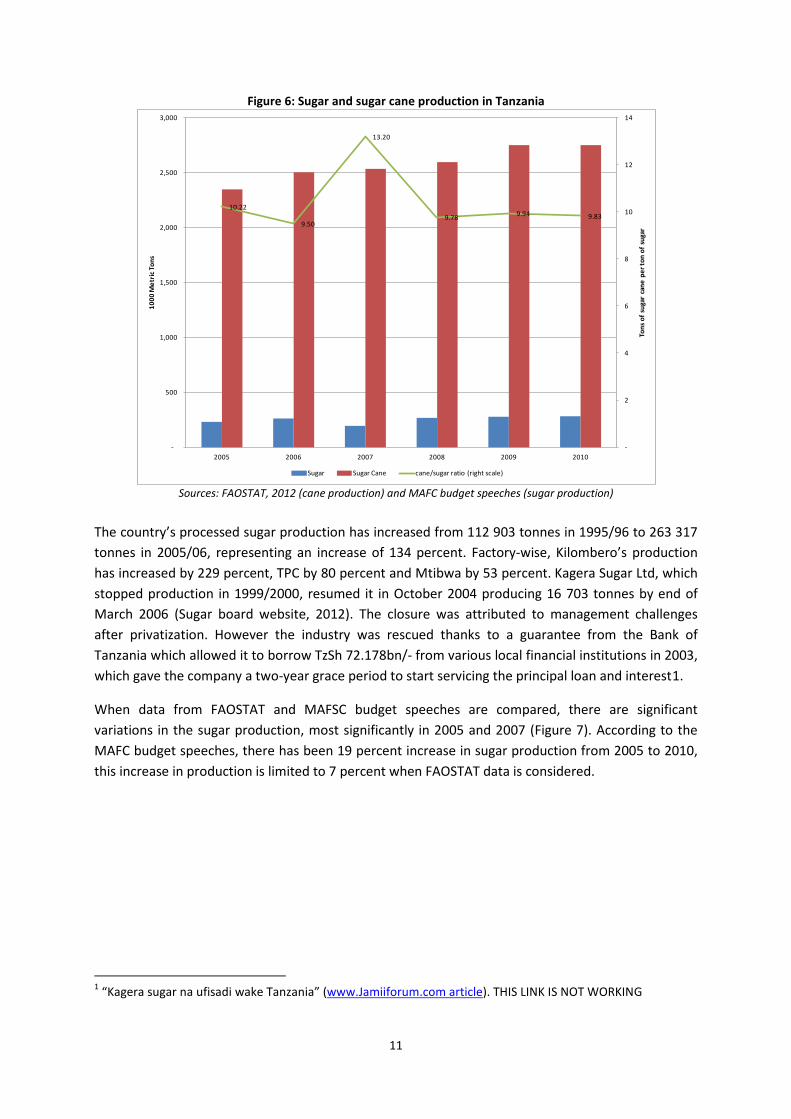
Figure 6: Sugar and sugar cane production in Tanzania
Sources: FAOSTAT, 2012 (cane production) and MAFC budget speeches (sugar production)
The country’s processed sugar production has increased from 112 903 tonnes in 1995/96 to 263 317 tonnes in 2005/06, representing an increase of 134 percent. Factory-wise, Kilombero’s production has increased by 229 percent, TPC by 80 percent and Mtibwa by 53 percent. Kagera Sugar Ltd, which stopped production in 1999/2000, resumed it in October 2004 producing 16 703 tonnes by end of March 2006 (Sugar board website, 2012). The closure was attributed to management challenges after privatization. However the industry was rescued thanks to a guarantee from the Bank of Tanzania which allowed it to borrow TzSh 72.178bn/- from various local financial institutions in 2003, which gave the company a two-year grace period to start servicing the principal loan and interest1.
When data from FAOSTAT and MAFSC budget speeches are compared, there are significant variations in the sugar production, most significantly in 2005 and 2007 (Figure 7). According to the MAFC budget speeches, there has been 19 percent increase in sugar production from 2005 to 2010, this increase in production is limited to 7 percent when FAOSTAT data is considered.
1 “Kagera sugar na ufisadi wake Tanzania” (www.Jamiiforum.com article). THIS LINK IS NOT WORKING
10.22
9.50
13.20
9.78 9.94 9.83
-
2
4
6
8
10
12
14
-
500
1,000
1,500
2,000
2,500
3,000
2005 2006 2007 2008 2009 2010
Tons
of s
ugar
can
e pe
r ton
of s
ugar
1000
Met
ric T
ons
Sugar Sugar Cane cane/sugar ratio (right scale)
11
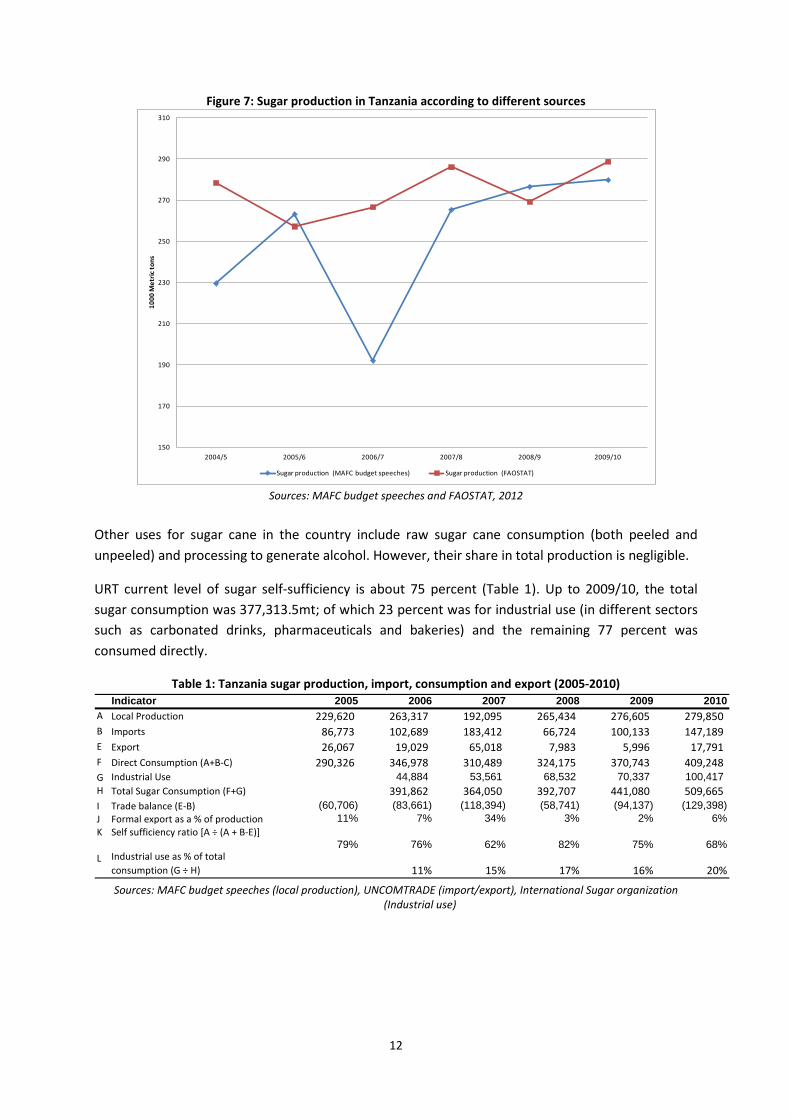
Figure 7: Sugar production in Tanzania according to different sources
Sources: MAFC budget speeches and FAOSTAT, 2012
Other uses for sugar cane in the country include raw sugar cane consumption (both peeled and unpeeled) and processing to generate alcohol. However, their share in total production is negligible.
URT current level of sugar self-sufficiency is about 75 percent (Table 1). Up to 2009/10, the total sugar consumption was 377,313.5mt; of which 23 percent was for industrial use (in different sectors such as carbonated drinks, pharmaceuticals and bakeries) and the remaining 77 percent was consumed directly.
Table 1: Tanzania sugar production, import, consumption and export (2005-2010)
Sources: MAFC budget speeches (local production), UNCOMTRADE (import/export), International Sugar organization
(Industrial use)
150
170
190
210
230
250
270
290
310
2004/5 2005/6 2006/7 2007/8 2008/9 2009/10
1000
Met
ric to
ns
Sugar production (MAFC budget speeches) Sugar production (FAOSTAT)
Indicator 2005 2006 2007 2008 2009 2010A Local Production 229,620 263,317 192,095 265,434 276,605 279,850 B Imports 86,773 102,689 183,412 66,724 100,133 147,189 E Export 26,067 19,029 65,018 7,983 5,996 17,791 F Direct Consumption (A+B-C) 290,326 346,978 310,489 324,175 370,743 409,248 G Industrial Use 44,884 53,561 68,532 70,337 100,417 H Total Sugar Consumption (F+G) 391,862 364,050 392,707 441,080 509,665 I Trade balance (E-B) (60,706) (83,661) (118,394) (58,741) (94,137) (129,398) J Formal export as a % of production 11% 7% 34% 3% 2% 6%K Self sufficiency ratio [A ÷ (A + B-E)]
79% 76% 62% 82% 75% 68%L Industrial use as % of total
consumption (G ÷ H) 11% 15% 17% 16% 20%
12
As a way of curbing the ever increasing import gap, the government increased sugar imports and also imposed an export ban on sugar to neighboring countries. One of the critical challenges facing the local sugar industry is the country’s porous borders and ports. Smuggling is not only creating shortage in the local market but also subjecting the government to huge losses due to tax evasion. In 2011, for example, the government was compelled to engage security organs to block illegal exportation of sugar to the neighboring countries facing acute shortage that pushed prices of the commodity to extraordinarily high levels. This results in very low per capita consumption levels (under 10 kg per person and year including sugar from industrial use).
MARKETING AND TRADE
Imports and export by destination countries
The Harmonized Commodity Description and Coding System (HS) of tariff nomenclature has four 6-digit codes for sugar products: raw sugar cane (HS 17.01.11); raw sugar beet (HS 17.01.12), Cane/beet with flavor/color (HS 17.01.91) and pure sucrose (a.k.a. sugar for industrial use) (HS 17.01.99). In the following analysis, all are going to be discussed either implicitly or explicitly.
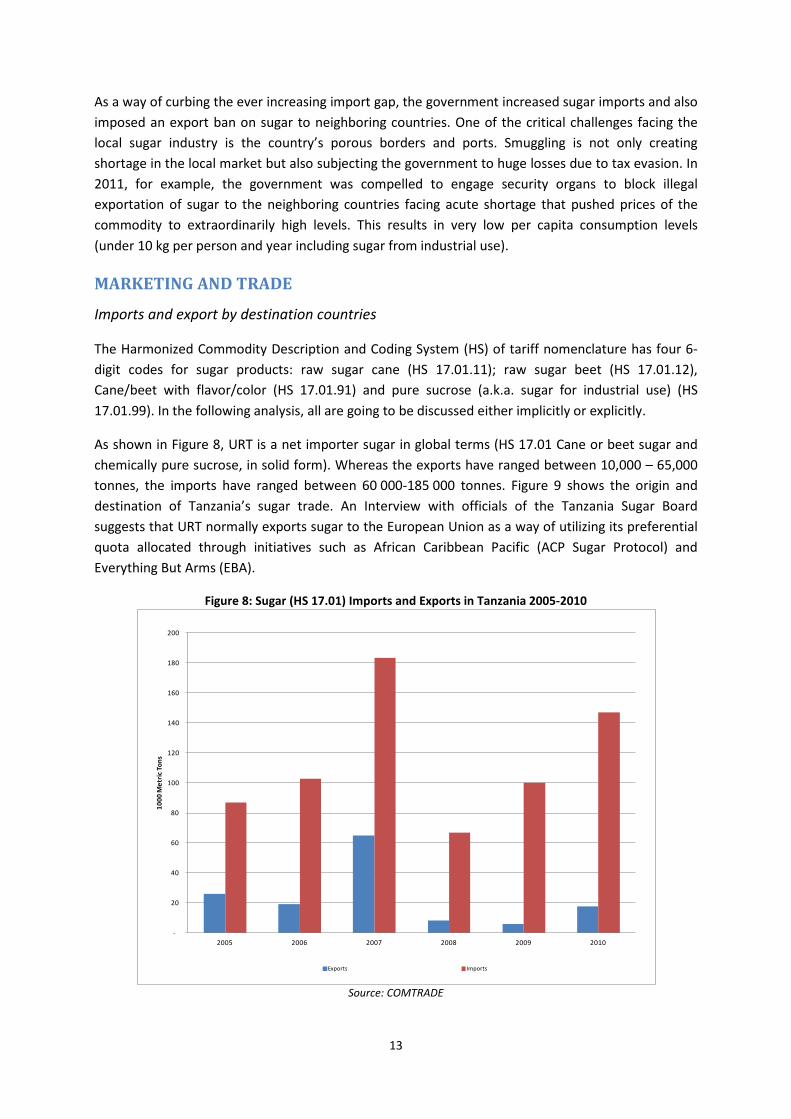
As shown in Figure 8, URT is a net importer sugar in global terms (HS 17.01 Cane or beet sugar and chemically pure sucrose, in solid form). Whereas the exports have ranged between 10,000 – 65,000 tonnes, the imports have ranged between 60 000-185 000 tonnes. Figure 9 shows the origin and destination of Tanzania’s sugar trade. An Interview with officials of the Tanzania Sugar Board suggests that URT normally exports sugar to the European Union as a way of utilizing its preferential quota allocated through initiatives such as African Caribbean Pacific (ACP Sugar Protocol) and Everything But Arms (EBA).
Figure 8: Sugar (HS 17.01) Imports and Exports in Tanzania 2005-2010
Source: COMTRADE
-
20
40
60
80
100
120
140
160
180
200
2005 2006 2007 2008 2009 2010
1000
Met
ric T
ons
Exports Imports
13
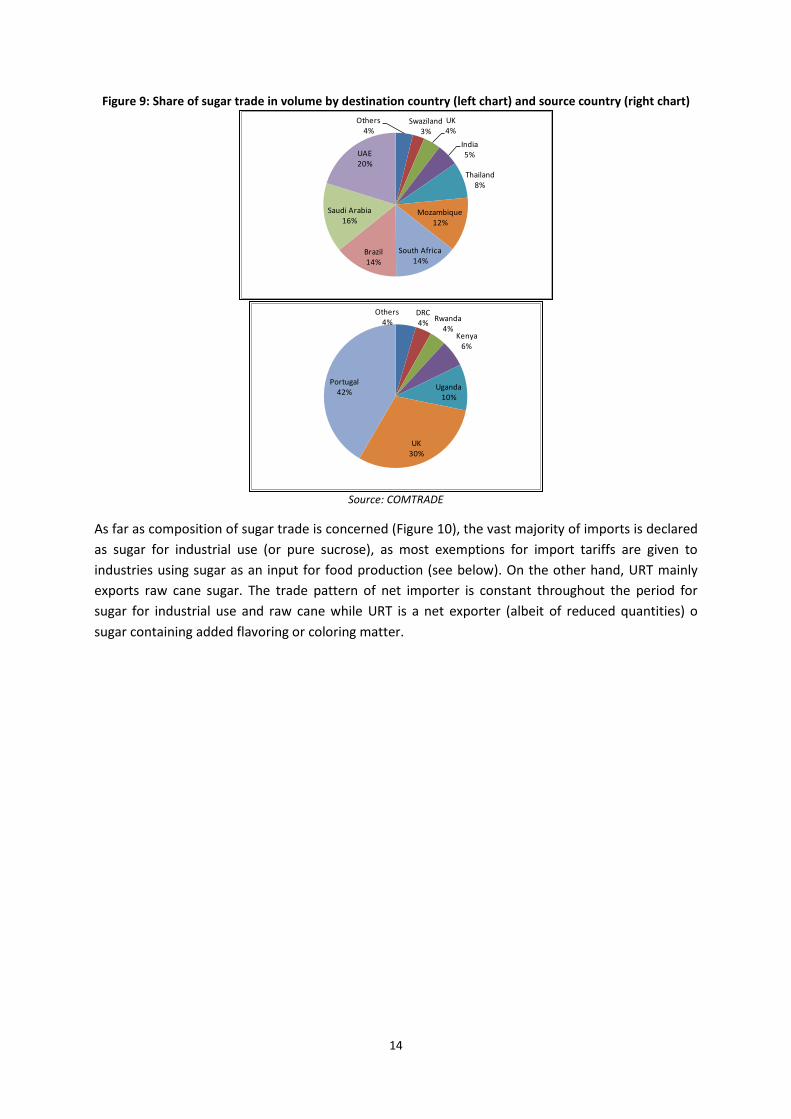
Figure 9: Share of sugar trade in volume by destination country (left chart) and source country (right chart)
Source: COMTRADE
As far as composition of sugar trade is concerned (Figure 10), the vast majority of imports is declared as sugar for industrial use (or pure sucrose), as most exemptions for import tariffs are given to industries using sugar as an input for food production (see below). On the other hand, URT mainly exports raw cane sugar. The trade pattern of net importer is constant throughout the period for sugar for industrial use and raw cane while URT is a net exporter (albeit of reduced quantities) o sugar containing added flavoring or coloring matter.
Others4%
Swaziland3%
UK4%
India5%
Thailand8%
Mozambique12%
South Africa14%
Brazil14%
Saudi Arabia16%
UAE20%
Others4%
DRC4% Rwanda
4%Kenya
6%
Uganda10%
UK30%
Portugal42%
14

Figure 10: Composition of sugar trade in Tanzania by sugar type(2005-2010)
Source: COMTRADE
DESCRIPTION OF THE VALUE CHAIN AND PROCESSING Sugar cane is produced by both the estates and outgrowers who ultimately sell to the sugar factories located at eastern, northern and northwestern part of URT. These factories then sell the sugar to local sellers or exporters. Whereas local wholesalers market it to retailers, exporters find markets to regional and global markets. All this process of internal and international sugar marketing is regulated by the Sugar Board of Tanzania (SBT). Since the locally produced sugar is insufficient for direct or industrial local consumption, there is an import inlet in all corners of the country.
Figure 11: Sugar value chain
Sugar is mainly marketed from its main production factories located in Morogoro, Kilimanjaro and Kagera.
0%
10%
20%
30%
40%
50%
60%
70%
80%
90%
100%
Exports Imports
17.01.99 Sugar for industrial use 17.01.91 Sugar containing added flavoring or coloring 17.01.12 Raw Beet Sugar 17.01.11 Raw Cane Sugar
15

This sugar is either directly consumed locally or exported to Burundi, Democratic Republic of Congo, Kenya, Spain, Sudan, Uganda or Zambia.
Figure 12: Sugar value chain map
Source: Nkonya, N.M
Since the start of buying sugarcane from small holder farmers (SHFs) in 1962, the price of sugarcane was set to fluctuate with the sucrose level in the sugarcane supplied by the SHFs. Sugar processing plants offered prices according to the sucrose levels measured in the laboratory. Since then different remunerations systems have developed.
After contract renegotiations between 1999 and 2000, in 2001 KSCL, ROA and KCGA representatives agreed to fix the prices at a 9 percent level of sucrose. Given the fertility of the area, this sucrose level was thought to be achievable for every farmer, while it mitigated the variability in income for farmers. It was seen as a good incentive for SHFs to grow more cane and as a solution to the measurement problem. However, processing units have significant market power. In some seasons, some factories pay farmers lower prices than the production unit costs2. This low pay is ascribed to the monopoly situation created by the existing laws that prohibit construction of another factory within the radius of 80 km from the existing one and the obligation for farmers within that radius to sell to Mtibwa factory only at a price dictated by the factory. Moreover, farmers face delay in payments. Even when contract farming requires payments to be done within 40 days after delivery, this requirement is not observed and payment occurs three to four months after delivery.
2 For the 2010/11 growing season in the producing area around Mtibwa, sugar factory farmer costs are approximately 43,000 TSh per tonne (30 USD) but buying price from MSE never surpassed 42,500 TzSh per tonne (29 USD).
Sugar producing
16
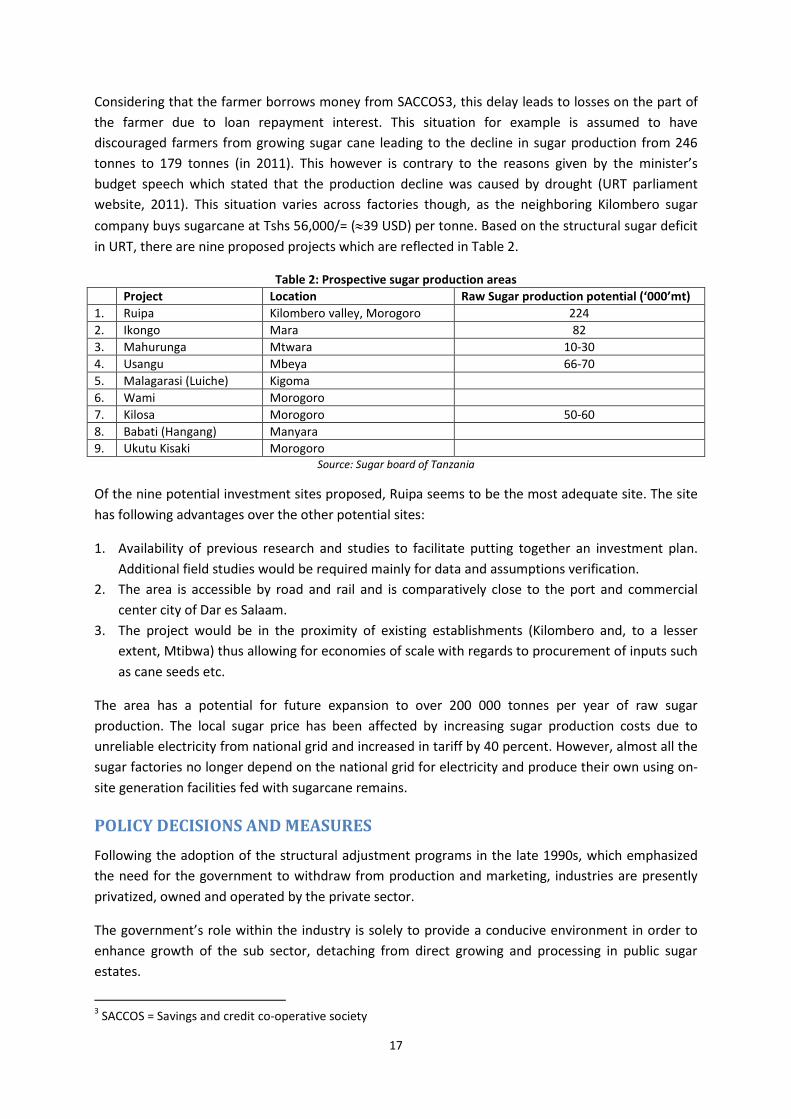
Considering that the farmer borrows money from SACCOS3, this delay leads to losses on the part of the farmer due to loan repayment interest. This situation for example is assumed to have discouraged farmers from growing sugar cane leading to the decline in sugar production from 246 tonnes to 179 tonnes (in 2011). This however is contrary to the reasons given by the minister’s budget speech which stated that the production decline was caused by drought (URT parliament website, 2011). This situation varies across factories though, as the neighboring Kilombero sugar company buys sugarcane at Tshs 56,000/= (≈39 USD) per tonne. Based on the structural sugar deficit in URT, there are nine proposed projects which are reflected in Table 2.
Table 2: Prospective sugar production areas Project Location Raw Sugar production potential (‘000’mt) 1. Ruipa Kilombero valley, Morogoro 224 2. Ikongo Mara 82 3. Mahurunga Mtwara 10-30 4. Usangu Mbeya 66-70 5. Malagarasi (Luiche) Kigoma 6. Wami Morogoro 7. Kilosa Morogoro 50-60 8. Babati (Hangang) Manyara 9. Ukutu Kisaki Morogoro
Source: Sugar board of Tanzania
Of the nine potential investment sites proposed, Ruipa seems to be the most adequate site. The site has following advantages over the other potential sites:
1. Availability of previous research and studies to facilitate putting together an investment plan. Additional field studies would be required mainly for data and assumptions verification.
2. The area is accessible by road and rail and is comparatively close to the port and commercial center city of Dar es Salaam.
3. The project would be in the proximity of existing establishments (Kilombero and, to a lesser extent, Mtibwa) thus allowing for economies of scale with regards to procurement of inputs such as cane seeds etc.
The area has a potential for future expansion to over 200 000 tonnes per year of raw sugar production. The local sugar price has been affected by increasing sugar production costs due to unreliable electricity from national grid and increased in tariff by 40 percent. However, almost all the sugar factories no longer depend on the national grid for electricity and produce their own using on-site generation facilities fed with sugarcane remains.
POLICY DECISIONS AND MEASURES Following the adoption of the structural adjustment programs in the late 1990s, which emphasized the need for the government to withdraw from production and marketing, industries are presently privatized, owned and operated by the private sector.
The government’s role within the industry is solely to provide a conducive environment in order to enhance growth of the sub sector, detaching from direct growing and processing in public sugar estates.
3 SACCOS = Savings and credit co-operative society
17
The sugar industry in URT is governed through the sugar industry parliamentary act No 26 of 2001 that came in force with effect from 28th January, 2002 by presidential assent. This act provides for the establishment of the Sugar Board of Tanzania and the National Sugar Institute, improvement, development, regulation of the sugar industry and matters related to. The sugar regulations were published under this act through publication in the gazette of the United Republic of Tanzania on 24th June 2005.
The Government encouraged the private sector to participate in the ownership and management of the public sugar estates with the aim of rehabilitating the estates so that the existing facilities produce sugar at full capacity (230 000 tonnes per year). The Government had, therefore, to create an environment in which new private estates and small scale processing plants were facilitated. Emphasis was directed to Mtwara, Ruvuma (Tunduru district) and Morogoro regions, which offered possibilities for the new direction (Agricultural and livestock policy, 1997).While existing facilities increased their production to full capacity utilization, the Government had an intention of putting in place a system that allowed private traders to import the commodity to supplement domestic production.
For Sugarcane growers, these regulations require that they are registered for the purpose of controlling sugarcane quality, establishing a basis for planning and making appropriate estimates of inputs, extension services and sugar cane growers credit requirements. All growers are required by these regulations to grow sugarcane in a farm with an area of at least 0.40469 ha within a radius not exceeding 40 km from a registered miller to which they have the obligation to sell their crop. Before growing sugarcane, a registered sugarcane grower, or in his name a sugar board agent or a growers association to which he belongs, shall enter into a commercial agreement with a sugar factory to whom he will sell sugarcane. The agreement provides for the sugarcane variety to be grown, quantity, obligations on harvest schedule and delivery/transport to the mill, price or its formula, the time lapse not exceeding 30 days between delivery and payment and related interest upon payment delay, which shall be equivalent to the ruling standard short term borrowing rate from a commercial Bank.
International trade in sugar is also ruled by domestic policies. All sugar exporters need to be licensed by the board and the expected proceeds from the exports need to substantially exceed the cost of importing the same quantity of sugar. The Board prescribes the maximum quantity of sugar that may be exported every year while taking into account the domestic sugar production, the requirement of sugar for domestic and industrial use, and a buffer stock equivalent to not less than two months domestic and industrial consumption. Figure 13 shows the different export quotas allocated to the different sugar producers in URT.
18
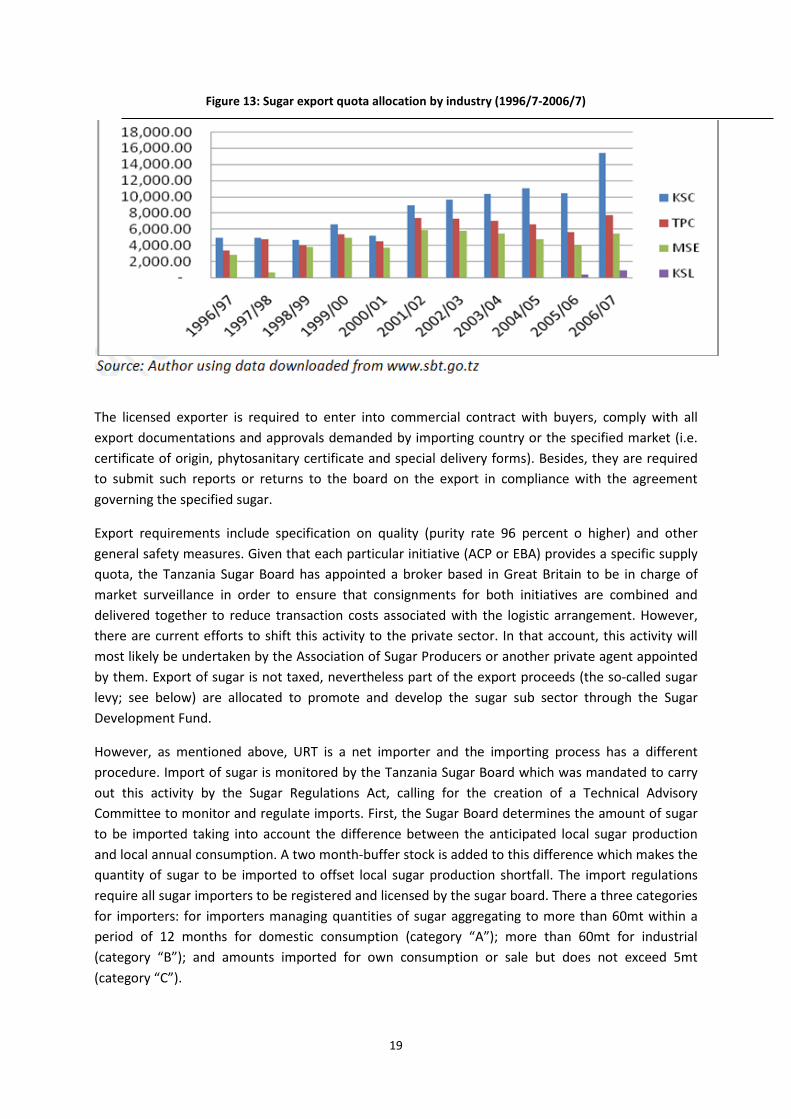
Figure 13: Sugar export quota allocation by industry (1996/7-2006/7)
The licensed exporter is required to enter into commercial contract with buyers, comply with all export documentations and approvals demanded by importing country or the specified market (i.e. certificate of origin, phytosanitary certificate and special delivery forms). Besides, they are required to submit such reports or returns to the board on the export in compliance with the agreement governing the specified sugar.
Export requirements include specification on quality (purity rate 96 percent o higher) and other general safety measures. Given that each particular initiative (ACP or EBA) provides a specific supply quota, the Tanzania Sugar Board has appointed a broker based in Great Britain to be in charge of market surveillance in order to ensure that consignments for both initiatives are combined and delivered together to reduce transaction costs associated with the logistic arrangement. However, there are current efforts to shift this activity to the private sector. In that account, this activity will most likely be undertaken by the Association of Sugar Producers or another private agent appointed by them. Export of sugar is not taxed, nevertheless part of the export proceeds (the so-called sugar levy; see below) are allocated to promote and develop the sugar sub sector through the Sugar Development Fund.
However, as mentioned above, URT is a net importer and the importing process has a different procedure. Import of sugar is monitored by the Tanzania Sugar Board which was mandated to carry out this activity by the Sugar Regulations Act, calling for the creation of a Technical Advisory Committee to monitor and regulate imports. First, the Sugar Board determines the amount of sugar to be imported taking into account the difference between the anticipated local sugar production and local annual consumption. A two month-buffer stock is added to this difference which makes the quantity of sugar to be imported to offset local sugar production shortfall. The import regulations require all sugar importers to be registered and licensed by the sugar board. There a three categories for importers: for importers managing quantities of sugar aggregating to more than 60mt within a period of 12 months for domestic consumption (category “A”); more than 60mt for industrial (category “B”); and amounts imported for own consumption or sale but does not exceed 5mt (category “C”).
19
Any person who wishes to import sugar must provide adequate information to the Board before an import license valid for each specific consignment is granted (ESRF). Some of the requirements for acquiring an import license include details of the company (address, location, VAT or TIN registration, trading license, business turnover, performance of previous year on sugar importation, sales distribution network in URT mainland) and details of the trade expected to undertake (quantity of sugar to be imported, and the number of importation lots). Granted licenses provide detailed information of category of sugar (for domestic consumption), quantity to be imported, validity period of the license, port of entry and fees payable. The import license is granted upon the payment of a non-refundable performance bond of 10 USD per tonne to the SBT. Other conditions include the payment of a per tonne license fee, confirmation of purchase agreement i.e. evidence of sugar supply agreement, and lastly a letter of comfort from the bank indicating that a particular trader is known, has an account with the bank and is financially capable. Imported sugar normally undergoes tests to examine if it complies with the minimum food standards before it is allowed to enter the local market (ibid).
Sugar levies and development fund: The regulations require that all large scale producers and sellers shall pay to the board a sugar levy equivalent to 2.75 USD per tonne of sugar sold in URT or 3 USD per tonne for sugar imported in mainland URT. The minister responsible for agriculture may vary these levies by publishing in the government Gazette. These levies are the sources of money for the sugar industry development fund and are used for sugarcane research, training, administration, outgrowers promotion and other related activities (see below).
To address the sugar deficit in URT, some actors have considered installing an export ban as that existing for some staples. The export ban will definitely weaken the sugar supply and so the best way is for concerted efforts to increase production and tape the shortage in other countries as a business opportunity. Increased production will close the current demand-supply gap and create sugar surplus for export markets. Local producers should capitalize on frequent shortages in neighboring countries (Own observations, 2012).
As with all other export commodities, Sugarcane is part of the public research establishment (through the ZARDIs4). The research is co-financed by the industry and the government, with the private sector playing an increasing role in agricultural and livestock services, in particular with respect to extension, training and technical services which are under ASDP. The sugar research institute is located about 40 km west of Dar es Salaam city along Morogoro road at Tumbi, Kibaha township, Pwani region5.
Despite government interventions, retail sugar price continued to rise and in some regions especially those in the border with neighboring countries, a kilo was sold for as high as 2,600 TzSh. In Dar es Salaam, for example, retail price for sugar ranges between 2,000 and 2,400 TzSh a kilo.
4 ZARDI = Zonal Agricultural Research and Development Institutes 5 This is a Sugarcane breeding Station that was established in 1972 under the then EAAFRO (East African Agricultural and Forestry Research Organization) of the East African Community. It replaced Kikambala Station near Mombasa, which had operated since 1967. After the Community had collapsed in February 1977, the station was taken over by the Tanzanian Ministry of Agriculture until 1st March 1982 when it came under the administration of TARO (Tanzania Agricultural Research Organization). However, it was later, in 1989 retaken when TARO ceased to exist, and is now under the department of research and development (DRD).
20

Sugar tariff regime
The common external tariff (CET) for sugar is of 100 percent unless it is unrefined which then has a 35 percent tariff. The 2007 version of the CET moves sugar to the sensitive items section (Schedule 2) and raises the tariff to 100 percent or 200 USD whatever is higher. However URT, during the period under study, has enacted different transitory measures reducing the tariff, abolishing it or giving special permits for sugar of industrial use. These transitory measures made the tariffs undulate between zero and 25 percent.
Table 3: Sugar import tariff and quantity imported (tonnes) Source
(EAC gazette) Product Quantity
(tonnes) Tariff (%) Period
EAC/15/2008 Sugar for industrial use (1701.99)
73 000 10% One year from 1st July 2008
EAC/13/2009 Sugar for industrial use (1701.99)
10% Twelve months as of 1st July 2009
EAC/7/2010 Sugar (1701.11, 1701.12, 1701.91 and 1701.99)
65 000 25% Three months from 30 March 2010 to 30th June 2010
EAC/9/2010 Sugar for industrial use (1701.99)
30 550 10% Six months from 30 March 2010
EAC/23/2010 Sugar for industrial use (1701.99)
120 060 10% One year from 1st July 2010
EAC/10/2011 Sugar (1701.11, 1701.12, 1701.91 and 1701.99)
40 000 0% Six months from 1st January, 2011
EAC/20/2011 Sugar for Industrial use (1701.99)
110 571 10% One year from 20st June 2011
These exemptions, mainly due to the specific dates for which they are granted, generate problems with the importers as in some cases the purchase date is during the tariff exemption or reduction period and the delivery date is not. There have been cases where important loads of sugar have been stuck in the port of Dar es Salaam while there is shortage of sugar in the country due to this kind of misunderstandings.
21

3. DATA REQUIREMENTS, DESCRIPTION AND CALCULATION OF INDICATORS
The analysis of price dis/incentives is carried out for the period of 2005-2010 and aims at estimating price gaps and rates of protection at wholesale and farm-gate levels. According to the review in the foregoing chapters, the analysis is made considering that the point of competition takes place at the border since URT is a net importer of sugar.
TRADE STATUS OF THE PRODUCTS
As mentioned above, URT is a net importer of sugar.
BENCHMARK PRICES For imported products, the benchmark price must reflect the CIF cost of sugar in the port of entry to the country, in this case Dar es Salaam. Two sources of data for import and export prices are available in URT, the Tanzania revenue authority (TRA) and the UN commodity trade databases (UNCOMTRADE). In both data sets, we can compute unit prices for the four sugar commodity groups. Unit value trends for the four commodities can be seen in Figure 14.
Figure 14: Unit value of imported sugar products in Tanzania (2005-2010)
Source: COMTRADE
As the most traded product is sugar for industrial use (HS 1701.99) we have considered this as the most reliable price information and we use it as the benchmark price for our analysis. This sugar is the highest quality and purity; however as our domestic price for the point of competition is based on retail prices (see below) we consider that the quality of both reference and domestic prices can be the same. The benchmark price used for the analysis is reflected in Table 4.
-
200
400
600
800
1,000
1,200
1,400
1,600
1,800
2,005 2,006 2,007 2,008 2,009 2,010
USD
per
met
ric to
n
HS 1701.99 Sugar for industrial use HS 1701.92 Sugar containing added flavor or color HS1701.12 Raw beet sugar HS 1701.12 Raw cane sugar
22
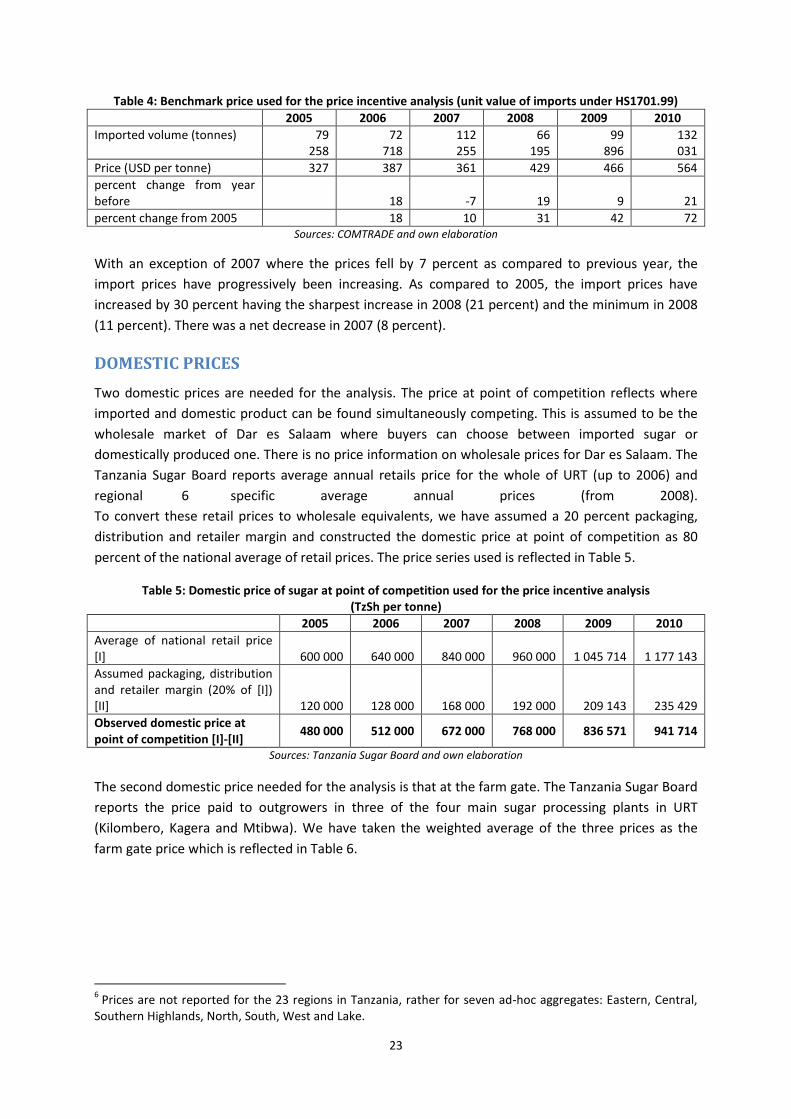
Table 4: Benchmark price used for the price incentive analysis (unit value of imports under HS1701.99) 2005 2006 2007 2008 2009 2010 Imported volume (tonnes) 79
258 72
718 112
255 66
195 99
896 132
031 Price (USD per tonne) 327 387 361 429 466 564 percent change from year before 18 -7 19 9 21 percent change from 2005 18 10 31 42 72
Sources: COMTRADE and own elaboration
With an exception of 2007 where the prices fell by 7 percent as compared to previous year, the import prices have progressively been increasing. As compared to 2005, the import prices have increased by 30 percent having the sharpest increase in 2008 (21 percent) and the minimum in 2008 (11 percent). There was a net decrease in 2007 (8 percent).
DOMESTIC PRICES Two domestic prices are needed for the analysis. The price at point of competition reflects where imported and domestic product can be found simultaneously competing. This is assumed to be the wholesale market of Dar es Salaam where buyers can choose between imported sugar or domestically produced one. There is no price information on wholesale prices for Dar es Salaam. The Tanzania Sugar Board reports average annual retails price for the whole of URT (up to 2006) and regional 6 specific average annual prices (from 2008). To convert these retail prices to wholesale equivalents, we have assumed a 20 percent packaging, distribution and retailer margin and constructed the domestic price at point of competition as 80 percent of the national average of retail prices. The price series used is reflected in Table 5.
Table 5: Domestic price of sugar at point of competition used for the price incentive analysis (TzSh per tonne)
2005 2006 2007 2008 2009 2010 Average of national retail price [I] 600 000 640 000 840 000 960 000 1 045 714 1 177 143 Assumed packaging, distribution and retailer margin (20% of [I]) [II] 120 000 128 000 168 000 192 000 209 143 235 429 Observed domestic price at point of competition [I]-[II] 480 000 512 000 672 000 768 000 836 571 941 714
Sources: Tanzania Sugar Board and own elaboration
The second domestic price needed for the analysis is that at the farm gate. The Tanzania Sugar Board reports the price paid to outgrowers in three of the four main sugar processing plants in URT (Kilombero, Kagera and Mtibwa). We have taken the weighted average of the three prices as the farm gate price which is reflected in Table 6.
6 Prices are not reported for the 23 regions in Tanzania, rather for seven ad-hoc aggregates: Eastern, Central, Southern Highlands, North, South, West and Lake.
23

Table 6: Weighted average of outgrower prices for sugar cane in main sugar mills in Tanzania (TzSh per tonne of sugar cane)
2005 2006 2007 2008 2009 2010
Price (TzSh per ton) Kilombero 22 635 24 266 31 500 35 017 36 590 54 103 Mtibwa 18 500 20 500 26 500 30 516 31 722 38 337 Kagera 30 000 33 600 Production (tons) Kilombero 588 051 696 253 481 147 568 169 473 457 413 640 Mtibwa 241 063 259 952 129 624 230 874 216 600 179 884 Kagera 2 712 4 082 Domestic Price at Farm gate (TzSh per ton) Weighted average of three plants
21 433 23 242 30 439 33 717 35 042 49 217
Source: Tanzania Sugar Board and own elaboration.
As it can be seen in Figure 15, prices at point of competition and farm gate have followed the same trend during the study period and the share of sugar cane costs over sugar price (taking into account the sugar cane to sugar ratio) has been more or less constant over time.
Figure 15: Domestic prices used in the analysis (Tzsh per tonne of sugar equivalent)
Sources: Tanzania Sugar Board and own elaboration
0.0%
5.0%
10.0%
15.0%
20.0%
25.0%
30.0%
35.0%
40.0%
45.0%
-
200
400
600
800
1,000
1,200
1,400
1,600
2003 2004 2005 2006 2007 2008 2009 2010 2011
Shar
e of
who
lesa
le p
rice
Thou
sand
s
Share of FG over Wholesale Wholesale price
Farm gate price (sugar equivalent at FAOSTAT conversion rate) Farm gate price (sugar equivalent at 10% conversion rate)
Linear (Share of FG over Wholesale)
24
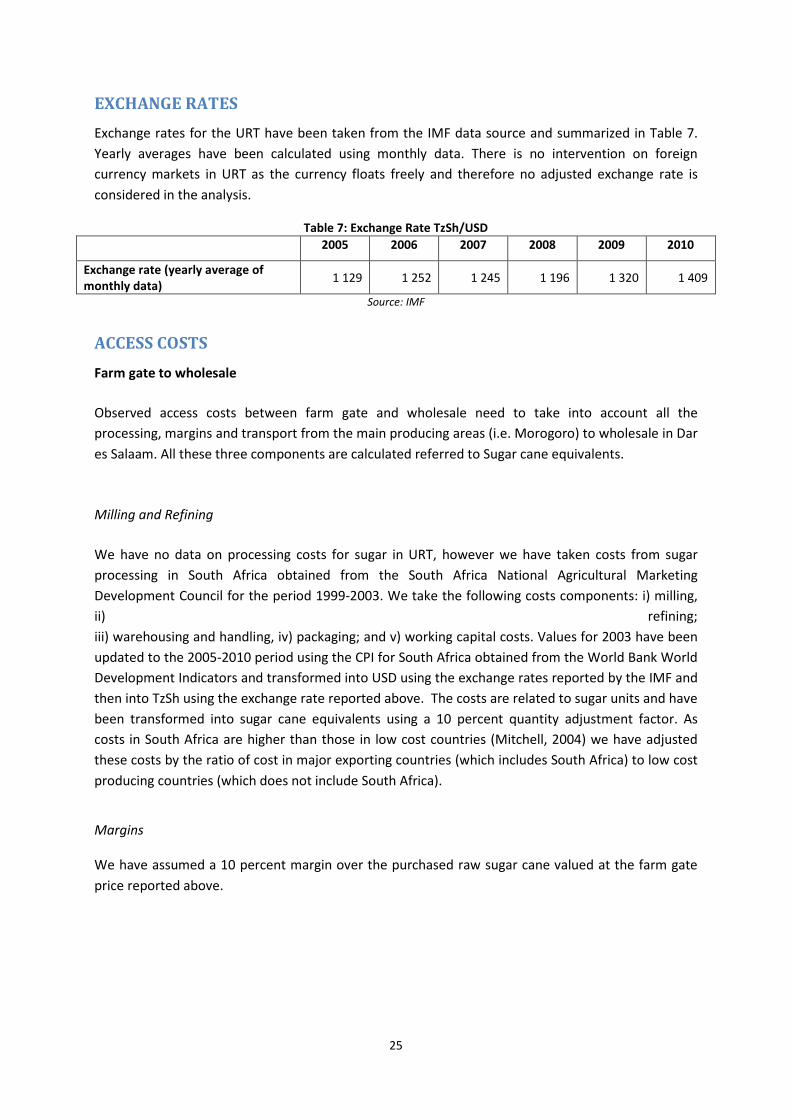
EXCHANGE RATES Exchange rates for the URT have been taken from the IMF data source and summarized in Table 7. Yearly averages have been calculated using monthly data. There is no intervention on foreign currency markets in URT as the currency floats freely and therefore no adjusted exchange rate is considered in the analysis.
Table 7: Exchange Rate TzSh/USD 2005 2006 2007 2008 2009 2010
Exchange rate (yearly average of monthly data) 1 129 1 252 1 245 1 196 1 320 1 409
Source: IMF
ACCESS COSTS
Farm gate to wholesale
Observed access costs between farm gate and wholesale need to take into account all the processing, margins and transport from the main producing areas (i.e. Morogoro) to wholesale in Dar es Salaam. All these three components are calculated referred to Sugar cane equivalents.
Milling and Refining
We have no data on processing costs for sugar in URT, however we have taken costs from sugar processing in South Africa obtained from the South Africa National Agricultural Marketing Development Council for the period 1999-2003. We take the following costs components: i) milling, ii) refining; iii) warehousing and handling, iv) packaging; and v) working capital costs. Values for 2003 have been updated to the 2005-2010 period using the CPI for South Africa obtained from the World Bank World Development Indicators and transformed into USD using the exchange rates reported by the IMF and then into TzSh using the exchange rate reported above. The costs are related to sugar units and have been transformed into sugar cane equivalents using a 10 percent quantity adjustment factor. As costs in South Africa are higher than those in low cost countries (Mitchell, 2004) we have adjusted these costs by the ratio of cost in major exporting countries (which includes South Africa) to low cost producing countries (which does not include South Africa).
Margins
We have assumed a 10 percent margin over the purchased raw sugar cane valued at the farm gate price reported above.
25
Transport
We have assumed an average distance from sugar mills to Dar es Salaam of 350 km and a unit cost per tonne of sugar of 0.11 USD per tonne and km to obtain the transport costs. These are converted into TzSh using the average annual exchange rate and into raw cane equivalents using a 10 percent quantity adjustment factor.
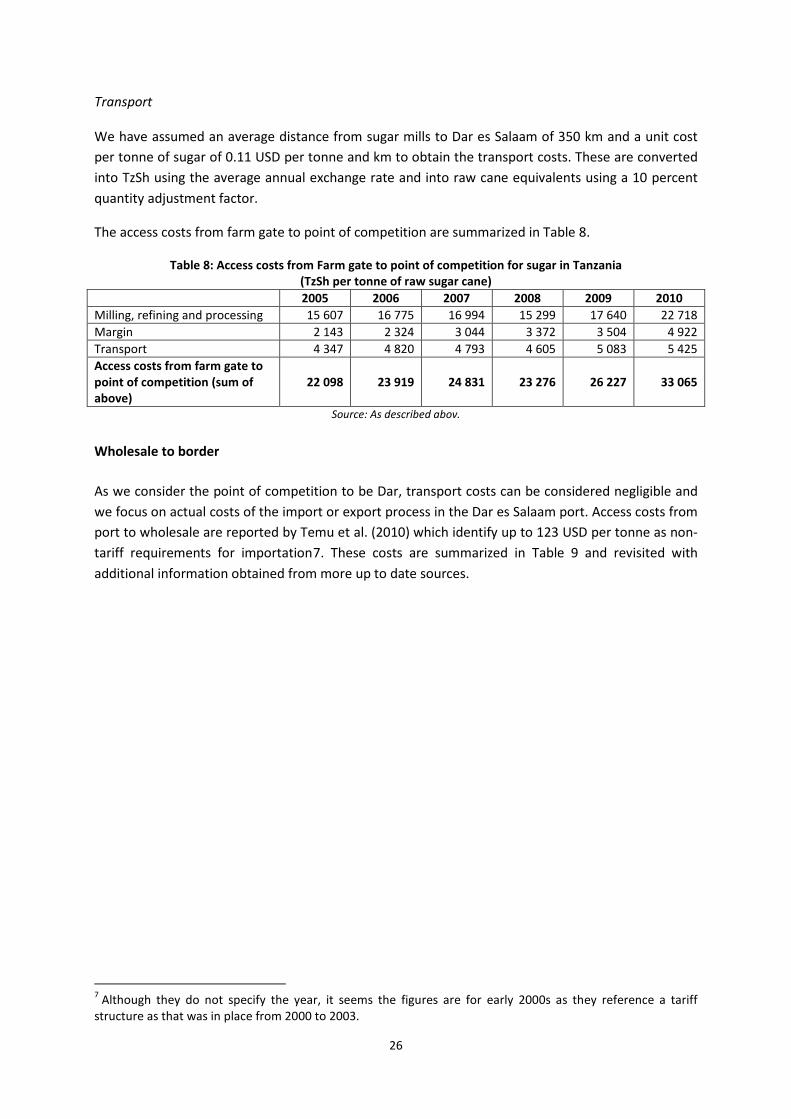
The access costs from farm gate to point of competition are summarized in Table 8.
Table 8: Access costs from Farm gate to point of competition for sugar in Tanzania (TzSh per tonne of raw sugar cane)
2005 2006 2007 2008 2009 2010 Milling, refining and processing 15 607 16 775 16 994 15 299 17 640 22 718 Margin 2 143 2 324 3 044 3 372 3 504 4 922 Transport 4 347 4 820 4 793 4 605 5 083 5 425 Access costs from farm gate to point of competition (sum of above)
22 098 23 919 24 831 23 276 26 227 33 065
Source: As described abov.
Wholesale to border
As we consider the point of competition to be Dar, transport costs can be considered negligible and we focus on actual costs of the import or export process in the Dar es Salaam port. Access costs from port to wholesale are reported by Temu et al. (2010) which identify up to 123 USD per tonne as non-tariff requirements for importation7. These costs are summarized in Table 9 and revisited with additional information obtained from more up to date sources.
7 Although they do not specify the year, it seems the figures are for early 2000s as they reference a tariff structure as that was in place from 2000 to 2003.
26
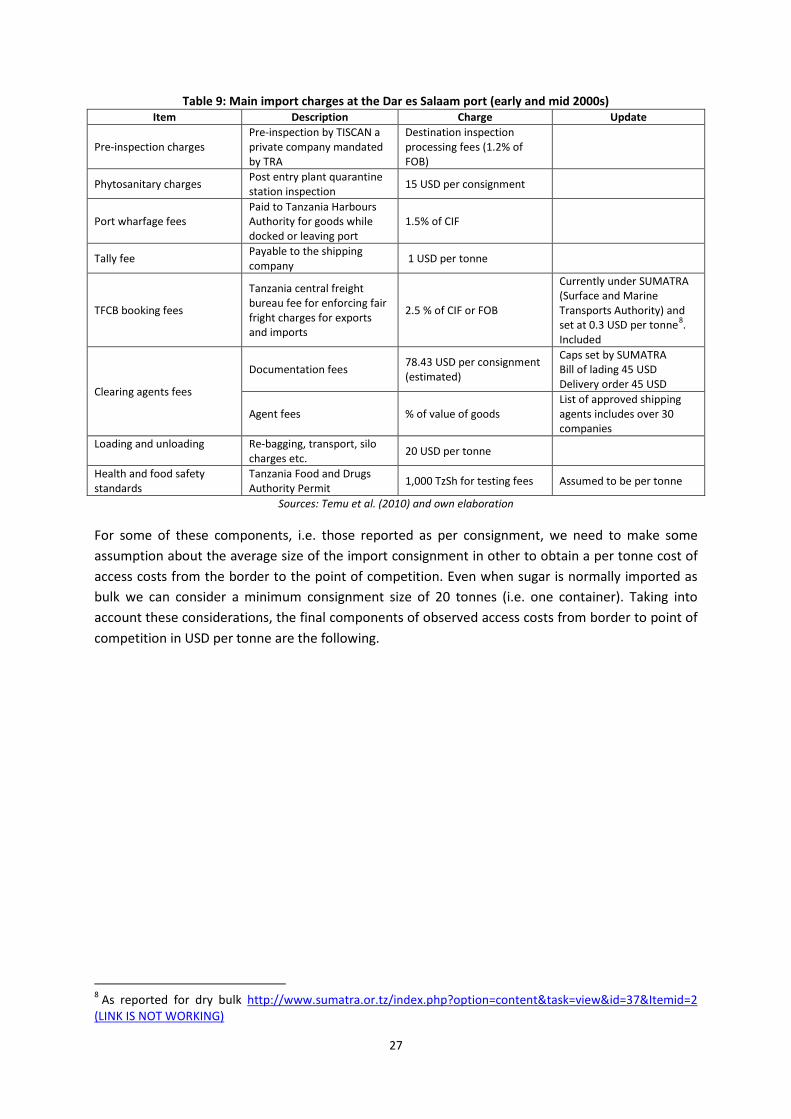
Table 9: Main import charges at the Dar es Salaam port (early and mid 2000s) Item Description Charge Update
Pre-inspection charges Pre-inspection by TISCAN a private company mandated by TRA
Destination inspection processing fees (1.2% of FOB)
Phytosanitary charges Post entry plant quarantine station inspection 15 USD per consignment
Port wharfage fees Paid to Tanzania Harbours Authority for goods while docked or leaving port
1.5% of CIF
Tally fee Payable to the shipping company 1 USD per tonne
TFCB booking fees
Tanzania central freight bureau fee for enforcing fair fright charges for exports and imports
2.5 % of CIF or FOB
Currently under SUMATRA (Surface and Marine Transports Authority) and set at 0.3 USD per tonne8. Included
Clearing agents fees
Documentation fees 78.43 USD per consignment (estimated)
Caps set by SUMATRA Bill of lading 45 USD Delivery order 45 USD
Agent fees % of value of goods List of approved shipping agents includes over 30 companies
Loading and unloading Re-bagging, transport, silo charges etc. 20 USD per tonne
Health and food safety standards
Tanzania Food and Drugs Authority Permit 1,000 TzSh for testing fees Assumed to be per tonne
Sources: Temu et al. (2010) and own elaboration
For some of these components, i.e. those reported as per consignment, we need to make some assumption about the average size of the import consignment in other to obtain a per tonne cost of access costs from the border to the point of competition. Even when sugar is normally imported as bulk we can consider a minimum consignment size of 20 tonnes (i.e. one container). Taking into account these considerations, the final components of observed access costs from border to point of competition in USD per tonne are the following.
8 As reported for dry bulk http://www.sumatra.or.tz/index.php?option=content&task=view&id=37&Itemid=2 (LINK IS NOT WORKING)
27
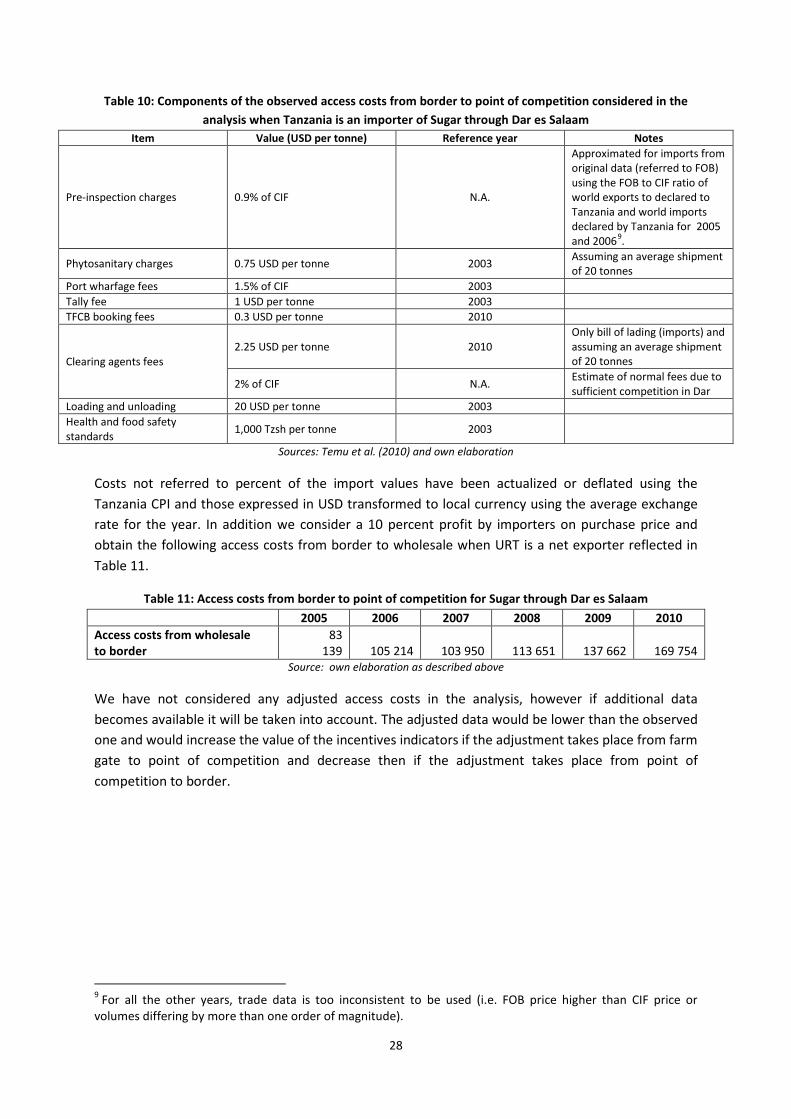
Table 10: Components of the observed access costs from border to point of competition considered in the analysis when Tanzania is an importer of Sugar through Dar es Salaam
Item Value (USD per tonne) Reference year Notes
Pre-inspection charges 0.9% of CIF N.A.
Approximated for imports from original data (referred to FOB) using the FOB to CIF ratio of world exports to declared to Tanzania and world imports declared by Tanzania for 2005 and 20069.
Phytosanitary charges 0.75 USD per tonne 2003 Assuming an average shipment of 20 tonnes
Port wharfage fees 1.5% of CIF 2003 Tally fee 1 USD per tonne 2003 TFCB booking fees 0.3 USD per tonne 2010
Clearing agents fees 2.25 USD per tonne 2010
Only bill of lading (imports) and assuming an average shipment of 20 tonnes
2% of CIF N.A. Estimate of normal fees due to sufficient competition in Dar
Loading and unloading 20 USD per tonne 2003 Health and food safety standards 1,000 Tzsh per tonne 2003
Sources: Temu et al. (2010) and own elaboration
Costs not referred to percent of the import values have been actualized or deflated using the Tanzania CPI and those expressed in USD transformed to local currency using the average exchange rate for the year. In addition we consider a 10 percent profit by importers on purchase price and obtain the following access costs from border to wholesale when URT is a net exporter reflected in Table 11.
Table 11: Access costs from border to point of competition for Sugar through Dar es Salaam 2005 2006 2007 2008 2009 2010 Access costs from wholesale to border
83 139 105 214 103 950 113 651 137 662 169 754
Source: own elaboration as described above
We have not considered any adjusted access costs in the analysis, however if additional data becomes available it will be taken into account. The adjusted data would be lower than the observed one and would increase the value of the incentives indicators if the adjustment takes place from farm gate to point of competition and decrease then if the adjustment takes place from point of competition to border.
9 For all the other years, trade data is too inconsistent to be used (i.e. FOB price higher than CIF price or volumes differing by more than one order of magnitude).
28
EXTERNALITIES We are not aware of any positive or negative externalities associated with sugar production in URT and have therefore not considered this concept in the analysis.
BUDGET AND OTHER TRANSFERS We have not been able to identify an allocation key for sugar and therefore no BOT have been considered.
QUALITY AND QUANTITY ADJUSTMENTS As benchmark prices and wholesale prices are referred to sugar and farm gate price are referred to sugar cane we have used a technical conversion coefficient of sugar cane to sugar of 0.10.
29
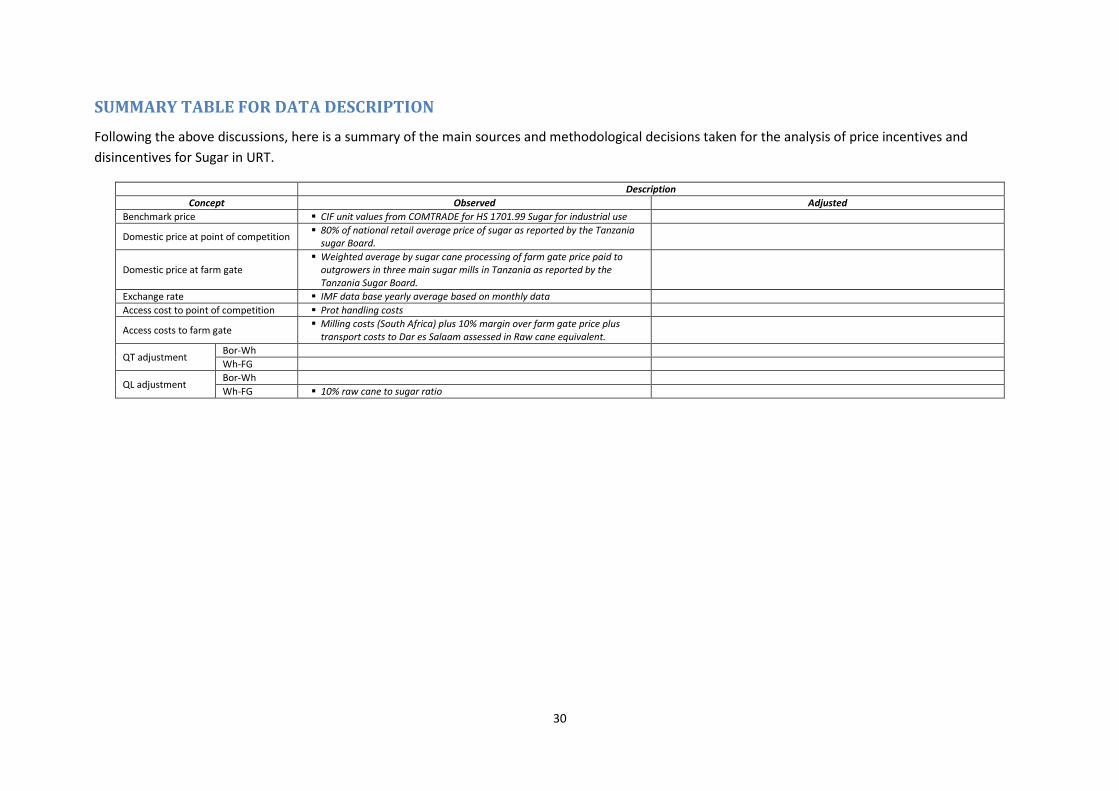
SUMMARY TABLE FOR DATA DESCRIPTION Following the above discussions, here is a summary of the main sources and methodological decisions taken for the analysis of price incentives and disincentives for Sugar in URT.
Description Concept Observed Adjusted
Benchmark price CIF unit values from COMTRADE for HS 1701.99 Sugar for industrial use
Domestic price at point of competition 80% of national retail average price of sugar as reported by the Tanzania sugar Board.
Domestic price at farm gate Weighted average by sugar cane processing of farm gate price paid to
outgrowers in three main sugar mills in Tanzania as reported by the Tanzania Sugar Board.
Exchange rate IMF data base yearly average based on monthly data Access cost to point of competition Prot handling costs
Access costs to farm gate Milling costs (South Africa) plus 10% margin over farm gate price plus transport costs to Dar es Salaam assessed in Raw cane equivalent.
QT adjustment Bor-Wh Wh-FG
QL adjustment Bor-Wh Wh-FG 10% raw cane to sugar ratio
30
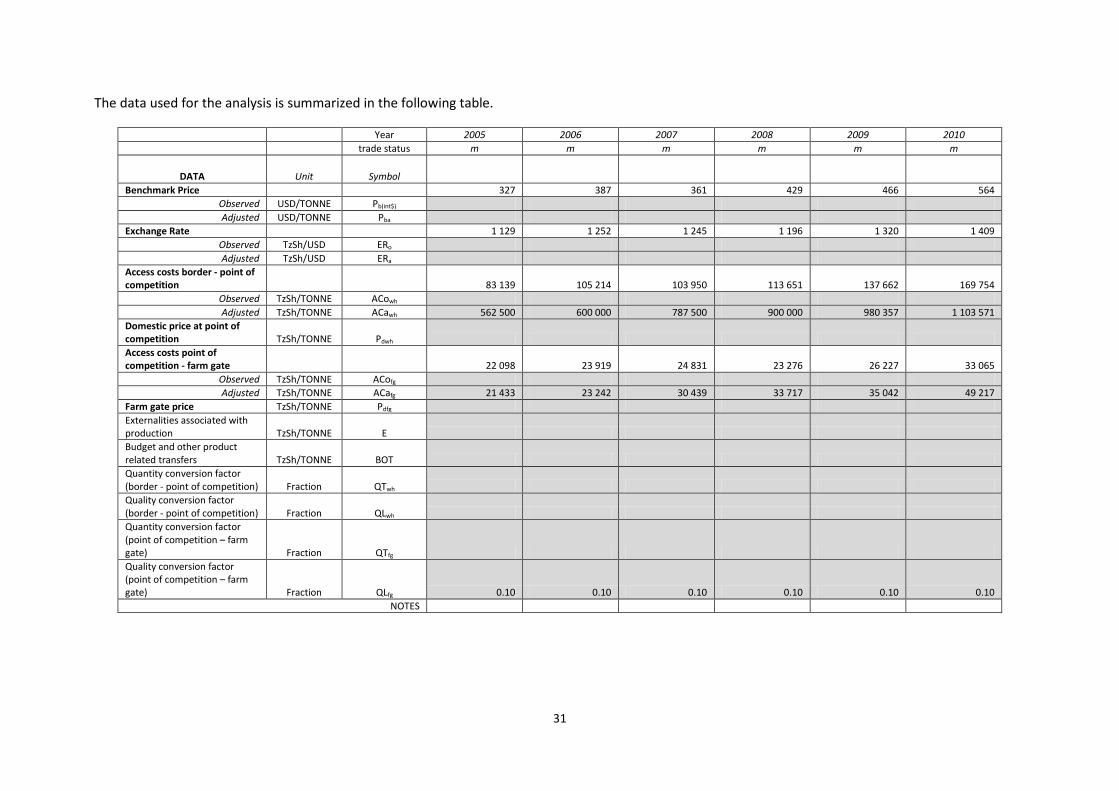
The data used for the analysis is summarized in the following table.
Year 2005 2006 2007 2008 2009 2010 trade status m m m m m m
DATA Unit Symbol
Benchmark Price 327 387 361 429 466 564 Observed USD/TONNE Pb(int$) Adjusted USD/TONNE Pba
Exchange Rate 1 129 1 252 1 245 1 196 1 320 1 409 Observed TzSh/USD ERo Adjusted TzSh/USD ERa
Access costs border - point of competition 83 139 105 214 103 950 113 651 137 662 169 754
Observed TzSh/TONNE ACowh Adjusted TzSh/TONNE ACawh 562 500 600 000 787 500 900 000 980 357 1 103 571
Domestic price at point of competition TzSh/TONNE Pdwh Access costs point of competition - farm gate 22 098 23 919 24 831 23 276 26 227 33 065
Observed TzSh/TONNE ACofg Adjusted TzSh/TONNE ACafg 21 433 23 242 30 439 33 717 35 042 49 217
Farm gate price TzSh/TONNE Pdfg Externalities associated with production TzSh/TONNE E Budget and other product related transfers TzSh/TONNE BOT Quantity conversion factor (border - point of competition) Fraction QTwh Quality conversion factor (border - point of competition) Fraction QLwh Quantity conversion factor (point of competition – farm gate) Fraction QTfg Quality conversion factor (point of competition – farm gate) Fraction QLfg 0.10 0.10 0.10 0.10 0.10 0.10
NOTES
31
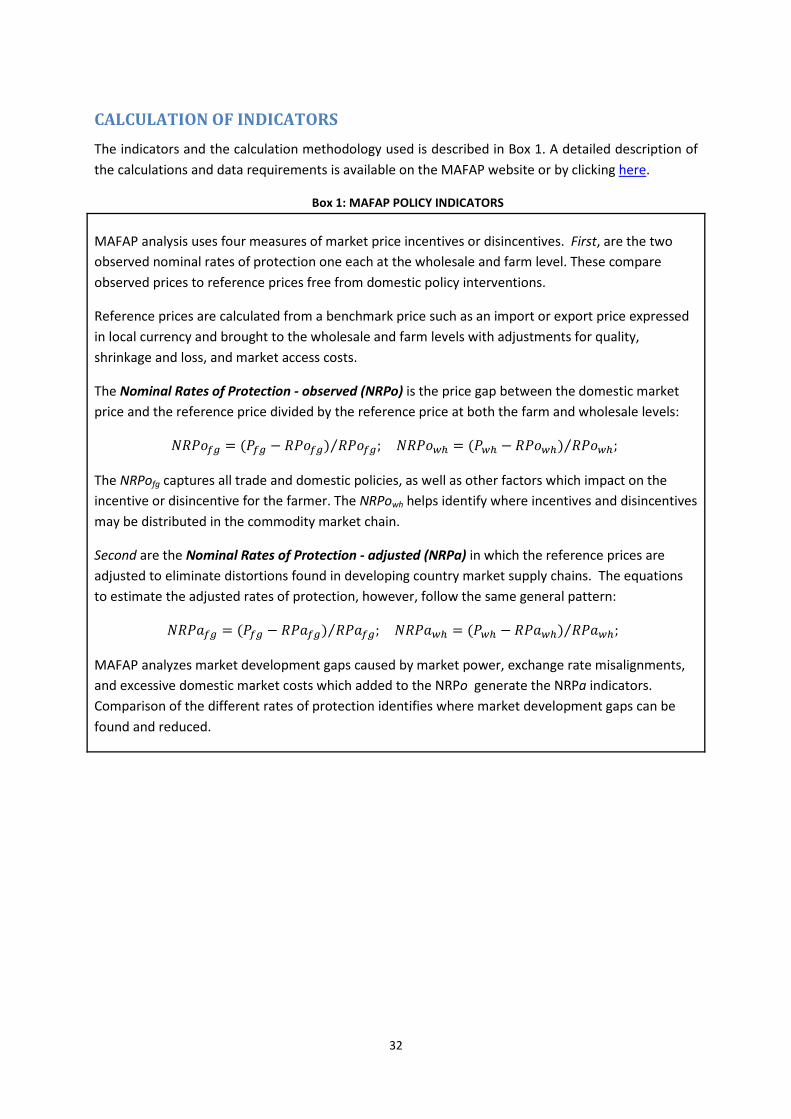
CALCULATION OF INDICATORS The indicators and the calculation methodology used is described in Box 1. A detailed description of the calculations and data requirements is available on the MAFAP website or by clicking here.
Box 1: MAFAP POLICY INDICATORS
MAFAP analysis uses four measures of market price incentives or disincentives. First, are the two observed nominal rates of protection one each at the wholesale and farm level. These compare observed prices to reference prices free from domestic policy interventions.
Reference prices are calculated from a benchmark price such as an import or export price expressed in local currency and brought to the wholesale and farm levels with adjustments for quality, shrinkage and loss, and market access costs.
The Nominal Rates of Protection - observed (NRPo) is the price gap between the domestic market price and the reference price divided by the reference price at both the farm and wholesale levels:
𝑁𝑅𝑃𝑜𝑓𝑔 = (𝑃𝑓𝑔 − 𝑅𝑃𝑜𝑓𝑔) 𝑅𝑃𝑜𝑓𝑔; ⁄ 𝑁𝑅𝑃𝑜𝑤ℎ = (𝑃𝑤ℎ − 𝑅𝑃𝑜𝑤ℎ) 𝑅𝑃𝑜𝑤ℎ; ⁄
The NRPofg captures all trade and domestic policies, as well as other factors which impact on the incentive or disincentive for the farmer. The NRPowh helps identify where incentives and disincentives may be distributed in the commodity market chain.
Second are the Nominal Rates of Protection - adjusted (NRPa) in which the reference prices are adjusted to eliminate distortions found in developing country market supply chains. The equations to estimate the adjusted rates of protection, however, follow the same general pattern:
𝑁𝑅𝑃𝑎𝑓𝑔 = (𝑃𝑓𝑔 − 𝑅𝑃𝑎𝑓𝑔) 𝑅𝑃𝑎𝑓𝑔; ⁄ 𝑁𝑅𝑃𝑎𝑤ℎ = (𝑃𝑤ℎ − 𝑅𝑃𝑎𝑤ℎ) 𝑅𝑃𝑎𝑤ℎ; ⁄
MAFAP analyzes market development gaps caused by market power, exchange rate misalignments, and excessive domestic market costs which added to the NRPo generate the NRPa indicators. Comparison of the different rates of protection identifies where market development gaps can be found and reduced.
32

Table 9: MAFAP price gaps for sugar in Tanzania 2005-2010 (TzSh per tonne of sugar at point of competition and of raw cane at farm gate)
2005 2006 2007 2008 2009 2010 Trade status for the year m m m m m m Observed Price gap at point of competition 109 841.43 9 969 233 596 273 387 227 084 139 810 Adjusted Price gap at point of competition 109 841.43 9 969 233 596 273 387 227 084 139 810 Observed price gap at farm gate (1 735.36) (11 842) (121) (5 669) (14 058) (14 094) Adjusted price gap at farm gate (1 735.36) (11 842) (121) (5 669) (14 058) (14 094)
Source: Own calculations using data as described above
Figure 16: MAFAP price gaps for sugar in Tanzania 2005-2010 (USD per tonne)
Table 12: MAFAP nominal rates of protection (NRP) for sugar (at point of competition) and raw sugar cane (at farm gate) in Tanzania 2005-2010 (%)
2005 2006 2007 2008 2009 2010 Trade status for the year x x x x x x Observed Nominal rate of protection at point of competition 24.3% 1.7% 42.2% 43.6% 30.1% 14.5%
Adjusted Nominal rate of protection at point of competition 24.3% 1.7% 42.2% 43.6% 30.1% 14.5%
Observed Nominal rate of protection at farm gate -7.5% -33.8% -0.4% -14.4% -28.6% -22.3%
Adjusted Nominal rate of protection at farm gate -7.5% -33.8% -0.4% -14.4% -28.6% -22.3% Source: Own calculations using data as described above
-50
-
50
100
150
200
250
300
2005 2006 2007 2008 2009 2010
Thou
sand
s
ObservedPrice gap at point of competition AdjustedPrice gap at point of competition Observed price gap at farm gate Adjusted price gap at farm gate
33
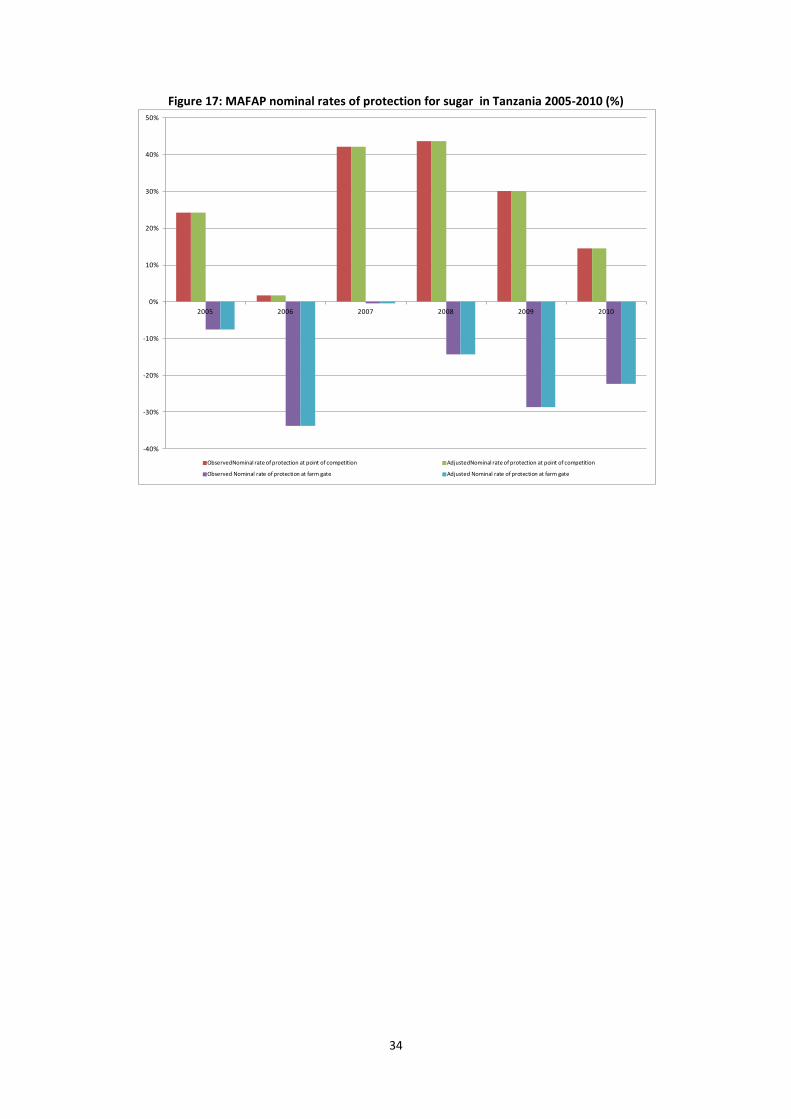
Figure 17: MAFAP nominal rates of protection for sugar in Tanzania 2005-2010 (%)
-40%
-30%
-20%
-10%
0%
10%
20%
30%
40%
50%
2005 2006 2007 2008 2009 2010
ObservedNominal rate of protection at point of competition AdjustedNominal rate of protection at point of competition
Observed Nominal rate of protection at farm gate Adjusted Nominal rate of protection at farm gate
34
4. INTERPRETATION OF THE INDICATORS
As it can be seen, there is a diverging impact of policy and value chain inefficiencies in the sugar market for URT. While at the point of competition the border policy (i.e. 100% or 200 USD per tonne common external tariff) results in domestic prices being higher than reference prices, this situation changes drastically for sugar cane farmers who receive a price for their output significantly below than the reference price The level of protection at the wholesale level has been decreasing as of 2008 due to the exemptions for sugar imports, in particular in 2010 when the exception was granted for all types of sugar.
Compared to the actual taxes on sugar cane marketing at domestic level (around 120 TzSh per tonne of sugar cane), the disincentives are far greater than the taxation by local governments. Farmers face significant disincentives due to the either very high profits by the local sugar industry or higher processing costs. However we cannot identify which of these factors is pushing the disincentives to farmers. If it where the latter, investments in sugar mills would be necessary to lower processing costs and assure either lower domestic prices for consumers or higher farm gate prices for producers.
In 2007, the disincentives to farmers were lower due to the low domestic production of sugar which led to competition by mills for raw sugar production and important quantities of raw cane being exported and imported.
35

5. PRELIMINARY CONCLUSIONS AND RECOMMENDATIONS
MAIN MESSAGE Sugar consumers in URT are paying higher prices than those at the international level due to the tariff and other factors. Farmers however are not benefitting from this border protection; moreover they receive disincentives by the functioning of the value chain. Data was obtained from one of the sugar mills (Mtwiba) showing processing costs that are well above those considered in the study (50%) higher which would explain the high level of disincentives and relate them to a bad functioning of the sugar processing sector.
Changes in trade policy are reflected into the additional price that consumers need to pay for sugar in URT however disincentives to farmers seem to be disconnected from changes in trade policy.
PRELIMINARY RECOMMENDATIONS In view of the high costs of sugar in URT and the low prices perceived by farmers for sugar cane the government should consider making the ad-hoc exemptions of the sugar import tariff stable. This would require that sugar is taken away of the Sensitive Items list of the EAC Common External Tariff.
If high sugar processing costs are confirmed for the rest of the factories, the sector should consider investing in upgrading the milling facilities.
LIMITATIONS The major limitation for this study was lack of local sugar processing costs from factories. The Ministry of Agriculture through the Sugar Board of Tanzania collects data on sugarcane farm gate prices and wholesale prices only.
FURTHER INVESTIGATION AND RESEARCH Obtain domestic data on sugar processing to disentangle the causes for disincentives to producers and provide better recommendations for policy modifications and value chain interventions.
36

BIBLIOGRAPHY
6.1. Agricultural and livestock policy, 1997 6.2. Sugar industry act No 26 of 2001 6.3. Sugar regulations, 2005 6.4. ASDP Agricultural sector development program 6.5. UN COMTRADE: United nations Commodity Trade statistics database 6.6. Budget speech for the Ministry of Agriculture and Food Security, 2005/6 6.7. Budget speeches for the Ministry of Agriculture, Food Security and Co-operatives (2006/7 to
2010/11) 6.8. MAFC, 2009: Investment potential and opportunities in agriculture (crop sub-sector) 6.9. Ministry of finance and economic affairs, 2009: The economic survey 2009 6.10. National Development Cooperation [NDC], 1992 6.11. Economic and Social Research Foundation [ESRF], 2002 6.12. Sugar Board of Tanzania website (www.sbt.go.tz) 6.13. Tanzania Parliament website (www.parliament.go.tz): Translated from the Kiswahili version as
published on July 25, 2011 at http://www.parliament.go.tz/bunge/hansards.php?pageNum_hans=3&totalRows_hans=83&search=2011)
6.14. ESRF: Survey 2: Agricultural Trade Policies Tanzania. Author: Economic and Social Research Foundation, Dar Es Salaam, Tanzania
6.15. Jamiiforum website: http://www.jamiiforums.com/jukwaa-la-siasa/1445-kagera-sugar-na-ufisadi-wake- tanzania.html
6.16. Mitchel, D. (2004). Sugar policies: opportunity for change. World Bank Policy Research Working Paper 3222, February 2004
6.17. Temu, A.; Manyama, A.; Temu, A. (2010). Maize trade and policy interventions in Tanzania. In Sarris and Morris (eds.) Food security in Africa. Market and trade policy for staple foods in Eastern and Southern Africa. FAO and Edward Elgar: 317-353
37
ANNEX I: Methodology Used
A guide to the methodology used by MAFAP can be downloaded from the MAFAP website or by clicking here.
38

ANNEX II: Data and calculations used in the analysis Year 2005 2006 2007 2008 2009 2010 Notes
DATA Unit Symbol trade status m m m m m mBenchmark Price
Observed US$/TON Pb(int$) 327 387 361 429 466 564 CIF PriceAdjusted US$/TON Pba
Exchange RateObserved Tshs/US$ ERo 1,129 1,252 1,245 1,196 1,320 1,409 Adjusted Tshs/US$ ERa
Access costs border - point of competitionObserved Tshs/TON ACowh 83,139 105,214 103,950 113,651 137,662 169,754 Adjusted Tshs/TON ACawh
Domestic price at point of competition Tshs/TON Pdwh 562,500 600,000 787,500 900,000 980,357 1,103,571 75% of retail priceAccess costs point of competition - farm gate
Observed Tshs/TON ACofg 22,098 23,919 24,831 23,276 26,227 33,065 Adjusted Tshs/TON ACafg
Farm gate price Tshs/TON Pdfg 21,433 23,242 30,439 33,717 35,042 49,217 SBT OG priceExternalities associated w ith production Tshs/TON EBudget and other product related transfers Tshs/TON BOT From PE AnalysisQuantity conversion factor (border - point of competition) Fraction QTwh
Quality conversion factor (border - point of competition) Fraction QLwh
Quantity conversion factor (point of competition - farm gate) Fraction QTfg 0.10 0.10 0.10 0.10 0.10 0.10 Quality conversion factor (point of competition - farm gate) Fraction QLfg
CALCULATED PRICES Unit Symbol 2005 2006 2007 2008 2009 2010 FormulaBenchmark price in local currency
Observed Tshs/TON Pb(loc$) 369,519.47 484,817.70 449,954.02 512,961.93 615,610.35 794,006.85 [1]*[2]Adjusted Tshs/TON Pb(loc$)a 369,519.47 484,817.70 449,954.02 512,961.93 615,610.35 794,006.85 [1]*[2]
Reference Price at point of competitionObserved Tshs/TON RPowh 452,658.57 590,031.38 553,904.42 626,613.30 753,272.77 963,761.03 [9]+[3]Adjusted Tshs/TON RPawh 452,658.57 590,031.38 553,904.42 626,613.30 753,272.77 963,761.03 [10]+[3]
Reference Price at Farm Gate Observed Tshs/TON RPofg 23,168.15 35,084.01 30,559.40 39,385.80 49,099.93 63,311.59 ([11]*[QTfg])-[5]Adjusted Tshs/TON RPafg 23,168.15 35,084.01 30,559.40 39,385.80 49,099.93 63,311.59 ([12]*[QTfg])-[5]
effective tarif 0.30 0.02 0.52 0.53 0.37 0.18
INDICATORS Unit Symbol 2005 2006 2007 2008 2009 2010 FormulaPrice gap at point of competition
Observed Tshs/TON PGowh 109,841.43 9,968.62 233,595.58 273,386.70 227,084.37 139,810.39 [4]-[11]Adjusted Tshs/TON PGawh 109,841.43 9,968.62 233,595.58 273,386.70 227,084.37 139,810.39 [4]-[12]
Price gap at farm gateObserved Tshs/TON PGofg (1,735.36) (11,842.00) (120.55) (5,669.25) (14,057.89) (14,094.38) [6]-[13]Adjusted Tshs/TON PGafg (1,735.36) (11,842.00) (120.55) (5,669.25) (14,057.89) (14,094.38) [6]-[14]
Nominal rate of protection at point of competitionObserved % NRPowh 24.27% 1.69% 42.17% 43.63% 30.15% 14.51% [15]/[11]Adjusted % NRPawh 24.27% 1.69% 42.17% 43.63% 30.15% 14.51% [16]/[12]
Nominal rate of protection at farm gateObserved % NRPofg -7.49% -33.75% -0.39% -14.39% -28.63% -22.26% [17]/[13]Adjusted % NRPafg -7.49% -33.75% -0.39% -14.39% -28.63% -22.26% [18]/[14]
Nominal rate of assistanceObserved % NRAo -7.49% -33.75% -0.39% -14.39% -28.63% -22.26% ([17]+[8])/[13]Adjusted % NRAa -7.49% -33.75% -0.39% -14.39% -28.63% -22.26% ([18]+[8])/[14]
Decomposition of PWAfg Unit Symbol 2005 2006 2007 2008 2009 2010 FormulaInternational markets gap Tshs/TON IRG - - - - - - - Exchange policy gap Tshs/TON ERPG - - - - - - - Access costs gap to point of competition Tshs/TON ACGwh - - - - - - - Access costs gap to farm gate Tshs/TON ACGfg - - - - - - - Externality gap Tshs/TON EG - - - - - - -
39
