accelerated reader 360 understanding reliability and...
TRANSCRIPT

Accelerated Reader 360® Understanding Reliability and Validity

RenaissancePO Box 8036Wisconsin Rapids, WI 54495-8036
Telephone: (800) 338-4204(715) 424-3636Outside the US: 1.715.424.3636Fax: (715) 424-4242
Email (general questions): [email protected] (technical questions): [email protected]: www.renaissance.com
Copyright NoticeCopyright © 2018, Renaissance Learning, Inc. All Rights Reserved. Printed in the United States of America.
All logos, designs, and brand names for Renaissance’s products and services, including, but not limited to, Accelerated Math, Accelerated Reader, Accelerated Reader 360, AccelScan, English in a Flash, MathFacts in a Flash, Renaissance, Renaissance Flow 360, Renaissance Growth Platform, Renaissance Growth Alliance, Renaissance Learning, Renaissance-U, Renaissance Smart Start, Star, Star 360, Star Custom, Star Early Literacy, Star Early Literacy Spanish, Star Math, Star Math Spanish, Star Reading, Star Reading Spanish and Star Spanish, are trademarks of Renaissance Learning, Inc. All other product and company names should be considered the property of their respective companies and organizations.
DRP and Degrees of Reading Power are registered trademarks of Questar Assessment Inc.
DIBELS is a registered trademark of Dynamic Measurement Group, Inc. http://dibels.org/
GRADE is a registered trademark of Pearson Education, Inc.
Lexile® and MetaMetrics® are trademarks of MetaMetrics, Inc., and are registered in the United States and abroad. Copyright © 2017 MetaMetrics, Inc. All rights reserved.
TPRI is a registered trademark of Texas Education Agency & University of Texas System.
01/2018 AR
Contents
Overview of Accelerated Reader 360 . . . . . . . . . . . . . . . . . . . . . . . . . . . . .1Accelerated Reader 360, ATOS, and the Common Core State Standards . . . . . . . . . . . . . . . . . . . . . . . 2Assess, Teach, and Learn: The Foundation of Instruction. . . . . . . . . . . . . . . . . . . . . . . . . . . . . . . . . . . . . 3
Assess . . . . . . . . . . . . . . . . . . . . . . . . . . . . . . . . . . . . . . . . . . . . . . . . . . . . . . . . . . . . . . . . . . . . . . . . . . . . . . . . . . . . . . . 4Teach . . . . . . . . . . . . . . . . . . . . . . . . . . . . . . . . . . . . . . . . . . . . . . . . . . . . . . . . . . . . . . . . . . . . . . . . . . . . . . . . . . . . . . . . 4Learn . . . . . . . . . . . . . . . . . . . . . . . . . . . . . . . . . . . . . . . . . . . . . . . . . . . . . . . . . . . . . . . . . . . . . . . . . . . . . . . . . . . . . . . . 4
Summary: What Accelerated Reader Is and Is Not . . . . . . . . . . . . . . . . . . . . . . . . . . . . . . . . . . . . . . . . . . . 5
The Purpose and Intended Use of Accelerated Reader . . . . . . . . . . . . . .6Goal Setting. . . . . . . . . . . . . . . . . . . . . . . . . . . . . . . . . . . . . . . . . . . . . . . . . . . . . . . . . . . . . . . . . . . . . . . . . . . . . 6Average Percent Correct Goal . . . . . . . . . . . . . . . . . . . . . . . . . . . . . . . . . . . . . . . . . . . . . . . . . . . . . . . . . . . . . 8ZPD and Book Level Goal . . . . . . . . . . . . . . . . . . . . . . . . . . . . . . . . . . . . . . . . . . . . . . . . . . . . . . . . . . . . . . . . . 8
ATOS Readability Formula for Books . . . . . . . . . . . . . . . . . . . . . . . . . . . . . . . . . . . . . . . . . . . . . . . . . . . . . . . . . . . . 8Validation of ZPD Ranges . . . . . . . . . . . . . . . . . . . . . . . . . . . . . . . . . . . . . . . . . . . . . . . . . . . . . . . . . . . . . . . . . . . . . . 9Factors Influencing ZPD Readability Levels. . . . . . . . . . . . . . . . . . . . . . . . . . . . . . . . . . . . . . . . . . . . . . . . . . . . . . 11
Point and Time Goals . . . . . . . . . . . . . . . . . . . . . . . . . . . . . . . . . . . . . . . . . . . . . . . . . . . . . . . . . . . . . . . . . . . 11Accelerated Reader Points . . . . . . . . . . . . . . . . . . . . . . . . . . . . . . . . . . . . . . . . . . . . . . . . . . . . . . . . . . . . . . . . . . . . 11Point Goals and Grade Equivalent Scores . . . . . . . . . . . . . . . . . . . . . . . . . . . . . . . . . . . . . . . . . . . . . . . . . . . . . . . 12Validation of the AR Point Goals. . . . . . . . . . . . . . . . . . . . . . . . . . . . . . . . . . . . . . . . . . . . . . . . . . . . . . . . . . . . . . . . 12
AR in a Response to Intervention Framework:Practice and Progress Monitoring . . . . . . . . . . . . . . . . . . . . . . . . . . . . . 14
The Reading Practice Component of General Instruction and Intervention. . . . . . . . . . . . . . . . . . . . . 14Progress Monitoring . . . . . . . . . . . . . . . . . . . . . . . . . . . . . . . . . . . . . . . . . . . . . . . . . . . . . . . . . . . . . . . . . . . . 15
AR Points. . . . . . . . . . . . . . . . . . . . . . . . . . . . . . . . . . . . . . . . . . . . . . . . . . . . . . . . . . . . . . . . . . . . . . . . . . . . . . . . . . . . 15Percent Correct . . . . . . . . . . . . . . . . . . . . . . . . . . . . . . . . . . . . . . . . . . . . . . . . . . . . . . . . . . . . . . . . . . . . . . . . . . . . . . 16Book Level . . . . . . . . . . . . . . . . . . . . . . . . . . . . . . . . . . . . . . . . . . . . . . . . . . . . . . . . . . . . . . . . . . . . . . . . . . . . . . . . . . . 16
Progress Monitoring and Data-Based Decision Making. . . . . . . . . . . . . . . . . . . . . . . . . . . . . . . . . . . . . . 17
Overview of Accelerated Reader Quizzes . . . . . . . . . . . . . . . . . . . . . . . 19Reading Practice Quizzes. . . . . . . . . . . . . . . . . . . . . . . . . . . . . . . . . . . . . . . . . . . . . . . . . . . . . . . . . . . . . . . . 19Literacy Skills Quizzes. . . . . . . . . . . . . . . . . . . . . . . . . . . . . . . . . . . . . . . . . . . . . . . . . . . . . . . . . . . . . . . . . . . 20Other Reading Quizzes . . . . . . . . . . . . . . . . . . . . . . . . . . . . . . . . . . . . . . . . . . . . . . . . . . . . . . . . . . . . . . . . . . 20Vocabulary Practice Quizzes . . . . . . . . . . . . . . . . . . . . . . . . . . . . . . . . . . . . . . . . . . . . . . . . . . . . . . . . . . . . . 20Summary of Available Quiz Titles . . . . . . . . . . . . . . . . . . . . . . . . . . . . . . . . . . . . . . . . . . . . . . . . . . . . . . . . . 21
iAccelerated Reader 360™Understanding Reliability and Validity
Contents
The Development of Accelerated Reader Quizzes . . . . . . . . . . . . . . . . 22Standardization of Quizzes . . . . . . . . . . . . . . . . . . . . . . . . . . . . . . . . . . . . . . . . . . . . . . . . . . . . . . . . . . . . . . 22Cheating and Related Issues . . . . . . . . . . . . . . . . . . . . . . . . . . . . . . . . . . . . . . . . . . . . . . . . . . . . . . . . . . . . . 23Retaking Quizzes . . . . . . . . . . . . . . . . . . . . . . . . . . . . . . . . . . . . . . . . . . . . . . . . . . . . . . . . . . . . . . . . . . . . . . . 24
Reliability . . . . . . . . . . . . . . . . . . . . . . . . . . . . . . . . . . . . . . . . . . . . . . . . . 25Description of Data Used for Reliability Analyses . . . . . . . . . . . . . . . . . . . . . . . . . . . . . . . . . . . . . . . . . . . 25The Reliability of Accelerated Reader Quiz Scores . . . . . . . . . . . . . . . . . . . . . . . . . . . . . . . . . . . . . . . . . . 26
Reliability: Individual Quiz Scores . . . . . . . . . . . . . . . . . . . . . . . . . . . . . . . . . . . . . . . . . . . . . . . . . . . . . . . . . . . . . . . 27Reliability: Cumulative Quiz Scores . . . . . . . . . . . . . . . . . . . . . . . . . . . . . . . . . . . . . . . . . . . . . . . . . . . . . . . . . . . . . 28
Validity . . . . . . . . . . . . . . . . . . . . . . . . . . . . . . . . . . . . . . . . . . . . . . . . . . . 33Quiz Validity Study . . . . . . . . . . . . . . . . . . . . . . . . . . . . . . . . . . . . . . . . . . . . . . . . . . . . . . . . . . . . . . . . . . . . . . 33
Sample Selection and Data Collection. . . . . . . . . . . . . . . . . . . . . . . . . . . . . . . . . . . . . . . . . . . . . . . . . . . . . . . . . . . 34Study Results . . . . . . . . . . . . . . . . . . . . . . . . . . . . . . . . . . . . . . . . . . . . . . . . . . . . . . . . . . . . . . . . . . . . . . . . . . . . . . . . 35Conclusion . . . . . . . . . . . . . . . . . . . . . . . . . . . . . . . . . . . . . . . . . . . . . . . . . . . . . . . . . . . . . . . . . . . . . . . . . . . . . . . . . . 38
Correlation with Standardized Reading Assessments . . . . . . . . . . . . . . . . . . . . . . . . . . . . . . . . . . . . . . . 39Description of Data Used for Validity Analyses . . . . . . . . . . . . . . . . . . . . . . . . . . . . . . . . . . . . . . . . . . . . . . . . . . . 39Correlations with External Tests. . . . . . . . . . . . . . . . . . . . . . . . . . . . . . . . . . . . . . . . . . . . . . . . . . . . . . . . . . . . . . . . 40AR Points. . . . . . . . . . . . . . . . . . . . . . . . . . . . . . . . . . . . . . . . . . . . . . . . . . . . . . . . . . . . . . . . . . . . . . . . . . . . . . . . . . . . 41Correlation Coefficients Between AR Points and External Reading Measures . . . . . . . . . . . . . . . . . . . . . . . . 41Meta-Analysis of Accelerated Reader External Validity Data . . . . . . . . . . . . . . . . . . . . . . . . . . . . . . . . . . . . . . . 46
References . . . . . . . . . . . . . . . . . . . . . . . . . . . . . . . . . . . . . . . . . . . . . . . . 48
Appendix A: Diagnostic Report . . . . . . . . . . . . . . . . . . . . . . . . . . . . . . . . 52
Appendix B: Reading Practice TOPS Report . . . . . . . . . . . . . . . . . . . . . 54
Index . . . . . . . . . . . . . . . . . . . . . . . . . . . . . . . . . . . . . . . . . . . . . . . . . . . . . 56
iiAccelerated Reader 360™Understanding Reliability and Validity
Overview of Accelerated Reader 360
Accelerated Reader 360 (AR 360), the latest version of Accelerated Reader (AR), provides a balance of independent reading practice with nonfiction reading and close reading skills practice. This research focuses on the AR software and best practices that make the essential student practice component of any reading curriculum more effective. Using AR, this practice time is personalized to each student’s individual level to ensure a high rate of success and immediately followed by feedback to help educators target instruction. Personalized reading practice includes guiding students to books at appropriate levels, closely monitoring their progress, and intervening with appropriate instruction when necessary. For students, this feedback is motivational (Husman, Brem, & Duggan, 2005; Sadusky & Brem, 2002; Samuels & Wu, 2003). For teachers, this assessment information is used to carefully monitor and guide each student’s independent reading practice (Borman & Dowling, 2004; Renaissance Learning, 2012a).
Guided independent reading practice is in-class reading practice during which the teacher guides students to books at appropriate levels, closely monitors their progress, and intervenes with appropriate instruction when necessary. Accelerated Reader is intended to enable guided independent reading through the assessment information it generates, and teachers are encouraged to arrange frequent meetings with students to discuss their book selection, reading, and quiz scores (Renaissance Learning, 2012a). Guided independent reading practice has been shown to accelerate reading growth for all students, regardless of ability (Borman & Dowling, 2004; Holmes, Brown, & Algozzine, 2006; Nunnery & Ross, 2007; Nunnery, Ross, & Goldfedder, 2003; Nunnery, Ross, & McDonald, 2006; Renaissance Learning, 2012a; Samuels & Wu, 2003; Topping, Samuels, & Paul, 2007).
Accelerated Reader helps teachers closely monitor several types of reading practice recommended by the National Reading Panel (National Institute of Child Health and Human Development, 2000), including reading aloud, paired reading, and independent reading. Accelerated Reader Quizzes are available on thousands of trade books and all major reading textbooks. The feedback provided by the quizzes supports direct, explicit, systematic reading instruction.
Using Accelerated Reader for independent reading practice involves three main steps:
1. The student reads a library or textbook selection.
2. The student takes an Accelerated Reader Quiz on a classroom computer, laptop, or tablet. The quiz assesses the student’s comprehension of key elements of the book’s content. Accelerated Reader immediately scores the quiz, manages all record-keeping tasks, and generates detailed reports describing student performance and progress toward goals.
3. Teachers (as well as administrators and parents) can use the reports to guide instruction, monitor the student’s independent reading, and help the student select appropriate reading materials.
1Accelerated Reader 360™Understanding Reliability and Validity
Overview of Accelerated Reader 360Accelerated Reader 360, ATOS, and the Common Core State Standards
Four types of reading quizzes are available—Reading Practice, Vocabulary Practice, Literacy Skills, and Other Reading (textbook and article quizzes). Some quizzes are available in Spanish language and Recorded Voice versions. Quiz titles are available through a yearly subscription from Renaissance.
Accelerated Reader may be used with any core or supplemental reading curriculum. Accelerated Reader software and AR Best Practices have been shown by scientifically based research to be effective in helping educators dramatically accelerate reading growth in K–12 classrooms. Numerous studies by independent researchers demonstrate that students’ reading abilities improve with the use of these tools, and that the performance gap between high-achieving and low-achieving students is substantially reduced. Those best practices are outlined in “The Purpose and Intended Use of Accelerated Reader” on page 6 and described in more detail in Getting Results with Accelerated Reader (Renaissance Learning, 2014). Several experimental and quasi-experimental studies have demonstrated the effectiveness of Accelerated Reader when implemented according to best classroom practices (Holmes & Brown, 2003; Shannon, Styers, Wilkerson, & Peery, 2015; Nunnery, Ross, & McDonald, 2006; Sadusky & Brem, 2002; Samuels & Wu, 2003; Vollands, Topping, & Evans, 1999).
The information provided in this booklet applies regardless of the context in which Accelerated Reader is used.
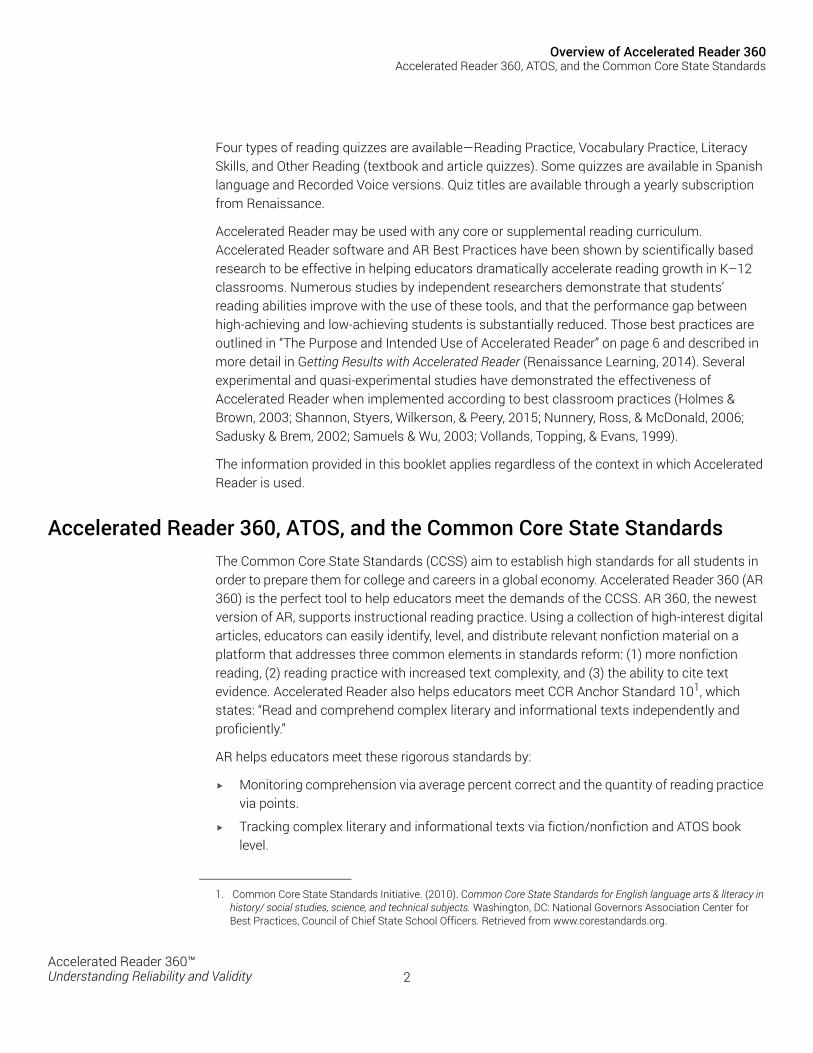
Accelerated Reader 360, ATOS, and the Common Core State StandardsThe Common Core State Standards (CCSS) aim to establish high standards for all students in order to prepare them for college and careers in a global economy. Accelerated Reader 360 (AR 360) is the perfect tool to help educators meet the demands of the CCSS. AR 360, the newest version of AR, supports instructional reading practice. Using a collection of high-interest digital articles, educators can easily identify, level, and distribute relevant nonfiction material on a platform that addresses three common elements in standards reform: (1) more nonfiction reading, (2) reading practice with increased text complexity, and (3) the ability to cite text evidence. Accelerated Reader also helps educators meet CCR Anchor Standard 101, which states: “Read and comprehend complex literary and informational texts independently and proficiently.”
AR helps educators meet these rigorous standards by:
Monitoring comprehension via average percent correct and the quantity of reading practice via points.
Tracking complex literary and informational texts via fiction/nonfiction and ATOS book level.
1. Common Core State Standards Initiative. (2010). Common Core State Standards for English language arts & literacy in history/ social studies, science, and technical subjects. Washington, DC: National Governors Association Center for Best Practices, Council of Chief State School Officers. Retrieved from www.corestandards.org.
2Accelerated Reader 360™Understanding Reliability and Validity
Overview of Accelerated Reader 360Assess, Teach, and Learn: The Foundation of Instruction
Identifying how the text was read, i.e. read to, read with, or read independently, via TWI preference and reports.
CCSS Appendix A defines a three-part model of text complexity with each part of equal importance:
1. Qualitative Dimensions of Text Complexity are “those aspects best measured by an attentive human reader, such as levels of meaning or purpose; structure; language conventionality and clarity; and knowledge demands.”2
In AR, every text is given an interest level that is based on content—the book’s themes and ideas—and indicates for which age group a book is appropriate to help educators define the qualitative dimension of text complexity.
2. Quantitative Dimensions of Text Complexity are “those aspects of text complexity such as word length or frequency, sentence length, and text cohesion that are best measured by computer software.”3
AR uses the ATOS readability formula as its quantitative measure. ATOS levels are based on a book’s average sentence length, average word length, vocabulary grade level, and the number of words in a book. ATOS values are expressed on an easily understandable grade-level scale. A Lexile® measure is also available on many reports beginning fall 2014. Both ATOS and Lexile® measures were included in CCSS Appendix A and found to be valid measures of text complexity in an independent study of readability measures.3
3. Reader and Task Considerations are “variables specific to particular readers… and to particular tasks… [that] must also be considered when determining whether a text is appropriate for a given student. Such assessments are best made by teachers employing their professional judgment, experience, and knowledge of their students and the subject.”3
AR’s new College and Career Readiness Report gives you a student-by-student look at reading practice data, with expectations defined by the Common Core State Standards. You’ll know immediately who is on track to tackle college and career texts, and who isn’t, so you can take steps to change outcomes.
Assess, Teach, and Learn: The Foundation of InstructionLifelong learners are created by effectively connecting assessment, teaching, and learning. But if these three components of the learning cycle don’t work together seamlessly—if gaps emerge—information is lost, opportunities are missed, and a student’s potential is put at risk.
2. Common Core State Standards Initiative. (2010). Common Core State Standards for English language arts & literacy in history/ social studies, science, and technical subjects. Appendix A: Research supporting the key elements of the standards, Glossary of terms. Washington, DC: National Governors Association Center for Best Practices, Council of Chief State School Officers. Retrieved from www.corestandards.org.
3. Nelson, J., Perfetti, C., Liben, D., Liben, M. (2011). Measures of text difficulty: Testing their predictive value for grade levels and student performance. Technical Report to the Gates Foundation (also to be submitted for publication).
3Accelerated Reader 360™Understanding Reliability and Validity
Overview of Accelerated Reader 360Assess, Teach, and Learn: The Foundation of Instruction
AssessAccelerated Reader is a formative classroom reading assessment system. AR makes it easy for students to get immediate feedback on their reading comprehension and for teachers to get a quick but complete picture of each student’s reading practice progress. The software provides detailed reports that describe exactly what each individual student needs at any given time, not days or weeks later when the best opportunity for helping a student has passed. With the most reliable, actionable, and timely data available, we can help teachers keep students on track for college and career readiness, while setting a constant course for achieving the goals of Common Core and state standards in any learning environment.
TeachOur vast library of student assessment data lets us move beyond expert opinion and create research-validated learning progressions for both Common Core and state standards. By connecting the end objectives to the reading skills students need to master, we can provide an instructional roadmap showing where each student is every day, what skills should be taught next, and recommend an individualized and accelerated learning path. Most importantly, we can help teachers identify where students are struggling and map backward to address any missing prerequisite skills.
LearnKids who are excited and engaged learn best. And a big part of learning comes from practice. But here’s the thing: kids are most likely to practice what they enjoy. Accelerated Reader helps students tap into their natural interests by offering more than 160,000 AR Quizzes in an extremely wide variety of subject matter—both in fiction and content-area texts—so they don’t think of learning as work. As a result, they read more, learn more, and achieve more.
4Accelerated Reader 360™Understanding Reliability and Validity
Overview of Accelerated Reader 360Summary: What Accelerated Reader Is and Is Not
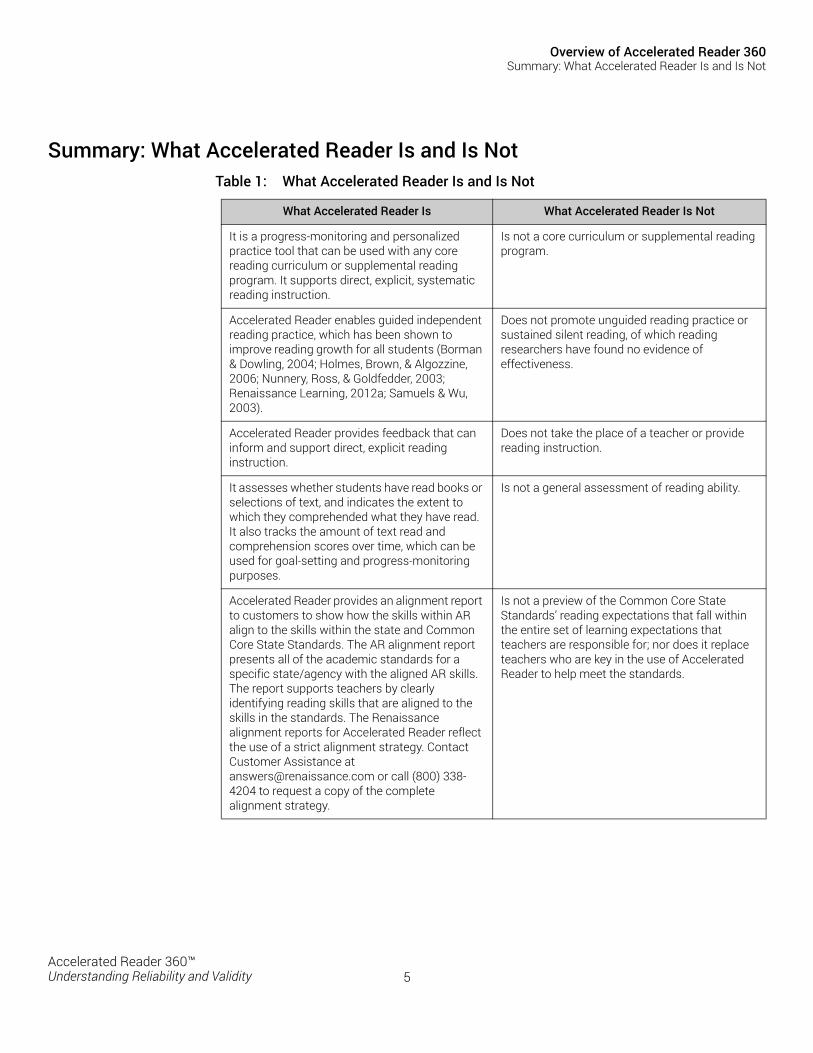
Summary: What Accelerated Reader Is and Is NotTable 1: What Accelerated Reader Is and Is Not
What Accelerated Reader Is What Accelerated Reader Is Not
It is a progress-monitoring and personalized practice tool that can be used with any core reading curriculum or supplemental reading program. It supports direct, explicit, systematic reading instruction.
Is not a core curriculum or supplemental reading program.
Accelerated Reader enables guided independent reading practice, which has been shown to improve reading growth for all students (Borman & Dowling, 2004; Holmes, Brown, & Algozzine, 2006; Nunnery, Ross, & Goldfedder, 2003; Renaissance Learning, 2012a; Samuels & Wu, 2003).
Does not promote unguided reading practice or sustained silent reading, of which reading researchers have found no evidence of effectiveness.
Accelerated Reader provides feedback that can inform and support direct, explicit reading instruction.
Does not take the place of a teacher or provide reading instruction.
It assesses whether students have read books or selections of text, and indicates the extent to which they comprehended what they have read. It also tracks the amount of text read and comprehension scores over time, which can be used for goal-setting and progress-monitoring purposes.
Is not a general assessment of reading ability.
Accelerated Reader provides an alignment report to customers to show how the skills within AR align to the skills within the state and Common Core State Standards. The AR alignment report presents all of the academic standards for a specific state/agency with the aligned AR skills. The report supports teachers by clearly identifying reading skills that are aligned to the skills in the standards. The Renaissance alignment reports for Accelerated Reader reflect the use of a strict alignment strategy. Contact Customer Assistance at [email protected] or call (800) 338-4204 to request a copy of the complete alignment strategy.
Is not a preview of the Common Core State Standards’ reading expectations that fall within the entire set of learning expectations that teachers are responsible for; nor does it replace teachers who are key in the use of Accelerated Reader to help meet the standards.
5Accelerated Reader 360™Understanding Reliability and Validity
The Purpose and Intended Use of Accelerated Reader
As a progress-monitoring system that promotes guided independent reading practice, Accelerated Reader software serves three primary purposes:
AR provides quick and accurate assessments of whether students have read and understood trade books that they have selected and textbook passages that have been assigned to them.
It assigns point values for each AR Reading Practice Quiz taken. Point values are a factor of book level and performance on quizzes. Points accumulate during the school year, and are a way for teachers to monitor students’ reading volume.
The system tracks student performance on AR quizzes over time.
AR provides a way for educators to monitor and guide reading practice and ensure success for their students through goal setting (see below).
Goal SettingThere are three key components of goal setting with Accelerated Reader:
Quality (or level of success) of reading practice
Quantity of reading practice
Book level (or level of challenge)
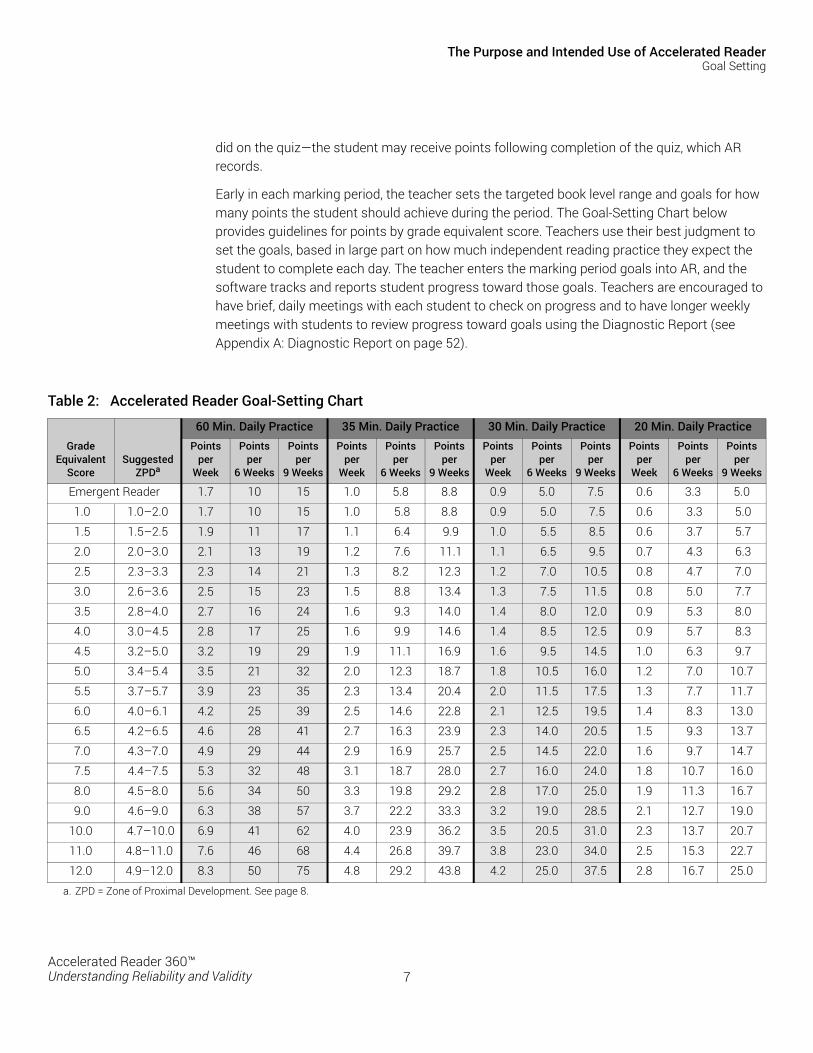
The Accelerated Reader Goal-Setting Chart (see Table 2 on page 7) was created to assist educators in establishing appropriate goals for their students in these areas. The chart helps educators set individual goals for AR Reading Practice Quizzes, quantity of AR points earned, and book level ranges. The guidelines for setting individual and classroom goals are supported by research and have been validated empirically (Renaissance Learning, 2012b). When combined with educators’ professional judgment, they help ensure the best outcomes for students.
In practice, goal setting and monitoring involve regular communication between the teacher and each student throughout the school year. The teacher uses student reading performance data from Star Reading (a standardized test for estimating reading ability)4 or a similar assessment to determine the student’s reading level and help the student select books that are at an appropriate challenge level—not too easy and not so difficult as to be frustrating. The student reads one book at a time and takes an AR quiz for each book. Based on three factors—the number of words the book contains, the reading level of the book, and how well the student
4. Star Reading is a computer-adaptive reading test and database. Star Reading enables educators to quickly and accurately assess reading scores for all students, grades 1–12. Detailed reports provide educators with each student’s suggested ZPD (Zone of Proximal Development) and other valuable feedback that can be used to monitor progress and adjust instructional strategies.
6Accelerated Reader 360™Understanding Reliability and Validity
The Purpose and Intended Use of Accelerated ReaderGoal Setting
did on the quiz—the student may receive points following completion of the quiz, which AR records.
Early in each marking period, the teacher sets the targeted book level range and goals for how many points the student should achieve during the period. The Goal-Setting Chart below provides guidelines for points by grade equivalent score. Teachers use their best judgment to set the goals, based in large part on how much independent reading practice they expect the student to complete each day. The teacher enters the marking period goals into AR, and the software tracks and reports student progress toward those goals. Teachers are encouraged to have brief, daily meetings with each student to check on progress and to have longer weekly meetings with students to review progress toward goals using the Diagnostic Report (see Appendix A: Diagnostic Report on page 52).
Table 2: Accelerated Reader Goal-Setting Chart
Grade Equivalent
ScoreSuggested
ZPDa
a. ZPD = Zone of Proximal Development. See page 8.
60 Min. Daily Practice 35 Min. Daily Practice 30 Min. Daily Practice 20 Min. Daily PracticePoints
per Week
Points per
6 Weeks
Points per
9 Weeks
Points per
Week
Points per
6 Weeks
Points per
9 Weeks
Points per
Week
Points per
6 Weeks
Points per
9 Weeks
Points per
Week
Points per
6 Weeks
Points per
9 Weeks
Emergent Reader 1.7 10 15 1.0 5.8 8.8 0.9 5.0 7.5 0.6 3.3 5.0
1.0 1.0–2.0 1.7 10 15 1.0 5.8 8.8 0.9 5.0 7.5 0.6 3.3 5.0
1.5 1.5–2.5 1.9 11 17 1.1 6.4 9.9 1.0 5.5 8.5 0.6 3.7 5.7
2.0 2.0–3.0 2.1 13 19 1.2 7.6 11.1 1.1 6.5 9.5 0.7 4.3 6.3
2.5 2.3–3.3 2.3 14 21 1.3 8.2 12.3 1.2 7.0 10.5 0.8 4.7 7.0
3.0 2.6–3.6 2.5 15 23 1.5 8.8 13.4 1.3 7.5 11.5 0.8 5.0 7.7
3.5 2.8–4.0 2.7 16 24 1.6 9.3 14.0 1.4 8.0 12.0 0.9 5.3 8.0
4.0 3.0–4.5 2.8 17 25 1.6 9.9 14.6 1.4 8.5 12.5 0.9 5.7 8.3
4.5 3.2–5.0 3.2 19 29 1.9 11.1 16.9 1.6 9.5 14.5 1.0 6.3 9.7
5.0 3.4–5.4 3.5 21 32 2.0 12.3 18.7 1.8 10.5 16.0 1.2 7.0 10.7
5.5 3.7–5.7 3.9 23 35 2.3 13.4 20.4 2.0 11.5 17.5 1.3 7.7 11.7
6.0 4.0–6.1 4.2 25 39 2.5 14.6 22.8 2.1 12.5 19.5 1.4 8.3 13.0
6.5 4.2–6.5 4.6 28 41 2.7 16.3 23.9 2.3 14.0 20.5 1.5 9.3 13.7
7.0 4.3–7.0 4.9 29 44 2.9 16.9 25.7 2.5 14.5 22.0 1.6 9.7 14.7
7.5 4.4–7.5 5.3 32 48 3.1 18.7 28.0 2.7 16.0 24.0 1.8 10.7 16.0
8.0 4.5–8.0 5.6 34 50 3.3 19.8 29.2 2.8 17.0 25.0 1.9 11.3 16.7
9.0 4.6–9.0 6.3 38 57 3.7 22.2 33.3 3.2 19.0 28.5 2.1 12.7 19.0
10.0 4.7–10.0 6.9 41 62 4.0 23.9 36.2 3.5 20.5 31.0 2.3 13.7 20.7
11.0 4.8–11.0 7.6 46 68 4.4 26.8 39.7 3.8 23.0 34.0 2.5 15.3 22.7
12.0 4.9–12.0 8.3 50 75 4.8 29.2 43.8 4.2 25.0 37.5 2.8 16.7 25.0
7Accelerated Reader 360™Understanding Reliability and Validity
The Purpose and Intended Use of Accelerated ReaderAverage Percent Correct Goal
Average Percent Correct GoalBoth the development and application of goals in Accelerated Reader are based on decades of educational research. Researchers have demonstrated that high levels of success in academic tasks lead to improved educational outcomes, including large gains in reading achievement (Allington, 1984; Betts, 1946; Rosenshine & Stevens, 1984). Subsequent research has led to conclusions that high rates of success are more critical for low-achieving students than for high-achieving students and that high rates of success have more significant effects on achievement than engaged time on task (Marliave & Filby, 1985).
Level of success in reading practice is measured by percent correct on AR Reading Practice Quizzes over time. Renaissance recommends that students average 85 percent correct or higher on AR Reading Practice Quizzes. Recent research has validated the 85 percent correct recommendation by analyzing the relationship between reading practice and achievement (Borman & Dowling, 2004; Renaissance Learning, 2012a; Topping & Sanders, 2000). This research showed that percent correct on AR Reading Practice Quizzes is more important to student reading achievement than the amount of reading or readability level of books. At all ability levels, students experience greater gains in reading achievement as percent correct increases (Renaissance Learning, 2012a).
Our research also shows that students who gain the most in reading ability have an even higher average than 85 percent. These students score 100 percent on many, if not most, of their AR quizzes and average well over 90 percent. Achieving a perfect score not only signifies that a student understands the key points of a book, it also motivates the student to read more.
ZPD and Book Level GoalZPD—or Zone of Proximal Development—is a theoretical concept introduced by the Russian child development psychologist Lev Vygotsky (1978). This concept has been translated into the realm of independent reading with the development of ZPD ranges for student reading. In independent, literature-based reading, ZPD is the range of books that will challenge a student without causing frustration or loss of motivation. When students read within their currently assigned zone, the portion of the text that they know helps them to understand the unknown portion of the text (Paul, 1996).
ATOS Readability Formula for BooksEvery book title or textbook selection that is to be included in the Accelerated Reader catalog is assigned a readability level to help teachers and students find appropriate books. The ATOS Readability Formula5 was released by Renaissance in partnership with Touchstone Applied
5. For more information about ATOS, see The Development of ATOS: The Renaissance Readbility Formula by Michael Milone written for Renaissance Learning. Available online: http://doc.renlearn.com/KMNet/R004250827GJ11C4.pdf.
8Accelerated Reader 360™Understanding Reliability and Validity
The Purpose and Intended Use of Accelerated ReaderZPD and Book Level Goal
Science Associates, Inc. in 2000 as a more reliable and accurate alternative to existing readability formulas, which were judged to yield inconsistent results due to the way they are calculated. Unlike many other readability formulas that take samples of text, ATOS uses whole-text scans to eliminate sampling error; that is, it calculates the readability of an entire book, not just a few samples of text within it.
Other key characteristics of ATOS include the following:
It employs the three statistics that researchers have found to be most predictive of reading difficulty: the number of words per sentence, the number of characters per word, and the average grade level of the words in the book.
It takes book length into account, which has been confirmed to be an important variable based on analysis of a database of more than 30,000 students and nearly 1,000,000 Accelerated Reader quiz records.
It is an open system, meaning that to make the first match of students to books, educators are free to use any standardized test for estimating student reading ability. Our Goal-Setting Chart provides the guidance in the form of suggested reading ranges that educators need to make the initial match. There is no charge to the user, or to book or text publishers, for the use of ATOS.
ATOS Readability Formula has been validated for use with other categories of books that present special challenges, including nonfiction books and high-interest/low-readability books.
ATOS levels are reviewed for reasonableness based on the characteristics of each individual book. Renaissance occasionally makes adjustments based on standardized rubrics for certain books where it is obvious that the readability formula is not fully accounting for text difficulty. These rubrics are applied to many of the classics, including books by English or foreign authors, poems, plays, and early American literature. However, these adjustments are applied sparingly. Less than one percent of books have been adjusted.
There are separate ATOS formulas for books and text passages. For more information about the ATOS formulas and how they were developed, see Milone (2014). Renaissance has also partnered with MetaMetrics® in order to provide certified Lexile® measures as an additional option.
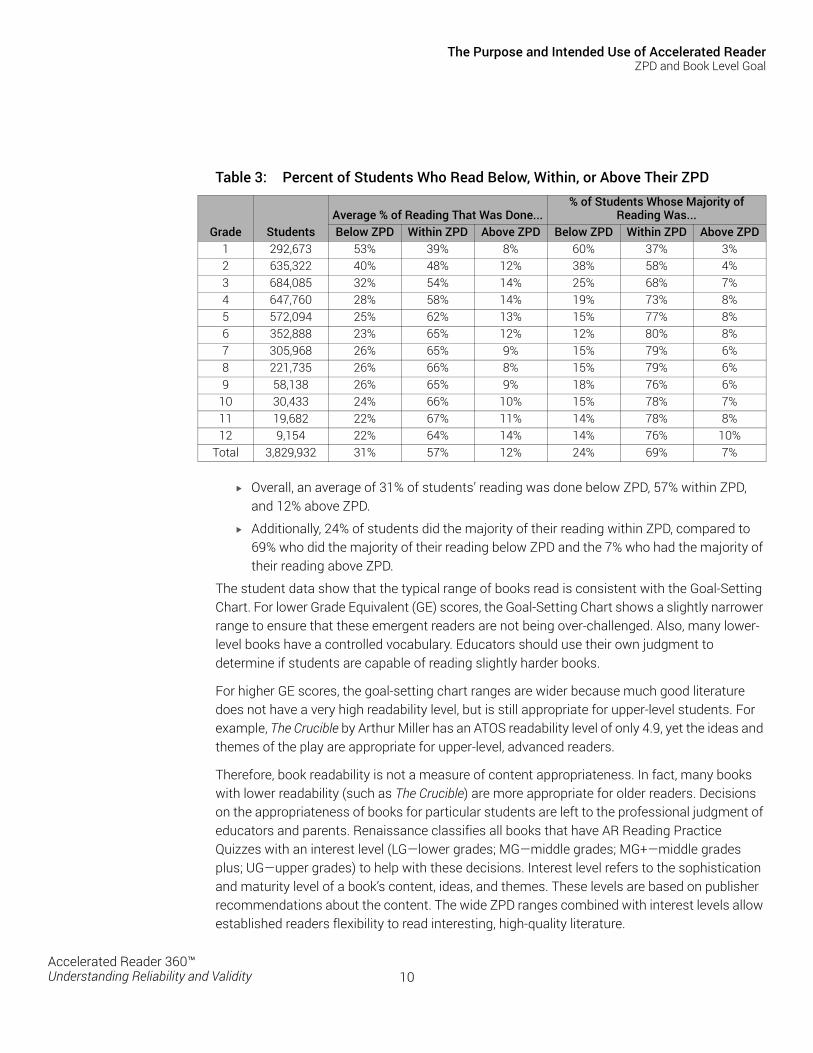
Validation of ZPD RangesThe Goal-Setting Chart includes suggested ZPD ranges, which educators can use when setting goals with their students (see Table 2 on page 7). ZPD ranges were developed and have been updated over the years using actual student reading data. The current ranges have been validated based on data from more than 3.8 million students during the 2012–2013 school year. The percentages of students who read below, within, or above their ZPD are shown in Table 3.
9Accelerated Reader 360™Understanding Reliability and Validity
The Purpose and Intended Use of Accelerated ReaderZPD and Book Level Goal
Overall, an average of 31% of students’ reading was done below ZPD, 57% within ZPD, and 12% above ZPD.
Additionally, 24% of students did the majority of their reading within ZPD, compared to 69% who did the majority of their reading below ZPD and the 7% who had the majority of their reading above ZPD.
The student data show that the typical range of books read is consistent with the Goal-Setting Chart. For lower Grade Equivalent (GE) scores, the Goal-Setting Chart shows a slightly narrower range to ensure that these emergent readers are not being over-challenged. Also, many lower-level books have a controlled vocabulary. Educators should use their own judgment to determine if students are capable of reading slightly harder books.
For higher GE scores, the goal-setting chart ranges are wider because much good literature does not have a very high readability level, but is still appropriate for upper-level students. For example, The Crucible by Arthur Miller has an ATOS readability level of only 4.9, yet the ideas and themes of the play are appropriate for upper-level, advanced readers.
Therefore, book readability is not a measure of content appropriateness. In fact, many books with lower readability (such as The Crucible) are more appropriate for older readers. Decisions on the appropriateness of books for particular students are left to the professional judgment of educators and parents. Renaissance classifies all books that have AR Reading Practice Quizzes with an interest level (LG—lower grades; MG—middle grades; MG+—middle grades plus; UG—upper grades) to help with these decisions. Interest level refers to the sophistication and maturity level of a book’s content, ideas, and themes. These levels are based on publisher recommendations about the content. The wide ZPD ranges combined with interest levels allow established readers flexibility to read interesting, high-quality literature.
Table 3: Percent of Students Who Read Below, Within, or Above Their ZPD
Grade StudentsAverage % of Reading That Was Done...
% of Students Whose Majority ofReading Was...
Below ZPD Within ZPD Above ZPD Below ZPD Within ZPD Above ZPD1 292,673 53% 39% 8% 60% 37% 3%2 635,322 40% 48% 12% 38% 58% 4%3 684,085 32% 54% 14% 25% 68% 7%4 647,760 28% 58% 14% 19% 73% 8%5 572,094 25% 62% 13% 15% 77% 8%6 352,888 23% 65% 12% 12% 80% 8%7 305,968 26% 65% 9% 15% 79% 6%8 221,735 26% 66% 8% 15% 79% 6%9 58,138 26% 65% 9% 18% 76% 6%
10 30,433 24% 66% 10% 15% 78% 7%11 19,682 22% 67% 11% 14% 78% 8%12 9,154 22% 64% 14% 14% 76% 10%
Total 3,829,932 31% 57% 12% 24% 69% 7%
10Accelerated Reader 360™Understanding Reliability and Validity
The Purpose and Intended Use of Accelerated ReaderPoint and Time Goals
Factors Influencing ZPD Readability LevelsThe ZPD ranges are guidelines only. Determining the book readability levels that make up a student’s ZPD range is a two-step process. First, educators match students to book readability ranges based on the students’ tested reading abilities, which can be assessed by interim/periodic assessments like Star Reading. Second, educators monitor how well students comprehend what they are reading and adjust their ZPD ranges accordingly. Factors that affect a student’s optimal ZPD range include the following:
1. family, peer, and teacher expectations
2. student motivation and interest
3. book availability
4. error in measuring student reading ability and book readability
Educators should use their knowledge of each student’s ability and appetite for challenge, along with their professional judgment, to guide reading practice and set goals. If a student is struggling or scoring low on AR Reading Practice Quizzes, the educator may need to suggest a shorter book, an easier book, or a book on a topic of keen interest to the student.
ZPD ranges equal or exceed the GE score for lower readability levels, but are substantially less than the GE score at the upper levels. This is because measures of reading ability, such as the GE score from a Star Reading assessment, estimate the highest level at which a student can read short passages for a short period of time. ZPD ranges, however, are based on the range of books one can read for hours without becoming either frustrated or bored. For example, many adults have a post-high school reading ability, yet the average book that adults read for leisure is at a sixth- to eighth-grade readability level. If forced to read books at or near their reading level, many adults would quickly stop reading for pleasure entirely.
To gain automaticity and knowledge from reading, as well as to learn new vocabulary, students must read a large quantity of literature. When a student’s ZPD range is too high, the student will not experience the successful reading practice vital for improving reading achievement.
Point and Time Goals
Accelerated Reader PointsThe amount of reading practice students receive is highly correlated to reading achievement gains (Anderson, 1996). Research has shown that it is not just the amount of time that is allocated to an activity that predicts student achievement. Rather, it is the amount of time in which a student is successfully engaged in activities related to valued educational outcomes (Berliner, 1990; Fisher et al., 1980). This time is referred to as academic learning time. Reading academic learning time can be measured with AR points.
AR points are computed based on the readability level and number of words in the book. Students earn a portion of a book’s points depending on how well they perform on the quiz. The
11Accelerated Reader 360™Understanding Reliability and Validity
The Purpose and Intended Use of Accelerated ReaderPoint and Time Goals
Goal-Setting Chart (see Table 2 on page 7) provides guidelines for the approximate number of AR points students should be able to earn depending on how much time they spend reading and their GE level. Monitoring AR points earned by students and comparing them to the guideline values listed on the Goal-Setting Chart enables educators to determine how well students are using the time provided for reading practice and whether they are reading materials at an appropriate level of challenge.
Point Goals and Grade Equivalent ScoresThe point values on the Goal-Setting Chart depend on a student’s Grade Equivalent score. Research on student rates of reading shows that the relationship between reading rate and comprehension varies with the age and intellectual ability of students, as well as with the type of reading material (Harris & Sipay, 1990). Consequently, when educators use the guidelines they should also use their professional judgment and consider the attitudes, interests, and abilities of each student. The point goals on the Goal-Setting Chart may be modified by teachers, when appropriate, to consider the individual needs and abilities of each student.
Validation of the AR Point GoalsPoint goals were first published in 1993, based on a comparison of student reading logs and AR points earned (Paul, 1992). The goals have been recently modified based on additional data showing actual student reading behavior.
AR point goals were validated by:
Comparing the goals on the Goal-Setting Chart to the number of words read by students as published in several studies on student reading rates.
Analyzing data from more than 7,000 students in classrooms known to allocate 60 minutes daily for reading practice.
Research conducted on student reading rates reveals a wide range of reading speeds for students at different grade levels and with different reading abilities. The type of material, the purpose of reading, the length of material, and topical knowledge all influence reading rates. Most research on reading rates examines silent reading, often under test conditions. However, the rates at which students read for relatively short periods of time under test conditions may not be the same as the rates they use in their daily reading at school.
To validate the point goals, the expected points shown on the Goal-Setting Chart were converted to words read using the AR point formula6 and compared to words read by students in various reading rate research studies (Allington, 2001; Carver, 1990; Harris & Sipay, 1990). The point goals on the Goal-Setting Chart are lower than the published study results, but
6. Students earn AR points when they pass Reading Practice Quizzes. The number of points earned equals: [(10 + Reading Level) × (Words in Book/100,000)] × Percent Correct.
12Accelerated Reader 360™Understanding Reliability and Validity
The Purpose and Intended Use of Accelerated ReaderPoint and Time Goals
reasonable given the differences between daily reading practice of self-selected books and reading in a testing situation.
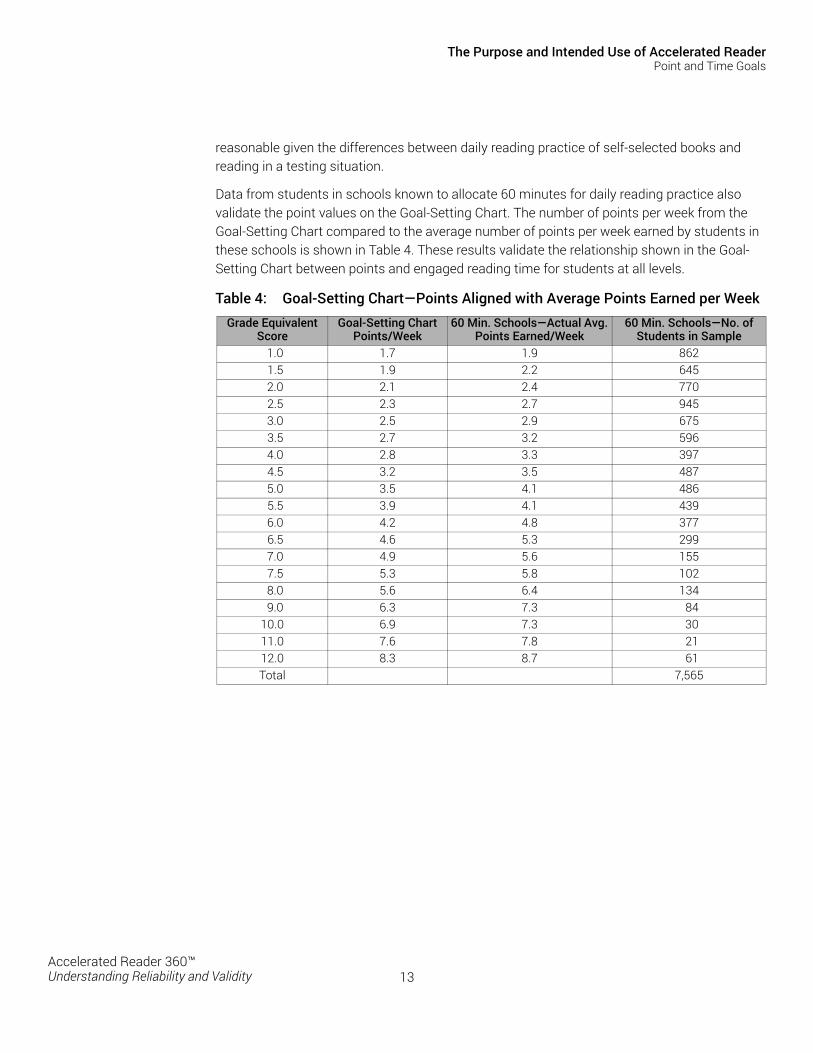
Data from students in schools known to allocate 60 minutes for daily reading practice also validate the point values on the Goal-Setting Chart. The number of points per week from the Goal-Setting Chart compared to the average number of points per week earned by students in these schools is shown in Table 4. These results validate the relationship shown in the Goal-Setting Chart between points and engaged reading time for students at all levels.
Table 4: Goal-Setting Chart—Points Aligned with Average Points Earned per WeekGrade Equivalent
ScoreGoal-Setting Chart
Points/Week60 Min. Schools—Actual Avg.
Points Earned/Week60 Min. Schools—No. of
Students in Sample 1.0 1.7 1.9 862 1.5 1.9 2.2 645 2.0 2.1 2.4 770 2.5 2.3 2.7 945 3.0 2.5 2.9 675 3.5 2.7 3.2 596 4.0 2.8 3.3 397 4.5 3.2 3.5 487 5.0 3.5 4.1 486 5.5 3.9 4.1 439 6.0 4.2 4.8 377 6.5 4.6 5.3 299 7.0 4.9 5.6 155 7.5 5.3 5.8 102 8.0 5.6 6.4 134 9.0 6.3 7.3 8410.0 6.9 7.3 3011.0 7.6 7.8 2112.0 8.3 8.7 61Total 7,565
13Accelerated Reader 360™Understanding Reliability and Validity
AR in a Response to Intervention Framework:Practice and Progress Monitoring
Many schools are implementing approaches to systematically collect data on student performance and progress, and using that information to make a variety of instructional and resource allocation decisions. Most often called Response to Intervention (RTI) or Response to Instruction, these approaches are being promoted and piloted in many states as a way to improve educational outcomes for all students and to identify those in need of more intensive services more quickly and effectively.
Although defined differently by various experts, states, and school districts, the key components of RTI are consistent: universal screening, the use of evidence-based instruction or interventions, monitoring of student progress, and the making of instructional or eligibility decisions based on progress-monitoring data.
How do Accelerated Reader software and best practices fit in an RTI framework? In short, AR is the evidence-based practice component of both general reading curricula and reading interventions. AR also generates progress-monitoring data that educators use to make decisions about students at all levels.
The Reading Practice Component of General Instruction and InterventionIn a typical RTI framework, “Tier 1” refers to universal or general classroom instruction. Student performance is monitored using various assessments to track progress and differentiate instruction. Students who do not make adequate progress in the general class or whose screening test results indicate they are at-risk may be referred for more intensive interventions or services, which are generally termed RTI “Tier 2” or higher.
AR is neither a comprehensive reading curriculum nor a comprehensive intervention. Rather, AR is the practice component of the core reading curriculum or intervention. Reading practice (book reading) is essential for improving reading achievement, for all students at all grade levels. Regardless of whether a student is successful in the general reading class or in need of more intensive intervention, all students need to practice by reading books or other authentic texts in order to become better readers. However, reading practice that is neither guided nor monitored is not effective; AR helps teachers guide and monitor reading practice.
Regardless of the setting—the general reading/language arts classroom or a targeted intervention—AR provides a way to set individualized reading practice goals, motivate students to read more and read better (as a result of goal setting and receiving immediate feedback), guide reading practice by finding books at each student’s challenge level, and track student reading practice data automatically so teachers can monitor students’ progress toward their goals. Most importantly, AR provides immediate feedback on student comprehension of the books they have read. Their performance on AR quizzes is a way of determining whether the
14Accelerated Reader 360™Understanding Reliability and Validity
AR in a Response to Intervention Framework: Practice and Progress MonitoringProgress Monitoring
skills taught (for example, identifying consonants or building words or recognizing sequence) have culminated in student’s comprehension of independently read authentic text.
Many educators find that using AR schoolwide—for students receiving targeted interventions or special education services as well as the general population—is a way to maintain a uniform culture of reading for all students within the school. Because AR personalizes reading practice, every student in the school can be reading books at his or her level, taking AR quizzes, and working toward individualized reading practice goals.
Progress MonitoringOne of the strengths of AR is its efficiency as a progress-monitoring system. AR quizzes are short, generally requiring three minutes or less to complete. AR quizzes are automatically scored and recorded in a database, freeing the teacher to do other things. Through the software, teachers have at their disposal a number of class- and student-level reports they use to monitor progress and inform instructional decisions.
Teachers using AR to monitor student progress in reading practice look primarily at three variables (points, percent correct, and book level7), each of which is automatically recorded and reported by the AR software.
AR PointsAR points are an indication of the amount of reading practice completed by each student. Students receive points only after passing the AR Reading Practice quiz. Renaissance recommends a certain number of points per week, and the amount varies by each student’s reading level. (See page 11 for a discussion of points and individualized goal setting using points.) The software provides a number of reports that present point accumulation and indicate whether students are meeting point goals. For example, the class Diagnostic Report (“Appendix A: Diagnostic Report” on page 52) indicates the point goal, number earned to date, and the percent of goal attained. The TOPS report (“Appendix B: Reading Practice TOPS Report” on page 54) presents the same information for an individual student immediately after each quiz is taken.
If a student is not on track to meet point goals, the teacher should consider whether:
The student is spending sufficient time and effort reading books. Renaissance recommends devoting time for book reading every day that is in addition to the reading students do in basal readers or other instructional materials—at least 30 minutes in elementary and middle school, and at least 20 minutes in high school. The teacher may need to schedule reading time during class period, assign it for homework, or encourage it during a study hall or free period.
7. The recommendations related to points, percent correct, and book level were adapted from a resource guide that is provided to educators during professional development on AR best practices: Renaissance Learning. (2014). Getting results with Accelerated Reader. Wisconsin Rapids, WI: Author.
15Accelerated Reader 360™Understanding Reliability and Validity
AR in a Response to Intervention Framework: Practice and Progress MonitoringProgress Monitoring
The student is reading books but not demonstrating comprehension, as evidenced by low percent correct scores on quizzes. See “Percent Correct” below.
The student is selecting appropriately challenging books. See “Book Level” below.
Percent CorrectBecause the most significant gains in reading ability are associated with high averages on AR quizzes, Renaissance recommends that students maintain an average of 85% correct or higher. This is consistent with research findings that student independent reading comprehension levels should be high, around 90 percent (Bormuth, 1968; McCormick, 1999; Roe & Burns, 2007). Since every student is reading texts that are at an appropriate challenge level, every student should be maintaining an average percent correct in this range.
If a student is struggling to maintain 85% correct or higher, there are several questions the teacher can consider when reviewing AR reports and/or during the daily check-in with each student (a technique called “Status of the Class”), including:
Is the student selecting appropriately challenging books? (See “Book Level” below.)
Is the student reading appropriately challenging books but still scoring low? Teaching the student review strategies before taking the quiz often helps, such as reviewing the table of contents or briefly retelling the story. If the student is still scoring low, the teacher may expand the range of books (ZPD) downward and ask the student to choose books from the low end.
Is the student choosing very long books and having trouble remembering what was read? Does the student appear to need help with comprehension strategies? Comprehension strategies such as visualization, previewing before reading, and summarizing after reading may help. If the student continues to struggle, more intensive intervention may be needed.
Is the student an English-language learner struggling with unfamiliar vocabulary and subject matter? Help the student find books on familiar subjects. Also, ask the student to read a page of the book aloud. A good rule of thumb is that if a student has problems with five words out of a hundred, the book is too difficult. In that case, widen the student’s ZPD (as described above) or help the student select another book with more familiar vocabulary.
Book LevelAs discussed on pages 8–11, the book level variable is important to help students find appropriately challenging texts and also as a means to monitor reading progress. Using the Goal-Setting Chart (see Table 2 on page 7), teachers determine the appropriate reading range for each student. Research studies (Borman & Dowling, 2004; Renaissance Learning, 2012a; Topping & Sanders, 2000) have demonstrated that students reading within or slightly above their ZPD tend to experience the largest gains in reading achievement. Book level is an important indicator to check if a student is struggling with obtaining points or maintaining a high average percent correct.
16Accelerated Reader 360™Understanding Reliability and Validity
AR in a Response to Intervention Framework: Practice and Progress MonitoringProgress Monitoring and Data-Based Decision Making
Teachers should also consider whether the student is selecting books of interest. If the student struggles with book selection (aside from finding books within his or her ZPD), the teacher should ask about the student’s interests, and help the student use the library or Renaissance book searching tools (AR BookFinder at www.arbookfind.com) to find topics of interest, award-winning books, and so forth.
Progress Monitoring and Data-Based Decision MakingEducators should not use AR data alone to make decisions regarding whether students need more intensive (RTI Tier 2 or Tier 3) intervention or special services. However, AR progress-monitoring data on authentic text reading can contribute critical information for making such decisions quickly and effectively. Specifically, AR data is used to tell each student’s story by providing a clear picture of the daily book reading practice they are doing and how the amount of practice and the comprehension of books read compares with research-based benchmarks.
The two scenarios below provide examples of how AR can be used to inform instructional decisions in conjunction with other assessment data:
An initial screening indicates that student A scores significantly below grade level, indicating that the student is at risk, in need of close monitoring, and may need more intensive instruction. The teacher views student A as motivated; he reads lots of books within his ZPD. Yet after a couple of weeks his average percent correct is 70%, well below the 85% recommendation. Because of his low comprehension scores, student A is not accumulating enough points to remain on target toward his individual goal. The teacher re-teaches some comprehension strategies and encourages student A to read books slightly below his ZPD. Yet, he still struggles with comprehension as evidenced by low percent correct scores. Decision: Based on AR data, as well as other progress-monitoring data, a team of teachers determines that student A most likely requires additional diagnosis and more intensive, RTI Tier 2 intervention. The following week, student A begins receiving 30 minutes of intensive intervention in addition to his regular class instruction. Student A’s teachers understand it is important to coordinate between his regular class and RTI Tier 2 instruction. Therefore, they decide student A should continue his reading practice within his regular class, but at a slightly lower ZPD range. During his RTI Tier 2 time, the teacher will monitor every book quiz during the intervention, and can encourage him to read higher-level books once his AR quiz scores improve to 85% or higher.
An initial screening indicates that student B scores roughly at grade level; therefore, she is not considered to be at-risk. While student B’s average percent correct on AR quizzes is an acceptable 89%, she is only doing enough book reading to meet 30% of her reading practice goals, which were set using the research-based Goal-Setting Chart (see Table 2 on page 7). Decision: This student may not need additional skills instruction or intervention, but she does need to read more. Research on thousands of students’ reading practice data indicate that students who fall short of the research-based AR points recommendations tend to experience rates of reading achievement growth that are significantly below their peers
17Accelerated Reader 360™Understanding Reliability and Validity
AR in a Response to Intervention Framework: Practice and Progress MonitoringProgress Monitoring and Data-Based Decision Making
(Borman & Dowling, 2004; Renaissance Learning, 2012a; Topping & Sanders, 2000). The teacher should have daily conferences with student B about her reading and make explicit recommendations concerning the amount of book reading she should be doing. The teacher will continue to monitor her average percent correct and point accumulation.
18Accelerated Reader 360™Understanding Reliability and Validity
Overview of Accelerated Reader Quizzes
As mentioned previously, there are several types of AR quizzes—Reading Practice, Literacy Skills, Other Reading (quizzes for textbook series and nonfiction articles), and Vocabulary Practice. Each type of quiz is described below, and following that is a table summarizing the number of AR quizzes available for each type of quiz.
Reading Practice QuizzesThe most common type of AR assessment is the Reading Practice Quiz. They are so-named because the purpose of the assessment is to provide quality information for both the management and motivation of reading practice. Reading Practice Quizzes are primarily intended to determine whether or not a student has read a book. These quizzes are encouraging rather than intimidating, chiefly because a student who has read a book should be able to pass the quiz. Questions typically focus on significant events, characters, and literary features of a book. In addition, questions are presented in an order that matches the chronology of a book, a practice that reinforces the story structure as a student takes a quiz.
Quizzes incorporate multiple-choice items that focus on literal understanding. Selecting this type of assessment is consistent with Stiggins’ (2005) recommendation that:
[Selected-response] tests are efficient in that we can administer large numbers of multiple-choice or true/false test items per unit of testing time. Thus, they permit us to sample widely and draw relatively confident generalizations from the content sampled. For this reason, when the target is knowledge mastery, selected response formats fit nicely into the resource realities of most classrooms. (p. 70)
Reading Practice Quizzes are accessible to a broader range of students with the addition of Spanish quizzes and Recorded Voice quizzes. Quizzes in Spanish are available for about six percent of AR quiz titles. Recorded Voice quizzes are read by professional narrators and allow preliterate and emergent readers to take the same quizzes as independent readers without extra assistance from the teacher. This enables students to take quizzes on all books that they read independently, books that they read with an adult or peer tutor, and books that were read to them. Recorded Voice quizzes are available for about eight percent of Reading Practice Quiz titles.
Reading Practice Quizzes are available in 3-, 5-, 10-, and 20-item formats. The number of items is largely a function of book level. The 3-item and 5-item quizzes are primarily used to cover short books read by emergent readers, while 20-item quizzes cover longer books at higher reading levels. The most common length of Reading Practice Quizzes (RP) is 10 items.
19Accelerated Reader 360™Understanding Reliability and Validity
Overview of Accelerated Reader QuizzesLiteracy Skills Quizzes
Literacy Skills QuizzesIn response to teachers’ requests, Literacy Skills Quizzes were developed to help identify students’ reading strengths and weaknesses. Literacy Skills Quiz items are based on 24 specific higher-order reading comprehension skills from state standards, basal reading series, and standardized tests. The skills are grouped into four categories (Constructing Meaning, Inferential Comprehension, Literary Analysis, and Initial Understanding) so that diagnostic reports can be generated to give teachers an accurate picture of students’ reading abilities. Inferential reasoning, main idea, cause and effect, characterization, and recognizing plot are examples of the kinds of skills tested. Currently, Literacy Skills Quizzes are available for many of the most popular titles in the Accelerated Reader database. Many of these books are considered classics, such as Charlotte’s Web, A Farewell to Arms, and Macbeth.
Questions on Literacy Skills Quizzes are randomly generated from a 24-item, 30-item, 36-item, or 60-item bank.
The item-bank approach is appropriate for testing literacy skills because there is ample content in the books for which the tests have been developed. In addition, the tests are not intended as a motivational tool, but rather as an instrument to diagnose students’ strengths and weaknesses. As a supplemental option to Reading Practice Quizzes, Literacy Skills Quizzes may be administered to students for various reasons, such as test preparation or to assess a deeper understanding of a book. Teachers are advised that the best time for students to take Literacy Skills Quizzes is after they have taken the Reading Practice Quiz for the book.
Most Literacy Skills Quizzes are available in 12-item formats, but a few are available in a 24-item format.
Other Reading QuizzesOther Reading Quizzes enable teachers to monitor reading instruction assignments from textbooks.8 Aligned quizzes are available for a variety of textbooks including series published by Houghton Mifflin Harcourt, Macmillan/McGraw-Hill, Pearson Scott Foresman, and SRA/McGraw-Hill. Like Reading Practice Quizzes on trade books, Other Reading Quizzes follow the order of the text, assess literal comprehension using a multiple-choice format, and are available in 3-, 5-, or 10- item lengths, depending on the readability level of the text.
Vocabulary Practice QuizzesAlso available are Accelerated Reader Vocabulary Practice Quizzes, which are designed to facilitate implicit and explicit vocabulary instruction through authentic, in-context literature experiences. The AR software can generate vocabulary lists for trade books that can be pasted
8. Other Reading Quizzes now only include textbook quizzes, as magazine quizzes are no longer available as of this printing. The Other Reading Quiz data in Tables 6 through 9 do, however, contain statistics gathered from both magazine and textbook quizzes.
20Accelerated Reader 360™Understanding Reliability and Validity

Overview of Accelerated Reader QuizzesSummary of Available Quiz Titles
into the front cover of the book or onto a bookmark. Students receive direct instruction on these vocabulary strategies from the teacher and then encounter the words in context while reading independently. It is recommended that students take an AR Vocabulary Practice Quiz after passing the Reading Practice Quiz for the same book. These vocabulary and comprehension quizzes include current and previous vocabulary words, and can be 5, 10, or 15 items in length (the 1st try quiz is 5, 10, or 15 words long, but quizzes could be longer with the inclusion of the 2nd try and review words). Accelerated Reader then generates reports on each student’s continuing vocabulary development.
Summary of Available Quiz TitlesTable 6 is a summary of available AR quiz titles as of January 2015, broken down by type of quiz, fiction/nonfiction, quiz language, and number of items per quiz. In addition to the number of quiz titles available in each category, the average readability level (ARL) is also presented to demonstrate that as the readability level increases, so do the number of items per quiz.
Vocabulary Practice and Literacy Skills Quizzes are produced for books on which a Reading Practice Quiz already exists, so the total number of available quizzes shown in the table exceeds the total number of book titles.
Table 5: AR Quiz Titles Available in the US as of January 2015
Quiz TypeFiction or Nonfiction Language
Quiz Length (in Number of Questions)3 5 10 12a
a. 12-question Literacy Skills Quizzes have an item bank of 24, 30, or 36 items, and 24-question quizzes have an item bank of 60 items.
15 20 24a TotalCount ARLb
b. ARL = Average Reading Level (Average ATOS Book Level).
Count ARLb Count ARLb Count ARLb Count ARLb Count ARLb Count ARLb
Reading Practicec
c. 6,510 of these quizzes are also available as Recorded Voice Quizzes in English, and 982 are available as Recorded Voice in Spanish.
Fiction English 825 1.08 25,434 2.64 48,002 4.56 1,851 6.48 76,112Spanish 2,593 2.83 2,899 4.55 192 7.24 5,684
Nonfiction English 825 1.43 34,005 3.83 37,570 6.66 388 8.55 72,788Spanish 2,511 3.34 867 5.55 21 8.69 3,399
Both Both 1650 1.25 64,543 3.30 89,338 5.45 2,452 6.88 157,983
Vocabulary Practice
Fiction English 2,591 3.43 4,314 4.23 1,985 5.07 8.890Nonfiction English 1,116 4.45 509 5.13 59 6.42 1,694
Both English 3,707 3.74 4,823 4.32 2,044 5.11 10,574
Literacy Skills
Fiction English 827 5.43 14 8.66 841Nonfiction English 22 6.32 22
Both English 849 5.45 14 8.66 863
Other Reading
Fiction English 43 0.99 4,765 2.85 1,539 4.27 6,347Spanish 565 3.08 203 4.34
Nonfiction English 447 6.33 5,892 4.26 539 5.55 6,878Spanish 386 4.61 72 5.48
Both Both 490 5.86 11,608 3.63 2,353 4.61 14,451All Both Both 2,140 2.3 79,858 3.37 96,514 5.38 849 5.45 2,044 5.11 2,452 6.88 14 8.66 183,871
21Accelerated Reader 360™Understanding Reliability and Validity
The Development of Accelerated Reader Quizzes
Accelerated Reader quizzes9 conform closely to the most widely accepted principles of assessment. Most importantly, the quizzes are valid because they are tied directly to the content of a specific book or passage and focus on facts rather than conjecture. The results of analyses of student performance with AR suggest that students who read the book perform well on the quiz. Those who take quizzes despite not having read the book perform at a level that is not different than would be expected by chance.10 When students read the book and do well on the corresponding quiz, they are motivated to read additional books and take the corresponding quizzes. This tendency is consistent with the observations of Black and Wiliam (1998) that students respond more favorably when they can establish their own goals and are presented with “a meaningful, interesting, and reasonably demanding challenge.”
To ensure that AR quizzes present a meaningful, interesting, and reasonably demanding challenge, the development of the quizzes entails a multi-step process with quality checks at several points. AR quizzes are developed following multiple-choice guidelines from Frary (1995) and others. Quizzes are developed by dedicated quiz writers and reviewed by multiple editors. The two main goals of writers and editors are to make sure that the quiz questions (1) are key to the text or advance the plot in an important way, and (2) are not easily guessable without having read the book.
The process begins when a quiz writer reads a book and drafts items that reflect key points in the text or plot. The quiz is then reviewed by two editors, who each check for content and plausibility, spelling, usage, grammar, punctuation, and conformation to quiz style. Special attention is paid to ensure that the distracters (the incorrect responses for each question) are neither too unlikely nor too close to the correct answer. Following those reviews and modifications (if necessary), the quiz goes through a third quality check during which an editor reviews the quiz electronically in the AR format and makes sure that the correct responses are recognized by the program. The final quality check involves spell-checking and proofing.
Standardization of QuizzesIn two respects, Accelerated Reader quizzes are standardized. First, they fit the definition of “standardized” given by Popham (1999): they are “administered and scored in a predetermined, standard manner.” This characteristic is important because it ensures that the quizzes are fair. Even though AR is considered a low-stakes formative assessment, both students and teachers invest much of themselves in the program, and the perception of fairness contributes importantly to the widespread acceptance of AR. Second, the consistent manner in which AR
9. For more information on the development of AR Quizzes, refer to Renaissance Learning, Inc., 2011, The Design of Accelerated Reader Assessments.
10. For a summary of this analysis, refer to the Quiz Validity Study beginning on page 33.
22Accelerated Reader 360™Understanding Reliability and Validity
The Development of Accelerated Reader QuizzesCheating and Related Issues
quizzes are developed and administered means the information they provide is comparable over time and from student to student.
In order to maintain fairness and consistency, AR doesn’t allow the teacher the option of assigning point values or changing the number of questions required to pass a quiz.11 This approach would render the information collected meaningless because data would not be comparable from student to student. In addition, this approach is arbitrary and might be perceived by students and parents as being unfair.
Cheating and Related IssuesFeedback received from teachers using AR indicates that cheating is not a significant problem on AR quizzes. Teachers indicate that students enjoy reading books they have chosen, feel confident about taking quizzes, and recognize that Accelerated Reader quizzes are non-threatening assessments (Institute for Academic Excellence, 1999). For students, there is not much reason to cheat on an AR quiz because there are typically no negative consequences associated with failing a quiz, and if a student has read a book, chances are that he/she will answer most of the questions correctly.12
Reading Practice and Other Reading Quizzes discourage casual cheating (e.g., students sharing correct answer choices) because the answer choices appear in randomized order each time the quiz is started. This level of security has proven successful and is consistent with the purposes of AR quizzes. Further, in the typical AR classroom, at any given time students are all reading different books, and take a quiz only once. Therefore, it is unlikely that they will be sufficiently familiar with a quiz to provide useful information to another student.
When AR is used according to Renaissance’s recommended best practices, the incidence of cheating is virtually eliminated because teachers conduct daily reviews of each student’s reading. Called “Status of the Class,” this review takes about 30 seconds to a minute for each student per day, during which time the teacher checks each student’s reading log, noting the book that the student is reading, how many pages have been read that day, and whether or not the student might be ready to finish the book, take a quiz, and select a new book. If the number of pages read that day is significantly lower than expected, the teacher checks to make sure that the book is at an appropriate level for the student, asks the student if he or she has encountered a difficult passage or has questions, etc. If the amount of materials read is significantly higher than expected, the teacher makes sure that the student is actually reading and comprehending the book by asking the student to paraphrase what he or she has just read, explain who the main characters are, etc.
11. Each quiz has a predetermined passing percent, which is a minimum percentage of items that a student must answer correctly. Students who do not pass the quiz are not eligible to receive any points. On 5- and 10-item quizzes, the pass rate is 60 percent correct; that is, at least 3 correct on the 5-item quizzes, and at least 6 correct on the 10-item quizzes. For 20-item quizzes, students must get 70 percent, or 14 items, correct in order to pass.
12. For a summary of this analysis, refer to the Validity Research Study beginning on page 33.
23Accelerated Reader 360™Understanding Reliability and Validity
The Development of Accelerated Reader QuizzesRetaking Quizzes
Retaking QuizzesRetaking the identical quiz typically increases students’ scores but is likely to be perceived by parents as being unfair (Snow, 1993). The tendency to score better increases when students receive feedback about whether their answers are right or wrong. Given this tendency, one might question the purpose of allowing students to retake a quiz, or more specifically, to retake a Reading Practice Quiz that is meant to determine if a student has read a book.
Therefore, students are discouraged from taking Reading Practice or Other Reading Quizzes more than once. If students have read a book within their zone of proximal development (ZPD), they are likely to pass the quiz because of the way it has been designed. If a student does not pass a quiz, it is probably because the student has not read the book or the book was too difficult in the first place. In neither case does it make sense for the student to retake the quiz.
Occasionally, there may be extenuating circumstances that contribute to a student’s failing a quiz. These circumstances include disruptions, illness, personal situations, and so on. When this is the case, the teacher has the option of deleting the student’s score and allowing the student to retake the quiz.
In essence, the regular retaking of quizzes may indicate cheating. Allowing students to retake a Reading Practice or Other Reading Quiz on a regular basis promotes guessing and may lead students to choose books that are too difficult for them. In fact, allowing students to take a quiz more than once may cause some students to take quizzes on books they haven’t read because they have a good chance of passing the quiz after taking it several times.
Literacy Skills Quizzes, on the other hand, are an exception to this recommendation. The items on these quizzes are drawn from item banks correlated to specific comprehension skills. The purpose of Literacy Skills Quizzes is to measure various aspects of comprehension. Teachers may choose to have students retake Literacy Skills Quizzes in order to provide additional practice or to assess specific elements of comprehension, such as inferential comprehension. Also, Literacy Skills Quizzes can be useful for diagnostic purposes, to measure the change in students’ skills after an intervention, or to determine if students have mastered one or more skills. For these purposes, item-bank technology is appropriate because equivalent forms of the assessment can be generated within a skill category, such as constructing meaning.
24Accelerated Reader 360™Understanding Reliability and Validity
Reliability
Reliability is the extent to which the scores from an assessment are consistent across repeated administrations of the same or similar tests to the same group or population. The more reliable test scores are, the greater their freedom from errors of measurement. In educational assessment, some degree of measurement error is inevitable. One reason for this is that a student’s performance may vary from one occasion to another.
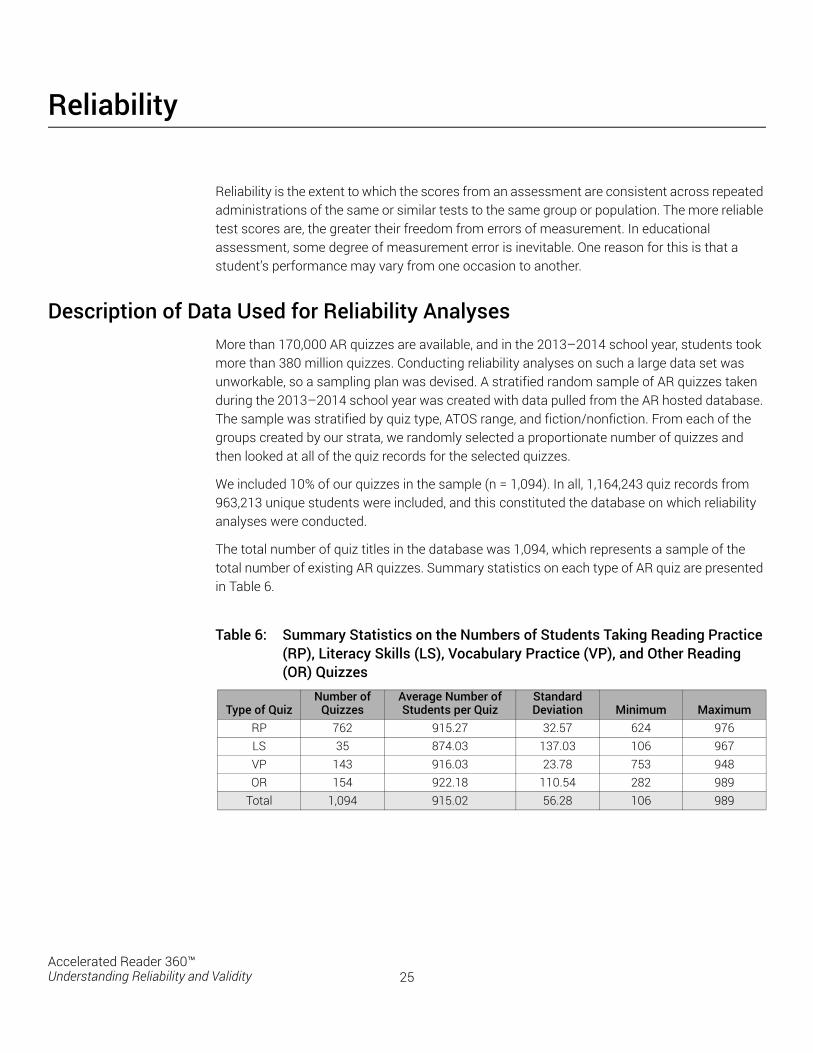
Description of Data Used for Reliability AnalysesMore than 170,000 AR quizzes are available, and in the 2013–2014 school year, students took more than 380 million quizzes. Conducting reliability analyses on such a large data set was unworkable, so a sampling plan was devised. A stratified random sample of AR quizzes taken during the 2013–2014 school year was created with data pulled from the AR hosted database. The sample was stratified by quiz type, ATOS range, and fiction/nonfiction. From each of the groups created by our strata, we randomly selected a proportionate number of quizzes and then looked at all of the quiz records for the selected quizzes.
We included 10% of our quizzes in the sample (n = 1,094). In all, 1,164,243 quiz records from 963,213 unique students were included, and this constituted the database on which reliability analyses were conducted.
The total number of quiz titles in the database was 1,094, which represents a sample of the total number of existing AR quizzes. Summary statistics on each type of AR quiz are presented in Table 6.
Table 6: Summary Statistics on the Numbers of Students Taking Reading Practice (RP), Literacy Skills (LS), Vocabulary Practice (VP), and Other Reading (OR) Quizzes
Type of QuizNumber of
QuizzesAverage Number of Students per Quiz
Standard Deviation Minimum Maximum
RP 762 915.27 32.57 624 976LS 35 874.03 137.03 106 967VP 143 916.03 23.78 753 948OR 154 922.18 110.54 282 989
Total 1,094 915.02 56.28 106 989
25Accelerated Reader 360™Understanding Reliability and Validity
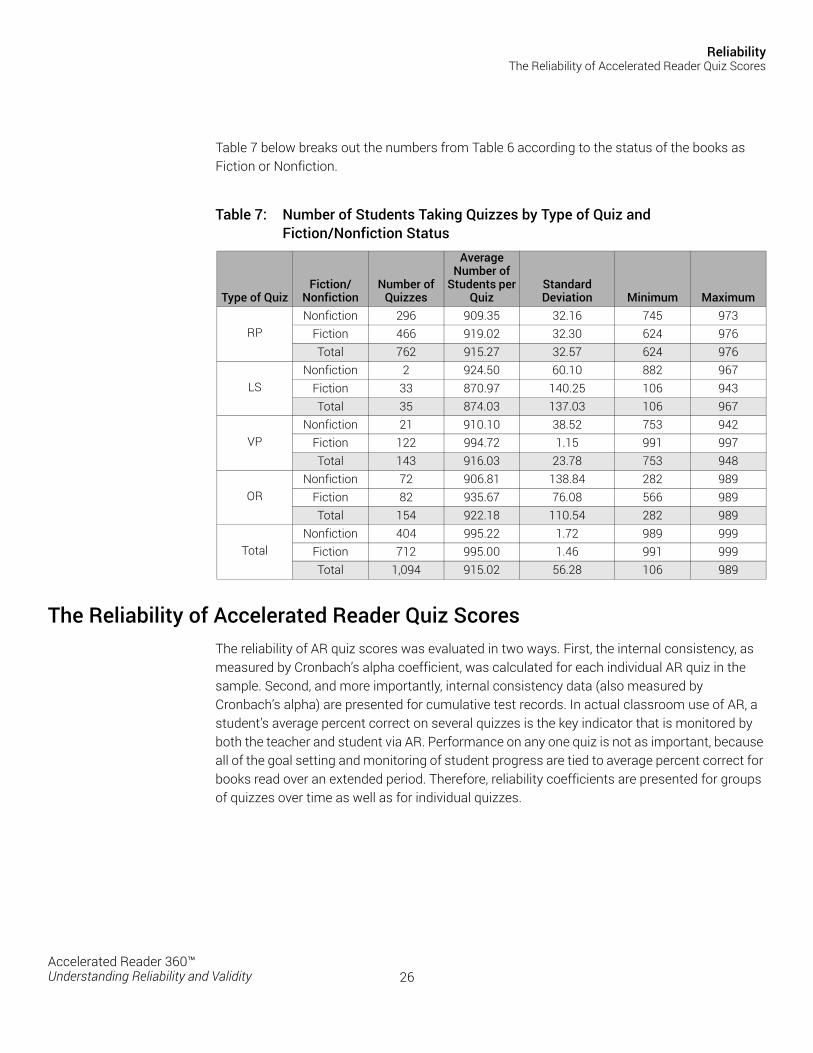
ReliabilityThe Reliability of Accelerated Reader Quiz Scores
Table 7 below breaks out the numbers from Table 6 according to the status of the books as Fiction or Nonfiction.
The Reliability of Accelerated Reader Quiz ScoresThe reliability of AR quiz scores was evaluated in two ways. First, the internal consistency, as measured by Cronbach’s alpha coefficient, was calculated for each individual AR quiz in the sample. Second, and more importantly, internal consistency data (also measured by Cronbach’s alpha) are presented for cumulative test records. In actual classroom use of AR, a student’s average percent correct on several quizzes is the key indicator that is monitored by both the teacher and student via AR. Performance on any one quiz is not as important, because all of the goal setting and monitoring of student progress are tied to average percent correct for books read over an extended period. Therefore, reliability coefficients are presented for groups of quizzes over time as well as for individual quizzes.
Table 7: Number of Students Taking Quizzes by Type of Quiz and Fiction/Nonfiction Status
Type of QuizFiction/
NonfictionNumber of
Quizzes
Average Number of
Students per Quiz
Standard Deviation Minimum Maximum
RPNonfiction 296 909.35 32.16 745 973
Fiction 466 919.02 32.30 624 976Total 762 915.27 32.57 624 976
LSNonfiction 2 924.50 60.10 882 967
Fiction 33 870.97 140.25 106 943Total 35 874.03 137.03 106 967
VPNonfiction 21 910.10 38.52 753 942
Fiction 122 994.72 1.15 991 997Total 143 916.03 23.78 753 948
ORNonfiction 72 906.81 138.84 282 989
Fiction 82 935.67 76.08 566 989Total 154 922.18 110.54 282 989
TotalNonfiction 404 995.22 1.72 989 999
Fiction 712 995.00 1.46 991 999Total 1,094 915.02 56.28 106 989
26Accelerated Reader 360™Understanding Reliability and Validity
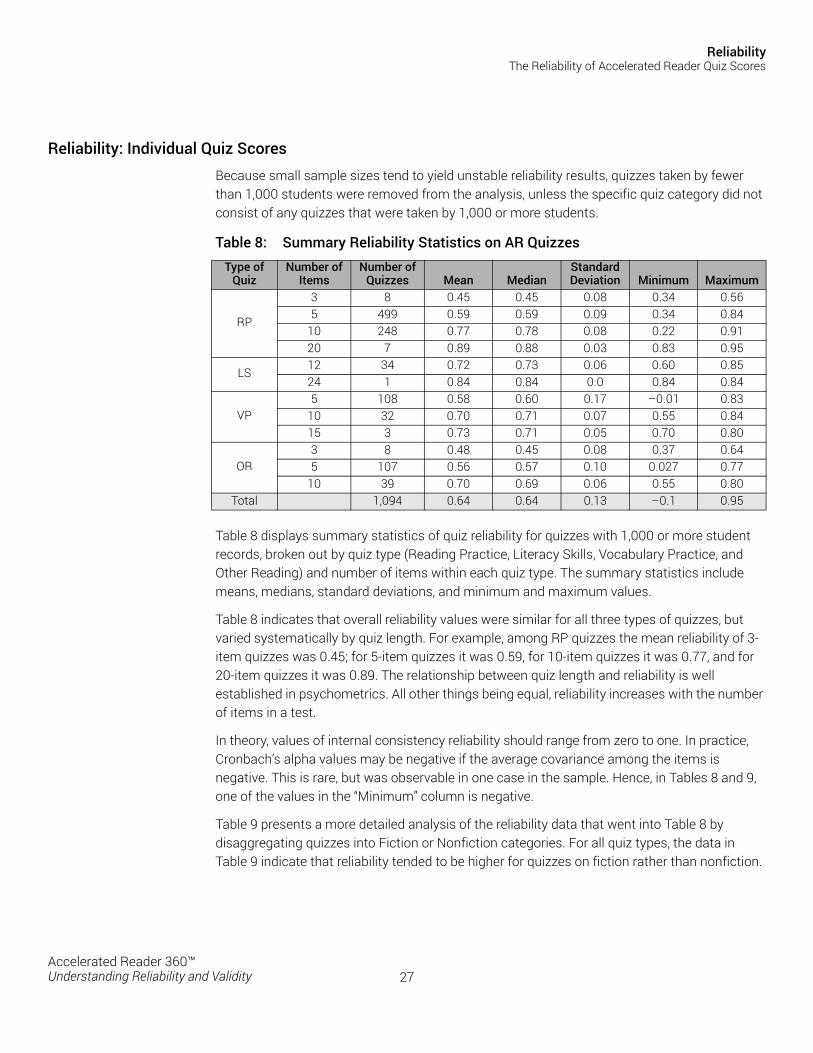
ReliabilityThe Reliability of Accelerated Reader Quiz Scores
Reliability: Individual Quiz ScoresBecause small sample sizes tend to yield unstable reliability results, quizzes taken by fewer than 1,000 students were removed from the analysis, unless the specific quiz category did not consist of any quizzes that were taken by 1,000 or more students.
Table 8 displays summary statistics of quiz reliability for quizzes with 1,000 or more student records, broken out by quiz type (Reading Practice, Literacy Skills, Vocabulary Practice, and Other Reading) and number of items within each quiz type. The summary statistics include means, medians, standard deviations, and minimum and maximum values.
Table 8 indicates that overall reliability values were similar for all three types of quizzes, but varied systematically by quiz length. For example, among RP quizzes the mean reliability of 3-item quizzes was 0.45; for 5-item quizzes it was 0.59, for 10-item quizzes it was 0.77, and for 20-item quizzes it was 0.89. The relationship between quiz length and reliability is well established in psychometrics. All other things being equal, reliability increases with the number of items in a test.
In theory, values of internal consistency reliability should range from zero to one. In practice, Cronbach’s alpha values may be negative if the average covariance among the items is negative. This is rare, but was observable in one case in the sample. Hence, in Tables 8 and 9, one of the values in the “Minimum” column is negative.
Table 9 presents a more detailed analysis of the reliability data that went into Table 8 by disaggregating quizzes into Fiction or Nonfiction categories. For all quiz types, the data in Table 9 indicate that reliability tended to be higher for quizzes on fiction rather than nonfiction.
Table 8: Summary Reliability Statistics on AR QuizzesType of
QuizNumber of
ItemsNumber of
Quizzes Mean MedianStandard Deviation Minimum Maximum
RP
3 8 0.45 0.45 0.08 0.34 0.565 499 0.59 0.59 0.09 0.34 0.84
10 248 0.77 0.78 0.08 0.22 0.9120 7 0.89 0.88 0.03 0.83 0.95
LS12 34 0.72 0.73 0.06 0.60 0.8524 1 0.84 0.84 0.0 0.84 0.84
VP5 108 0.58 0.60 0.17 –0.01 0.83
10 32 0.70 0.71 0.07 0.55 0.8415 3 0.73 0.71 0.05 0.70 0.80
OR3 8 0.48 0.45 0.08 0.37 0.645 107 0.56 0.57 0.10 0.027 0.77
10 39 0.70 0.69 0.06 0.55 0.80Total 1,094 0.64 0.64 0.13 –0.1 0.95
27Accelerated Reader 360™Understanding Reliability and Validity
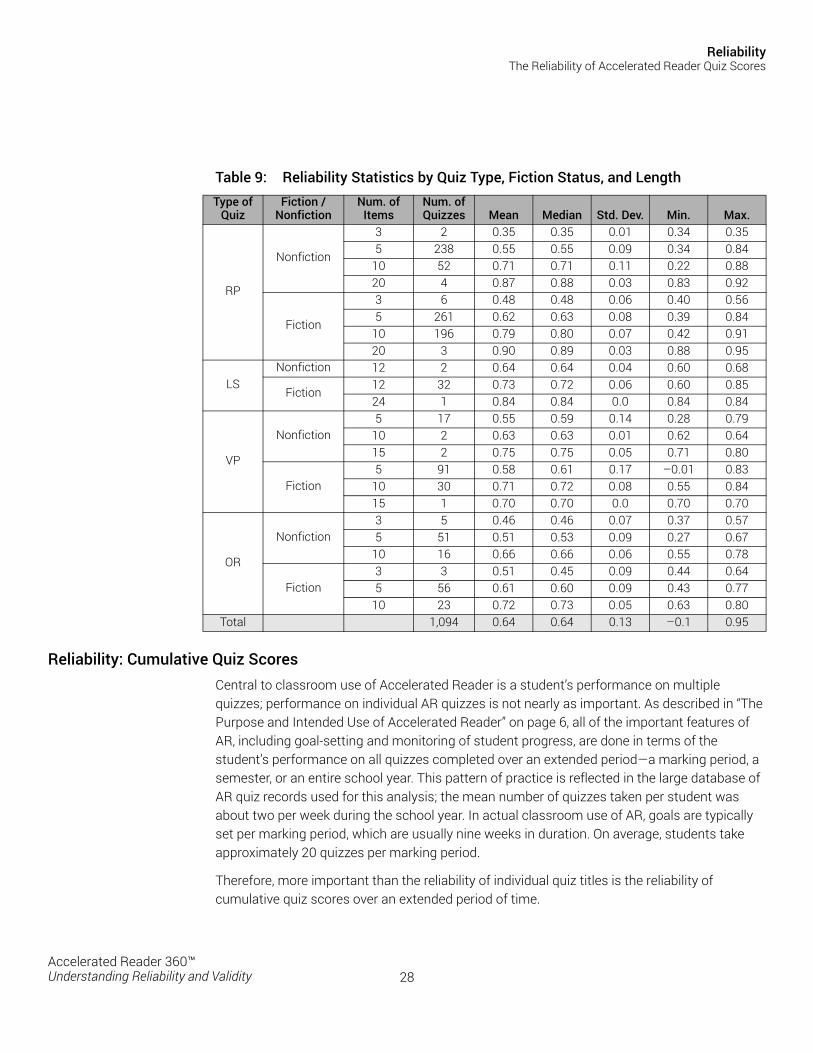
ReliabilityThe Reliability of Accelerated Reader Quiz Scores
Reliability: Cumulative Quiz ScoresCentral to classroom use of Accelerated Reader is a student’s performance on multiple quizzes; performance on individual AR quizzes is not nearly as important. As described in “The Purpose and Intended Use of Accelerated Reader” on page 6, all of the important features of AR, including goal-setting and monitoring of student progress, are done in terms of the student’s performance on all quizzes completed over an extended period—a marking period, a semester, or an entire school year. This pattern of practice is reflected in the large database of AR quiz records used for this analysis; the mean number of quizzes taken per student was about two per week during the school year. In actual classroom use of AR, goals are typically set per marking period, which are usually nine weeks in duration. On average, students take approximately 20 quizzes per marking period.
Therefore, more important than the reliability of individual quiz titles is the reliability of cumulative quiz scores over an extended period of time.
Table 9: Reliability Statistics by Quiz Type, Fiction Status, and LengthType of
QuizFiction /
NonfictionNum. of
ItemsNum. of Quizzes Mean Median Std. Dev. Min. Max.
RP
Nonfiction
3 2 0.35 0.35 0.01 0.34 0.355 238 0.55 0.55 0.09 0.34 0.84
10 52 0.71 0.71 0.11 0.22 0.8820 4 0.87 0.88 0.03 0.83 0.92
Fiction
3 6 0.48 0.48 0.06 0.40 0.565 261 0.62 0.63 0.08 0.39 0.84
10 196 0.79 0.80 0.07 0.42 0.9120 3 0.90 0.89 0.03 0.88 0.95
LSNonfiction 12 2 0.64 0.64 0.04 0.60 0.68
Fiction12 32 0.73 0.72 0.06 0.60 0.8524 1 0.84 0.84 0.0 0.84 0.84
VP
Nonfiction5 17 0.55 0.59 0.14 0.28 0.79
10 2 0.63 0.63 0.01 0.62 0.6415 2 0.75 0.75 0.05 0.71 0.80
Fiction5 91 0.58 0.61 0.17 –0.01 0.83
10 30 0.71 0.72 0.08 0.55 0.8415 1 0.70 0.70 0.0 0.70 0.70
OR
Nonfiction3 5 0.46 0.46 0.07 0.37 0.575 51 0.51 0.53 0.09 0.27 0.67
10 16 0.66 0.66 0.06 0.55 0.78
Fiction3 3 0.51 0.45 0.09 0.44 0.645 56 0.61 0.60 0.09 0.43 0.77
10 23 0.72 0.73 0.05 0.63 0.80Total 1,094 0.64 0.64 0.13 –0.1 0.95
28Accelerated Reader 360™Understanding Reliability and Validity
ReliabilityThe Reliability of Accelerated Reader Quiz Scores
Construction of Quiz Composites. To estimate the reliability of cumulative quiz scores taken over extended periods of time such as marking periods, groups of quizzes, called composites, were created that shared key characteristics. Composites contained varying numbers of quizzes, but were constructed so that the quiz characteristics of each composite were as uniform as possible. The criteria used for creating each composite were as follows:
Quizzes were taken by the same student
Quizzes contained the same number of items (5-, 10-, or 20-item)
Quizzes were taken during a three-month time period
Quizzes were at the same book level
Quizzes were all either fiction or nonfiction
For example, one composite consisted of four 10-item nonfiction quizzes. Each quiz was at grade level 6, and each was taken by the same student during the period of February through May of 2014. These four 10-item quizzes essentially became a 40-item composite.
Reliability coefficients (Cronbach’s alpha) were calculated separately for composite scores of 5-, 10-, and 20-item quizzes. Because Reading Practice and Other Reading Quizzes are both available in 5-, 10-, and 20-item formats, composites were constructed containing these two types of quizzes. Literacy Skills Quizzes were not included because LS quizzes are generated using item banks, and there were insufficient numbers of LS quizzes to create composites of LS-only quizzes.
In all, 345,477 composites were created for 5-item quizzes, 336,728 composites were created for 10-item quizzes, and 65,631 composites were created for 20-item quizzes. Composites ranged in size from 2 to 20 quizzes for 5- and 10-item quizzes. Composites ranged from two to thirteen quizzes for 20-item quizzes; there were no cases in which a group of more than thirteen 20-item quizzes met the above criteria.
All other things being equal (such as item difficulty and discriminating power), longer tests are more reliable than shorter ones, and that is the case for the individual quiz reliability coefficients presented previously. Therefore, we would expect the reliability of quiz composites to increase as their length (in number of items) increases. This notion was tested using the well-known Spearman–Brown formula (Lord & Novick, 1968). The Spearman–Brown formula describes the relationship of the reliability of a lengthened test to the ratio of the revised length to the original length. The Spearman–Brown formula is shown below.
R'xx = kRxx/(1 + (k – 1)Rxx)
where
k is the ratio of the revised length of the test to its original length
Rxx is the reliability coefficient of the test at its original length
R'xx is the expected reliability coefficient at the revised length
29Accelerated Reader 360™Understanding Reliability and Validity
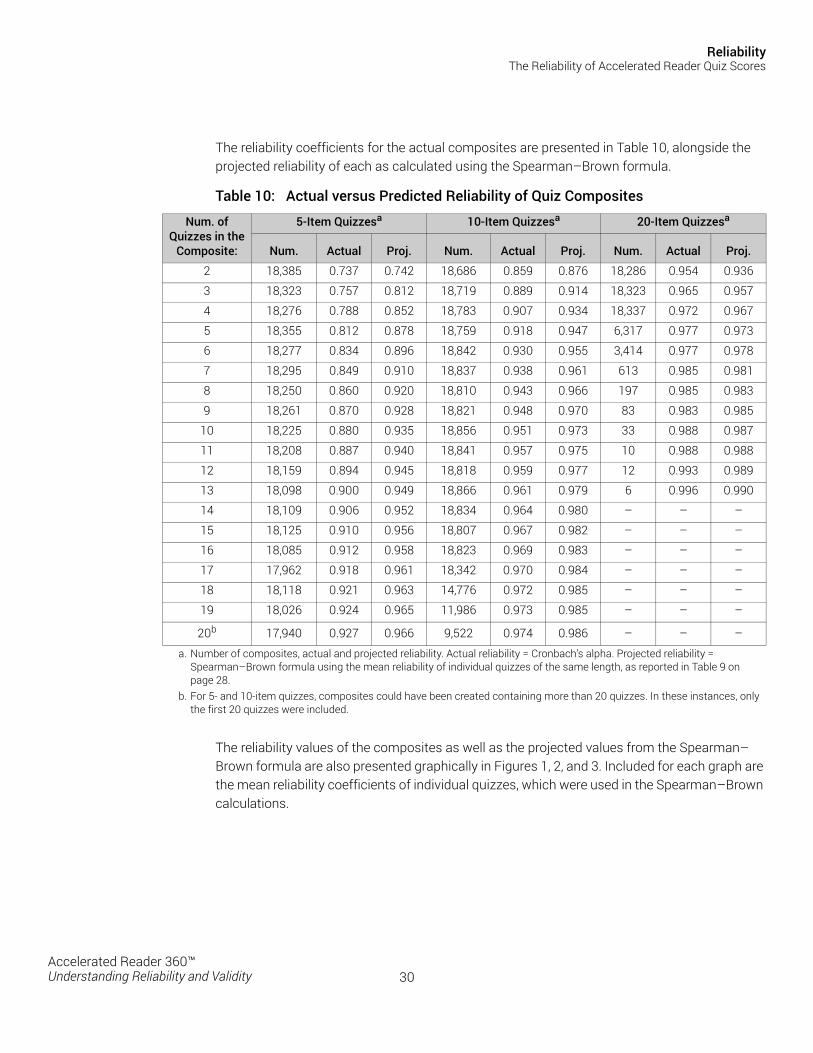
ReliabilityThe Reliability of Accelerated Reader Quiz Scores
The reliability coefficients for the actual composites are presented in Table 10, alongside the projected reliability of each as calculated using the Spearman–Brown formula.
The reliability values of the composites as well as the projected values from the Spearman–Brown formula are also presented graphically in Figures 1, 2, and 3. Included for each graph are the mean reliability coefficients of individual quizzes, which were used in the Spearman–Brown calculations.
Table 10: Actual versus Predicted Reliability of Quiz Composites
Num. of Quizzes in the
Composite:
5-Item Quizzesa
a. Number of composites, actual and projected reliability. Actual reliability = Cronbach’s alpha. Projected reliability = Spearman–Brown formula using the mean reliability of individual quizzes of the same length, as reported in Table 9 on page 28.
10-Item Quizzesa 20-Item Quizzesa
Num. Actual Proj. Num. Actual Proj. Num. Actual Proj.
2 18,385 0.737 0.742 18,686 0.859 0.876 18,286 0.954 0.936
3 18,323 0.757 0.812 18,719 0.889 0.914 18,323 0.965 0.957
4 18,276 0.788 0.852 18,783 0.907 0.934 18,337 0.972 0.967
5 18,355 0.812 0.878 18,759 0.918 0.947 6,317 0.977 0.973
6 18,277 0.834 0.896 18,842 0.930 0.955 3,414 0.977 0.978
7 18,295 0.849 0.910 18,837 0.938 0.961 613 0.985 0.981
8 18,250 0.860 0.920 18,810 0.943 0.966 197 0.985 0.983
9 18,261 0.870 0.928 18,821 0.948 0.970 83 0.983 0.985
10 18,225 0.880 0.935 18,856 0.951 0.973 33 0.988 0.987
11 18,208 0.887 0.940 18,841 0.957 0.975 10 0.988 0.988
12 18,159 0.894 0.945 18,818 0.959 0.977 12 0.993 0.989
13 18,098 0.900 0.949 18,866 0.961 0.979 6 0.996 0.990
14 18,109 0.906 0.952 18,834 0.964 0.980 – – –
15 18,125 0.910 0.956 18,807 0.967 0.982 – – –
16 18,085 0.912 0.958 18,823 0.969 0.983 – – –
17 17,962 0.918 0.961 18,342 0.970 0.984 – – –
18 18,118 0.921 0.963 14,776 0.972 0.985 – – –
19 18,026 0.924 0.965 11,986 0.973 0.985 – – –
20b
b. For 5- and 10-item quizzes, composites could have been created containing more than 20 quizzes. In these instances, only the first 20 quizzes were included.
17,940 0.927 0.966 9,522 0.974 0.986 – – –
30Accelerated Reader 360™Understanding Reliability and Validity
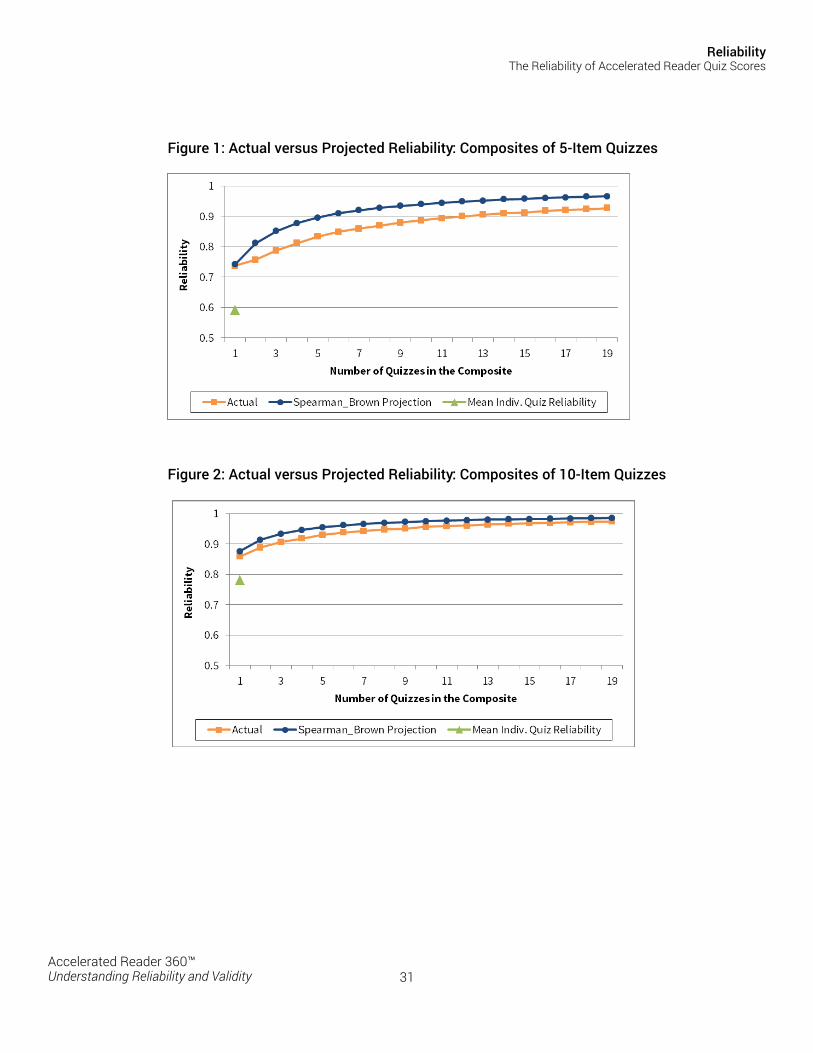
ReliabilityThe Reliability of Accelerated Reader Quiz Scores
Figure 1: Actual versus Projected Reliability: Composites of 5-Item Quizzes
Figure 2: Actual versus Projected Reliability: Composites of 10-Item Quizzes
31Accelerated Reader 360™Understanding Reliability and Validity
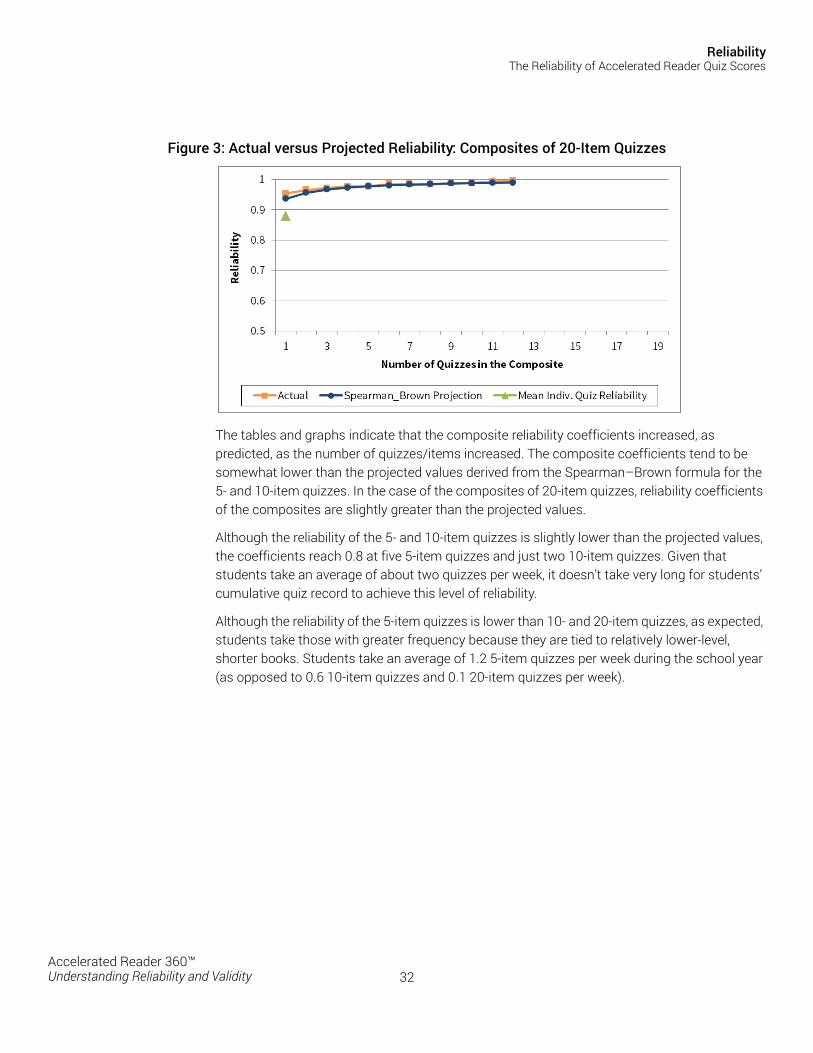
ReliabilityThe Reliability of Accelerated Reader Quiz Scores
Figure 3: Actual versus Projected Reliability: Composites of 20-Item Quizzes
The tables and graphs indicate that the composite reliability coefficients increased, as predicted, as the number of quizzes/items increased. The composite coefficients tend to be somewhat lower than the projected values derived from the Spearman–Brown formula for the 5- and 10-item quizzes. In the case of the composites of 20-item quizzes, reliability coefficients of the composites are slightly greater than the projected values.
Although the reliability of the 5- and 10-item quizzes is slightly lower than the projected values, the coefficients reach 0.8 at five 5-item quizzes and just two 10-item quizzes. Given that students take an average of about two quizzes per week, it doesn’t take very long for students’ cumulative quiz record to achieve this level of reliability.
Although the reliability of the 5-item quizzes is lower than 10- and 20-item quizzes, as expected, students take those with greater frequency because they are tied to relatively lower-level, shorter books. Students take an average of 1.2 5-item quizzes per week during the school year (as opposed to 0.6 10-item quizzes and 0.1 20-item quizzes per week).
32Accelerated Reader 360™Understanding Reliability and Validity
Validity
Assessment validity is the degree to which a test measures what it claims to measure. Evidence of test validity is often indirect and incremental, consisting of a variety of data that in the aggregate are consistent with the theory that the test measures the intended construct.
Accelerated Reader quizzes are intended to assess whether or not students have read and comprehended books or selections of text from textbooks. Students read multiple books and selections of text throughout the school year, and their cumulative progress is measured against goals recommended by Renaissance and set by teachers.
To be valid, Accelerated Reader quiz scores should:
Discriminate between students who have read books and those who have not
Correlate positively with valid and reliable state and other standardized reading assessments
This section contains evidence, accumulated to date, of Accelerated Reader’s performance in these two areas. First, a controlled “validity study” is described that involved groups of randomly selected students that took AR quizzes for books that they had not read. The results indicate that AR quizzes were effective at discriminating between instances of students having read the book and not having read the book. Second, cumulative AR data are correlated with 11 state and other standardized tests of general reading ability. Although this is not an ideal comparison (in the sense that AR quizzes measure whether students read and comprehended books and the state/standardized tests measure general reading ability), the correlations are positive and in the moderate range, suggesting that the tests are measuring something similar.
Quiz Validity StudyIn the spring of 2005, a study was conducted to test the assumption that AR Reading Practice Quizzes are effective in discriminating between students who have actually read the books and those who have not.
Two research hypotheses were identified. First, the passing rate13 on books that the students had not read would be no greater than would be expected by chance. Second, student performance on quizzes covering books they had read would be much higher than on books that they have not read.
To test these hypotheses, random samples of students from three elementary schools were selected, and the students were asked to take AR quizzes for books that they had not read. The quizzes assigned to each student were carefully selected to match each student’s reading level, and also to match a recently completed quiz on book genre, reading level, and book length. The processes of selecting schools, students, and quizzes are described below.
13. To pass a quiz, students must get 60 percent correct on 5- and 10-item quizzes, and 70 percent correct on 20-item quizzes.
33Accelerated Reader 360™Understanding Reliability and Validity
ValidityQuiz Validity Study
Sample Selection and Data CollectionBecause the study design called for schools to strictly follow unusual data collection procedures (students being asked to take quizzes on books that they had not read), it was determined that Associate Renaissance Consultants (ARCs), individuals affiliated with schools that have a proven track record of correctly using Renaissance products and participating in tightly controlled research studies, should be involved to ensure adherence to the study design. Applications to participate in the study were distributed through 35 ARCs. Thirteen schools returned applications, and three schools were selected randomly to participate.
From each school, 20 students in grade 3 and 20 in grade 4 were randomly selected to participate, for a total of 120 students. It was decided to include those grades because the greatest number of AR quizzes are available at those levels. The study design necessitates having a large number of quiz titles available because the process of assigning quizzes to students calls for identifying at least five quizzes per student that match specific characteristics. The quiz selection process is described below.
Each of the three schools provided data files that included student names, AR quiz history from the 2004–2005 school year, and most recent performance on the computer-adaptive Star Reading test from the 2004–2005 school year. After students were randomly selected from both grades, replicate samples were also randomly selected as backups, in case the selected students were unable to participate in the study.
For each selected and replicate student, we selected the most recent AR Reading Practice Quiz that was at a reading level very close to the students’ reading abilities as measured by their most recent Star Reading test completed. When a student completes a Star Reading test, the software analyzes the student’s performance and calculates his or her Instructional Reading Level (IRL), a criterion-referenced score that is the highest reading level at which a student is at least 90–98% proficient at recognizing words (Gickling & Havertape, 1981; Johnson, Kress, & Pikulski, 1987; McCormick, 1999) and 80% proficient (or higher) at comprehending material with assistance (Gickling & Thompson, 2001). IRL is not the same as Grade Equivalent, but corresponds closely to it. For each student, we selected the most recently taken AR quiz that had a reading level within +/– 0.2 points of the student’s Star Reading IRL. For the vast majority, the selected AR quiz was within this range, but for a few, the closest quiz match to a recent IRL was greater than +/– 0.2 points.
With a recently completed AR quiz having been selected for each student, we then attempted to identify five quizzes that matched the selected quiz on a number of important characteristics. The five quizzes would be presented to each student, who would be asked to pick a title that he or she had not previously read and complete a quiz for it. First, a master list of AR Reading Practice Quizzes was generated so it could be used for the random selection of matched quizzes. Quizzes that were part of a series or were nonfiction were removed from the list because it was determined students should not have prior knowledge of the subject matter on which they would be quizzed. Then, for each selected quiz, five quizzes were identified that
34Accelerated Reader 360™Understanding Reliability and Validity
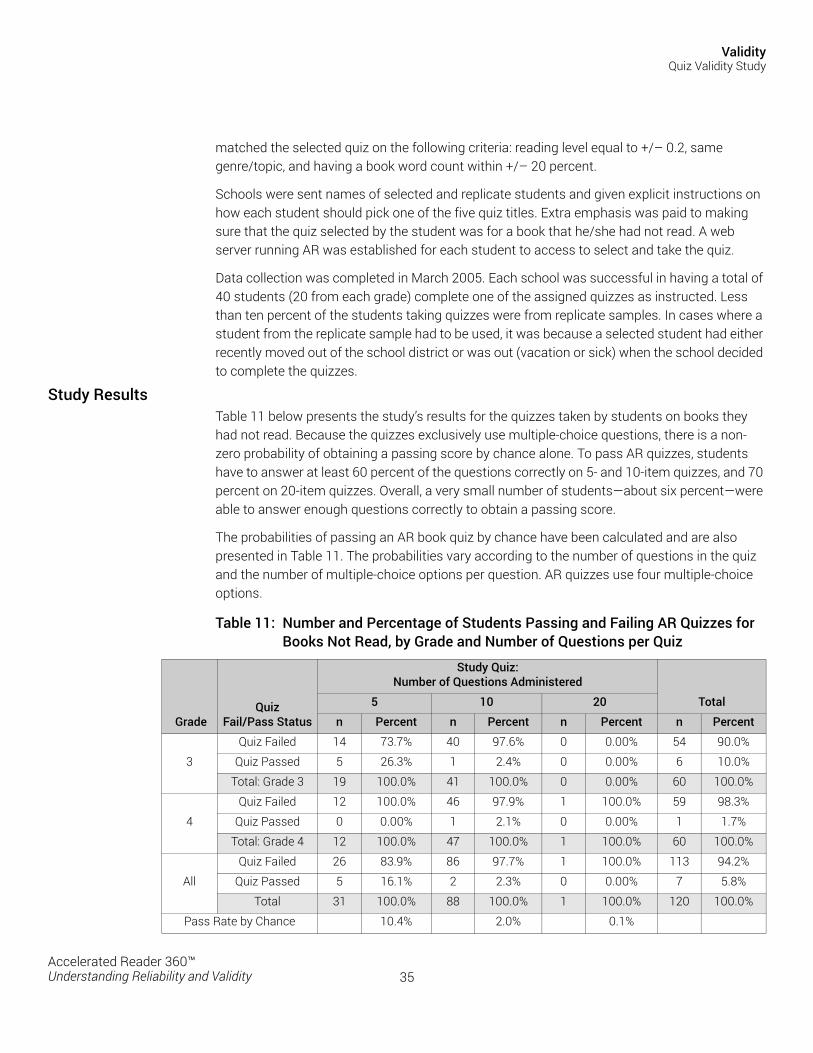
ValidityQuiz Validity Study
matched the selected quiz on the following criteria: reading level equal to +/– 0.2, same genre/topic, and having a book word count within +/– 20 percent.
Schools were sent names of selected and replicate students and given explicit instructions on how each student should pick one of the five quiz titles. Extra emphasis was paid to making sure that the quiz selected by the student was for a book that he/she had not read. A web server running AR was established for each student to access to select and take the quiz.
Data collection was completed in March 2005. Each school was successful in having a total of 40 students (20 from each grade) complete one of the assigned quizzes as instructed. Less than ten percent of the students taking quizzes were from replicate samples. In cases where a student from the replicate sample had to be used, it was because a selected student had either recently moved out of the school district or was out (vacation or sick) when the school decided to complete the quizzes.
Study ResultsTable 11 below presents the study’s results for the quizzes taken by students on books they had not read. Because the quizzes exclusively use multiple-choice questions, there is a non-zero probability of obtaining a passing score by chance alone. To pass AR quizzes, students have to answer at least 60 percent of the questions correctly on 5- and 10-item quizzes, and 70 percent on 20-item quizzes. Overall, a very small number of students—about six percent—were able to answer enough questions correctly to obtain a passing score.
The probabilities of passing an AR book quiz by chance have been calculated and are also presented in Table 11. The probabilities vary according to the number of questions in the quiz and the number of multiple-choice options per question. AR quizzes use four multiple-choice options.
Table 11: Number and Percentage of Students Passing and Failing AR Quizzes for Books Not Read, by Grade and Number of Questions per Quiz
GradeQuiz
Fail/Pass Status
Study Quiz:Number of Questions Administered
Total 5 10 20
n Percent n Percent n Percent n Percent
3
Quiz Failed 14 73.7% 40 97.6% 0 0.00% 54 90.0%
Quiz Passed 5 26.3% 1 2.4% 0 0.00% 6 10.0%
Total: Grade 3 19 100.0% 41 100.0% 0 0.00% 60 100.0%
4
Quiz Failed 12 100.0% 46 97.9% 1 100.0% 59 98.3%
Quiz Passed 0 0.00% 1 2.1% 0 0.00% 1 1.7%
Total: Grade 4 12 100.0% 47 100.0% 1 100.0% 60 100.0%
All
Quiz Failed 26 83.9% 86 97.7% 1 100.0% 113 94.2%
Quiz Passed 5 16.1% 2 2.3% 0 0.00% 7 5.8%
Total 31 100.0% 88 100.0% 1 100.0% 120 100.0%
Pass Rate by Chance 10.4% 2.0% 0.1%
35Accelerated Reader 360™Understanding Reliability and Validity

ValidityQuiz Validity Study
Table 11 shows that students’ pass rates on books not read were slightly higher than chance rates. On 5-question quizzes, 16.1 percent of students passed their quizzes, and the rate of passing by chance was 10.4 percent. On 10-question quizzes, 2.3 percent of students passed their quizzes, and the rate of passing by chance was 2.0 percent.
The first hypothesis—that student pass rates on books not read would be no greater than chance—was tested on 5- and 10-item quiz results separately using a one-sample z-test for a proportion.14 For both tests, the null hypothesis was that the student pass rate on books not read was equivalent to chance. The z-test produces probabilities (p-values) that correspond to the likelihood of obtaining a result that is as far or farther away as our sample mean is from the population mean (in this case the probability of passing by chance), if the null hypothesis is true. A low probability (0.05 or less) would provide justification to reject the null hypothesis and accept an alternative hypothesis. A higher probability would lead us not to reject the null hypothesis and, in this case, to conclude that the sample mean does not differ significantly from the chance pass rate.
The p-values generated by the z-tests were 0.30 for 5-item quizzes and 0.86 for 10-item quizzes, leading us not to reject the null hypothesis that the students’ pass rate was the same as the pass rate from chance. Although students’ average pass rates on books not read were slightly higher than the chance pass rates, the differences were not statistically significant. In other words, when quizzed on books they have not read, students pass at a rate that is not significantly different than what would be expected by chance.
The second hypothesis involved examining the difference between student performance on quizzes for books read versus performance on quizzes for books not read. The descriptive data for these two quizzes reveals quite substantial differences. Table 12 presents the means and standard deviations, by grade, of quiz percent correct and pass rates. Figure 4 depicts in a bar graph the quiz percent correct on books not read versus books read.
14. Only one student took a 20-item quiz, so that was not included in the analysis. Note that in the master list of AR Reading Practice Quizzes, most quizzes contain 5 or 10 items. Only a small number (about two percent) use 20 items. Approximately 34 and 64 percent are 5- and 10-question quizzes, respectively.
Table 12: Means and Standard Deviations of Quiz Percent Correct and Pass Rate on Books Not Read versus Books Read
Grade 3 Grade 4 Both Grades
MeanStandard Deviation Mean
Standard Deviation Mean
Standard Deviation
Percent Correct on Quizzes for Books Not Read 25.00 19.53 23.50 13.88 24.25 16.89
Percent Correct on Randomly Selected Quizzes for Books Read 85.00 15.78 90.00 14.26 87.50 15.19
Percent of Students Passing Quizzes for Books Not Read 10.00 30.25 1.67 12.91 5.83 23.54Percent of Students Passing
Quizzes for Books Read 95.00 21.98 98.33 12.91 96.67 18.03
36Accelerated Reader 360™Understanding Reliability and Validity
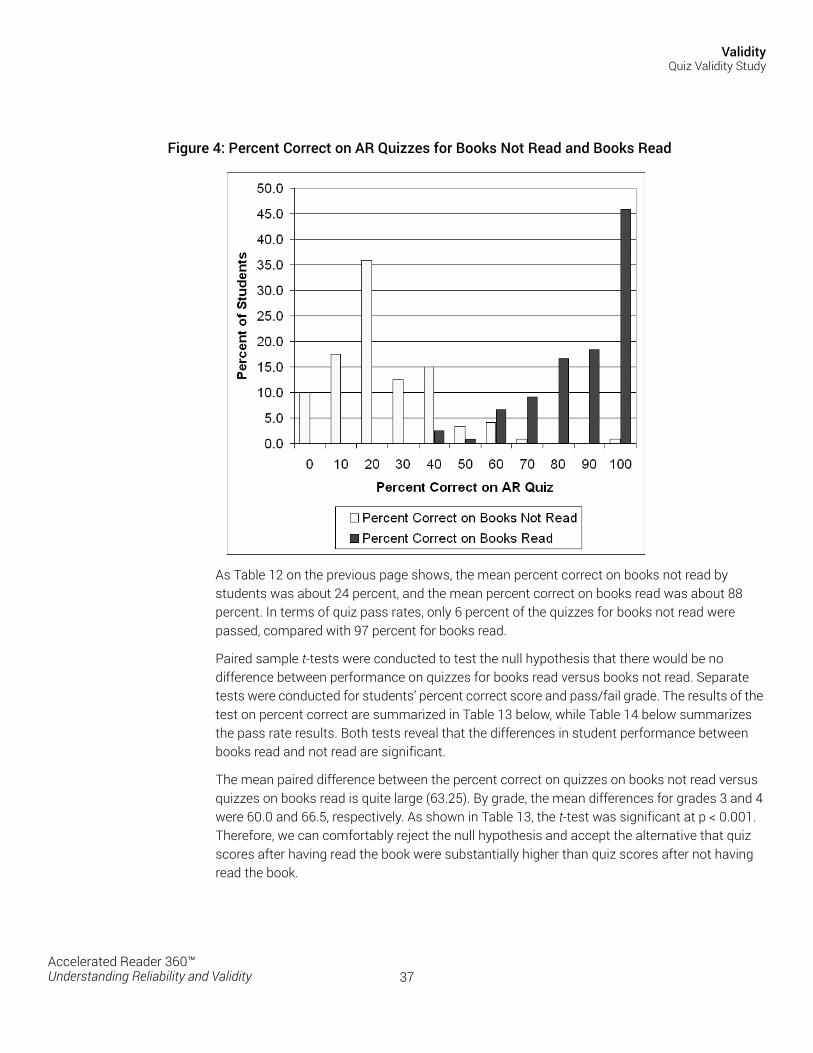
ValidityQuiz Validity Study
Figure 4: Percent Correct on AR Quizzes for Books Not Read and Books Read
As Table 12 on the previous page shows, the mean percent correct on books not read by students was about 24 percent, and the mean percent correct on books read was about 88 percent. In terms of quiz pass rates, only 6 percent of the quizzes for books not read were passed, compared with 97 percent for books read.
Paired sample t-tests were conducted to test the null hypothesis that there would be no difference between performance on quizzes for books read versus books not read. Separate tests were conducted for students’ percent correct score and pass/fail grade. The results of the test on percent correct are summarized in Table 13 below, while Table 14 below summarizes the pass rate results. Both tests reveal that the differences in student performance between books read and not read are significant.
The mean paired difference between the percent correct on quizzes on books not read versus quizzes on books read is quite large (63.25). By grade, the mean differences for grades 3 and 4 were 60.0 and 66.5, respectively. As shown in Table 13, the t-test was significant at p < 0.001. Therefore, we can comfortably reject the null hypothesis and accept the alternative that quiz scores after having read the book were substantially higher than quiz scores after not having read the book.
37Accelerated Reader 360™Understanding Reliability and Validity
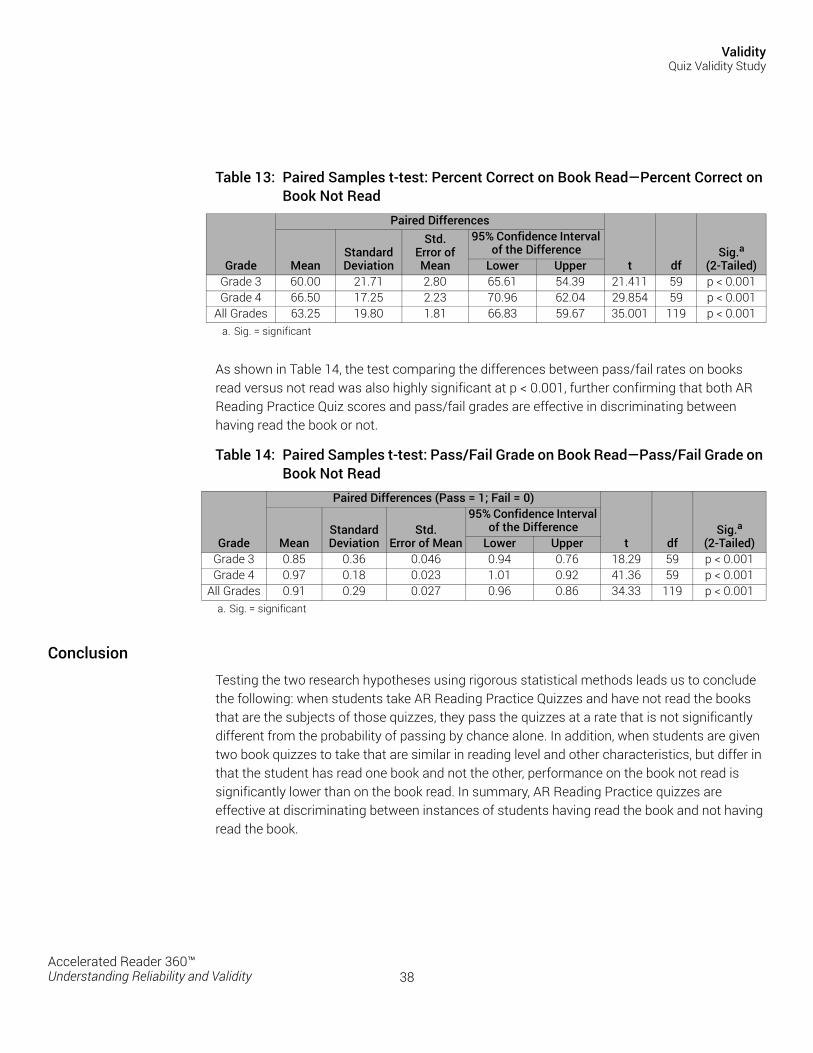
ValidityQuiz Validity Study
As shown in Table 14, the test comparing the differences between pass/fail rates on books read versus not read was also highly significant at p < 0.001, further confirming that both AR Reading Practice Quiz scores and pass/fail grades are effective in discriminating between having read the book or not.
ConclusionTesting the two research hypotheses using rigorous statistical methods leads us to conclude the following: when students take AR Reading Practice Quizzes and have not read the books that are the subjects of those quizzes, they pass the quizzes at a rate that is not significantly different from the probability of passing by chance alone. In addition, when students are given two book quizzes to take that are similar in reading level and other characteristics, but differ in that the student has read one book and not the other, performance on the book not read is significantly lower than on the book read. In summary, AR Reading Practice quizzes are effective at discriminating between instances of students having read the book and not having read the book.
Table 13: Paired Samples t-test: Percent Correct on Book Read—Percent Correct on Book Not Read
Grade
Paired Differences
t dfSig.a
(2-Tailed)
a. Sig. = significant
MeanStandard Deviation
Std.Error of Mean
95% Confidence Interval of the Difference
Lower UpperGrade 3 60.00 21.71 2.80 65.61 54.39 21.411 59 p < 0.001Grade 4 66.50 17.25 2.23 70.96 62.04 29.854 59 p < 0.001
All Grades 63.25 19.80 1.81 66.83 59.67 35.001 119 p < 0.001
Table 14: Paired Samples t-test: Pass/Fail Grade on Book Read—Pass/Fail Grade on Book Not Read
Grade
Paired Differences (Pass = 1; Fail = 0)
t dfSig.a
(2-Tailed)
a. Sig. = significant
MeanStandard Deviation
Std.Error of Mean
95% Confidence Interval of the Difference
Lower UpperGrade 3 0.85 0.36 0.046 0.94 0.76 18.29 59 p < 0.001Grade 4 0.97 0.18 0.023 1.01 0.92 41.36 59 p < 0.001
All Grades 0.91 0.29 0.027 0.96 0.86 34.33 119 p < 0.001
38Accelerated Reader 360™Understanding Reliability and Validity
ValidityCorrelation with Standardized Reading Assessments
Correlation with Standardized Reading AssessmentsThis section summarizes the external validity of AR Reading Practice Quizzes by describing their relationship with state and other standardized reading assessments. In some respects, AR is a unique assessment in that it assesses whether students read and comprehended books and selections of text. Ideally, its validity could be measured, in part, by the extent to which its scores correlate with assessments that both (1) assess the same thing, and (2) are of a sufficient quality, as judged by published studies, and reliability and/or validity data. Unfortunately, no assessment systems meet these criteria. Therefore, Renaissance collected student-level data from state and other standardized reading tests.
Correlations between AR and 24 reading tests are presented in this section. For some of the tests, scores were available pertaining to specific skills (for example comprehension and fluency), but in most cases, only a score of general reading ability was available. Although the tests of general reading ability measure more skills than AR does, one would expect a positive correlation overall. One would also expect a higher correlation with the tests of reading comprehension. The correlations between AR and the general reading assessments are positive and generally in the moderate range, providing evidence of AR’s validity. That the correlations are not higher is not surprising given that AR is more narrowly focused than the general reading assessments. Also, the way that comprehension is measured is somewhat different. AR measures students’ ability to recall literal information from books or stories that they have read. This is comparable to, but more challenging than, traditional tests of comprehension, in which the passage of text is available to the student. As expected, AR correlations with reading comprehension measures are higher than with the general reading measures.
Description of Data Used for Validity AnalysesA total of 216 schools provided student-level AR data along with matching scores from popular standardized reading assessments. The schools were from the following 34 U.S. states plus one Canadian province (Saskatchewan): Alabama, Arizona, Arkansas, California, Colorado, Delaware, Florida, Georgia, Idaho, Illinois, Indiana, Kentucky, Louisiana, Massachusetts, Minnesota, Mississippi, Missouri, Montana, Nebraska, New Jersey, New Mexico, New York, North Carolina, Ohio, Oklahoma, Oregon, Pennsylvania, South Dakota, Tennessee, Texas, Virginia, Washington, Wisconsin, and Wyoming.
A total of 4,532,589 unique students were included in the sample used for the validity analyses. This is smaller than the total number of matched-student AR-external test pairs (4,799,152) due to the fact that a single student may be included in correlations with more than one test. Additionally, a student may be included in correlations across multiple school years (e.g., spring 2002 as a fourth-grade student, and spring 2003 as a fifth-grade student).
The AR quiz data were collected over a period of fifteen school years. During the first three of those years (2000–2001, 2001–2002, and 2002–2003), data were collected under the
39Accelerated Reader 360™Understanding Reliability and Validity
ValidityCorrelation with Standardized Reading Assessments
auspices of a consulting service provided by Renaissance. The service involved the submission to Renaissance of schools’ student-level electronic data on Accelerated Reader, Star Reading, and other assessments. In turn, the company provided schools with detailed summaries of student, teacher, class, and school performance compared to best practice implementation standards for AR, as well as suggestions for improvement. Some schools also provided student-level results on such standardized tests as the Stanford Achievement Test (SAT-9) and Measures of Academic Progress (MAP), as well as several state tests.
Starting with the 2003–2004 school year, AR data and scores from Star Early Literacy (a criterion-referenced test developed by Renaissance) and Star Reading were collected from schools that had signed hosting agreements with Renaissance whereby the company hosts the schools’ assessment data on its web servers and may use those data for research purposes.
Including the two Renaissance computerized assessments—Star Reading and Star Early Literacy—student-level AR data were matched with data from a total of 21 reading assessments. Those assessments are listed in Tables 15 and 16 on pages 41–45.
In addition to the assessments of general reading ability, correlations are also provided between AR and a number of subtests measuring specific reading skills. Those subtests are from DIBELS (Dynamic Indicators of Basic Early Literacy Skills), GRADE (Group Reading Assessment and Diagnostic Evaluation), and TPRI (Texas Primary Reading Inventory). These data were collected during the fall 2004 semester. Two elementary schools provided student-level AR data along with matching scores from DIBELS, GRADE, and TPRI.
It should be noted that AR is much more specific than the 21 general tests of reading ability. AR measures the amount of reading and comprehension by asking students to respond to literal questions about text they have read. In other words, the underlying tasks are somewhat different. Therefore, the correlations between AR and the general reading assessments are likely to be not as strong as the correlations among the general reading assessments themselves. However, there is a moderate positive relationship between the two, suggesting that AR is measuring something that the general reading tests are measuring, even though AR is more limited in scope. The correlations between AR and the reading comprehension subtests are generally stronger than the correlations between AR and the general reading assessments.
Correlations with External TestsBecause students take multiple AR quizzes during a school year, semester, quarter, or even week, and the program emphasizes cumulative performance such as words read and percent correct on quizzes, correlating student performance on individual AR quizzes with external tests would not be meaningful. Therefore, cumulative performance on AR quizzes was aggregated by semester, and was correlated with the state or standardized test taken during that semester. Semesters were defined as fall including August through December, and spring including January through June.
40Accelerated Reader 360™Understanding Reliability and Validity
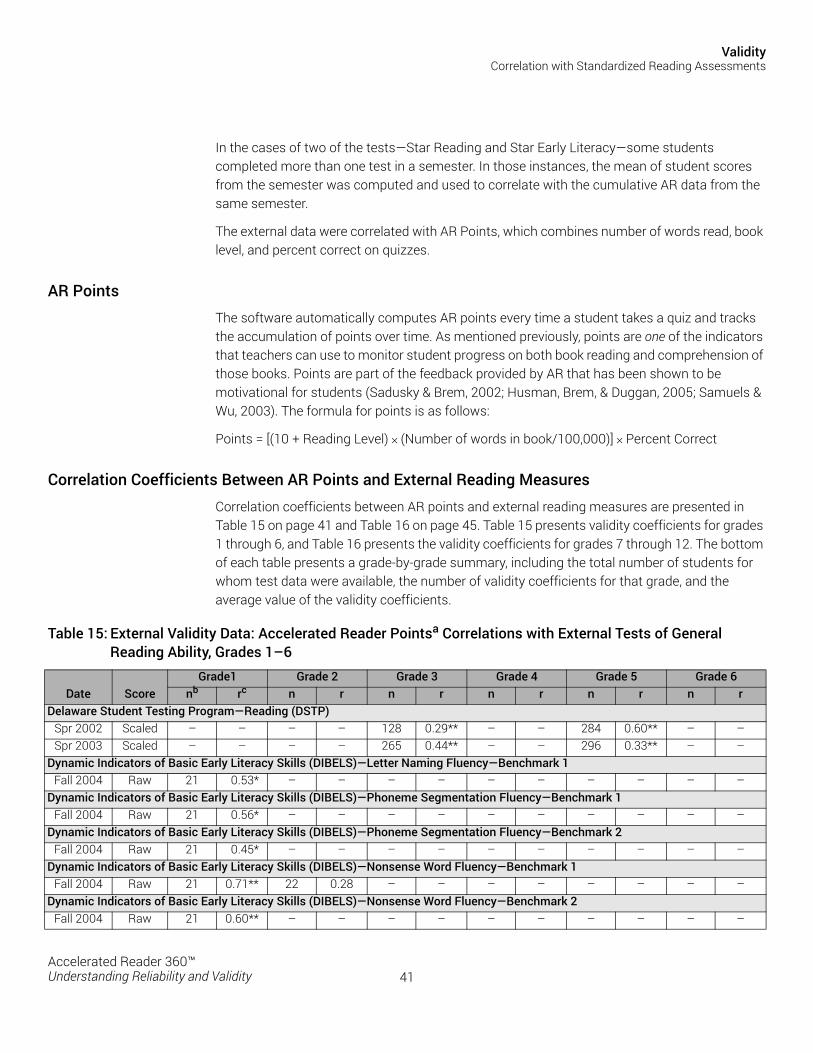
ValidityCorrelation with Standardized Reading Assessments
In the cases of two of the tests—Star Reading and Star Early Literacy—some students completed more than one test in a semester. In those instances, the mean of student scores from the semester was computed and used to correlate with the cumulative AR data from the same semester.
The external data were correlated with AR Points, which combines number of words read, book level, and percent correct on quizzes.
AR PointsThe software automatically computes AR points every time a student takes a quiz and tracks the accumulation of points over time. As mentioned previously, points are one of the indicators that teachers can use to monitor student progress on both book reading and comprehension of those books. Points are part of the feedback provided by AR that has been shown to be motivational for students (Sadusky & Brem, 2002; Husman, Brem, & Duggan, 2005; Samuels & Wu, 2003). The formula for points is as follows:
Points = [(10 + Reading Level) × (Number of words in book/100,000)] × Percent Correct
Correlation Coefficients Between AR Points and External Reading MeasuresCorrelation coefficients between AR points and external reading measures are presented in Table 15 on page 41 and Table 16 on page 45. Table 15 presents validity coefficients for grades 1 through 6, and Table 16 presents the validity coefficients for grades 7 through 12. The bottom of each table presents a grade-by-grade summary, including the total number of students for whom test data were available, the number of validity coefficients for that grade, and the average value of the validity coefficients.
Table 15: External Validity Data: Accelerated Reader Pointsa Correlations with External Tests of General Reading Ability, Grades 1–6
Date ScoreGrade1 Grade 2 Grade 3 Grade 4 Grade 5 Grade 6
nb rc n r n r n r n r n rDelaware Student Testing Program—Reading (DSTP)
Spr 2002 Scaled – – – – 128 0.29** – – 284 0.60** – –Spr 2003 Scaled – – – – 265 0.44** – – 296 0.33** – –
Dynamic Indicators of Basic Early Literacy Skills (DIBELS)—Letter Naming Fluency—Benchmark 1Fall 2004 Raw 21 0.53* – – – – – – – – – –
Dynamic Indicators of Basic Early Literacy Skills (DIBELS)—Phoneme Segmentation Fluency—Benchmark 1Fall 2004 Raw 21 0.56* – – – – – – – – – –
Dynamic Indicators of Basic Early Literacy Skills (DIBELS)—Phoneme Segmentation Fluency—Benchmark 2Fall 2004 Raw 21 0.45* – – – – – – – – – –
Dynamic Indicators of Basic Early Literacy Skills (DIBELS)—Nonsense Word Fluency—Benchmark 1Fall 2004 Raw 21 0.71** 22 0.28 – – – – – – – –
Dynamic Indicators of Basic Early Literacy Skills (DIBELS)—Nonsense Word Fluency—Benchmark 2Fall 2004 Raw 21 0.60** – – – – – – – – – –
41Accelerated Reader 360™Understanding Reliability and Validity
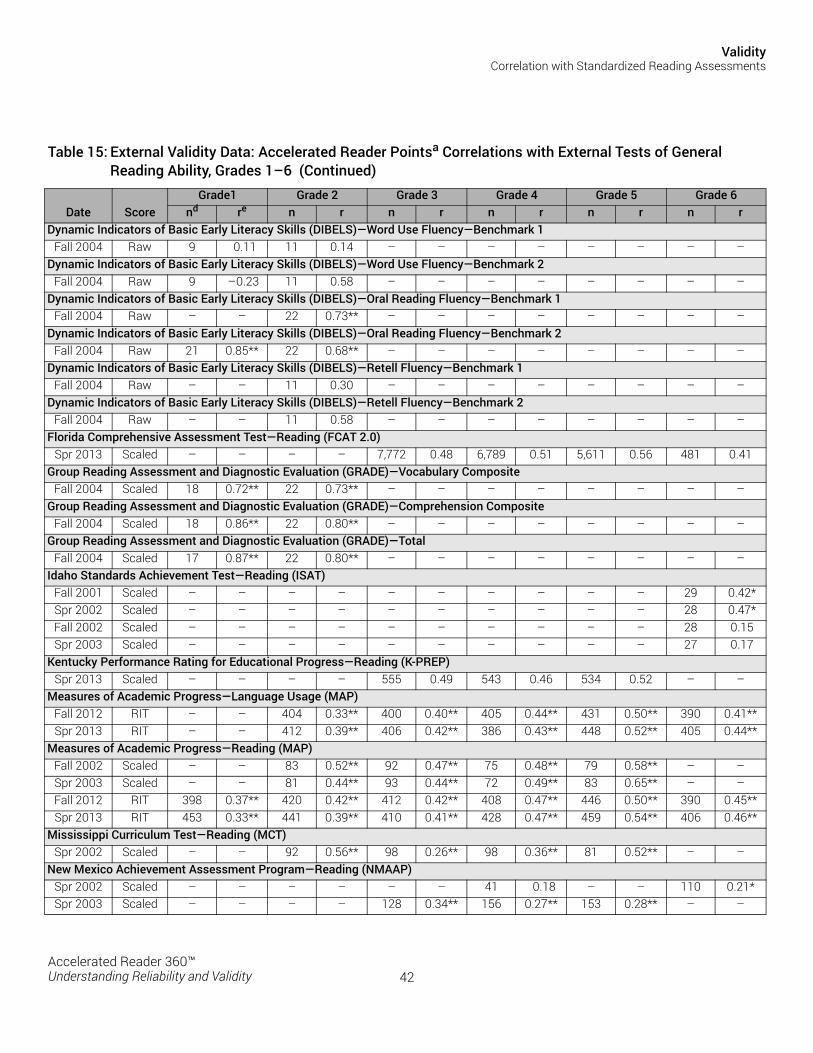
ValidityCorrelation with Standardized Reading Assessments
Date ScoreGrade1 Grade 2 Grade 3 Grade 4 Grade 5 Grade 6
nd re n r n r n r n r n rDynamic Indicators of Basic Early Literacy Skills (DIBELS)—Word Use Fluency—Benchmark 1
Fall 2004 Raw 9 0.11 11 0.14 – – – – – – – –Dynamic Indicators of Basic Early Literacy Skills (DIBELS)—Word Use Fluency—Benchmark 2
Fall 2004 Raw 9 –0.23 11 0.58 – – – – – – – –Dynamic Indicators of Basic Early Literacy Skills (DIBELS)—Oral Reading Fluency—Benchmark 1
Fall 2004 Raw – – 22 0.73** – – – – – – – –Dynamic Indicators of Basic Early Literacy Skills (DIBELS)—Oral Reading Fluency—Benchmark 2
Fall 2004 Raw 21 0.85** 22 0.68** – – – – – – – –Dynamic Indicators of Basic Early Literacy Skills (DIBELS)—Retell Fluency—Benchmark 1
Fall 2004 Raw – – 11 0.30 – – – – – – – –Dynamic Indicators of Basic Early Literacy Skills (DIBELS)—Retell Fluency—Benchmark 2
Fall 2004 Raw – – 11 0.58 – – – – – – – –Florida Comprehensive Assessment Test—Reading (FCAT 2.0)
Spr 2013 Scaled – – – – 7,772 0.48 6,789 0.51 5,611 0.56 481 0.41Group Reading Assessment and Diagnostic Evaluation (GRADE)—Vocabulary Composite
Fall 2004 Scaled 18 0.72** 22 0.73** – – – – – – – –Group Reading Assessment and Diagnostic Evaluation (GRADE)—Comprehension Composite
Fall 2004 Scaled 18 0.86** 22 0.80** – – – – – – – –Group Reading Assessment and Diagnostic Evaluation (GRADE)—Total
Fall 2004 Scaled 17 0.87** 22 0.80** – – – – – – – –Idaho Standards Achievement Test—Reading (ISAT)
Fall 2001 Scaled – – – – – – – – – – 29 0.42*Spr 2002 Scaled – – – – – – – – – – 28 0.47*Fall 2002 Scaled – – – – – – – – – – 28 0.15Spr 2003 Scaled – – – – – – – – – – 27 0.17
Kentucky Performance Rating for Educational Progress—Reading (K-PREP)Spr 2013 Scaled – – – – 555 0.49 543 0.46 534 0.52 – –
Measures of Academic Progress—Language Usage (MAP)Fall 2012 RIT – – 404 0.33** 400 0.40** 405 0.44** 431 0.50** 390 0.41**Spr 2013 RIT – – 412 0.39** 406 0.42** 386 0.43** 448 0.52** 405 0.44**
Measures of Academic Progress—Reading (MAP)Fall 2002 Scaled – – 83 0.52** 92 0.47** 75 0.48** 79 0.58** – –Spr 2003 Scaled – – 81 0.44** 93 0.44** 72 0.49** 83 0.65** – –Fall 2012 RIT 398 0.37** 420 0.42** 412 0.42** 408 0.47** 446 0.50** 390 0.45**Spr 2013 RIT 453 0.33** 441 0.39** 410 0.41** 428 0.47** 459 0.54** 406 0.46**
Mississippi Curriculum Test—Reading (MCT)Spr 2002 Scaled – – 92 0.56** 98 0.26** 98 0.36** 81 0.52** – –
New Mexico Achievement Assessment Program—Reading (NMAAP)Spr 2002 Scaled – – – – – – 41 0.18 – – 110 0.21*Spr 2003 Scaled – – – – 128 0.34** 156 0.27** 153 0.28** – –
Table 15: External Validity Data: Accelerated Reader Pointsa Correlations with External Tests of General Reading Ability, Grades 1–6 (Continued)
42Accelerated Reader 360™Understanding Reliability and Validity
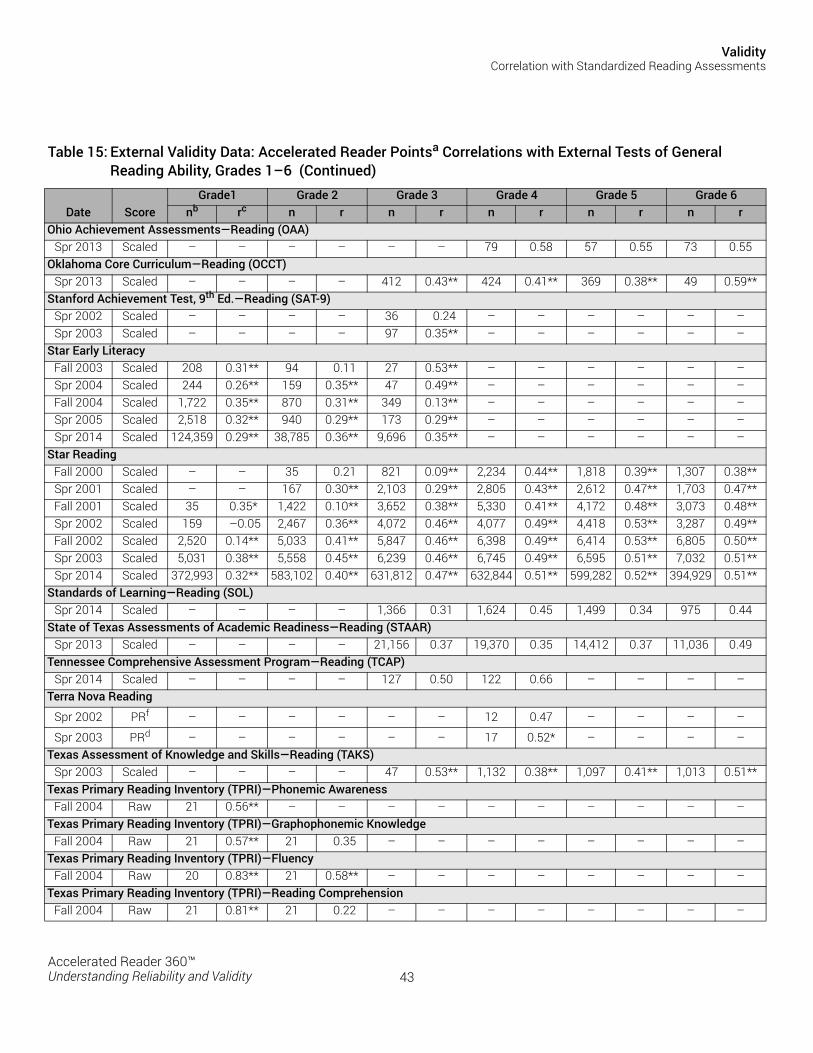
ValidityCorrelation with Standardized Reading Assessments
Date ScoreGrade1 Grade 2 Grade 3 Grade 4 Grade 5 Grade 6
nb rc n r n r n r n r n rOhio Achievement Assessments—Reading (OAA)
Spr 2013 Scaled – – – – – – 79 0.58 57 0.55 73 0.55Oklahoma Core Curriculum—Reading (OCCT)
Spr 2013 Scaled – – – – 412 0.43** 424 0.41** 369 0.38** 49 0.59**Stanford Achievement Test, 9th Ed.—Reading (SAT-9)
Spr 2002 Scaled – – – – 36 0.24 – – – – – –Spr 2003 Scaled – – – – 97 0.35** – – – – – –
Star Early LiteracyFall 2003 Scaled 208 0.31** 94 0.11 27 0.53** – – – – – –Spr 2004 Scaled 244 0.26** 159 0.35** 47 0.49** – – – – – –Fall 2004 Scaled 1,722 0.35** 870 0.31** 349 0.13** – – – – – –Spr 2005 Scaled 2,518 0.32** 940 0.29** 173 0.29** – – – – – –Spr 2014 Scaled 124,359 0.29** 38,785 0.36** 9,696 0.35** – – – – – –
Star ReadingFall 2000 Scaled – – 35 0.21 821 0.09** 2,234 0.44** 1,818 0.39** 1,307 0.38**Spr 2001 Scaled – – 167 0.30** 2,103 0.29** 2,805 0.43** 2,612 0.47** 1,703 0.47**Fall 2001 Scaled 35 0.35* 1,422 0.10** 3,652 0.38** 5,330 0.41** 4,172 0.48** 3,073 0.48**Spr 2002 Scaled 159 –0.05 2,467 0.36** 4,072 0.46** 4,077 0.49** 4,418 0.53** 3,287 0.49**Fall 2002 Scaled 2,520 0.14** 5,033 0.41** 5,847 0.46** 6,398 0.49** 6,414 0.53** 6,805 0.50**Spr 2003 Scaled 5,031 0.38** 5,558 0.45** 6,239 0.46** 6,745 0.49** 6,595 0.51** 7,032 0.51**Spr 2014 Scaled 372,993 0.32** 583,102 0.40** 631,812 0.47** 632,844 0.51** 599,282 0.52** 394,929 0.51**
Standards of Learning—Reading (SOL)Spr 2014 Scaled – – – – 1,366 0.31 1,624 0.45 1,499 0.34 975 0.44
State of Texas Assessments of Academic Readiness—Reading (STAAR)Spr 2013 Scaled – – – – 21,156 0.37 19,370 0.35 14,412 0.37 11,036 0.49
Tennessee Comprehensive Assessment Program—Reading (TCAP)Spr 2014 Scaled – – – – 127 0.50 122 0.66 – – – –
Terra Nova Reading
Spr 2002 PRf – – – – – – 12 0.47 – – – –
Spr 2003 PRd – – – – – – 17 0.52* – – – –Texas Assessment of Knowledge and Skills—Reading (TAKS)
Spr 2003 Scaled – – – – 47 0.53** 1,132 0.38** 1,097 0.41** 1,013 0.51**Texas Primary Reading Inventory (TPRI)—Phonemic Awareness
Fall 2004 Raw 21 0.56** – – – – – – – – – –Texas Primary Reading Inventory (TPRI)—Graphophonemic Knowledge
Fall 2004 Raw 21 0.57** 21 0.35 – – – – – – – –Texas Primary Reading Inventory (TPRI)—Fluency
Fall 2004 Raw 20 0.83** 21 0.58** – – – – – – – –Texas Primary Reading Inventory (TPRI)—Reading Comprehension
Fall 2004 Raw 21 0.81** 21 0.22 – – – – – – – –
Table 15: External Validity Data: Accelerated Reader Pointsa Correlations with External Tests of General Reading Ability, Grades 1–6 (Continued)
43Accelerated Reader 360™Understanding Reliability and Validity
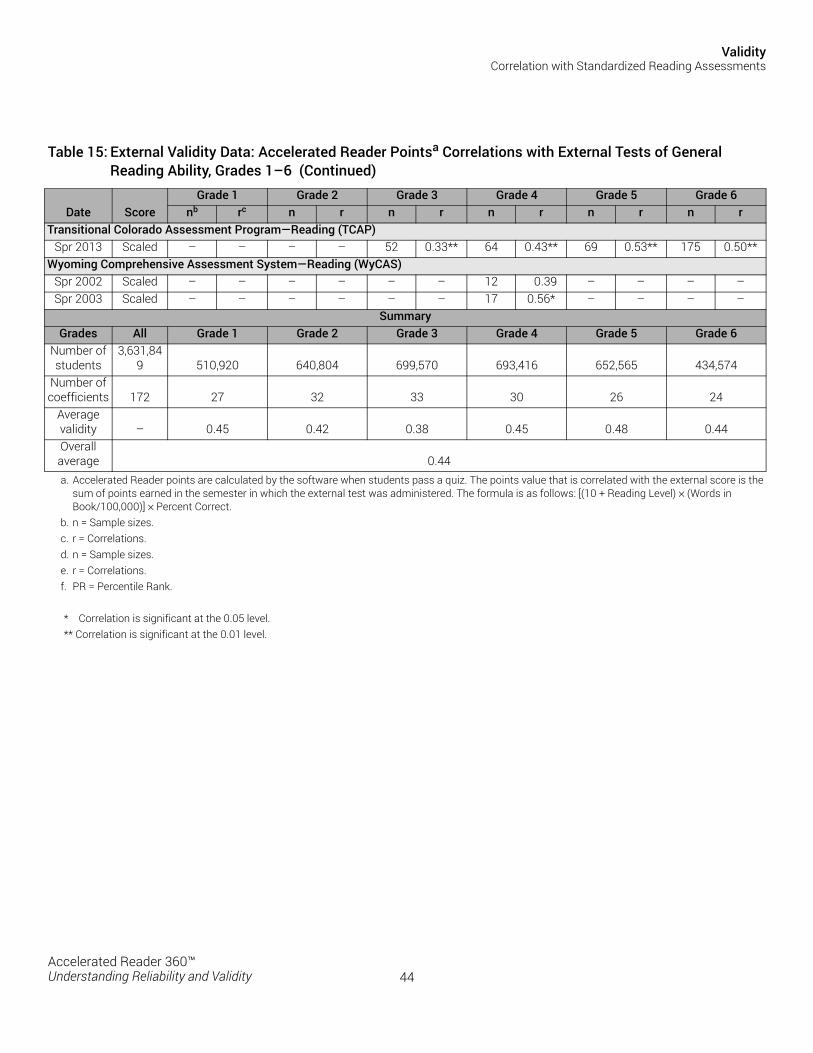
ValidityCorrelation with Standardized Reading Assessments
* Correlation is significant at the 0.05 level.** Correlation is significant at the 0.01 level.
Date ScoreGrade 1 Grade 2 Grade 3 Grade 4 Grade 5 Grade 6
nb rc n r n r n r n r n rTransitional Colorado Assessment Program—Reading (TCAP)
Spr 2013 Scaled – – – – 52 0.33** 64 0.43** 69 0.53** 175 0.50**Wyoming Comprehensive Assessment System—Reading (WyCAS)
Spr 2002 Scaled – – – – – – 12 0.39 – – – –Spr 2003 Scaled – – – – – – 17 0.56* – – – –
SummaryGrades All Grade 1 Grade 2 Grade 3 Grade 4 Grade 5 Grade 6
Number of students
3,631,849 510,920 640,804 699,570 693,416 652,565 434,574
Number of coefficients 172 27 32 33 30 26 24
Average validity – 0.45 0.42 0.38 0.45 0.48 0.44Overall average 0.44a. Accelerated Reader points are calculated by the software when students pass a quiz. The points value that is correlated with the external score is the
sum of points earned in the semester in which the external test was administered. The formula is as follows: [(10 + Reading Level) × (Words in Book/100,000)] × Percent Correct.
b. n = Sample sizes.c. r = Correlations.d. n = Sample sizes.e. r = Correlations.f. PR = Percentile Rank.
Table 15: External Validity Data: Accelerated Reader Pointsa Correlations with External Tests of General Reading Ability, Grades 1–6 (Continued)
44Accelerated Reader 360™Understanding Reliability and Validity
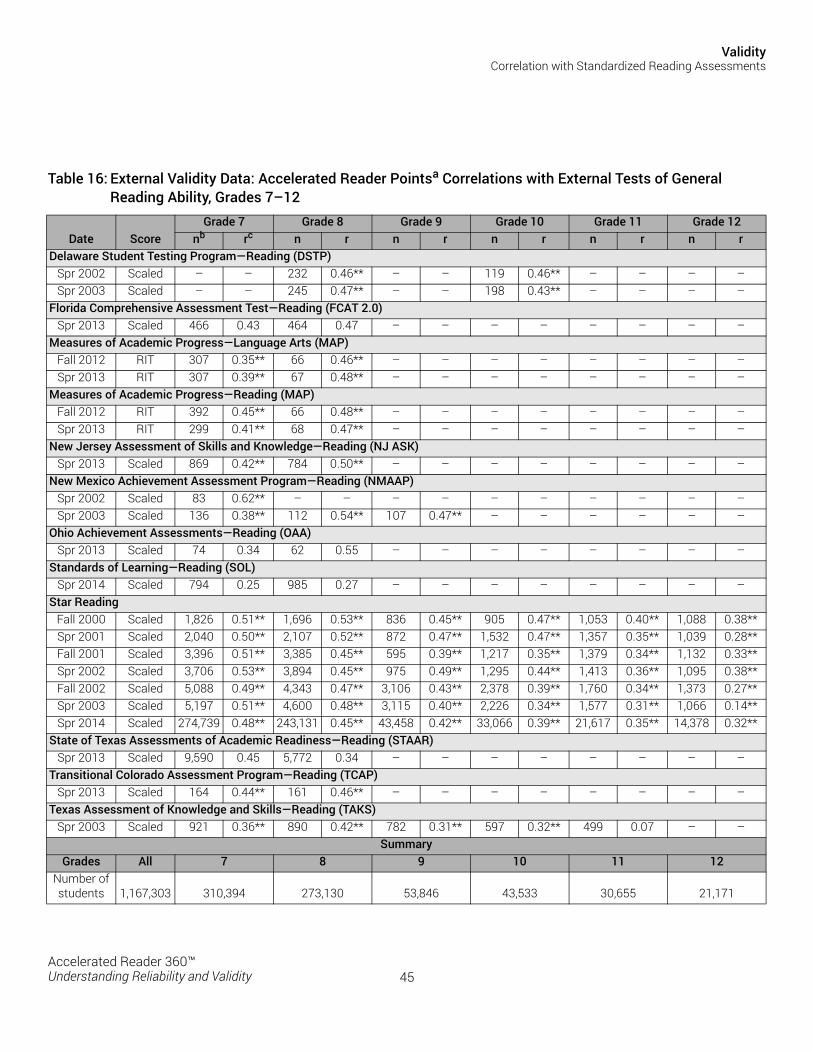
ValidityCorrelation with Standardized Reading Assessments
Table 16: External Validity Data: Accelerated Reader Pointsa Correlations with External Tests of General Reading Ability, Grades 7–12
Date ScoreGrade 7 Grade 8 Grade 9 Grade 10 Grade 11 Grade 12
nb rc n r n r n r n r n rDelaware Student Testing Program—Reading (DSTP)
Spr 2002 Scaled – – 232 0.46** – – 119 0.46** – – – –Spr 2003 Scaled – – 245 0.47** – – 198 0.43** – – – –
Florida Comprehensive Assessment Test—Reading (FCAT 2.0)Spr 2013 Scaled 466 0.43 464 0.47 – – – – – – – –
Measures of Academic Progress—Language Arts (MAP)Fall 2012 RIT 307 0.35** 66 0.46** – – – – – – – –Spr 2013 RIT 307 0.39** 67 0.48** – – – – – – – –
Measures of Academic Progress—Reading (MAP)Fall 2012 RIT 392 0.45** 66 0.48** – – – – – – – –Spr 2013 RIT 299 0.41** 68 0.47** – – – – – – – –
New Jersey Assessment of Skills and Knowledge—Reading (NJ ASK)Spr 2013 Scaled 869 0.42** 784 0.50** – – – – – – – –
New Mexico Achievement Assessment Program—Reading (NMAAP)Spr 2002 Scaled 83 0.62** – – – – – – – – – –Spr 2003 Scaled 136 0.38** 112 0.54** 107 0.47** – – – – – –
Ohio Achievement Assessments—Reading (OAA)Spr 2013 Scaled 74 0.34 62 0.55 – – – – – – – –
Standards of Learning—Reading (SOL)Spr 2014 Scaled 794 0.25 985 0.27 – – – – – – – –
Star ReadingFall 2000 Scaled 1,826 0.51** 1,696 0.53** 836 0.45** 905 0.47** 1,053 0.40** 1,088 0.38**Spr 2001 Scaled 2,040 0.50** 2,107 0.52** 872 0.47** 1,532 0.47** 1,357 0.35** 1,039 0.28**Fall 2001 Scaled 3,396 0.51** 3,385 0.45** 595 0.39** 1,217 0.35** 1,379 0.34** 1,132 0.33**Spr 2002 Scaled 3,706 0.53** 3,894 0.45** 975 0.49** 1,295 0.44** 1,413 0.36** 1,095 0.38**Fall 2002 Scaled 5,088 0.49** 4,343 0.47** 3,106 0.43** 2,378 0.39** 1,760 0.34** 1,373 0.27**Spr 2003 Scaled 5,197 0.51** 4,600 0.48** 3,115 0.40** 2,226 0.34** 1,577 0.31** 1,066 0.14**Spr 2014 Scaled 274,739 0.48** 243,131 0.45** 43,458 0.42** 33,066 0.39** 21,617 0.35** 14,378 0.32**
State of Texas Assessments of Academic Readiness—Reading (STAAR)Spr 2013 Scaled 9,590 0.45 5,772 0.34 – – – – – – – –
Transitional Colorado Assessment Program—Reading (TCAP)Spr 2013 Scaled 164 0.44** 161 0.46** – – – – – – – –
Texas Assessment of Knowledge and Skills—Reading (TAKS)Spr 2003 Scaled 921 0.36** 890 0.42** 782 0.31** 597 0.32** 499 0.07 – –
SummaryGrades All 7 8 9 10 11 12
Number of students 1,167,303 310,394 273,130 53,846 43,533 30,655 21,171
45Accelerated Reader 360™Understanding Reliability and Validity
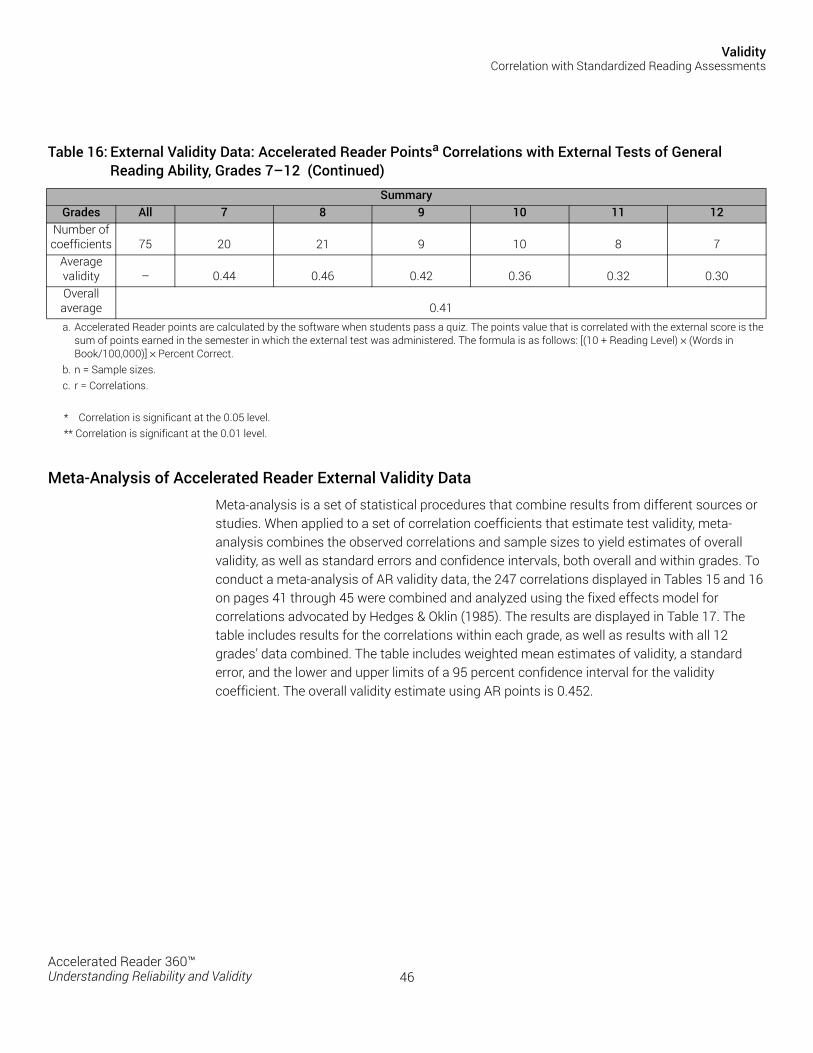
ValidityCorrelation with Standardized Reading Assessments
* Correlation is significant at the 0.05 level.** Correlation is significant at the 0.01 level.
Meta-Analysis of Accelerated Reader External Validity Data Meta-analysis is a set of statistical procedures that combine results from different sources or studies. When applied to a set of correlation coefficients that estimate test validity, meta-analysis combines the observed correlations and sample sizes to yield estimates of overall validity, as well as standard errors and confidence intervals, both overall and within grades. To conduct a meta-analysis of AR validity data, the 247 correlations displayed in Tables 15 and 16 on pages 41 through 45 were combined and analyzed using the fixed effects model for correlations advocated by Hedges & Oklin (1985). The results are displayed in Table 17. The table includes results for the correlations within each grade, as well as results with all 12 grades’ data combined. The table includes weighted mean estimates of validity, a standard error, and the lower and upper limits of a 95 percent confidence interval for the validity coefficient. The overall validity estimate using AR points is 0.452.
SummaryGrades All 7 8 9 10 11 12
Number of coefficients 75 20 21 9 10 8 7
Average validity – 0.44 0.46 0.42 0.36 0.32 0.30Overall average 0.41a. Accelerated Reader points are calculated by the software when students pass a quiz. The points value that is correlated with the external score is the
sum of points earned in the semester in which the external test was administered. The formula is as follows: [(10 + Reading Level) × (Words in Book/100,000)] × Percent Correct.
b. n = Sample sizes.c. r = Correlations.
Table 16: External Validity Data: Accelerated Reader Pointsa Correlations with External Tests of General Reading Ability, Grades 7–12 (Continued)
46Accelerated Reader 360™Understanding Reliability and Validity
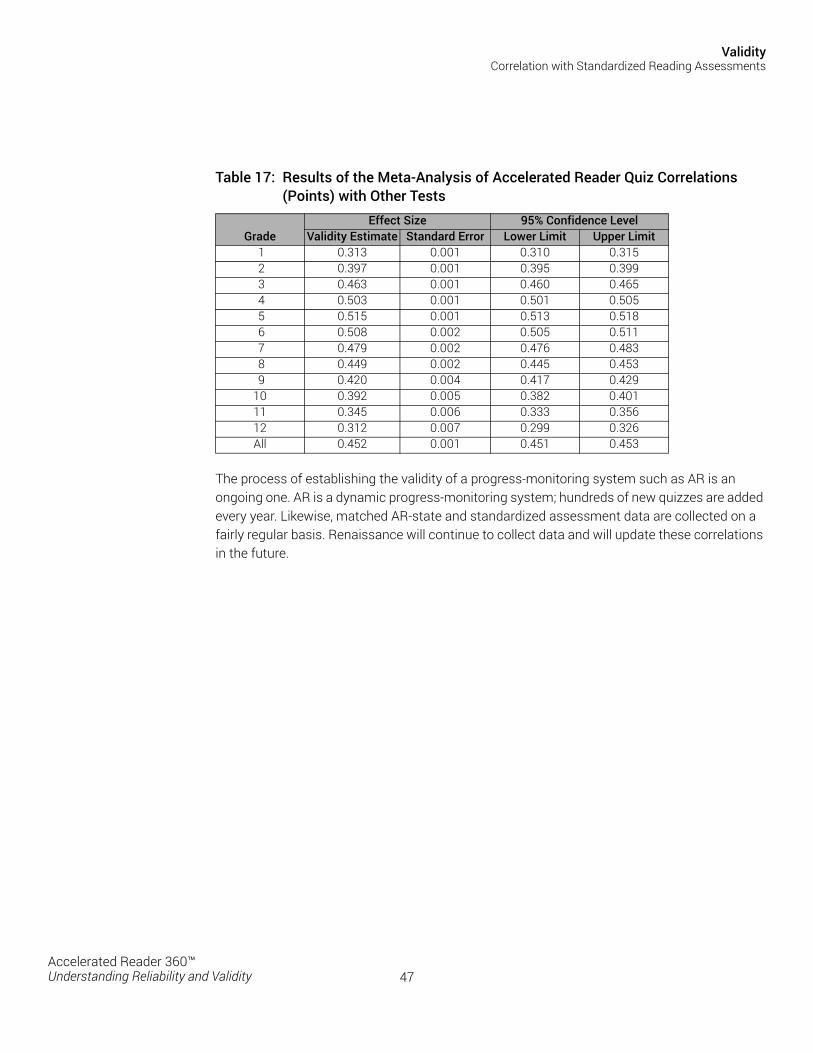
ValidityCorrelation with Standardized Reading Assessments
The process of establishing the validity of a progress-monitoring system such as AR is an ongoing one. AR is a dynamic progress-monitoring system; hundreds of new quizzes are added every year. Likewise, matched AR-state and standardized assessment data are collected on a fairly regular basis. Renaissance will continue to collect data and will update these correlations in the future.
Table 17: Results of the Meta-Analysis of Accelerated Reader Quiz Correlations (Points) with Other Tests
GradeEffect Size 95% Confidence Level
Validity Estimate Standard Error Lower Limit Upper Limit 1 0.313 0.001 0.310 0.315 2 0.397 0.001 0.395 0.399 3 0.463 0.001 0.460 0.465 4 0.503 0.001 0.501 0.505 5 0.515 0.001 0.513 0.518 6 0.508 0.002 0.505 0.511 7 0.479 0.002 0.476 0.483 8 0.449 0.002 0.445 0.453 9 0.420 0.004 0.417 0.42910 0.392 0.005 0.382 0.40111 0.345 0.006 0.333 0.35612 0.312 0.007 0.299 0.326All 0.452 0.001 0.451 0.453
47Accelerated Reader 360™Understanding Reliability and Validity
References
Allington, R. L. (2001). What really matters for struggling readers: Designing research-based programs. New York: Longman.
Allington, R. L. (1984). Content coverage and contextual reading in reading groups. Journal of Reading Behavior, 16, 85–96.
Anderson, R. C. (1996). Research foundations to support wide reading. Champaign: University of Illinois at Urbana–Champaign, Center for the Study of Reading. Tech. Rep. No. 631.
Anderson, R. C., Hiebert, E. H., Scott, J. A., & Wilkinson, I. A. G. (1985). Becoming a nation of readers: The report on the Commission of Reading. Washington, DC: The National Institute of Education.
Berliner, D. C. (1990). What’s all the fuss about instructional time? In M. Ben-Peretz & R. Bromme (Eds.), The nature of time in schools (pp. 3–35). New York: Teachers College Press.
Betts, E. A. (1946). Foundations of reading instruction, with emphasis on differentiated guidance. New York: American Book Co.
Black, P., & Wiliam, D. (1998). Assessment and classroom learning. Assessment in Education: Principles, Policy, & Practice, 5(1), 7–74.
Borman, G. & Dowling, M. (2004). Testing the Reading Renaissance Program Theory: A Multilevel Analysis of Student and Classroom Effects on Reading Achievement. Unpublished manuscript, University of Wisconsin–Madison. Available online: http://doc.renlearn.com/KMNet/R00405242EE3BD7A.pdf
Bormuth, J. R. (1968). Cloze test readability: Criterion Reference Scores. Journal of Educational Measurement, 5(3), 189–196.
Brozo, W. G., Shiel, G., & Topping, K. (2007/2008). Engagement in reading: Lessons learned from three PISA countries. Journal of Adolescent & Adult Literacy, 51(4), 304–315.
Carver, R. P. (1990). Reading rate: A review of research and theory. New York: Academic Press.
Fisher, C. W., Berliner, D. C., Fully, N. N., Marliave, R. S., Cahen, L. S., & Dishaw, M. M. (1980). Teaching behaviors, academic learning time and student achievement: An overview. In C. Denham & A. Lieberman (Eds.), Time to learn (pp. 7–32). Washington, DC: National Institute of Education.
Frary, R. B. (1995). More multiple-choice item writing do’s and don’ts. Practical Assessment, Research & Evaluation, 4(11). Available online: http://PAREonline.net/getvn.asp?v=4&n=11
Gambrell, L. B. (2007). Reading: Does practice make perfect? Reading Today, 24(6), 16.
Gickling, E. E., & Havertape, S. (1981). Curriculum-based assessment (CBA). Minneapolis, MN: School Psychology Inservice Training Network.
Gickling, E. E., & Thompson, V. E. (2001). Putting the learning needs of children first. In B. Sornson (Ed.). Preventing early learning failure. Alexandria, VA: ASCD.
Harris, A. J., & Sipay, E. R. (1990). How to increase reading ability (9th ed.). New York: Longman.
48Accelerated Reader 360™Understanding Reliability and Validity
References
Hedges, L. V., & Olkin, I. (1985). Statistical methods for meta-analysis. Orlando, FL: Academic Press.
Holmes, C. T., & Brown, C. L. (2003). A controlled evaluation of a total school improvement process, School Renaissance (Technical report). Athens: University of Georgia. ERIC No. ED474261. Available online: http://files.eric.ed.gov/fulltext/ED474261.pdf
Holmes, C. T., Brown, C. L., & Algozzine, B. (2006). Promoting academic success for all students. Academic Exchange Quarterly, 10(3), 141–147.
Husman, J., Brem, S., & Duggan, M. A. (2005). Student goal orientation and formative assessment. Academic Exchange Quarterly, 9(3), 355–359. Available online: http://www.rapidintellect.com/AEQweb/5oct3047l5.htm
Institute for Academic Excellence (now known as Renaissance). (1999). The teachers’ Reading Renaissance survey. Madison, WI: Institute for Academic Excellence.
Johnson, M. S., Kress, R. A., & Pikulski, J. J. (1987). Informal reading inventories. Newark, DE: International Reading Association.
Lord, F., & Novick, M. (1968). Statistical theories of mental test scores. Reading, MA: Addison–Wesley.
Marliave, R., & Filby, N. N. (1985). Success rate: A measure of task appropriateness. In C. W. Fisher & D. Berliner (Eds.), Perspectives on instructional time. White Plains, NY: Longman.
McCormick, S. (1999). Instructing students who have literacy problems. 3rd ed. Englewood Cliffs, NJ: Prentice-Hall.
Milone, M. (2014). Development of the ATOS Reliability Formula. Wisconsin Rapids, WI: Renaissance Learning. Retrieved from http://doc.renlearn.com/KMNet/R004250827GJ11C4.pdf
National Endowment for the Arts. (2007). To read or not to read: A question of national consequence (Research Report #47). Washington, DC: Author. Available online: http://arts.gov/sites/default/files/ToRead.pdf
National Institute of Child Health and Human Development. (2000).Teaching children to read: An Evidence-Based assessment of the scientific research literature on reading and its implications for reading instruction: Reports of the subgroups. Report of the National Reading Panel. Washington, DC: U.S. Government Printing Office. NIH Publication no. 00-4754. Available online: http://www.nichd.nih.gov/publications/nrp/report.cfm
Nunnery, J. A. & Ross, S. M. (2007). The effects of the School Renaissance program on student achievement in reading and mathematics. Research in the Schools, 14(1), 40–59.
Nunnery, J. A., Ross, S. M., & Goldfedder, E. (2003). The effect of School Renaissance on TAAS scores in the McKinney ISD. Memphis, TN: University of Memphis, Center for Research in Educational Policy.
Nunnery, J. A., Ross, S. M., & McDonald A. (2006). A randomized experimental evaluation of the impact of Accelerated Reader/Reading Renaissance implementation on reading achievement in grades 3 to 6. Journal of Education for Students Placed at Risk, 11(1), 1–18.
49Accelerated Reader 360™Understanding Reliability and Validity
References
Paul, T. D. (1996). Improving reading growth through the application of Vygotskian principles and advanced computer technology to literature-based reading programs. Paper presented at the International School Psychology Colloquium, University of Dundee, Scotland.
Paul, T. D. (1992). 1992 National reading study and theory of reading practice. Madison, WI: The Institute for Academic Excellence.
Popham, J. (1999). Why standardized tests don’t measure educational quality. Educational Leadership, 56(6), 8–15.
Renaissance Learning. (2011). The design of Accelerated Reader assessments. Madison, WI: Author. Available online: http://doc.renlearn.com/KMNet/R001184509GD7209.pdf
Renaissance Learning. (2012a). Guided Independent Reading. Madison, WI: Author. Available online: http://doc.renlearn.com/KMNet/R005577721AC3667.pdf
Renaissance Learning. (2012b). The research foundation for Accelerated Reader goal-setting practices. Madison, WI: Renaissance Learning, Inc. Available online: http://doc.renlearn.com/KMNet/R001438603GC81D6.pdf
Renaissance Learning. (2014). Getting results with Accelerated Reader. Wisconsin Rapids, WI: Author.
Roe, B. D. & Burns, P. C. (2007). Informal reading inventory: Preprimer to twelfth grade. 7th ed. Boston: Houghton Mifflin Company.
Rosenshine, B., & Stevens, R. (1984). Classroom instruction in reading. In P. D. Pearson (Ed.), Handbook of reading research (pp. 745–798). New York: Longman.
Sadusky, L. A., & Brem, S. K. (2002). The integration of Renaissance programs into an urban title I elementary school, and its effect on school-wide improvement (Technical report). Tempe: Arizona State University. Available online: http://doc.renlearn.com/KMNet/R004078401GK149B.pdf
Samuels, S. J., & Wu, Y. (2003). The effects of immediate feedback on reading achievement. Unpublished manuscript, University of Minnesota, Minneapolis. Available online: http://www.tc.umn.edu/~samue001/web%20pdf/immediate_feedback.pdf
Shannon, L. C., Styers, M. K., Wilkerson, S. B., & Peery, E. (2015). Computer-assisted learning in elementary reading: A randomized control trial. Computers in the Schools, 32(1), 20-34.
Snow, W. M. (1993). The effects of repetitive assessments on academic achievement and pupil self-esteem. ERIC No. ED 362565. Available online: http://files.eric.ed.gov/fulltext/ED362565.pdf
Snow, C. E., Burns, M. S., & Griffin, P. (Eds.). (1998). Preventing reading difficulties in young children. Washington, DC: National Academy Press.
Stiggins, R. J. (2005). Student-involved classroom assessment for learning (4th ed.). Upper Saddle River, New Jersey: Pearson/Merrill Prentice Hall.
Topping, K. J., Samuels, J., & Paul, T. (2007). Does practice make perfect? Independent reading quantity, quality and student achievement. Learning and Instruction, 17, 253–264.
50Accelerated Reader 360™Understanding Reliability and Validity
References
Topping, K. J., & Sanders, W. L. (2000). Teacher effectiveness and computer assessment of reading: Relating value-added and learning information systems data. School Effectiveness and School Improvement, 11(3), 305–337.
Vollands, S. R., Topping, K. J., & Evans, H. M. (1999). Computerized self-assessment of reading comprehension with the Accelerated Reader: Action Research. Reading and Writing Quarterly, 15(3), 197–211.
Vygotsky, L. S. (1978). Mind in society: The development of higher psychological processes. Cambridge, MA: Harvard University Press.
51Accelerated Reader 360™Understanding Reliability and Validity
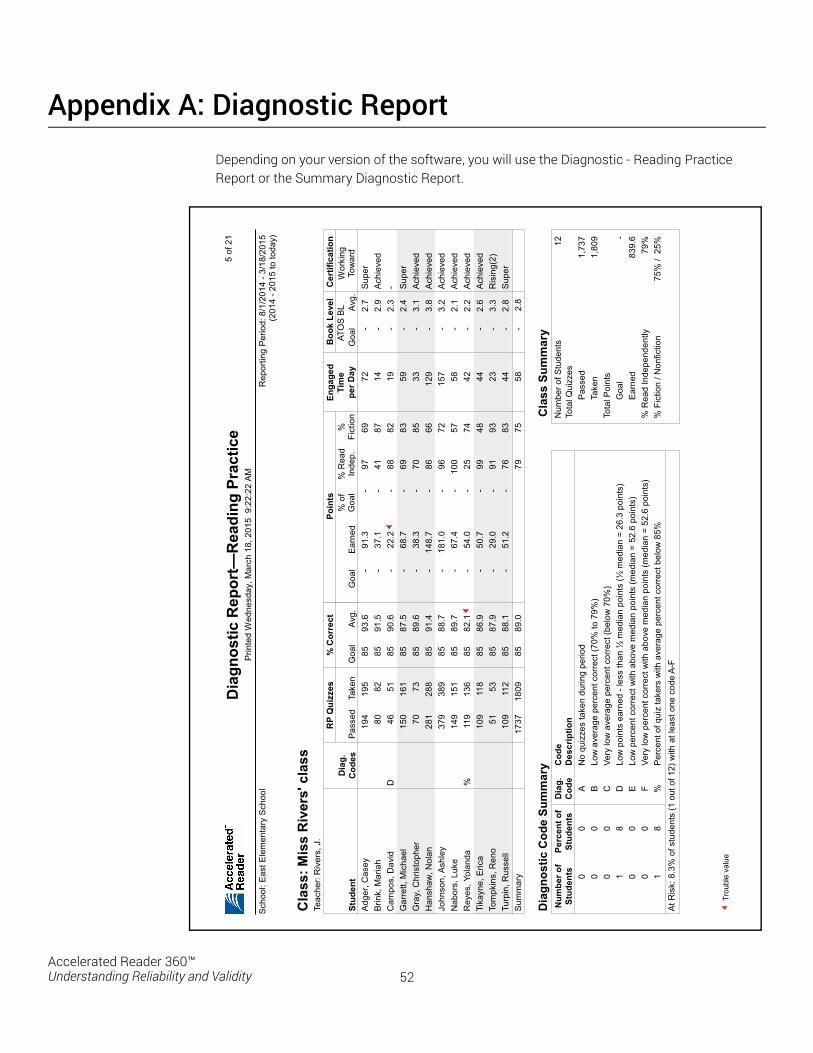
Appendix A: Diagnostic Report
Depending on your version of the software, you will use the Diagnostic - Reading Practice Report or the Summary Diagnostic Report.
����
�����
����� ��
����������
��������
��
���������� ����� ����������
�����
���
��������������������
!"
������
��#���
!�
�������
�� $
%����
&�'���'
&�(��
��� %����
&
��������������� ��������
)�����
����*����+,
����� �
��� �
� �����
��� �
�*�,
�*�,
-��
&������
)�.��
-��
&-��
&'����
�/
0������
�����
��� �
��.���
)�1���
��� ��!! �
"�����
/��
-��
&/���
�2���
�,
� ��#�����
�����
�)3%45
$��%�& � �
6���
���
���7
���
8�
�6
!%9�
��!
�,6
�",8
���
��
�
�,"
!�
��
4���
.�������
�6
�
!�����*��
!�
,���,�
��
��
"
6,�
!��
:��
7�(
����:�*��
��
��
!!
!�
,"��,8
��
8
��
�,�
!��
��
-������������
�&�"
8�
!%9�
��!
�,
�6,�
�8�
���
8
�,6
!""
��
-�� �7��������
����
6�
!�����*��
!"
,���,8
6"
6�
"
�,"
!��
���
;��
���1
�<�&��
88
�8
!�����*��
!"
,���,
���
���
� �
,6!
��6
��
+���
�������&�
6�
�8
!�����*��
!"
,���,6
"��
"6�
���
,�!
����
<�=
����59.�
�6
���
!�����*��
!�
,���,6
���
� �
8
6,
! �
/��
�� ���>
�&��
��6
��
!�����*��
!�
,���,�
�"8
���
��
,�
!
��
)�.� ���'����
�
��
!�����*��
!�
,8�8,�
���
���
�
�,6
!�"
��
)�(�.�������
��"
��
!������#�$
!"
,"�6,�
�"
��
�
�,�
!
��
)9������
9���&&
�"
68
!%9�
��!
�,�
��,�
���
���
�
�,�
!�6"
6���
�!
�,�
%9(
(��
6�
��
��,�
6�
��
�������������
���
��.��,"/����9��
���#��9����
�$1�����&��
�����
���
��!0
�������������� ��������
'��( ���#�
��� ��
� � ���#�
��� ��
�����
���
� 4 7 : ' 0 /
� ������
?�� &�1�*�����
��������������#=
�&�1
6�/
$
���������@
9�A��.���1����*�����
��������������=�&�1
��/
5�1�*�����
��������������#6
�/��
6�/
$
5�1��������
����
!&�����
��B
(��
�����
����#B
(��
���C�8
,"������$
?�� &�1��������������1����=�
*�(
�������
����#(
�����C��
,8������$
<�@9
�AA����.���9
������
����
5�1��������������1����=�
*�(
�������
����#(
�����C��
,8������$
���
� �������
� � � � � � �
�����
��6"6
<9(
=���
�%�9��
���
)���&D
9�AA��
������
)�.��
)���&�
�����
'����
�-��
&�"�
,8!
6�/
���/
/0�������<
���������
/���
�2���
����
���&
6�/
)��9=&�*�&9�
�
52Accelerated Reader 360™Understanding Reliability and Validity
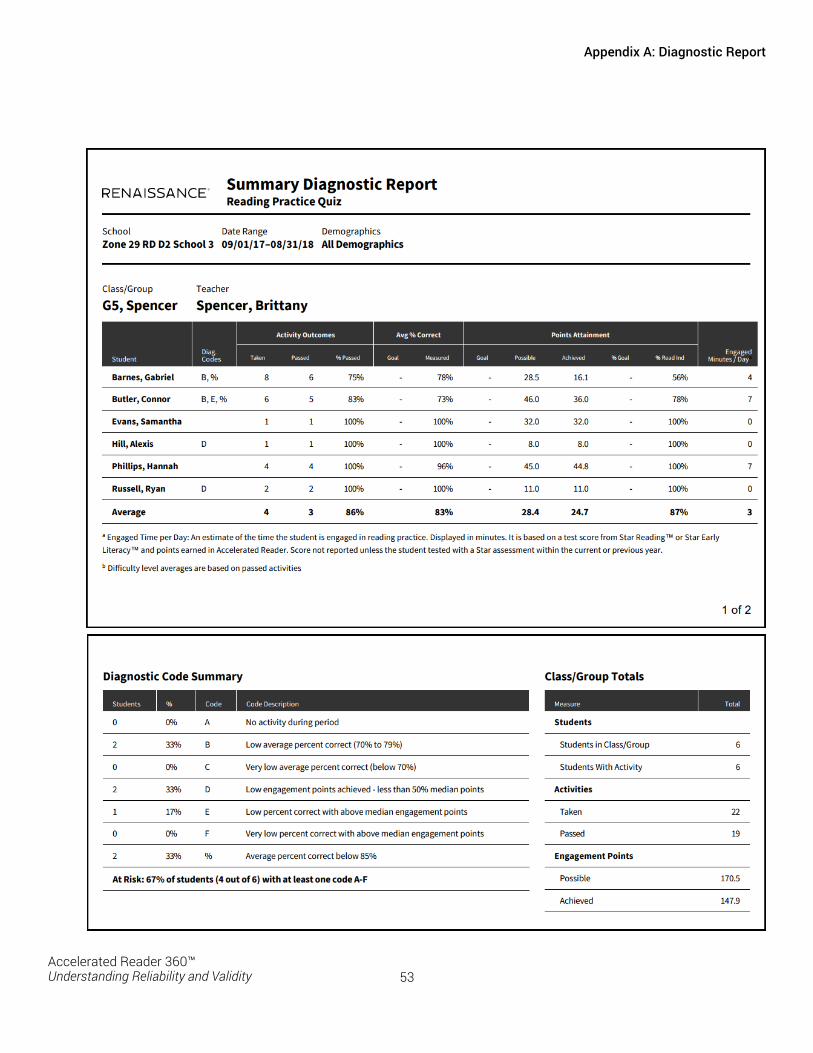
Appendix A: Diagnostic Report
53Accelerated Reader 360™Understanding Reliability and Validity
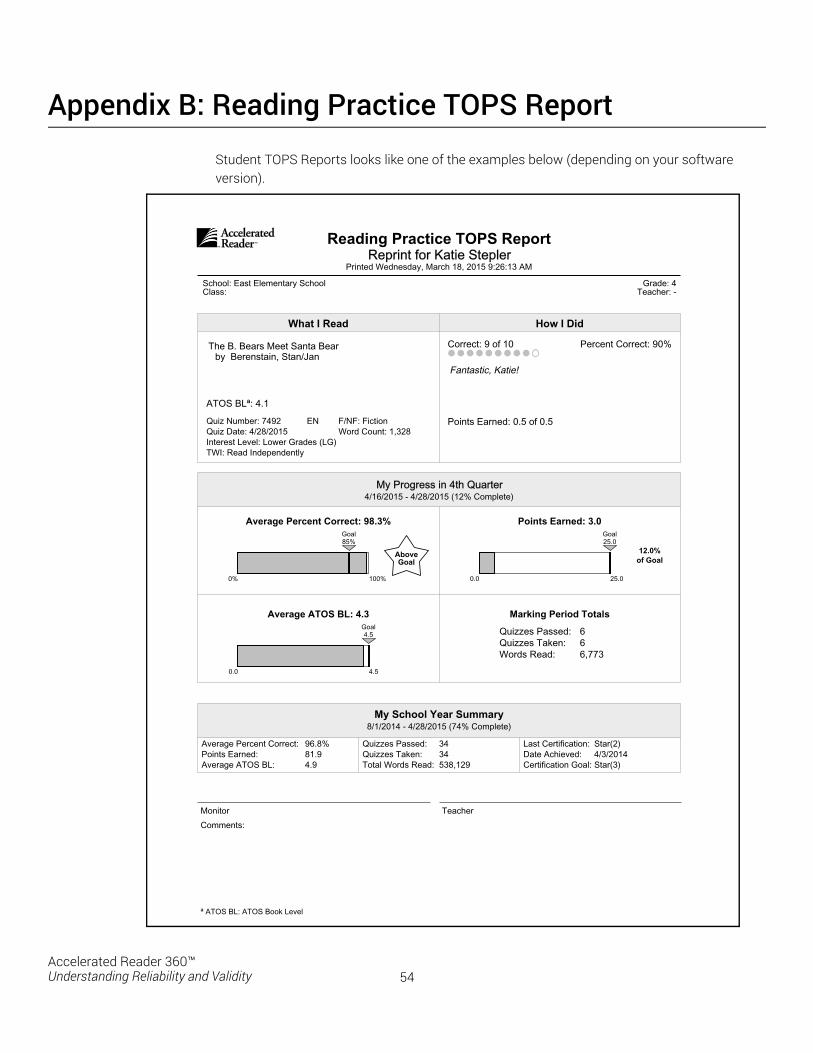
Appendix B: Reading Practice TOPS Report
Student TOPS Reports looks like one of the examples below (depending on your software version).
Reading Practice TOPS ReportReprint for Katie Stepler
Printed Wednesday, March 18, 2015 9:26:13 AM
School: East Elementary SchoolClass:
Grade: 4Teacher: -
What I Read How I Did
The B. Bears Meet Santa Bearby Berenstain, Stan/Jan
ATOS BLª: 4.1
Quiz Number: 7492 EN F/NF: Fiction
Quiz Date: 4/28/2015 Word Count: 1,328
Interest Level: Lower Grades (LG)
TWI: Read Independently
Correct: 9 of 10 Percent Correct: 90%
Fantastic, Katie!
Points Earned: 0.5 of 0.5
My Progress in 4th Quarter4/16/2015 - 4/28/2015 (12% Complete)
Average Percent Correct: 98.3% Points Earned: 3.0
Average ATOS BL: 4.3 Marking Period Totals
12.0%of Goal
0% 100%
Goal
85%
0.0 25.0
Goal
25.0
0.0 4.5
Goal
4.5 Quizzes Passed: 6
Quizzes Taken: 6
Words Read: 6,773
My School Year Summary8/1/2014 - 4/28/2015 (74% Complete)
Average Percent Correct: 96.8% Quizzes Passed: 34 Last Certification: Star(2)
Points Earned: 81.9 Quizzes Taken: 34 Date Achieved: 4/3/2014
Average ATOS BL: 4.9 Total Words Read: 538,129 Certification Goal: Star(3)
Monitor Teacher
Comments:
ª ATOS BL: ATOS Book Level
54Accelerated Reader 360™Understanding Reliability and Validity
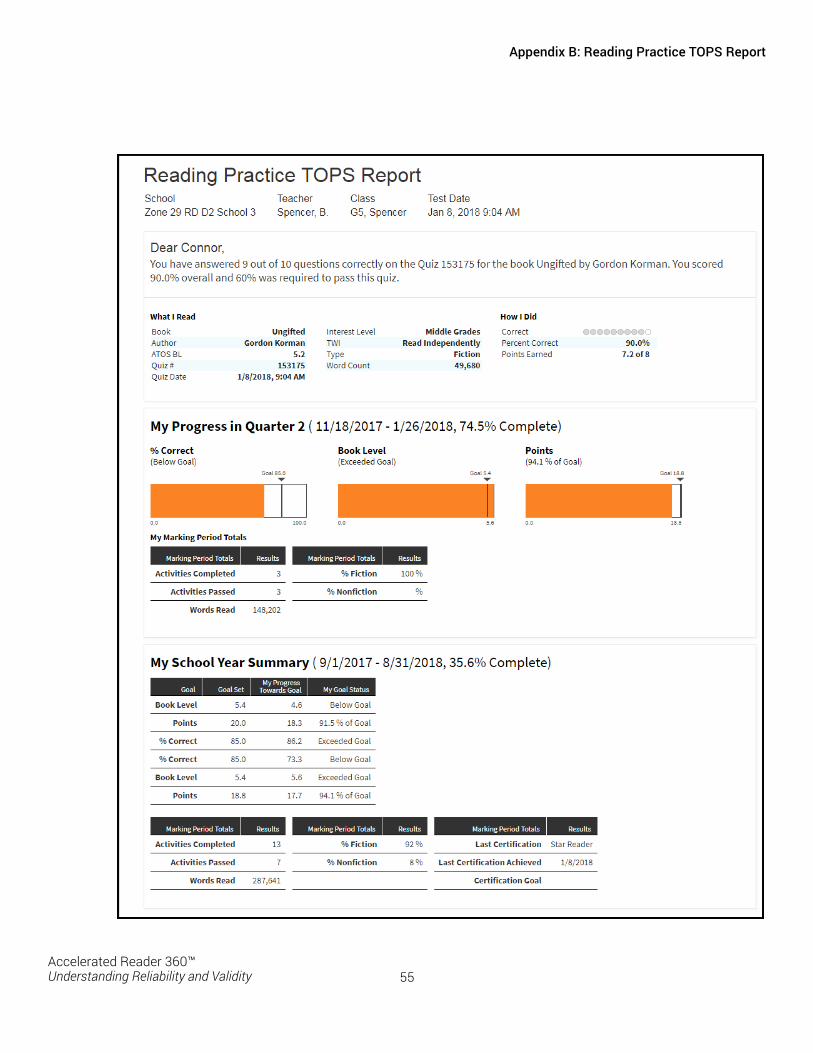
Appendix B: Reading Practice TOPS Report
55Accelerated Reader 360™Understanding Reliability and Validity
Index
Numerics2nd try and review words quiz, 21
AAcademic learning time, reading, 11Accelerated Reader catalog, 8AR best practices, 2, 23AR BookFinder, 17AR point formula, 12ATOS (Readability Formula for Books), 8Automaticity, 11Average grade level of words in a book, 9Average percent correct on quizzes, 17, 26Average readability level (ARL), 21
BBasal reading series, 15, 20Best practices, 23Book
genre, 33length, 9, 33level, 6, 15, 16readability, 10selection, 17
CChallenge level (book level), 6Cheating, 23Composite reliability coefficients, 32Comprehension, 12, 14, 16
strategies, 16Cronbach’s alpha, 27
DData-based decision making, 17Development of AR Quizzes, 22Devoting time for reading, 15Diagnostic Report, 7, 15DIBELS (Dynamic Indicators of Basic Early Literacy Skills), 40
EEffectiveness of Accelerated Reader, 2Emergent readers, 19Engaged reading time, 13English-language learner, 16Evidence-based instruction, 14External test correlations, 40External validity, 39
FFiction books, 26
GGenre of book, 33Getting Results with Accelerated Reader, 2Goals
Point, 11, 12setting, 6Time, 11
Goal-Setting Chart, 7, 9, 16, 17GRADE (Group Reading Assessment and Diagnostic Evaluation),
40Grade Equivalent (GE) score, 10, 34
HHigh averages on AR quizzes, 16Higher-order reading comprehension skills, 20High-interest/low-readability books, 9
IIndependent reading, 19Independent reading practice, 7Inferential reasoning, 20Instructional Reading Level (IRL), 34Interest levels, 10Intervention, 14Item-bank for Literacy Skills Quizzes, 20Item-bank technology, 24
56Accelerated Reader 360™Understanding Reliability and Validity
Index
LLearning time, academic, 11Length of book, 33Level of challenge (book level), 6Literacy Skills Quizzes, 20, 24Literal understanding, 19Low-readability/high-interest books, 9Low-stakes formative assessment, 22
MMarking period, 7, 28Measures of Academic Progress (MAP), 40Meta-analysis, 46Monitoring student progress, 14Multiple-choice, 22
NNonfiction books, 9, 26Number of characters per word, 9
OOther Reading Quizzes, 20
PPass rate on books not read, 36Pass rate on books read, 36Passing rate, 33Percent correct on quizzes, 8, 15, 40Performance on quizzes, 28, 33Point
formula, 12goals, 11, 12
Points, 6, 11, 15, 41Predicted reliability, 30Preliterate readers, 19Probabilities of passing an AR book quiz by chance, 35Progress-monitoring, 14, 17, 47
QQuality of reading practice, 6Quantity of reading practice, 6Quiz length, 27
Quizzesdevelopment of, 22Literacy Skills, 20Other Reading, 20percent correct on Reading Practice, 8Reading Practice, 19Recorded Voice, 2, 19retaking, 24Spanish, 2, 19standardization of, 22Vocabulary Practice, 20
RReadability level (ATOS), 8Readability, book, 10Reading
ability, measuring, 11achievement, 14achievement, gains in, 8achievement, improving, 11level, 33range, 16rate, 12speeds, 12
Reading assessments, state or standardized, 39Reading Practice Goals, 14Reading Practice Quizzes, 8, 19Recorded Voice Quizzes, 2, 19Reliability, 25Reliability coefficients, 26, 29Report
class and student level, 15Diagnostic, 7, 15TOPS, 15
Response to Intervention (RTI), 14, 17Retaking quizzes, 24Rubrics, standardized, 9
SScores, Grade Equivalent (GE), 10, 11Screening, 14Spanish quizzes, 2, 19Spearman–Brown formula, 29Standardized
quizzes, 22reading assessments, 39rubrics, 9test, 9, 20
57Accelerated Reader 360™Understanding Reliability and Validity
Index
Stanford Achievement Test (SAT-9), 40Star Early Literacy, 40Star Reading, 11, 34, 40
assessment, 11performance data, 6
State reading assessments, 39Status of the Class, 16, 23Student
performance on quizzes, 33progress toward goals, 7
Suggested reading ranges, 9
TTargeted intervention, 14Time Goals, 11TOPS Report, 15TPRI (Texas Primary Reading Inventory), 40
VValidity, 33
study, 33Vocabulary Practice Quizzes, 20
WWord count, 35Words per sentence, 9Words read, 40
ZZPD (Zone of Proximal Development), 8, 16, 24
ranges, 10, 11
58Accelerated Reader 360™Understanding Reliability and Validity
About Renaissance
Renaissance® transforms data about how students learn into instruments of empowerment for classroom teachers, enabling them to guide all students to achieve their full potentials. Through smart, data-driven educational technology solutions that amplify teachers’ effectiveness, Renaissance helps teachers teach better, students learn better, and school administrators lead better. By supporting teachers in the classroom but not supplanting them, Renaissance solutions deliver tight learning feedback loops: between teachers and students, between assessment of skills mastery and the resources to spur progress, and between each student’s current skills and future academic growth.
10Jan2018
© Copyright 2018 Renaissance Learning, Inc. All rights reserved. (800) 338-4204 www.renaissance.com
All logos, designs, and brand names for Renaissance’s products and services, including but not limited to Accelerated Reader, Star Early Literacy, Star Reading, and Renaissance, are trademarks of Renaissance Learning, Inc., and its subsidiaries, registered, common law, or pending registration in the United States.
Fremont | London | Madison | Minneapolis | New York | Sydney | Toronto | Vancouver | Wisconsin Rapids