a statistical analysis for pattern recognition of small ... · a statistical analysis for pattern...
TRANSCRIPT
A statistical analysis for pattern recognition of small cloud particlessampled with a PMS-2DC probe
A. Fouilloux1, J. Iaquinta2, C. Duroure1, F. Albers3
1 LAMP, 24 avenue des Landais, F-63177 AubieÁ re Cedex, France2 Currently on leave from LAMP3GKSS Research Center, Max-Planck Strasse, D-21502 Geesthacht, Germany
Received: 31 May 1996 /Revised: 2 December 1996 /Accepted: 20 January 1997
Abstract. Although small particles (size between 25 lmand 200 lm) are frequently observed within ice andwater clouds, they are not generally used properly forthe calculation of structural, optical and microphysicalquantities. Actually neither the exact shape nor thephase (ice or water) of these particles is well de®nedsince the existing pattern recognition algorithms areonly e�cient for larger particle sizes. The present studydescribes a statistical analysis concerning small hexag-onal columns and spherical particles sampled with aPMS-2DC probe, and the corresponding images areclassi®ed according to the occurrence probability ofvarious pixels arrangements. This approach was ®rstapplied to synthetic data generated with a numericalmodel, including the e�ects of di�raction at a shortdistance, and then validated against actual data setsobtained from in-cloud ¯ights during the pre-ICE'89campaign. Our method allows us to di�erentiate smallhexagonal columns from spherical particles, thus mak-ing possible the characterization of the three dimen-sional shape (and consequently evaluation of thevolume) of the particles, and ®nally to compute e.g.,the liquid or the ice water content.
1 Introduction
Size spectra obtained from in situ measurements withinclouds (Liou, 1992; Kinne and Liou, 1989) show that thenumber of small particles (size ranging from 25 lm to200 lm) is very large, and that it is important for thedetermination of structural, optical and microphysicalquantities such as liquid or ice water contents (LWC orIWC). In addition, since small ice crystals may drasti-
cally a�ect the radiative properties of cirrus clouds(Takano et al., 1992), their shape can not be simplyapproximated by spheres or cylinders. Actually thescattering properties of ice crystals (with hexagonalstructure or even a more complex shape) di�er signif-icantly from that of perfect spheres (as given by the Mietheory), and consequently the spherical assumptioninduces quite large errors for the calculation of bulkquantities such as the liquid water path or opticalthickness of the cloud.
The main problem, causing these inaccurate estima-tions, is that the three dimensional shape of the particlescan not be deduced from images obtained with thePMS-2DC (Particle Measuring Systems, Boulder, CO,USA) probe by applying the existing pattern recognitionalgorithms (Darlison et al., 1988; Duroure, 1982; Dur-oure et al., 1994). Indeed, the same con®guration cancorrespond either to a spherical particle or a hexagonalcolumn. Our ®rst objective is therefore to classify theimages of these hydrometeors according to their occur-rence probabilities. Nevertheless, we have to keep inmind that for PMS-2DC measurements the errors arelargest with particle sizes smaller than 200 lm and mayreach 85% (Korolev et al., 1990). Thus, the estimationof the corresponding shape will intrinsically contain nonremovable uncertainties.
In the ®rst part of this study, we present a numericalmodel, including the e�ects of Fresnel's di�raction,speci®cally intended to simulate the sampling of hexag-onal columns and spheres. In a second step, this schemewas used to create several synthetic data sets consideredafterwards in a statistical analysis. The objective was tode®ne a new automatic pattern recognition algorithm inorder to di�erentiate the images of small hexagonalcolumns from those of spherical particles. Our methodwas validated against actual data obtained during an in-cloud ¯ight of the pre-ICE'89 (International CirrusExperiment) campaign (Gayet et al., 1990; Gayet et al.,1993). We propose a simple way to approximatelydetermine the volume of the particles and then the liquidor ice water content.Correspondence to: A. Fouilloux
Ann. Geophysicae 15, 840±846 (1997) Ó EGS ± Springer-Verlag 1997
2 Statistical analysis of synthetic data sets
2.1 Simulating the sampling of spherical particlesand hexagonal columns
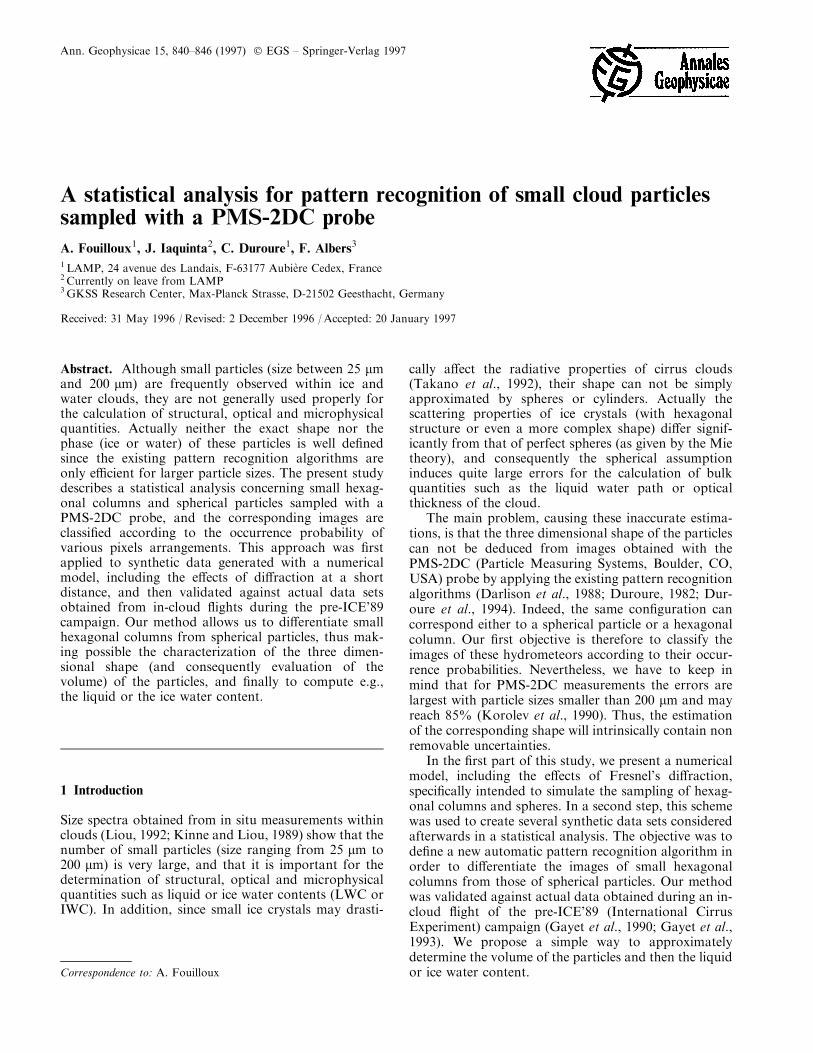
2.1.1 Theoretical study of particle shadow and di�ractione�ects. The formation of a particle shadow is alaborious problem since the di�racted, refracted andabsorbed components of the light beam have to beconsidered. As in Korolev et al. (1990), we neglected therefracted component of light and assumed that theparticles are completely opaque, therefore the shadowimage is simply de®ned by the di�racted component. Inaddition, we represented the e�ect of di�raction by athree-dimensional object, e.g., hexagonal column orspherical particle, by that of its projection on a planeperpendicular to the direction of propagation of theincident wave. Moreover, we considered the Huygens-Fresnel approximation since the characteristic size of theparticles (>20 lm) is much larger than the wavelengthof laser beam (i.e., 632 nm for the PMS-2DC probe).We implemented the theory initiated by Maggi-Rub-inowicz (Maggi, 1888 ; Rubinowicz, 1938), and furtherdeveloped by Miyamoto and Wolf (1962), in which thedi�raction can be considered as the combined e�ect ofan incident wave with a boundary wave. The amplitudeU(P) of the di�racted wave at a point P on the screen, asshown on Fig. 1, is given by:
U�P � � Ug�P � � Ud�P� �1�where
Ug�P � � eiKZ when P is in the direct beam0 when P is in the geometrical shadow
��2�
and
U d�P� � 1
4p
IC
ei~k�~qeiKS ~s�~k� �
S 1ÿ~s �~k� � d~l �3�
In these equations, Z represents the distance between theparticle and the screen, K � 2p=k is the wave number, kis the wavelength of the incident collimated light beam,S is the distance between point Q (on the contour C) andpoint P (on the screen). The corresponding unit vectorsare: ~k in the direction of the plane wave propagation, ~q(the radius vector of point Q) and~s. The integration iscarried out along the contour C (for which thedi�erential element of length is d~l), i.e., the boundaryof the geometrical shadow. The quantity Ug representsthe disturbance as predicted by the geometrical optics,and Ud the e�ect of di�raction. This approach is trueonly if Z is larger than 200 k=p (Papoulis, 1968), and theintensity I(P) of the di�raction is then deducted fromEqs. (1±3) by:
I�P� � jU�P�j2 �4�
In the case of the PMS-2DC probe a 50% thresholdlevel is applied for particle image sizing (Knollenberg,1970).
The spherical particles are de®ned by a radius R, thatcan randomly change over a range of �10% to considerthe noise of actual data, and varies from 25 lm to150 lm. This representation of the shape deformationsis very important, not only for water droplets, but alsofor aggregates which must be di�erentiated from hex-agonal particles.
The aspect ratio of the hexagonal columns (size< 200 lm), i.e., the ratio of the width w and the lengthL of the column, was found to be about 0.5 byHeyms®eld (1972). We selected intentionally a similarvalue in order to be in the least advantageous situation(since the particles are very compact their image lookslike almost that of a sphere), even if this is not really inagreement with the result of our actual data processing(the retrieved particle aspect ratio is 0.3 on average).Because the size of a photodiode is 25 lm, and to obtainimages of less than 10 pixels, the length of the simulatedcolumns takes values in the interval [25 lm; 300 lm].The location of a particle of maximal dimension Dwithin the sampling volume is chosen randomly so thatZ is in the range [D; 60 mm], according to the probecharacteristics.
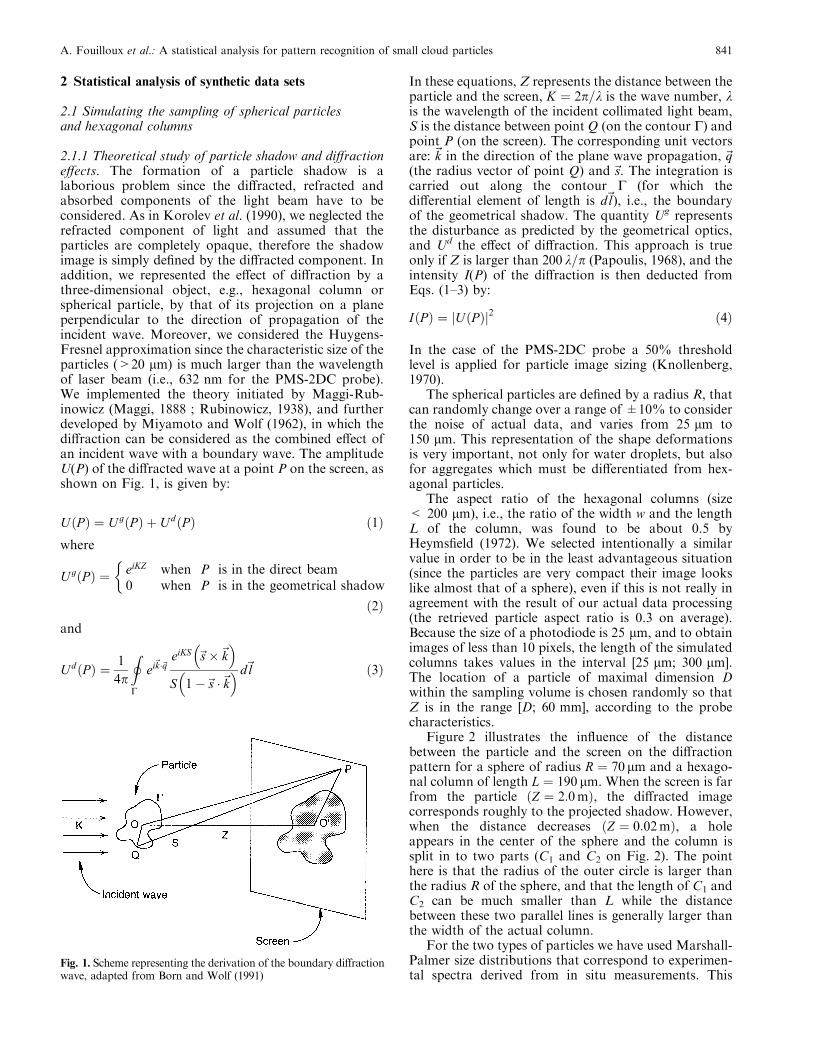
Figure 2 illustrates the in¯uence of the distancebetween the particle and the screen on the di�ractionpattern for a sphere of radius R � 70lm and a hexago-nal column of length L � 190 lm. When the screen is farfrom the particle �Z � 2:0m�, the di�racted imagecorresponds roughly to the projected shadow. However,when the distance decreases �Z � 0:02m�, a holeappears in the center of the sphere and the column issplit in to two parts (C1 and C2 on Fig. 2). The pointhere is that the radius of the outer circle is larger thanthe radius R of the sphere, and that the length of C1 andC2 can be much smaller than L while the distancebetween these two parallel lines is generally larger thanthe width of the actual column.
For the two types of particles we have used Marshall-Palmer size distributions that correspond to experimen-tal spectra derived from in situ measurements. This
Fig. 1. Scheme representing the derivation of the boundary di�ractionwave, adapted from Born and Wolf (1991)
A. Fouilloux et al.: A statistical analysis for pattern recognition of small cloud particles 841
option has a small in¯uence on the results consideringthat the analysis is conducted separately for the con®g-urations with di�erent numbers of pixels.
2.1.2 Modeling of the TAS clock frequency. The repre-sentativeness of the sampled images depends on both thetrue air speed (TAS) clock frequency and the lapse rateof the photodiodes. For instance, if the TAS clockfrequency is not set precisely to the exact aircraftairspeed, then the corresponding images will be elon-gated or contracted. The mean pixel aspect ratio Dx/Dycalculated for two data sets obtained during experimentswithin the pre-ICE and EUCREX (EUropean Cloudand Radiation EXperiment) program (Gayet et al., 1990;Raschke et al., 1990) are 0.9 and 2.4, respectively. Here,Dx characterizes the nominal pixel size (25 lm) de®nedby the array of the photodiodes, Dy is the pixel sizealong the ¯ight direction (determined by the TAS clock).The mean value of Dx/Dy strongly depends on thecharacteristics of the probe and on the aircraft airspeed.When the images are elongated, a pre-processing can beapplied in order to compress the information to a ratiovalue of 1.0, but when the loss of material is too large(for a pixel ratio much larger than 1.0, which is typicallythe case for the EUCREX data), our approach is notapplicable (it is actually the case with all the existingmethods even for large particles). Finally the ®rstcolumn of each simulated image is eliminated in orderto reproduce the triggering of the PMS-2DC probe.
2.2 Results of the statistical analysis
Note that the results of our model are only presented fora mean pixel aspect ratio Dx/Dy equal to 1.0 in the restof this study. Indeed, the computation of di�ractione�ects, even using the Maggi-Rubinowicz approxima-tion, is very time consuming, and we had to restrain ourstudy. Nevertheless, this work can be easily extended toother values of the mean pixel aspect ratio as mentionedin section 2.1.2.
In order to discriminate between the shapes ofhexagonal columns from those of spherical particles,we sampled about 5000 particles for each data set. Manypixel con®gurations appear, especially the non-relatedarrangements that are due to the di�raction e�ects (seeFig. 2) which produce `hollow' images (i.e., with a holein the center of the spheres or where columns are split intwo parallel parts). A con®guration will be considered asnon-related when there is at least one pixel of the imagefor which the 8-neighbors are not activated. For patternrecognition, we de®ne the following categories:
· related and oriented vertically (referred hereafter asRV )
· related and oriented horizontally (RH )· related and non-related with no particular orientation(RD1 and RD2 for 2-pixels, U otherwise)
· non-related and oriented vertically (NRV )· non-related and oriented horizontally (NRH )
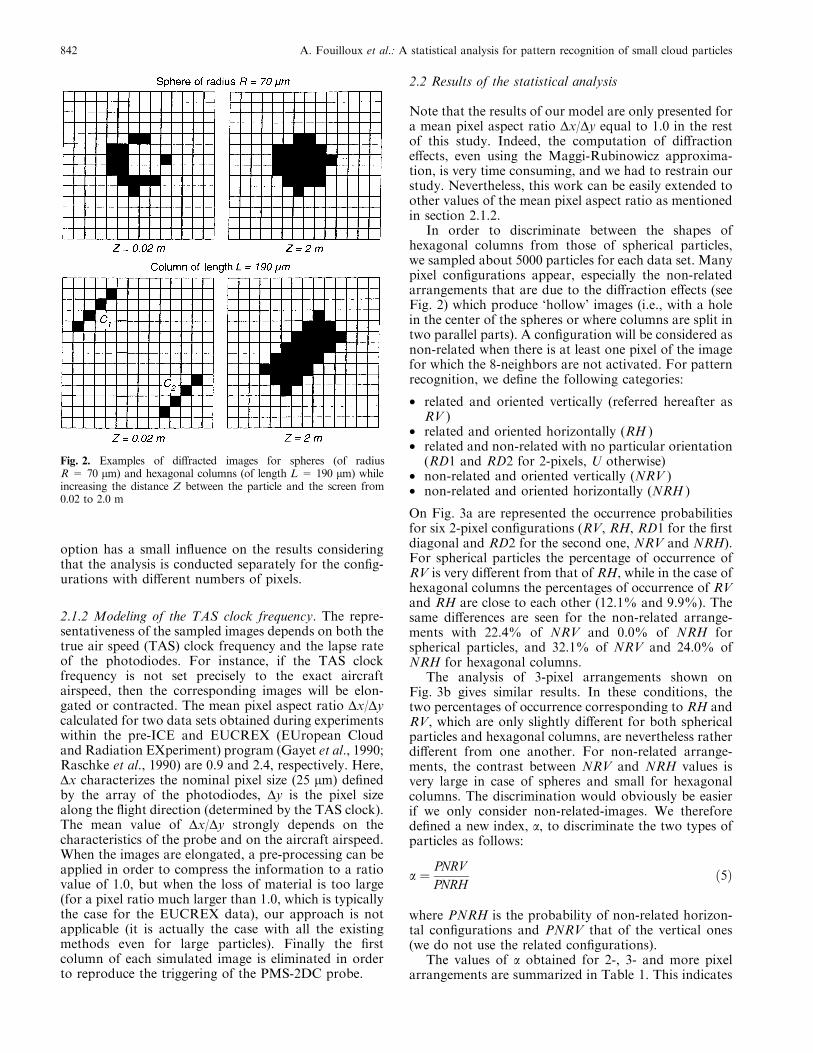
On Fig. 3a are represented the occurrence probabilitiesfor six 2-pixel con®gurations (RV, RH, RD1 for the ®rstdiagonal and RD2 for the second one, NRV and NRH).For spherical particles the percentage of occurrence ofRV is very di�erent from that of RH, while in the case ofhexagonal columns the percentages of occurrence of RVand RH are close to each other (12.1% and 9.9%). Thesame di�erences are seen for the non-related arrange-ments with 22.4% of NRV and 0.0% of NRH forspherical particles, and 32.1% of NRV and 24.0% ofNRH for hexagonal columns.
The analysis of 3-pixel arrangements shown onFig. 3b gives similar results. In these conditions, thetwo percentages of occurrence corresponding to RH andRV, which are only slightly di�erent for both sphericalparticles and hexagonal columns, are nevertheless ratherdi�erent from one another. For non-related arrange-ments, the contrast between NRV and NRH values isvery large in case of spheres and small for hexagonalcolumns. The discrimination would obviously be easierif we only consider non-related-images. We thereforede®ned a new index, a, to discriminate the two types ofparticles as follows:
a � PNRVPNRH
�5�
where PNRH is the probability of non-related horizon-tal con®gurations and PNRV that of the vertical ones(we do not use the related con®gurations).
The values of a obtained for 2-, 3- and more pixelarrangements are summarized in Table 1. This indicates
Fig. 2. Examples of di�racted images for spheres (of radiusR = 70 lm) and hexagonal columns (of length L = 190 lm) whileincreasing the distance Z between the particle and the screen from0.02 to 2.0 m
842 A. Fouilloux et al.: A statistical analysis for pattern recognition of small cloud particles
clearly that a small value of a is representative ofhexagonal columns whereas spherical particles presentlarger values (that is to say a > 5.0). In addition, we cansee that the di�erence between spheres and hexagonalcolumns increases in terms of a with the number ofpixels, but on the other hand, the proportion of non-related images decreases. The pattern recognition pro-cedure is very tedious for more than 10 pixels, where forinstance, the classical algorithm developed by Duroure(1982) becomes e�cient.
Finally, we also checked the automatic patternrecognition procedure for Dx/Dy much larger than 1.0and found that it can not be applied for a mean pixelaspect ratio larger than 1.5. Therefore, the EUCREXdata set (Dx/Dy = 2.4) is totally unusable, which is notsurprising since the aircraft airspeed was very high(about 200 m/s).
2.3 Estimation of the volume of the particle
With our model, the geometrical characteristics of theparticles (either spheres or hexagonal columns) areperfectly known. It is therefore possible to derive somekind of statistical `transfer function' associating eachpixel con®guration with a mean particle size (for both
cases) and ®nd the corresponding average volume value.Such theoretical relationships are given in detail inTable 3a (for spherical particles) and Table 3b (forhexagonal ice crystals), where the characteristic dimen-sion of the particles is tabulated with the standarddeviation for each of the two categories de®ned already.
Surprisingly, for a given number of pixels (forinstance with the 2-pixel con®gurations RH and NRV)the dimension of the columns can change drastically (inthis case by a factor of two), since both small and largeparticles can produce di�raction images classi®ed in thesame category. Furthermore, the number of pixels is notdirectly proportional to the size of the particle (i.e., asimple computation of the volume would be completelywrong), and the standard deviation is never larger than 2pixels. As a consequence, one can simply estimate theorder of magnitude of the ice or liquid water contents bymultiplying the average volume (given in our tables) bythe corresponding concentration and mass density of thehydrometeors.
3 Statistical analysis of actual data
3.1 Images with 2 pixels
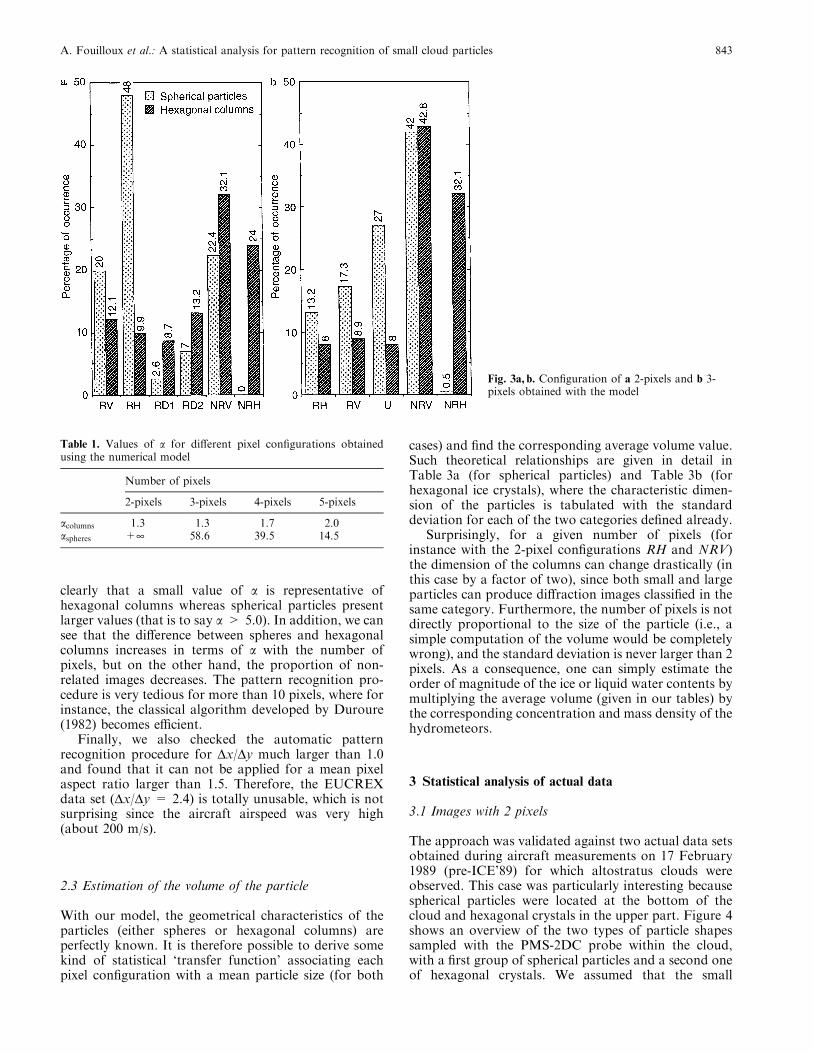
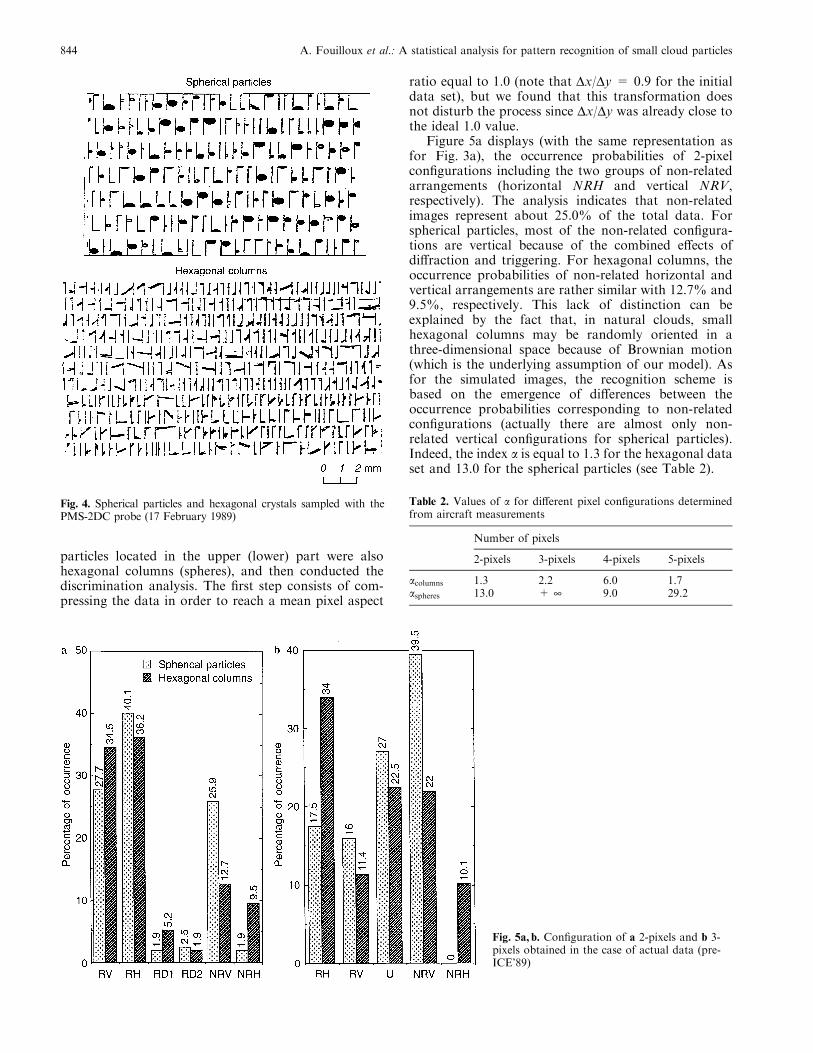
The approach was validated against two actual data setsobtained during aircraft measurements on 17 February1989 (pre-ICE'89) for which altostratus clouds wereobserved. This case was particularly interesting becausespherical particles were located at the bottom of thecloud and hexagonal crystals in the upper part. Figure 4shows an overview of the two types of particle shapessampled with the PMS-2DC probe within the cloud,with a ®rst group of spherical particles and a second oneof hexagonal crystals. We assumed that the small
Fig. 3a, b. Con®guration of a 2-pixels and b 3-pixels obtained with the model
Table 1. Values of a for di�erent pixel con®gurations obtainedusing the numerical model
Number of pixels
2-pixels 3-pixels 4-pixels 5-pixels
acolumns 1.3 1.3 1.7 2.0aspheres +¥ 58.6 39.5 14.5
A. Fouilloux et al.: A statistical analysis for pattern recognition of small cloud particles 843
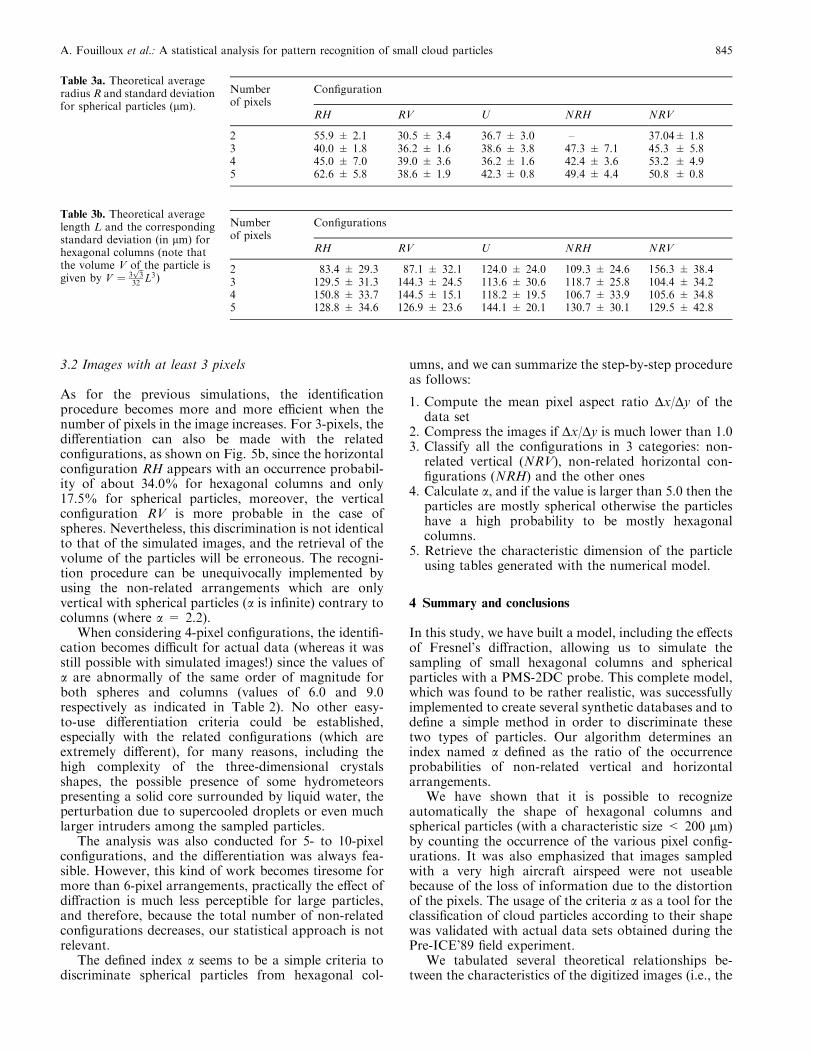
particles located in the upper (lower) part were alsohexagonal columns (spheres), and then conducted thediscrimination analysis. The ®rst step consists of com-pressing the data in order to reach a mean pixel aspect
ratio equal to 1.0 (note that Dx/Dy = 0.9 for the initialdata set), but we found that this transformation doesnot disturb the process since Dx/Dy was already close tothe ideal 1.0 value.
Figure 5a displays (with the same representation asfor Fig. 3a), the occurrence probabilities of 2-pixelcon®gurations including the two groups of non-relatedarrangements (horizontal NRH and vertical NRV,respectively). The analysis indicates that non-relatedimages represent about 25.0% of the total data. Forspherical particles, most of the non-related con®gura-tions are vertical because of the combined e�ects ofdi�raction and triggering. For hexagonal columns, theoccurrence probabilities of non-related horizontal andvertical arrangements are rather similar with 12.7% and9.5%, respectively. This lack of distinction can beexplained by the fact that, in natural clouds, smallhexagonal columns may be randomly oriented in athree-dimensional space because of Brownian motion(which is the underlying assumption of our model). Asfor the simulated images, the recognition scheme isbased on the emergence of di�erences between theoccurrence probabilities corresponding to non-relatedcon®gurations (actually there are almost only non-related vertical con®gurations for spherical particles).Indeed, the index a is equal to 1.3 for the hexagonal dataset and 13.0 for the spherical particles (see Table 2).
Fig. 4. Spherical particles and hexagonal crystals sampled with thePMS-2DC probe (17 February 1989)
Fig. 5a, b. Con®guration of a 2-pixels and b 3-pixels obtained in the case of actual data (pre-ICE'89)
Table 2. Values of a for di�erent pixel con®gurations determinedfrom aircraft measurements
Number of pixels
2-pixels 3-pixels 4-pixels 5-pixels
acolumns 1.3 2.2 6.0 1.7aspheres 13.0 + ¥ 9.0 29.2
844 A. Fouilloux et al.: A statistical analysis for pattern recognition of small cloud particles
3.2 Images with at least 3 pixels
As for the previous simulations, the identi®cationprocedure becomes more and more e�cient when thenumber of pixels in the image increases. For 3-pixels, thedi�erentiation can also be made with the relatedcon®gurations, as shown on Fig. 5b, since the horizontalcon®guration RH appears with an occurrence probabil-ity of about 34.0% for hexagonal columns and only17.5% for spherical particles, moreover, the verticalcon®guration RV is more probable in the case ofspheres. Nevertheless, this discrimination is not identicalto that of the simulated images, and the retrieval of thevolume of the particles will be erroneous. The recogni-tion procedure can be unequivocally implemented byusing the non-related arrangements which are onlyvertical with spherical particles (a is in®nite) contrary tocolumns (where a = 2.2).
When considering 4-pixel con®gurations, the identi®-cation becomes di�cult for actual data (whereas it wasstill possible with simulated images!) since the values ofa are abnormally of the same order of magnitude forboth spheres and columns (values of 6.0 and 9.0respectively as indicated in Table 2). No other easy-to-use di�erentiation criteria could be established,especially with the related con®gurations (which areextremely di�erent), for many reasons, including thehigh complexity of the three-dimensional crystalsshapes, the possible presence of some hydrometeorspresenting a solid core surrounded by liquid water, theperturbation due to supercooled droplets or even muchlarger intruders among the sampled particles.
The analysis was also conducted for 5- to 10-pixelcon®gurations, and the di�erentiation was always fea-sible. However, this kind of work becomes tiresome formore than 6-pixel arrangements, practically the e�ect ofdi�raction is much less perceptible for large particles,and therefore, because the total number of non-relatedcon®gurations decreases, our statistical approach is notrelevant.
The de®ned index a seems to be a simple criteria todiscriminate spherical particles from hexagonal col-
umns, and we can summarize the step-by-step procedureas follows:
1. Compute the mean pixel aspect ratio Dx/Dy of thedata set
2. Compress the images if Dx/Dy is much lower than 1.03. Classify all the con®gurations in 3 categories: non-related vertical (NRV), non-related horizontal con-®gurations (NRH) and the other ones
4. Calculate a, and if the value is larger than 5.0 then theparticles are mostly spherical otherwise the particleshave a high probability to be mostly hexagonalcolumns.
5. Retrieve the characteristic dimension of the particleusing tables generated with the numerical model.
4 Summary and conclusions
In this study, we have built a model, including the e�ectsof Fresnel's di�raction, allowing us to simulate thesampling of small hexagonal columns and sphericalparticles with a PMS-2DC probe. This complete model,which was found to be rather realistic, was successfullyimplemented to create several synthetic databases and tode®ne a simple method in order to discriminate thesetwo types of particles. Our algorithm determines anindex named a de®ned as the ratio of the occurrenceprobabilities of non-related vertical and horizontalarrangements.
We have shown that it is possible to recognizeautomatically the shape of hexagonal columns andspherical particles (with a characteristic size < 200 lm)by counting the occurrence of the various pixel con®g-urations. It was also emphasized that images sampledwith a very high aircraft airspeed were not useablebecause of the loss of information due to the distortionof the pixels. The usage of the criteria a as a tool for theclassi®cation of cloud particles according to their shapewas validated with actual data sets obtained during thePre-ICE'89 ®eld experiment.
We tabulated several theoretical relationships be-tween the characteristics of the digitized images (i.e., the
Table 3a. Theoretical averageradius R and standard deviationfor spherical particles (lm).
Numberof pixels
Con®guration
RH RV U NRH NRV
2 55.9 � 2.1 30.5 � 3.4 36.7 � 3.0 ± 37.04� 1.83 40.0 � 1.8 36.2 � 1.6 38.6 � 3.8 47.3 � 7.1 45.3 � 5.84 45.0 � 7.0 39.0 � 3.6 36.2 � 1.6 42.4 � 3.6 53.2 � 4.95 62.6 � 5.8 38.6 � 1.9 42.3 � 0.8 49.4 � 4.4 50.8 � 0.8
Table 3b. Theoretical averagelength L and the correspondingstandard deviation (in lm) forhexagonal columns (note thatthe volume V of the particle isgiven by V � 3
��3p32 L3)
Numberof pixels
Con®gurations
RH RV U NRH NRV
2 83.4 � 29.3 87.1 � 32.1 124.0 � 24.0 109.3 � 24.6 156.3 � 38.43 129.5 � 31.3 144.3 � 24.5 113.6 � 30.6 118.7 � 25.8 104.4 � 34.24 150.8 � 33.7 144.5 � 15.1 118.2 � 19.5 106.7 � 33.9 105.6 � 34.85 128.8 � 34.6 126.9 � 23.6 144.1 � 20.1 130.7 � 30.1 129.5 � 42.8
A. Fouilloux et al.: A statistical analysis for pattern recognition of small cloud particles 845
number of pixels and the various arrangements) and thevolume of spheres or hexagonal columns producing thesame pattern after being di�racted on a screen, decreas-ing the unavoidable volume error for small particles.These results are encouraging, and it should be inter-esting to extend the applicability ®eld of this statisticalalgorithm to a large number of di�erent data setsobtained within various types of clouds (a very hardtask) in order to re®ne the determination of structural,optical and microphysical quantities.
Acknowledgements. We are very grateful to Doctor Jean-FrancË oisGayet for his help during the entire course of this study, and toProfessor Harumi Isaka for prolonged discussions.
Topical Editor L. Eymard thanks F. Parol and P. Wendling fortheir help in evaluating this paper.
References
Born, M., and E. Wolf, Principles of optics, electromagnetic theoryof propagation interference and di�raction of light, 6th edn.,Pergamon Press, 808 pp. 1991.
Darlison, A. G., and P. R. A. Brown, The use of automatic particlesrecognition to improve the determination of bulk quantitiesfrom PMS-2D probe data in cirrus, Proc. Xth Int. Cloud PhysicsConf., Bad Homburg, FRG, August 15±20, 1988.
Duroure, C., Une nouvelle me thode de traitement d'hydrome te oresdonne e par les sondes bidimensionnelles. J. Rech. Atmos., 16,71±74, 1982.
Duroure, C., H. R. Larsen, H. Isaka, and P. Personne, 2D imagepopulation analysis, J. Rech. Atmos., 34, 195±205, 1994.
Gayet, J. F., P. R. A. Brown and F. Albers, Results of the pre-ICEexperiment. 42 pp. (Report available from LAMP, UniversiteÂBlaise Pascal, 63177 AubieÁ re Cedex, FRANCE), 1990.
Gayet, J. F., P. R. A. Brown, and F. Albers, A comparison of in-cloud measurements obtained with six PMS-2DC probes, J.Atmos. Ocean Tech., 10, 180±194, 1993.
Heyms®eld, A., Ice crystal terminal velocities, J. Atmos. Sci., 29,1348±1357, 1972.
Kinne, S., and K. N. Liou, The e�ects of the non-sphericity and sizedistribution of ice crystals on the radiative properties of cirrusclouds, Atmos. Res., 24, 273±284, 1989.
Knollenberg, R. G., The optical array: an alternative to scatteringand extinction for airborne particle size determination, J. Appl.Meteorol., 9, 86±103, 1970.
Korolev, A. V., S. V. Kuznetsov, Y. E. Makarov, and V. S. Novikov,Evaluation ofmeasurements of particle size and sample area fromoptical array probes, J. Atmos. Ocean. Tech., 8, 514±522, 1990.
Liou, K. N., Radiation and cloud processes in the atmosphere, theory,observation, and modeling, Oxford University Press, 1992.
Maggi, G. A., Annali di Matem, 16, 21, 1888.Miyamoto, K. and E. Wolf, J. Opt. Soc. Am., 52, 615±626, 1962.Papoulis, A., System and transforms with application in optics,
MacGraw-Hill, 1968.Raschke, E., J. Schmetz, J. Heintzenberg, R. Kandel, and R. Saun-
ders, The International Cirrus Experiment (ICE). A jointEuropean e�ort, ESA J., 14, 193±199, 1990.
Rubinowicz, A., Phys. Rev., 54, 931, 1938.Takano, Y., K. N Liou, and P. Minnis, The e�ect of small ice
crystals on cirrus infrared radiative properties, J. Atmos. Sci.,49, 1487±1493, 1992.
846 A. Fouilloux et al.: A statistical analysis for pattern recognition of small cloud particles