statistical pattern recognition(1)
TRANSCRIPT

1
Statistical Pattern
Recognition
A Review
Presented by : SYED ATIF CHISHTI

The Review Paper is divided in to 9 section:
Introduction.
Statistical Pattern Recognition.
The Curse of Dimensionality
Dimensionality Reduction.
Classifiers.
Classifier Combination.
Error Estimation.
Unsupervised Classification.
Frontiers of Pattern Recognition.
2

3
Introduction
Topics covered:
Pattern Recognition & Example.
Template Plating.
Statistical Approach
Syntactic Approach
Neural Networks.

4
Objective
To summarize and compare well known methodsGoal Goal of PR is to supervised or unsupervised Classification.
Pattern
As opposite of a Coas It is an Entity vaguely defined
Example: Finger Print image, Human Face, Speech signal, hand written cursive

Selection of Training and Test samples.
Definition of pattern classes
Sensing environment
Pattern representation
Feature extraction and selection
Cluster analysis
Classifier design
5

6

7

A template having 2 D shape or prototype of pattern is matched against the stored template.
Determines the similarity between 2 entities
Correlation.
Disadvantage Patterns are distorted.
8

Each pattern is represented in D features in d dimensional space as a point.
Objective to establish decision boundaries in the feature space which separate pattern of different classes.
Discriminate analysis based approach for classification
Using mean squared error criteria
Construct the decision boundaries of the specified form
9
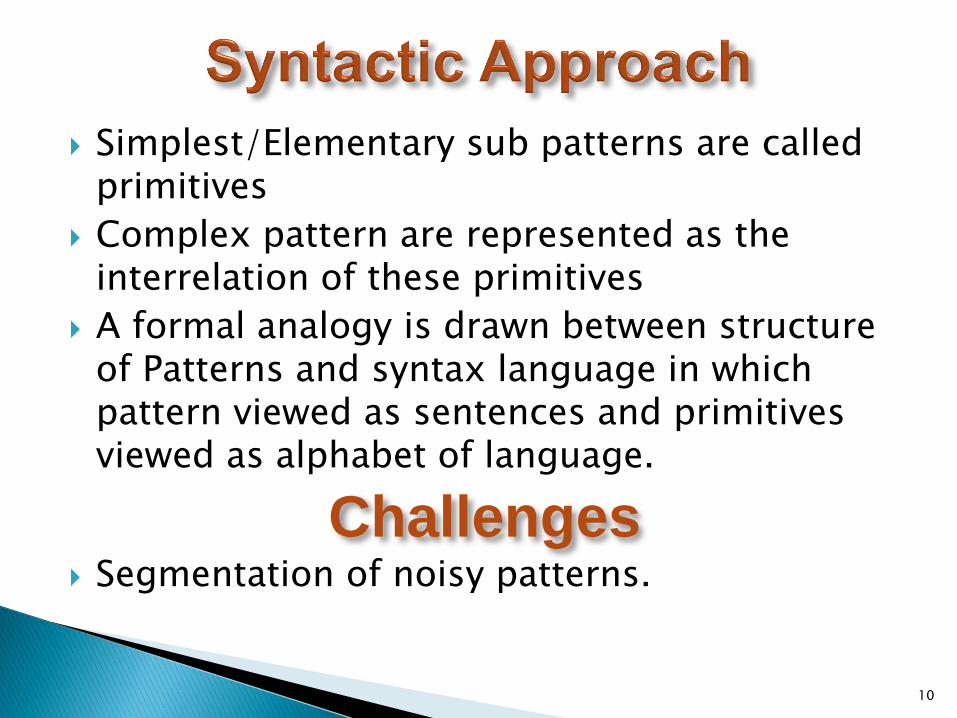
Simplest/Elementary sub patterns are called primitives
Complex pattern are represented as the interrelation of these primitives
A formal analogy is drawn between structure of Patterns and syntax language in which pattern viewed as sentences and primitives viewed as alphabet of language.
Challenges Segmentation of noisy patterns.
10

Massively parallel computing system
Consists of an extremely large number of simple processors with many interconnection.
Ability to learn complex non linear input/output relationship.
Feed forward network, Self-Organizing map(SOM).
11

12

Pattern is represented by set of d features/attributes viewed as D-dimensional feature space.
System is operating in two modes i.e Training and classification.
13

Decision Making Process Pattern assign to one of the C categories/Class
W1,W2,...,Wc based on a vector of d features values x=(x1,x2,...,xd)
Class conditional Probability = P(x|wi)
Conditional Risk = R(wi|x)=∑L(wi,wj).P(wj|X) where L(wi,wj) is loss in curred in deciding wi when true class is wj.
Posterior Probability = P(Wj|X)
For 0/1 loss function = L(wi,wj)={0,i=j
{1,i≠j
Assign input pattern x to class wi if
P(Wi|X)› P(Wj|X) for all j≠i
14

15
If all of the class conditional densities is known then Bayesdecision rule can be used to design a classifier.
If the form of class conditional densities is known(multivariate gaussian) but parameter like an mean vectorsand covariance matrix) not known then we have aparametric decision problem. Replace the unknownparamters with estimated value.
If form of class conditional density not known that we arein non parametric mode. In such cases we used Parzenwindow (estimate the density function) or directly constructboundry by using KNN rule.
Optimizing the classifier to maximize its performance ontraining data will NOT give such result on test data.
Statistical Pattern Recognition (cont..)

16

The number of features is too large relative to the number of training samples.
Performance of classifier depend on◦ The sample size, ◦ number of features and ◦ classifier complexity.
Curse of dimensionality ◦ Naive table-lookup technique requires the number of
training data points to be exponential function of feature dimension.
Small number of feature can reduce the curse of dimensionality when Training sample is limited.
17

If number of training sample is small relative to the numberof feature then it degrade the performance of classifier
Trunk Example
Two class classification with equal Prior probabilites,multivariate Gaussian and identity covariance matrix.
The mean vector have following component
18

19
Case 1: Mean vector m is known:
Use bayes decision rule with 0/1 loss function to construct decision boundry.
Case 2 : Mean vector m is unknown:
Pe(n,d)=1/2
Cases

20
Result
We can’t increase the number of featureswhen parameters of class conditionaldensities estimated from a finite number ofsamples.

Dimensionality of pattern or number of features should be small due to
Measurement cost and classification accuracy.
Can reduce the curse of dimensionality when training sample is limited.
Disadvantage : Reduction in number of features lead to a loss in the discrimination power
and lower the accuracy of Rs
Feature Selection : Feature selection refers to algorithm which select the best subset of the
input feature set.
Feature extraction
Feature extraction algorithm are methods which create new feature after transformation of original feature set.
21

Chernoff represent each pattern as cartoon face with nose length, face curvature & eye size as features.
Setosa looks quite different from others two.
Two dimensional Plot : PCA and Fisher mapping
22

23

24

25

Designer have access to multiple classifier. A single training set which is collected at different time and
environment uses different feature . Each classifier has its own region in feature space Some classifier show different result with different
initialization
Schemes to Combine multiple Classifier
Parallel: All individual classifier invoked independently
Cascading: Individual classifiers invoked in linear sequence.
Tree like: Individual classifiers are combined into structure similar to decision tree classifier.
26

Stacking
Bagging
Boosting
Combiner Trainability
Adaptive
Expectation output Confidence
Rank
Abstract
27

28

29

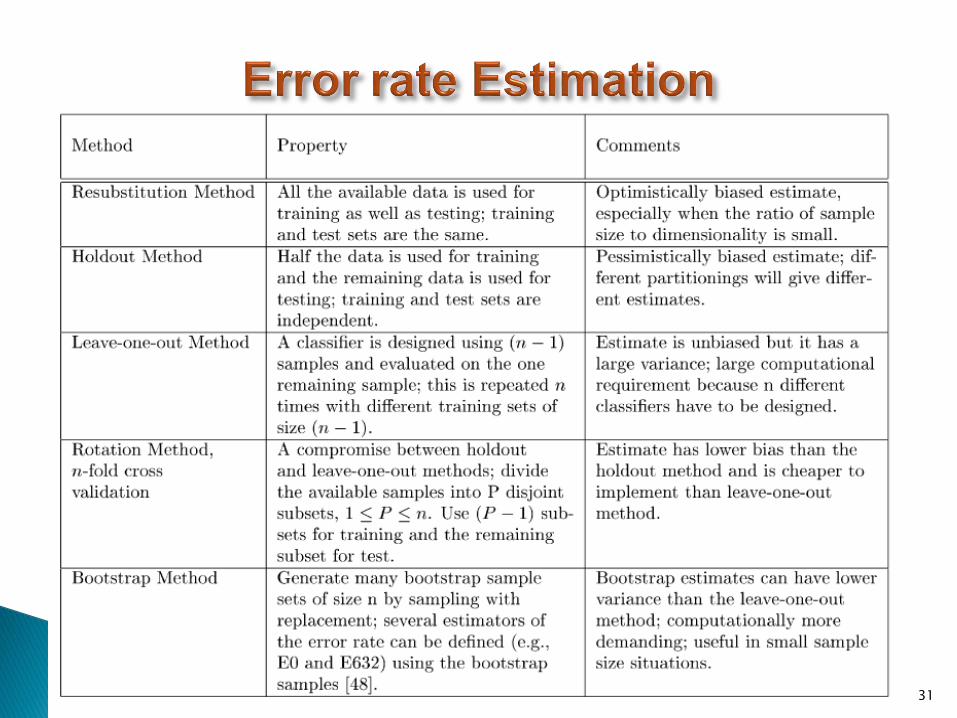
Classification error or error rate Pe is the ultimate measure of the performance of classifier.
Error probability.
For consistent training rule the value of Peapproaches to bayes error for increasing sample size.
A simple analytical expression for Pe is impossible to write even in multivariate Gaussian densities.
Maximum Likelihood estimate Pe˄ of Pe is =T/N
30
31

32

33

The Objective is to construct decisionboundaries based on unlabeled training data.
Clustering algorithm based on two technique◦ Iterative square error clustering.
◦ Agglomerative hierarchical clustering.
34

35

A given set of n patterns in d dimension has partitioned in to k clusters. Mean vector defined as :
The square error for cluster Ck is the sum of squared Euclidean distances between each pattern in Ck and cluster centre m.
36

37

38

39

40