a n n u a l r e p o r t 2 0 0 7 - amazon s3s3.amazonaws.com/zanran_storage/ mazoon petrogas saoc...
TRANSCRIPT

A n n u a l R e p o r t 2 0 0 7

2P Reserves vs cumm prodn

�


�
Message from ChairmanI am pleased to report that Petrogas’ 2007 performance has again been excellent, buoyed up by oil prices which averaged 66 US$ for the year. Production rose by 248 bopd to 9, 434 bopd (working interest), expenditure was on budget, reaching some 90 Million US$ (working interest) and reserves (2P) remained stable at 55 million barrels of oil. Net profit increased by 40% to US$ 52 million.
Towards the end of the year, Petrogas was in process of concluding three new business transactions, namely: the acquisition of an interest in producing assets onshore Gulf of Suez, Egypt; a farm-in to an exploration concession in Oman along trend from one of our existing concessions; and the award of the much sought after Rima small fields development contract in Oman.
Beside this, in a competitive market for staff resources, Petrogas has been successful in attracting key technical and managerial staff to allow it to develop its business and provide governance and advice to its subsidiaries. Petrogas has a staff of some 200 of whom more than 70% are Omani nationals. 50-70 additional staff are being resourced to manage the Rima small fields development project.
I look forward to production rising more substantially through 2008 as the impact of the 3rd rig’s activities in Daleel come though, Petrogas taking over operations in the Rima small fields and the results of the planned exploration and appraisal activities in Oman, Egypt and India. I would like to thank management and employees for all their efforts in 2007 and wish them continuing success in the future.
H.E. Mohamed Al Barwani Chairman Petrogas E&P LLC

��
Petrogas E&P is the holding Company for MB Holding Company’s Exploration and Production activities in Oman and overseas, namely Petrogas LLC, operator of Block-7 in Oman, Mazoon Petrogas SAOC which holds 50% interest in Block-5 in Oman and 50% stake in the operator Company Daleel Petroleum. Also through its Indian project office, Petrogas E&P manage three explo-ration concession being operator in one. Two more subsidiaries have been added in 2007, namely Petrogas Malih which holds 50% interest in block 45 & 48 and Petrogas Rima (Company formed in Jan’08) hold-ing 75% interest in the Rima Small Fields service contract awarded to Petrogas Rima by Petroleum Development Oman. Finally, Petrogas E&P acquired a 30% interest in oil producing Area A, onshore Egypt operated by Oil Search Eastern Desert.
Corporate Values
HSE is at the core of Petrogas values. We seek to improve its HSE systems and per-formance, and always to work within the laws, regulations and permits of the coun-tries hosting its operations. We see appro-priate attention to HSE and performance excellence as pre-requisites to business success. Petrogas, with more than 200 em-ployees at end 2007 and a requirement for intensive recruitment to staff up its new sub-sidiaries and affiliates sees its work force as its most valuable asset. Quality recruitment is perhaps the most critical factor in grow-ing the company and yet a challenging one in the current tight employment market for Oil and Gas personnel.
Company Profile
Training and development of Omani staff is seen as vital to secure a stable, experienced and motivated work force for the future. More than 70% of Petrogas staff is Omani. Petrogas also values the contri-bution of its international staff who willingly shares their experience and know-how with their colleagues. Diversity and multi-disciplinary teamwork are seen as essential factors to maintain Petrogas’ drive for continuous improvement and growth.
Petrogas E&P Organizational Chart

��
Petrogas E&P LLC’s current reserves and production are derived primarily from 7 fields located onshore the Sultanate of Oman. At the end of 2007, Petrogas E&P LLC has net proved developed and undeveloped reserves of around 35 million barrels and 2P reserves of around 55 million barrels (working interest basis). Production, during 2007, averaged 9,434 barrels a day on a work-ing interest basis. In the same period, Petrogas E&P LLC’s turnover amounted to US$ 215 million with an average realized oil price of around US$ 66 per barrel. No oil price hedging was, or is, in place and Petrogas continues to realize the full benefit of high oil prices.
During 2007, Petrogas E&P LLC invested US$ 57 mil-lion in Capex (development and exploration work pro-grams). At end 2007, profit from Operations was US$ 54 million and the Net Profit was US$ 52 million.
The latest estimates for 2008 show a higher level of production and increased revenue. Expenditure (Capex and Opex) are at US$ 170 million, up by some US$ 80 million, primarily in Block-7 & 5 due to asset maintenance and drilling and expenditure towards new acquisitions.
Petrogas E&P Organization (Corporate office)
Chairman
CEO
Exploration andNew Business Development
Field Developmentand Operations
Corporate HRand Administration
Finance andAccounts
Contract &Procurement
Petrogas E&P Organization (Corporate office)
�
Key dates in Petrogas History
1999 Petrogas LLC is established in January 1999 and acquires Block-7 (Butabul) contract area in Oman from Elf Petroleum. Petrogas LLC becomes the operator with a 100% working interest.
2001 Mazoon Petrogas SAOC is formed and acquires Block-5 (Wadi Aswad) contract area from Japex in January 2001.
2002 Mazoon Petrogas SAOC sells 50% working interest in Block-5 to China National Petroleum Corporation (CNPC). Daleel Petroleum LLC is formed as a jointly owned operating company for Block-5.
2005 Petrogas E&P LLC is established to hold all Group’s interest in Oil and Gas Exploration and Production. This includes the management of interest in Petrogas LLC operator (100%) for Block -7 as well as in Daleel Petroleum LLC (50%). It also hosts a New Business Development team handling the evaluation and acquisition of new E&P assets.
2006 Petrogas E&P LLC, as a part of the consortium were awarded 3 exploration blocks in India under the NELP VI bidding round. Three blocks include two shallow water offshore blocks in Mumbai basin and one onshore block in KG basin. Petrogas E&P LLC is the operator for one offshore block.
2007 Petrogas E&P India project office is opened in Gurgaon, India to oversee the E&P activities of the three recently awarded blocks.
Petrogas E&P through competitive bidding acquires 30% equity in Area A block in Egypt.
Petrogas E&P farmed in block 45 & 48, onshore Oman with 50% interest. Subsequently the interest was assigned to its subsidiary Petrogas Malih. Maersk is the operator and other 50% holder of the block.
2008 Rima cluster of small fields, onshore Oman awarded to Petrogas Rima, wholly owned subsidiary of Petrogas E&P.
�
petrogas e&p llC subsidiaries and affiliates
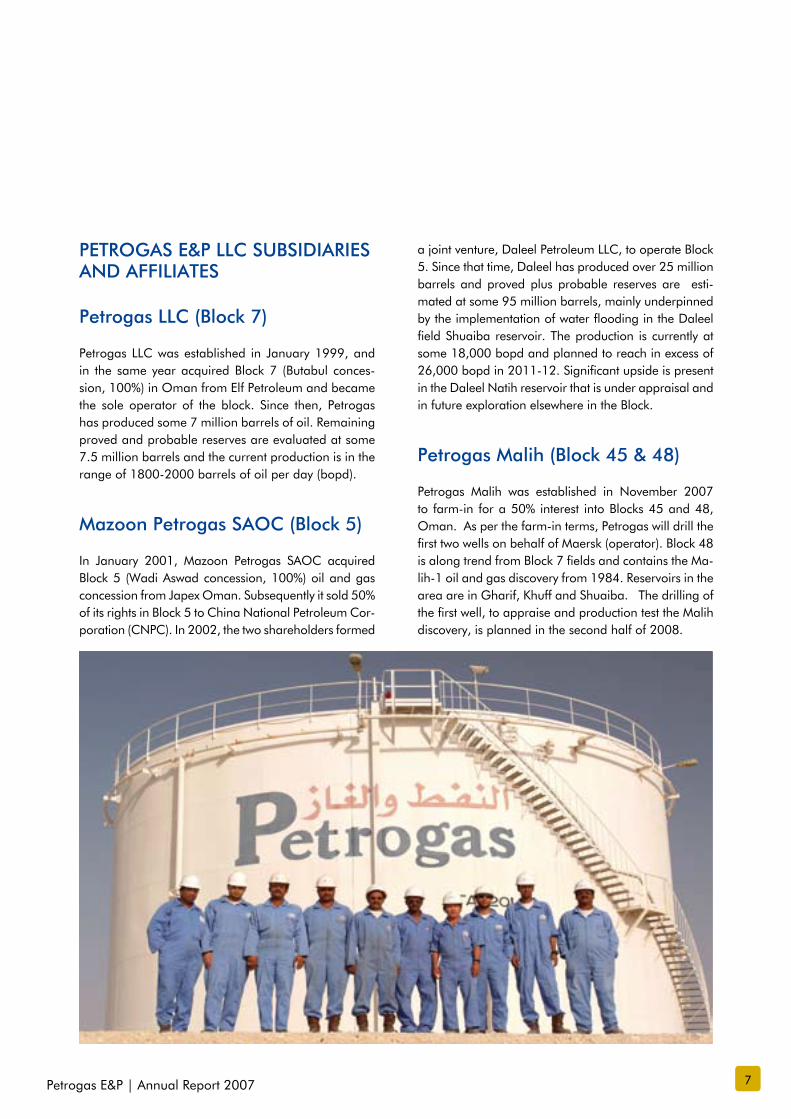
Petrogas LLC (Block 7)
Petrogas LLC was established in January 1999, and in the same year acquired Block 7 (Butabul conces-sion, 100%) in Oman from Elf Petroleum and became the sole operator of the block. Since then, Petrogas has produced some 7 million barrels of oil. Remaining proved and probable reserves are evaluated at some 7.5 million barrels and the current production is in the range of 1800-2000 barrels of oil per day (bopd).
Mazoon Petrogas SAOC (Block 5)
In January 2001, Mazoon Petrogas SAOC acquired Block 5 (Wadi Aswad concession, 100%) oil and gas concession from Japex Oman. Subsequently it sold 50% of its rights in Block 5 to China National Petroleum Cor-poration (CNPC). In 2002, the two shareholders formed
a joint venture, Daleel Petroleum LLC, to operate Block 5. Since that time, Daleel has produced over 25 million barrels and proved plus probable reserves are esti-mated at some 95 million barrels, mainly underpinned by the implementation of water flooding in the Daleel field Shuaiba reservoir. The production is currently at some 18,000 bopd and planned to reach in excess of 26,000 bopd in 2011-12. Significant upside is present in the Daleel Natih reservoir that is under appraisal and in future exploration elsewhere in the Block.
Petrogas Malih (Block 45 & 48)
Petrogas Malih was established in November 2007 to farm-in for a 50% interest into Blocks 45 and 48, Oman. As per the farm-in terms, Petrogas will drill the first two wells on behalf of Maersk (operator). Block 48 is along trend from Block 7 fields and contains the Ma-lih-1 oil and gas discovery from 1984. Reservoirs in the area are in Gharif, Khuff and Shuaiba. The drilling of the first well, to appraise and production test the Malih discovery, is planned in the second half of 2008.

�
petrogas rima (Small fields : Rima cluster)
Petrogas Rima was established at the beginning of 2008 to manage and operate the Rima satellite cluster of Small Fields on behalf of PDO. The area covers some 1500 km2 of PDO’s Block 6 and includes nine producing fields and nine unconnected single-well discoveries. Current production is 2000 bopd of an average 21°API. The project is a service contract with PDO, where cost-recovery and profit depend on oil production being maintained above a baseline and a tendered production profile for the first five years. Oman Oil Company SAOC is a 25% partner in the venture.
Rima Cluster

�
Limited, Hindustan Petroleum Corporation Limited, Gujarat State Petroleum Corporation and Indian Oil Corporation as non-operating partners. 3D seismic is planned after the monsoon season in 2008, with ex-ploration drilling (3 firm wells) to follow in 2009+.
KG-ONN-2004/2 block is an onshore coastal block on the east coast of India with an area of 1140 km2. The operator of KG-ONN-2004/2 is Gujarat State Petroleum Corporation. GAIL (India) Limited, is the non-operating partners along with Petrogas E&P. 5 exploratory wells are planned to be drilled in the first exploration phase (4 years)
Petrogas E&P India project office
Petrogas E&P India project office was setup in Gurgaon, India to over see the Indian E&P assets. Petrogas E&P was awarded (under NELP VI) three exploration blocks in India (viz MB-OSN-2004/1, MB-OSN-2004/2 & KG-ONN-2004/2 as a part of the consortium. In all three blocks it has a working interest of 20%. Petrogas is the operator for the block MB-OSN-2004/2
MB-OSN-2004/1 block is a large block with a sur-face area of 1,520 km2 and the block sits within water depths up to 20 meters. The operator of MB-OSN-2004/1 is Gujarat State Petroleum Corporation. GAIL (India) Limited, Hindustan Petroleum Corporation Limited and Indian Oil Corporation are the non-op-erating partners along with Petrogas E&P. 3 firm wells are planned to be drilled in the first exploration phase (4 years)
MB-OSN-2004/2 block is located in the eastern edge of the Mumbai Basin with a surface area of 741 km2 and sits within water depths ranging from about 30 meters to 60 meters. The prolific Neelam and Heera fields are located to the north and west respectively, and the Ratna and R series fields to the south. Petrogas E&P is operator in MB-OSN-2004/2, with GAIL (India)

�0
egypt
Petrogas E&P recently acquired 30% equity in Area A block in Egypt. The block comprises of two exploration concessions and four development leases situated on-shore along the western flank of Gulf of Suez, Egypt. Oil Search is the operator of the block with 70% inter-est. The block comprises a number of mature fields and exploration prospects. Reservoirs in the producing fields are mainly in the Tertiary, whilst ongoing explo-ration is largely targeted a deeper Cretaceous objec-tive. It is a service contract with GPC, Egypt whereby the contractor is paid a service fee against incremental production above a designated baseline.
portfolio suMMary
The Oil and Gas portfolio summary of Petrogas E&P LLC owned directly or through its subsidiary company is as follows:
Blocks Company status Acreage (KM2) Current Prodn (BOPD)* Remarks
Block 7, Onshore Oman 100% stake and operator 2331 1600 Producing fields
Block 5 Onshore, Oman 50% Stake and Joint operator (50:50) 992 18000 Producing fields
Block 45 & 48, Onshore Oman
50% stake and non-operator** 2995 & 883 NA Exploration stage
Rima Cluster (part of block 6), onshore Oman
75% stake and operator (contractor to PDO) 1500 2000 Producing fields
Area A, Onshore Egypt 30% and non-operator 350 3000 Producing fields
MB-OSN-2004/2,Offshore, India 20% stake and operator 741 NA Exploration stage
MB-OSN-2004/1 Offshore, India
20% stake and Non-operator 1520 NA Exploration stage
KG-ONN-2004/2, Onshore, India
20% stake and Non-operator 1140 NA Exploration stage
* Approximate figure for the block at the end of Q1, 2008** Petrogas Malih shall operate on behalf of operator for drilling of two wells. (Drilling expected to commence in Q3 2008)

��
growth strategy
The aforementioned asset base gives Petrogas a balanced exploration and development portfolio with international exposure and critical mass for further growth. Our strategy is to evolve Petrogas into a company that will sustain long term profitable growth while creating significant value to all its stakeholders. It plans to grow organically and through acquisitions investing in a disciplined manner to sustain its financial objectives.

HSEIn every respect, I am pleased with our HSE performance. 2007 was LTI-free for staff and contractors in all Petrogas E&P affiliates. This is not to say that we cannot improve and we have set ourselves further challenging targets for 2008.
GrowthAfter sowing seeds in the recent past, end 2007 was harvest time with, in quick succession, a farm-in into Exploration Block 45/48 in Oman operated by Maersk, the acquisition of a 30% interest in producing Area A in Egypt operated by Oil Search and, in January 2008, the award of a service contract for the Rima cluster of small fields by Petroleum Development Oman. Combined with our producing assets in Blocks 5 and 7, Oman, and exploration concessions in India, these acquisitions provide Petrogas with a high-value, balanced, portfolio of assets with material upside. Our assets are in countries with low political risk and track records of respecting contracts; moreover the work commitments do not compromise Petrogas’ financial strength.
OperationsOperations in our two producing concessions, namely Blocks 5 and 7, were at their highest level ever with, at year end, four drilling rigs under contract, 32 wells completed and production facility and infrastructure upgrades in both blocks. A plant to extract NGLs and LPG from the associated gas at Daleel was almost complete, with commissioning scheduled for April 2008.Production was on target at 9434 bopd (working interest), 3% above 2006 level. We did not manage to replace production with additional proved reserves, however, we did appraise >250 million barrels of un-booked resources in the Natih reservoir of Block 5 from which we have already produced more than 1 million barrels oil. I am further pleased to report that Daleel has made two material Exploration discoveries in the eastern part of Block 5 which were immediately put on production contributing more than 1,000 bopd at year’s end from resources of between 60 and 100 million barrels oil. Equally important for both blocks, we embarked on
Ceo review
�2

��
a program of G&G activities in preparation for what promises to be an exciting period of exploration and appraisal drilling in 2008 and 2009.
With Petrogas existing operations being onshore, cost increases for equipment and services, after strict monitoring and control, were able to be contained at < 20%. When confronted with this challenge, Petrogas’ approach has been to emphasize quality and value. In all of our contracts, we are developing with our suppliers a working relationship that gives them opportunities to execute the agreement in a “smarter” way by encouraging them to make suggestions, coming up with ideas and, empowering them to execute the service sensibly rather than to the letter of the contract. As a result, against a (gross) work program and budget for the two blocks of US$ 150 million (capex and opex), the actual expenditure was 3% below budget, with some minor deferral into 2008.
FinanceRevenue was up by 10% at US$ 215 million due to the combined effects of a 6% increase in the oil price at US$ 66/bbl and a 3% increase in production. With expenditure a little below budget, net profit after tax was up by 40% at US$ 52 million.
OutlookIn Oman, Petrogas’ challenge will be to set up the organizations and systems to implement work programs for our two new assets namely Block 45/48
exploration, where Petrogas has been contracted to drill two carry wells that earn us 50% equity, and the Rima cluster of small fields. In the latter, the challenge is to recruit a 50-70 strong organization, develop work programs, contract services, take over the running of the fields in August, 2008 and drill the first new wells before year end; this against a tight market for staff, equipment and services.
In India, the objective is to have a marine 3D seismic survey completed by the end of 2008 and to have awarded a contract for an offshore drilling rig by first quarter of 2009. In Egypt, we will be monitoring the operator’s activities and contributing to plans for 2009 and beyond.
In Blocks 5, 7 and 45/48 we will be eagerly anticipating the results of our exploration and appraisal drilling.
Finally, I could not close the review without expressing my sincere gratitude for the outstanding performance of Petrogas staff and managers. Petrogas is growing and it gives me pride to see that they too are growing with the company.
Jean-Denis BouvierChief Executive Officer
In 2007, Petrogas became a mature International E&P company with substantial
scope for growth. It was involved in the drilling of 32 new wells, the installation of
new production facilities and the upgrading of existing infrastructure. A new office was
established in India, farm-ins were agreed in Oman and Egypt, and a 15 year ‘Small Fields’
development contract won in Oman
“
”

��

��
Corporate and finanCials IN 2007
Strengthening Petrogas E&P’s corporate office was a major objective for 2007 and, as a result of a focused effort by all concerned, our management system has been expanded to cover all aspects of the business, not to mention the least HSE, HR, procurement, com-mercial and finance. Particular attention was paid to corporate governance to ensure that appropriate checks and balances and adequate reporting structure required for monitoring the performance of the Com-pany’s affiliates’ and subsidiaries, are in place. By end 2007, Petrogas E&P employed over 200 staff, some 80 directly, many of them in senior professional and management positions.
Average Oman export oil price in 2007 increased by 6% to US$66 per barrel compared to US$62 per barrel in 2006, while oil production (working interest/gross) was up from the previous year of 9,186 / 16,718 bopd to 9,434 bopd /17,129 bopd in Year 2007. Ex-penditure was on budget, reaching some US$ 90 Mil-lion (working interest) and the annual revenue reached a record US$ 215 Million. Consistent with these fig-ures, and for the fifth consecutive year, Petrogas con-solidated net profit increased over the previous year to reach US$ 52 Million, 40% up compared to 2006.
Petrogas E&P Revenue 2000-2007
2000 2001 2002 2003 2004 2005 2006 2007
250
200
150
100
50
0
US$
millio
n
Petrogas E&P Net Profit 2000-2007
hse
2007 has been an exceptionally good year as Daleel Petroleum was LTI free and Petrogas LLC completed in June 2008, 1000 days LTI free operations for staff and contractors.
OPERATIONS IN 2007
Development and ProductionPetrogas operations in 2007 were the highest ever with expenditure reaching US $90.0 Million most of it be-ing CAPEX allocated to the drilling and completion of some 30 wells. It is reassuring to note that while some activities were deferred or cancelled, Petrogas activities being mostly onshore, the effect of global increase in the cost of commodities, equipment and services could be relatively contained.
In Block 5, 2007 saw continued implementation of wa-ter flood and appraisal of Natih resources in Block 5. The construction of the gas project facilities in Block 5 was almost completed. The NGL and LPG gas plant is expected to be commissioned early 2008. Post explor-atory success in BRW-1 and BR-3 in Bushra cluster in Block 5, a comprehensive prospect portfolio has been developed and ranked
2000 2001 2002 2003 2004 2005 2006 2007U
S$
millio
n
60
50
40
30
20
10
0
2007 Review

��
In Block 7, several side tracks & work over jobs were completed to increase production from 1650 bopd to 1750 bopd in 2007. The main challenges to increase production is artificial lift optimization combining gas lift, ESP and Beam Pumps taking into account individual well production performance, gas availability and the depth of the reservoir which, at 3200 m makes it the deepest in Oman for ESP and Beam Pump. While the reliability of artificial lifting equipment has improved over time, under those circumstances, minimizing un-scheduled downtime remains a challenge.
Petrogas E&P Expendiure (MM US$) 2000-2007
Working Interest Production 2000-2007
In Block 7, reserves additions (2P) in the Ramlat fields, have resulted in a reserves replacement over production ratio to be around 1. As for Block 5, studies for thorough appraisal and reserve estimation for the Daleel Natih accumulations and the recent discoveries in the Bushra cluster are ongoing and hence no additional reserves were formally booked in 2007 against these commercial resources. At end 2007 Petrogas E&P LLC has proved and probable oil reserves (working interest basis) of around 55 Million barrels. In 2007 Daleel Petroleum has completed a field development plan for Daleel Oil Field, Shuaiba reservoir confirming the merit of extending the currently implemented water flood project to all blocks. Appraisal of the Natih resource continued and the STOIIP is now estimated to be in excess of 250 MM bbls. To date over 1.0 MM barrels of oil have been produced and, currently, 10 wells produce some 2000 bopd. With the exception of two accumulations with good reservoir and relatively light oil allowing wells to initially free flow, pro-duction requires artificial lift from the onset. For the “light oil accumulations”, a pilot waterflood may be imple-mented in 2008. While limited reserves can be booked until a comprehensive FDP is completed, the size of the STOIIP and the production performance so far indicate a substantial contingent resource.
Exploration
In Block 7 old vintages seismic data were acquired from PDO and from Total/Elf and more than 4000 km of old vintage seismic lines were prepared for reprocessing. Also a geochemical study had been carried out to help de-risk Sahmah Deep gas prospect. In Block 5 a compre-hensive exploration study was developed to review the geological model of the hydrocarbon system, review the existing leads and advise on forward exploration drilling strategy. A total of 13 exploration leads are identified at UHS level and the existing 16 Natih prospects were also reviewed. The potential reserves of all the leads for both reservoir levels are expected to be more than 400 MMstb STOIP. Drilling of the leads started in the second half of 2007 and has resulted in 2 commercial discover-ies in Bushra clusters. Early development facilities were put in place to start production immediately with the oil trucked to the main Daleel facilities.
2000 2001 2002 2003 2004 2005 2006 2007
100
75
50
25
0
Block 7 - Petrogas LLC Block 5 - MPSAOC
US$
millio
n
2000 2001 2002 2003 2004 2005 2006 2007
BO
PD
7500
10000
5000
2500
0
Block 7 Block 5

��
suMMary
Looking forward to the next five years, considerable technical effort and expenditure will be devoted to real-ize the potential of our existing assets with infill drill-ing and the expansion of water flood projects in our producing fields as well as in study work to mature re-sources into reserves. Specifically, in Block 5, a total of some 118 exploration, appraisal and producing wells as well as some 82 water injection wells will be drilled as result of which production is expected to reach some 30,000 bopd by 2012.
As for Block 7, drilling will continue with several side-tracks in Sahmah, and appraisal and development wells in Rija and Ramlat fields.
The Rima cluster of small fields will provide plenty of challenges and opportunities to raise production to the level we have committed.
In Exploration, for the first time, a potentially high value adding drilling program will be implemented in Block 5, 7 and 45/48. In India, 2008 will see around 3000 km2 of 3 D seismic acquired and interpreted to support the drilling of 11 Exploration commitment wells starting in 2009. Finally, in Egypt Area A, development drilling shall undertake to exploit resources from producing fields and 2 to 4 exploration wells are planned to be drilled.
On new business development, Petrogas shall continue to selectively analyze opportunities to add to its exist-ing asset base focusing activities in the Middle East, Af-rica and the Indian sub-continent. With a well balanced portfolio of producing assets and Exploration prospects, as well as its experienced workforce and a successful track record in value adding acquisition, Petrogas is well placed to realize its growth strategy.
CORPORATE AND FINANCIALS IN 2008
With an effective and value adding governance system in place, Petrogas E&P is well placed for a seamless im-plementation of its growth strategy. However the major
challenge remains in further bolstering the manpower resources, one that Petrogas E&P is determined to take up and overcome, for the benefit of all its stakehold-ers. Financially, 2008 should see higher revenue as a result of higher oil price and higher production. Profits in 2008 are estimated to be lower than in 2007 on the account of the acquisition costs of the Area - A, Egypt participation and high risk capital investment in explo-ration. Yet, this investment in seismic acquisition, drill-ing, facilities and infrastructure is estimated to result in increased reserves, production, revenue and profit, adding material value to the company in future.
Petrogas E&P Revenue 2008-2012 @ oil price 80$/bbl
OPERATIONS IN 2008
Petrogas operations in 2008, including exploration, and new acquisitions are budgeted at US$ 170 Mil-lion. The bulk of the capital expenditure will go towards drilling some 36 wells in Block 5 to accelerate the im-plementation of the water flood in the Daleel Shuaiba reservoir as well as further appraisal and development drilling of the large Natih accumulation and Bushra discoveries. On the facilities side, 2008 will see the commissioning of Daleel Gas plant to extract conden-sate and LPG from associated gas. The completion of this project represents a tangible contribution towards energy conservation and emissions reduction for the benefit of the environment.
Outlook for 2008-2012
2008 2009 2010 2011 2012
US$
millio
n
500
400
300
200
100
0

��

��
In Block 7, Petrogas will continue with its systematic well intervention program executing several side tracks and work overs as well as extending peripheral water flood to sustain and possibly increase production. It is also planned to drill up to 2 appraisal wells in Rija and Ramlat fields.
As for the Rima cluster of fields, Petrogas will set up the new company recruiting some 50-70 employ-ees, carry out subsurface reviews for all fields and complete and issue all Tenders required to take op-erations from Q3,2008. Workover and drilling activi-ties will beign soon thereafter.
Petrogas E&P Expenditure 2008 - 2012
Working Interest Production 2008-2012
2008 2009 2010 2011 2012
200
150
100
50
0
Opex Capex
US$
millio
n
2008 2009 2010 2011 2012
BO
PD
20,000
25,000
15,000
10,000
5,000
0
Block 7Rima Block 5
Exploration
In Block 7, the acquisition of 212 km of 2D seismic lines and the reprocessing of more than 4000 km of old vintage 2D data covering the Block 7 will allow detailed evaluation work of the Ramlat field as well as firming up the drilling of the Sahmah-East and Sah-mah Deep gas prospects.
In Block 5, the drilling campaign of the identified pros-pects will continue to test a number of prospects and plays identified in 2007. In Block 45 & 48, the drill-ing of the first well to appraise the Malih discovery is planned for the second half of 2008. In India, the main activity will be to complete the acquisition and process-ing of some 2000 km2 of 3D seismic data in the two offshore blocks and of some 900 km2 of 3D seismic data in the on-land block in the Krishna Godavari Ba-sin. It is also planned to complete and issue before the year’s end the Tender for offshore drilling planned to start by end 2009.
In Egypt, apart from reprocessing and interpretation of seismic data of the adjoining field, 2-4 exploratory wells are planned to be drilled in 2008.

20

Petrogas E&P LLC and its subsidiaries CONSOLIDATED FINANCIAL STATEMENTS
31 DECEMBER 2007

INDEPENDENT AUDITORS’ REPORT TO THE SHAREHOLDERS OF PETROGAS E&P LLC AND ITS SUBSIDIARIES
We have audited the accompanying consolidated financial statements of Petrogas E&P LLC and its subsidiaries (‘the Group’), which comprise the consolidated balance sheet as at 31 December 2007 and the consolidated income statement, consolidated cash flow statement and consolidated statement of changes in equity for the year then ended, and a summary of significant accounting policies and other explanatory notes.
Management’s Responsibility for the Financial StatementsManagement is responsible for the preparation and fair presentation of these consolidated financial statements in accordance with International Financial Reporting Standards. This responsibility includes: designing, implementing and maintaining internal control relevant to the preparation and fair presentation of financial statements that are free from material misstatement, whether due to fraud or error; selecting and applying appropriate accounting policies; and making accounting estimates that are reasonable in the circumstances.
Auditors’ ResponsibilityOur responsibility is to express an opinion on these consolidated financial statements based on our audit. We conducted our audit in accordance with International Standards on Auditing. Those standards require that we comply with ethical requirements and plan and perform the audit to obtain reasonable assurance whether the consolidated financial statements are free from material misstatement.
An audit involves performing procedures to obtain audit evidence about the amounts and disclosures in the financial statements. The procedures selected depend on the auditors’ judgment, including the assessment of the risks of material misstatement of the financial statements, whether due to fraud or error. In making those risk assessments, the auditor considers internal control relevant to the entity’s preparation and fair presentation of the financial statements in order to design audit procedures that are appropriate for the circumstances, but not for the purpose of expressing an opinion on the effectiveness of the entity’s internal control. An audit also includes evaluating the appropriateness of accounting policies used and the reasonableness of accounting estimates made by management, as well as evaluating the overall presentation of the financial statements.
We believe that the audit evidence we have obtained is sufficient and appropriate to provide a basis for our audit opinion.
OpinionIn our opinion, the consolidated financial statements present fairly, in all material respects, the financial position of the Group as of 31 December 2007 and its financial performance and its cash flows for the year then ended in accordance with International Financial Reporting Standards.
DateMuscat
P.O. Box 1750, Ruwi 112Ernst & Young BuildingQurumMuscat, Sultanate of Oman Tel: +968 2455 9559 Fax: +968 2456 [email protected] www.ey.com/meC.R. No. 1/36809/5P.R. No. MH/4
P.O. Box 1750, Ruwi 112Ernst & Young BuildingQurumMuscat, Sultanate of Oman Tel: +968 2455 9559 Fax: +968 2456 [email protected] www.ey.com/meC.R. No. 1/36809/5P.R. No. MH/4
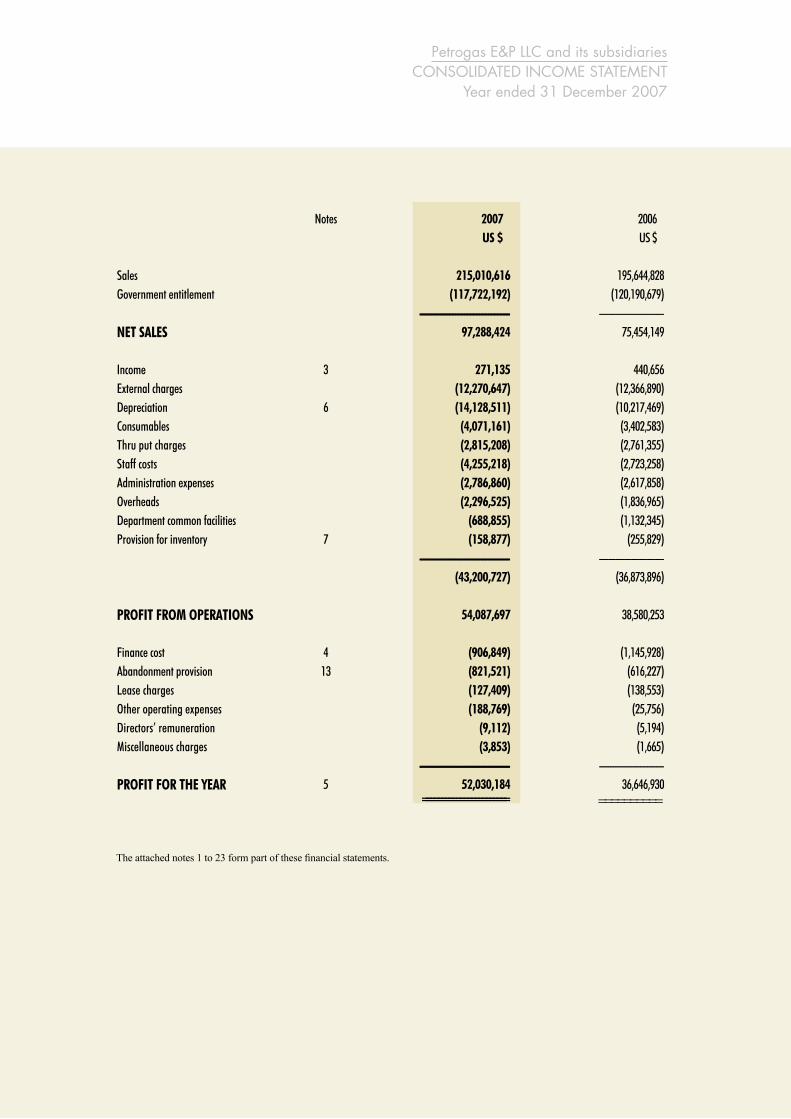
Notes 2007 2006US $ US $
Sales 215,010,616 195,644,828Government entitlement (117,722,192) (120,190,679)
------------------------------ ----------------------------NET SALES 97,288,424 75,454,149
Income 3 271,135 440,656External charges (12,270,647) (12,366,890)Depreciation 6 (14,128,511) (10,217,469)Consumables (4,071,161) (3,402,583)Thru put charges (2,815,208) (2,761,355)Staff costs (4,255,218) (2,723,258)Administration expenses (2,786,860) (2,617,858)Overheads (2,296,525) (1,836,965)Department common facilities (688,855) (1,132,345)Provision for inventory 7 (158,877) (255,829)
------------------------------ ----------------------------(43,200,727) (36,873,896)
PROFIT FROM OPERATIONS 54,087,697 38,580,253
Finance cost 4 (906,849) (1,145,928)Abandonment provision 13 (821,521) (616,227)Lease charges (127,409) (138,553)Other operating expenses (188,769) (25,756)Directors’ remuneration (9,112) (5,194)Miscellaneous charges (3,853) (1,665)
------------------------------ ----------------------------PROFIT FOR THE YEAR 5 52,030,184 36,646,930
======================= ==========
The attached notes 1 to 23 form part of these financial statements.
Petrogas E&P LLC and its subsidiariesCONSOLIDATED INCOME STATEMENT
Year ended 31 December 2007

2007 2006Notes US $ US $
ASSETSNon-current assetsProperty, plant and equipment 6 158,154,836 114,965,295Due from related parties 19 1,200,835 2,037,733Advance towards Joint Venture 8 9,000,000 -
--------------------------------- ------------------------------------168,355,671 117,003,028
--------------------------------- ------------------------------------Current assetsInventories 7 6,006,180 5,191,339Accounts receivable and prepayments 9 26,722,416 22,566,693Bank balances and cash 5,985,087 6,726,647
--------------------------------- ------------------------------------38,713,683 34,484,679
--------------------------------- ------------------------------------TOTAL ASSETS 207,069,354 151,487,707
========================== ============EQUITY AND LIABILITIESEquityShare capital 10 12,987,000 12,987,000Statutory reserve 11 2,610,910 2,610,910Retained earnings 108,140,421 56,110,237
--------------------------------- ------------------------------------Total equity 123,738,331 71,708,147
--------------------------------- ------------------------------------Non-current liabilitiesEmployees’ end of service benefits 12 239,247 167,010Provisions 13 5,375,864 4,554,343Term loans 14 9,383,333 11,366,666Due to related parties 19 23,062,677 2,102,378
--------------------------------- ------------------------------------38,061,121 18,190,397
--------------------------------- ------------------------------------Current liabilitiesAccounts payable and accruals 15 43,286,569 59,722,496Term loan 14 1,983,333 1,866,667
--------------------------------- ------------------------------------45,269,902 61,589,163
--------------------------------- ------------------------------------Total liabilities 83,331,023 79,779,560
--------------------------------- ------------------------------------TOTAL EQUITY AND LIABILITIES 207,069,354 151,487,707
========================== ============
The financial statements were authorised for issue in accordance with a resolution of the directors on ____________________
Chairman Chief Executive Officer
The attached notes 1 to 23 form part of these financial statements.
Petrogas E&P LLC and its subsidiariesCONSOLIDATED BALANCE SHEETAt 31 December 2007

2007 2006Notes US $ US $
OPERATING ACTIVITIESProfit for the year 52,030,184 36,646,930Adjustments for:
Depreciation 6 14,128,511 10,217,469Abandonment provision 13 821,521 616,227Provision for employees’ end of service benefits 12 123,235 80,760Interest income 3 (122,999) (440,656)Interest expense 4 906,849 1,145,928
--------------------------------- ------------------------------------67,887,301 48,266,658
Working capital changes:Inventories (814,841) (1,821,580)Accounts receivable and prepayments (4,155,723) (21,088,881)Accounts payable and accruals (16,435,927) 5,220,625
--------------------------------- ------------------------------------Cash from operations 46,480,810 30,576,822Employee's end of service benefit paid 12 (50,998) (29,760)Interest paid 4 (906,849) (1,145,928)
--------------------------------- ------------------------------------Net cash from operating activities 45,522,963 29,401,134
INVESTING ACTIVITIESPurchase of property, plant and equipment 6 (57,318,052) (29,403,861)Proceeds from disposal of property, plant and equipment - 4,803Adjustments to property, plant and equipment - 769,422Interest income 3 122,999 440,656Net funding to related parties (long term) 21,797,197 (6,661,997)Advance towards Joint Venture (9,000,000) -
--------------------------------- ------------------------------------Net cash used in investing activities (44,397,856) (34,850,977)
--------------------------------- ------------------------------------FINANCING ACTIVITIESDividends paid - (18,832,000)Repayment of term loans (1,866,667) (1,766,667)
--------------------------------- ------------------------------------Net cash used in financing activities (1,866,667) (20,598,667)
--------------------------------- ------------------------------------DECREASE IN CASH (741,560) (26,048,510)
Cash at 1 January 6,726,647 32,775,157--------------------------------- ------------------------------------
CASH AT 31 DECEMBER 5,985,087 6,726,647========================== ============
The attached notes 1 to 23 form part of these financial statements.
Petrogas E&P LLC and its subsidiariesCONSOLIDATED STATEMENT OF CASH FLOW
Year ended 31 December 2007

Sharecapital
StatutoryReserve
Retainedearnings Total
US $ US $ US $ US $
Balance at 31 December 2006 12,987,000 983,965 39,922,252 53,893,217
Profit for the year - - 36,646,930 36,646,930Dividend paid - - (18,832,000) (18,832,000) Transfer to statutory reserve (note 11) - 1,626,945 (1,626,945) -
--------------------------- --------------------------- ----------------------------- -------------------------------Balance at 31 December 2006 12,987,000 2,610,910 56,110,237 71,708,147
Profit for the year - - 52,030,184 52,030,184--------------------------- --------------------------- ----------------------------- -------------------------------
Balance at 31 December 2007 12,987,000 2,610,910 108,140,421 123,738,331--------------------------- --------------------------- ----------------------------- -------------------------------
The attached notes 1 to 23 form part of these financial statements.
Petrogas E&P LLC and its subsidiariesCONSOLIDATED STATEMENT OF CHANGES IN EQUITYYear ended 31 December 2007

Petrogas E&P LLC and its subsidiariesNOTES TO THE CONSOLIDATED FINANCIAL STATMENTS
AT 31 December 2007
1 ACTIVITIES
Petrogas E&P LLC and its subsidiaries (the group) are primarily engaged in oil and gas exploration and production activities. The Group’s registered address is PO Box 353, Postal code 112, Ruwi, Sultanate of Oman. The group’s ultimate parent is MB Holdings Co LLC, a limited liability company registered in the Sultanate of Oman.
2 SIGNIFICANT ACCOUNTING POLICIES
Basis of preparationThe consolidated financial statements have been prepared in accordance with International Financial Reporting Standards and applicable requirements of the Commercial Companies Law of the Sultanate of Oman.
The consolidated financial statements have been presented in US Dollars.
The financial statements are prepared under the historical cost convention.
Basis of consolidation The consolidated financial statements comprise the financial statements of Petrogas E&P LLC (the parent company) and its subsidiaries as at 31 December 2007. The financial statements of the subsidiaries are prepared for the same reporting year as the parent company, using consistent accounting policies.
All intra-group balances, transactions, income and expenses and profits and losses resulting from intra-group transactions that are recognised in assets, are eliminated in full. Subsidiaries are fully consolidated from the date of acquisition, being the date on which Group obtains control, and continue to be consolidated until the date that such control ceases.
International Accounting Standards Board (IASB) Standards and Interpretations issued but not adoptedThe IASB Standards and Interpretations that have been issued but are not yet mandatory, and have not been adopted by the group, are not expected to have a material impact on the group's financial statements.
Changes in accounting policiesThe accounting policies are consistent with those used in the previous financial year except as follows:
The group has adopted the following new and amended IFRS during the year. Adoption of these revised standards did not have any effect on the financial performance or position of the group. They did however give rise to additional disclosures.
• IFRS 7 Financial instruments: Disclosures• IAS 1 Amendment – Presentations of Financial Statements
The principal effects of these changes are as follows:
IFRS 7 Financial instruments: Disclosures
This standard requires disclosures that enable users of the financial statements to evaluate the significance of the groups’ financial instruments and the nature and extent of risks arising from those financial instruments. The new disclosures are included throughout the financial statements. While there has been no effect on the financial position or results, comparative information has been revised where needed.
IAS 1 Presentation of Financial Statements
This amendment requires the group to make new disclosures to enable users of the financial statements to evaluate the group’s objectives, policies and processes for managing capital. These new disclosures are shown in Note 21.

Petrogas E&P LLC and its subsidiariesNOTES TO THE CONSOLIDATED FINANCIAL STATMENTS AT 31 December 2007
2 SIGNIFICANT ACCOUNTING POLICIES (continued)
Revenue recognitionSales represents the gross invoiced value of crude oil sold during the year.
Interest revenue is recognised as the interest accrues.
Government entitlementGovernment entitlement represents reimbursement to Governments of their entitlement under petroleum agreements, of oil production sold by the group.
TaxationTaxation is provided in accordance with Omani fiscal regulations.
Property, plant and equipmentOil and gas exploration and producing tion and development activities under production sharing agreements which entitle it to a contractual portion of the oil and gas production to reimburse its operating, exploration and development costs (cost oil). In addition the group is entitled to share a portion of the net oil and gas production subject to the terms of the agreement (profit oil). Exploration and development costs incurred under these agreements are accounted for by applying the successful efforts method of accounting as described below:
- Exploration costsGeological and geophysical costs are expensed in the year incurred. Drilling in progress and completed wells where reserves are discovered in commercial quantities are capitalised. Costs of exploratory drilling that have not resulted in discoveries of reserves in commercial quantities are expensed.
- Fields under development and in productionDevelopment costs that relate to the acquisition and installation of production facilities, development drilling costs and applicable exploration costs are capitalised.
Other property, plant and equipmentOther property, plant and equipment is stated at cost less accumulated depreciation and any impairment in value.
Oil and gas producing assets are depreciated using the unit-of-production method by field.
Depreciation is calculated on a straight line basis over the estimated useful lives of other property, plant and equipment as follows:
Plant and equipment 3 yearsComputer equipment 3 yearsFurniture and fixtures 5 yearsVehicles 3 years
The carrying values of property, plant and equipment are reviewed for impairment when events or changes in circumstances indicate the carrying value may not be recoverable. If any such indication exists and where the carrying values exceed the estimated recoverable amount, the assets are written down to their recoverable amount, being the higher of their fair value less costs to sell and their value in use.
Impairment and uncollectibility of financial assetsAn assessment is made at each balance sheet date to determine whether there is objective evidence that a specific financial asset may be impaired. If such evidence exists, any impairment loss is recognised in the income statement. Impairment is determined as follows:
(a) For assets carried at fair value, impairment is the difference between cost and fair value, less any impairment loss previously recognised in the income statement;
(b) For assets carried at cost, impairment is the difference between carrying value and the present value of future cash flows discounted at the current market rate of return for a similar financial asset.

Petrogas E&P LLC and its subsidiariesNOTES TO THE CONSOLIDATED FINANCIAL STATMENTS
AT 31 December 2007
2 SIGNIFICANT ACCOUNTING POLICIES (continued)
InventoriesInventories are stated at the lower of cost and net realisable value. Costs are those expenses incurred in bringing each item to its present location and condition calculated on a weighted average basis.
Net realisable value is based on estimated selling price less any further costs expected to be incurred on disposal.
Term loansTerm loans are carried on the balance sheet at their principal amount. Instalments due within one year are shown as a current liability. Interest is charged as an expense as it accrues, with unpaid amounts included in “accounts payable and accruals”.
Accounts receivableAccounts receivable are stated at original invoice amount less an allowance for any uncollectible amounts. An estimate for doubtful debts is made when collection of the full amount is no longer probable. Bad debts are written off when there is no possible for recovery.
Cash and cash equivalentsFor the purpose of the statement of cash flows, cash and cash equivalents consist of cash and bank balances.
Accounts payable and accrualsLiabilities are recognised for amounts to be paid in the future for goods or services received, whether billed by the supplier or not.
Provisions Provisions are recognised when the company has an obligation (legal or constructive) arising from a past event, and the costs to settle the obligation are both probable and able to be reliably measured.
The group accrues for estimated abandonment and site restoration costs of oil exploration and producing properties on a unit of production basis.
LeasesOperating lease payments are recognised as an expense in the income statement on a straight line basis over the lease term.
Employees’ end of service benefitsPayment is made to the Omani Government Public Authority for Social Insurance scheme under Royal Decree 72/91 for Omani employees.
Accrual is made for amounts payable under the Oman labour law applicable to non Omani employees’ accumulated periods of service as of the balance sheet date.
Interest in a joint ventureThe group’s interest in its joint venture is accounted for by proportionate consolidation, which involves recognising a proportionate share of the joint venture’s assets, liabilities, income and expenses with similar items in the financial statements on a line-by-line basis.
Foreign currenciesTransactions in foreign currencies are recorded in US Dollars at the rate ruling at the date of the transaction. Monetary assets and liabilities denominated in foreign currencies are retranslated at the rates of exchange ruling at the balance sheet date. All differences are taken to the income statement.
Fair valuesThe fair value of interest-bearing items is estimated based on discounted cash flows using interest rates for items with similar terms and risk characteristics.

Petrogas E&P LLC and its subsidiariesNOTES TO THE CONSOLIDATED FINANCIAL STATMENTS AT 31 December 2007
Petrogas E&P LLC and its subsidiariesNOTES TO THE CONSOLIDATED FINANCIAL STATMENTS AT 31 December 2007
2007 2006
US $ US$
Interest income 122,999 440,656Other income 148,136 -
--------------------------------- ------------------------------------271,135 440,656
=============== =============
3 OTHER INCOME
2007 2006US $ US$
Term loans interest 872,000 1,064,256Other finance costs 34,849 81,672
--------------------------------- -------------------------------------Finance costs 906,849 1,145,928
--------------------------------- -------------------------------------
4 FINANCE COSTS
5PROFIT FOR THE YEAR
2007 2006
US $ US$
Staff costs 6,169,268 4,710,078--------------------------------- -------------------------------------
The profit for the year is stated after charging:

Petrogas E&P LLC and its subsidiariesNOTES TO THE CONSOLIDATED FINANCIAL STATMENTS
AT 31 December 2007
6 PR
OPER
TY, P
LANT
AND
EQU
IPM
ENT
Plan
t and
equip
ment
Vehic
lesCo
mpute
r eq
uipme
ntFu
rnitu
rean
d fixtu
res
Explo
ratio
nan
d pr
oduc
tion
Drilli
ngco
sts in
prog
ress
Total
US $
US $
US $
US $
US $
US $
US $
Cost At
1 Ja
nuar
y 200
71,5
34,36
654
9,801
1,011
,447
159,5
2413
6,805
,095
5,627
,270
145,6
87,50
3Ad
dition
s40
2,640
133,3
1819
7,237
59,97
131
,443,5
0525
,081,3
8157
,318,0
52Tr
ansfe
rs-
- -
- 2,2
81,91
7(2
,281,9
17)
- ---
------
------
------
-----
------
------
------
-----
------
------
------
-----
------
------
------
-----
------
------
------
-----
------
------
------
-----
------
------
------
--Ba
lanc
e at
31
Dece
mbe
r 200
71,
937,
006
683,
119
1,20
8,68
421
9,49
517
0,53
0,51
728
,426
,734
203,
005,
555
====
====
====
====
====
====
====
====
====
====
====
====
====
====
====
====
====
==De
preci
ation
At 1
Janu
ary 2
007
(749
,294)
(316
,721)
(875
,843)
(87,0
20)
(28,6
93,33
0)-
(30,7
22,20
8)De
prec
iatio
n ch
arge
for t
he ye
ar(4
06,1
31)
(90,
407)
(102
,617
)(3
2,32
1)(1
3,49
7,03
5)-
(14,
128,
511)
------
------
------
-----
------
------
------
-----
------
------
------
-----
------
------
------
-----
------
------
------
-----
------
------
------
-----
------
------
------
-----
At 3
1 De
cem
ber 2
007
(1,1
55,4
25)
(407
,128
)(9
78,4
60)
(119
,341
)(4
2,19
0,36
5)-
44,8
50,7
19==
====
====
====
====
====
====
====
====
====
====
====
====
====
====
====
====
====
Net c
arryi
ng am
ount
At 3
1 De
cem
ber 2
007
781,
581
275,
991
230,
224
100,
154
128,
340,
152
28,4
26,7
3415
8,15
4,83
6==
====
====
====
====
====
====
====
====
====
====
====
====
====
====
====
====
====

Petrogas E&P LLC and its subsidiariesNOTES TO THE CONSOLIDATED FINANCIAL STATMENTS AT 31 December 2007
6 PR
OPER
TY, P
LANT
AND
EQU
IPM
ENT
(cont
inue
d)
Plan
t and
equip
ment
Vehic
lesCo
mpute
r eq
uipme
ntFu
rnitu
rean
d fixtu
res
Explo
ratio
nan
d pr
oduc
tion
Drilli
ngco
sts in
prog
ress
Total
US $
US $
US $
US $
US $
US $
US $
Cost At
1 Ja
nuar
y 200
684
7,419
289,8
4594
2,930
136,0
0911
1,886
,565
2,959
,585
117,0
62,35
3Ad
dition
s68
6,947
259,9
5668
,517
32,80
423
,406,5
274,9
49,11
029
,403,8
61Di
spos
als-
- -
(9,28
9)-
- (9
,289)
Tran
sfers
- -
- -
2,281
,425
(2,28
1,425
)-
Adjus
tmen
ts (n
ote 16
)-
- -
- (7
69,42
2)-
(769
,422)
------
------
------
-----
------
------
------
-----
------
------
------
-----
------
------
------
-----
------
------
------
-----
------
------
------
-----
------
------
------
-----
Bala
nce
at 3
1 De
cem
ber 2
006
1,53
4,36
654
9,80
11,
011,
447
159,
524
136,
805,
095
5,62
7,27
014
5,68
7,50
3
====
====
====
====
====
====
====
====
====
====
====
====
====
====
====
====
====
==De
preci
ation
At 1
Janu
ary 2
006
(408
,940)
(223
,094)
(743
,395)
(66,7
89)
(19,0
67,00
7)-
(20,5
09,22
5)De
preci
ation
char
ge fo
r the
year
(340
,354)
(93,6
27)
(132
,448)
(24,7
17)
(9,62
6,323
)-
(10,2
17,46
9)Re
lating
to di
spos
als-
- -
4,486
- -
4,486
------
------
------
-----
------
------
------
-----
------
------
------
-----
------
------
------
-----
------
------
------
-----
------
------
------
-----
------
------
------
-----
At 3
1 De
cem
ber 2
006
(749
,294
)(3
16,7
21)
(875
,843
)(8
7,02
0)(2
8,69
3,33
0)-
(30,
722,
208)
====
====
====
====
====
====
====
====
====
====
====
====
====
====
====
====
====
==Ne
t car
rying
amou
ntAt
31
Dece
mbe
r 200
678
5,07
223
3,08
013
5,60
472
,504
108,
111,
765
5,62
7,27
011
4,96
5,29
5
====
====
====
====
====
====
====
====
====
====
====
====
====
====
====
====
====
==
Petrogas E&P LLC and its subsidiariesNOTES TO THE CONSOLIDATED FINANCIAL STATMENTS
AT 31 December 2007
As at 31 December 2007 none of the trade receivables were impaired or past due (2006 : same).
Unimpaired receivables are expected, on the basis of past experience, to be fully recoverable. It is not the practice of the group to obtain collateral over receivables and the vast majority are, therefore, unsecured.
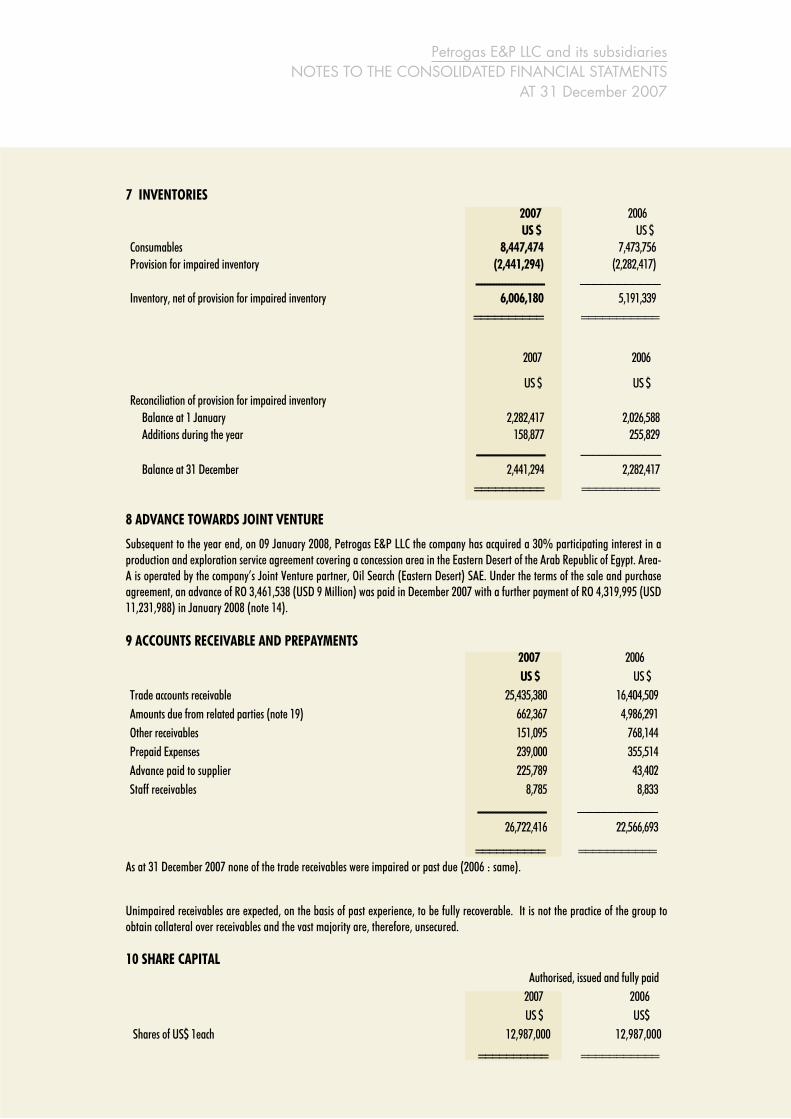
7 INVENTORIES2007 2006US $ US $
Consumables 8,447,474 7,473,756Provision for impaired inventory (2,441,294) (2,282,417)
----------------------- -----------------------------------Inventory, net of provision for impaired inventory 6,006,180 5,191,339
========== ===========
2007 2006
US $ US $Reconciliation of provision for impaired inventory
Balance at 1 January 2,282,417 2,026,588Additions during the year 158,877 255,829
----------------------- -----------------------------------Balance at 31 December 2,441,294 2,282,417
========== ===========
8 ADVANCE TOWARDS JOINT VENTURE
Subsequent to the year end, on 09 January 2008, Petrogas E&P LLC the company has acquired a 30% participating interest in a production and exploration service agreement covering a concession area in the Eastern Desert of the Arab Republic of Egypt. Area-A is operated by the company’s Joint Venture partner, Oil Search (Eastern Desert) SAE. Under the terms of the sale and purchase agreement, an advance of RO 3,461,538 (USD 9 Million) was paid in December 2007 with a further payment of RO 4,319,995 (USD 11,231,988) in January 2008 (note 14).
9 ACCOUNTS RECEIVABLE AND PREPAYMENTS2007 2006US $ US $
Trade accounts receivable 25,435,380 16,404,509Amounts due from related parties (note 19) 662,367 4,986,291Other receivables 151,095 768,144Prepaid Expenses 239,000 355,514Advance paid to supplier 225,789 43,402Staff receivables 8,785 8,833
----------------------- -----------------------------------26,722,416 22,566,693
========== ===========
10 SHARE CAPITALAuthorised, issued and fully paid
2007 2006US $ US$
Shares of US$ 1each 12,987,000 12,987,000
========== ===========

Petrogas E&P LLC and its subsidiariesNOTES TO THE CONSOLIDATED FINANCIAL STATMENTS AT 31 December 2007
11 STATUTORY RESERVE
As required by the Commercial Companies Law of the Sultanate of Oman, 10% of the parent company’s profits for the year has to be transferred to a statutory reserve. No transfer has been made in the current year as the parent company has incurred a loss. The parent company may resolve to discontinue such annual transfers when the reserve totals one third of issued share capital. The reserve is not available for distribution.
12 EMPLOYEES’ END OF SERVICE BENEFITS
2007 2006
US $ US$
Movements in the liability recognised in the balance sheet are as follows:Provision as at 1 January 167,010 116,010Provided during the year 123,235 80,760End of service benefits paid (50,998) (29,760)
----------------------- -------------------------------Provision as at 31 December 239,247 167,010
----------------------- -------------------------------
13 PROVISIONS
Abandonment cost provision:2007 2006US $ US$
Balance as at 1 January 4,554,343 3,938,116Provided during the year 476,280 616,227Unwinding of discount 345,241 -
----------------------- -------------------------------Balance as at 31 December 5,375,864 4,554,343
----------------------- -------------------------------
In accordance with IAS 37, a provision of US $ 5,375,864 has been recognised for abandonment costs. Of these costs, US$ 2,985,739 and US$ 2,390,125 are expected to be incurred in 2015 and 2028 respectively. The provision has been estimated using existing technologies, at current prices and discounted using a real discount rate of 7.5%.
14 TERM LOANS2007 2006US $ US$
Term loan 11,366,666 13,233,333Less: Current portion classified under current liabilities (1,983,333) (1,866,667)
----------------------- -------------------------------9,383,333 11,366,666
----------------------- -------------------------------
The term loan is in US Dollars, secured over the Group’s revenue and carries an effective annual interest rate of 3 months LIBOR + 1.9% p.a. The loan is repayable in twenty-eight quarterly instalments commencing from January 2006. The final instalment is due on October 2012. Interest accrues and is paid on a monthly basis.

Petrogas E&P LLC and its subsidiariesNOTES TO THE CONSOLIDATED FINANCIAL STATMENTS
AT 31 December 2007
15 ACCOUNTS PAYABLE AND ACCRUALS2007 2006US $ US$
Other payables 15,812,218 43,357,881Amounts due to related parties (note 19) 6,226,460 1,111,659Accrued expenses 6,975,252 6,675,962Trade accounts payable 14,272,639 8,494,072Payable to Joint Venture partner - 82,922
----------------------- -------------------------------43,286,569 59,722,496
========== ==========
16 NET PROVED OIL RESERVE QUANTITIES2007 2006
Thousand Thousandbarrels barrels
Net proved reserves acquired at 1 January: Proved developed reserves 14,324 12,745 Proved undeveloped reserves 24,593 29,647
----------------------- -------------------------------38,917 42,392
----------------------- -------------------------------Changes during the year: Revisions of previous estimates – developed reserves 1,194 - Revisions of previous estimates – undeveloped reserves (399) (463) Transfer to developed reserves (935) 4,591 Transfer from undeveloped reserves (740) (4,591) Production (3,158) (3,012)
----------------------- -------------------------------34,879 38,917
========== ==========Net proved reserves at 31 December: Proved developed reserves 11,425 14,324 Proved undeveloped reserves 23,454 24,593
----------------------- -------------------------------34,879 38,917
========== ==========

Petrogas E&P LLC and its subsidiariesNOTES TO THE CONSOLIDATED FINANCIAL STATMENTS AT 31 December 2007
17 JOINT VENTURE
The Group has a 50% interest in Daleel Petroleum Company LLC, which is engaged in the operation and management of oil and gas exploration and production activities of Block 5 in Sultanate of Oman.
The Group’s share of the assets, liabilities, revenue and expenses of the joint venture, which are included in the consolidated financial statements, are as follows at 31 December and for the years then ended:
2007 2006US $ US $
Current assets 7,422,925 4,483,594Current liabilities 6,891,209 4,016,776Net profit 67,265 51,181
Daleel Petroleum LLC (Daleel),a joint venture operator with one of the group companies, had in prior years performed drilling and production activities on a neighbouring concession area operated by Occidental of Oman Inc. (Occidental) – during the period from 2004 to 2006.
As a result, a settlement agreement (the agreement) was signed between Occidental, Daleel and the Ministry of Oil and Gas representing the Government of the Sultanate of Oman, on 6 January 2007. In accordance with the terms of the agreement, Occidental is entitled to compensation relating to its share of production from three affected wells, net of a share of related operating cost and capital expenditure incurred by Daleel.
The ownership of one well was transferred to Occidental on 31 December 2006. A settlement was reached in July 2007 for the second well whereby Daleel was absolved of all liabilities pertaining to this well. The remaining well continues to be operated by Daleel under a production sharing agreement with Occidental and all applicable revenues and costs in relation to this well pertaining to 2007 production have been recorded as attributable to Occidental.
The company has accounted for the amounts involved in the financial statements for the year ended 31 December 2006, prospectively in accordance with IAS 8. Accordingly, revenue and operating cost for the year ended 31 December 2006, and property, plant and equipment at 31 December 2006 have been reduced by RO 3,665,734 RO 336,030 and RO 295,843 (US $ 9,521,388, US $ 872,806 and US $ 769,422) respectively.
18 CONTINGENCIES
At 31 December 2007 the group had contingent liabilities in respect of bank and other guarantees and other matters arising in the ordinary course of business from which it is anticipated that no material liabilities will arise, amounting to RO 692,308 (US $ 1,800,000) and for 2006 RO 519,230 ( US $ 1,350,000).
19 RELATED PARTY TRANSACTIONS
Related parties represent associated companies, major shareholders, directors and key management personnel of the Group, and entities controlled, jointly controlled or significantly influenced by such parties. Pricing policies and terms of these transactions are approved by the Group’s management.
Transactions with related parties included in the income statement are as follows: 2007 2006
Purchases/ expenses
Income Purchases/ expenses
Income
US$ US$ US$ US$
Other related parties 26,926,866 14,977,277---------------------- ----------------------- ----------------------- -----------------------

Petrogas E&P LLC and its subsidiariesNOTES TO THE CONSOLIDATED FINANCIAL STATMENTS
AT 31 December 2007
19 R
ELAT
ED P
ARTY
TRA
NSAC
TION
S (co
ntin
ued)
Balan
ces w
ith re
lated
parti
es in
clude
d in t
he ba
lance
shee
t are
as fo
llows
:
2007
2006
Trad
e re
ceiva
bles
Trad
e pa
yabl
esNo
n cu
rrent
re
ceiva
bles
Non
curre
nt
paya
bles
Trad
e re
ceiva
bles
Trad
e pay
ables
Non c
urre
nt
recei
vable
sNo
n cur
rent
pa
yable
sUS
$US
$US
$US
$US
$US
$US
$US
$
Asso
ciated
comp
anies
10,5
90-
- -
- -
364,5
71-
Major
shar
ehold
ers
- -
- 23
,062
,677
4,866
,785
33,88
2
184,7
94-
Dire
ctors
and k
ey m
anag
emen
t per
sonn
el-
- -
- -
15,50
0-
- Ot
her r
elated
parti
es65
1,77
76,
226,
460
1,20
0,83
5-
119,5
061,0
62,27
71,4
88,36
82,1
02,37
8 ---
------
------
------
----
------
------
-----
------
------
------
----
------
------
------
------
--------
--------
--------
--------
--------
------
--------
--------
--------
--------
--------
--66
2,36
76,
226,
460
1,20
0,83
523
,062
,677
4,986
,291
1,111
,659
2,037
,733
2,102
,378
------
------
------
----
------
------
------
-----
------
------
------
----
------
------
-----
--------
--------
--------
--------
--------
------
--------
--------
--------
--------
--------
------
Com
pens
ation
of ke
y man
agem
ent p
erso
nnel
The r
emun
erat
ion of
dire
ctors
and o
ther
mem
bers
of ke
y man
agem
ent d
uring
the y
ear w
as as
follo
ws:
2007
2006
US $
US$
Shor
t-ter
m be
nefit
s32
6,66
125
9,896
Emplo
yees
’ end
of se
rvice
bene
fits
26,1
1955
,335
------
------
------
------
--------
--------
----35
2,78
031
5,231
------
------
------
------
--------
--------
----
Outst
andin
g bala
nces
at th
e yea
r-end
arise
in th
e nor
mal
cour
se of
busin
ess.
For t
he ye
ar en
ded 3
1 Dec
embe
r 200
7, th
e gro
up ha
s not
reco
rded
any i
mpa
irmen
t of a
mou
nts o
wed b
y rela
ted pa
rties
(200
6: ni
l).

Petrogas E&P LLC and its subsidiariesNOTES TO THE CONSOLIDATED FINANCIAL STATMENTS AT 31 December 2007
20 COMMITMENTS
Investment commitmentAs of 31 December 2007, Petrogas E&P LLC has an investment commitment to Oil Search (Eastern Desert) SAE amounting to RO 6,454,611 (USD 16,781,988) [2006 - USD Nil] as final payment towards acquisition of a 30% joint venture participating interest in a production and exploration concession in Area A in the Eastern Desert of Arab Republic of Egypt (note 8).
21 RISK MANAGEMENT
Interest rate risk The Group manages its interest rate risk through using fixed rate debts and deposits. The Group does not have any interest bearing assets and liabilities with floating interest rates. The management has estimated the effect on profit for the year due to increases or decreases in interest rates to be insignificant
Credit riskThe Group seeks to limit its credit risk with respect to customers by setting credit limits for individual customers and monitoring outstanding receivables.
Credit risk is limited to the carrying values of financial assets in the balance sheet.
Liquidity riskThe Group limits its liquidity risk by ensuring bank facilities are available. The Company’s terms of sales require amounts to be paid within 30 days of the date of sale.
The table below summarises the maturities of the Group’s undiscounted financial liabilities at 31 December 2007, based on contractual payment dates and current market interest rates.
Year ended 31 December 2007Less than 3 months
3 to 12 months
1 to 5 years > 5 years Total
Accounts payables and accruals 29,757,846 7,284,510 17,753 - 37,060,109Term loan - 1,983,333 9,383,333 - 11,366,666
-------------------- -------------------- ------------------ ----------------- -----------------Total 29,757,846 9,267,843 9,401,086 - 48,426,775
-------------------- -------------------- ------------------ ----------------- -----------------
Year ended 31 December 2006Less than3 months
3 to 12 months
1 to 5years > 5 years Total
Accounts payables and accruals 42,814,730 15,709,043 4,142 - 58,527,915Term loan - 1,866,667 11,366,666 - 13,233,333
-------------------- ------------------- ------------------ ----------------- -----------------Total 42,814,730 17,575,710 11,370,808 - 71,761,248
-------------------- ------------------- ------------------ ----------------- -----------------
Currency riskTrade accounts and notes payable include amounts of US $ 5,590,777 and for (2006 US $ 3,603,822) due in foreign currencies, mainly in US Dollars. As the US Dollar is pegged to the Rial Omani, the group’s management considers this to be a low risk.
Capital managementThe Company manages its capital structure and makes adjustments to it, in light of changes in economic conditions. To maintain or adjust the capital structure, the Company may adjust the dividend payment to shareholders, return capital to shareholders or issue new shares. No changes were made in the objectives, policies or processes during the years ended 31 December 2007 and 31 December 2006.

Petrogas E&P LLC and its subsidiariesNOTES TO THE CONSOLIDATED FINANCIAL STATMENTS
AT 31 December 2007
22 KEY SOURCES OF ESTIMATION UNCERTAINTY
Impairment of accounts receivableAn estimate of the collectible amount of trade accounts receivable is made when collection of the full amount is no longer probable. For individually significant amounts, this estimation is performed on an individual basis. Amounts which are not individually significant, but which are past due, are assessed collectively and a provision applied according to the length of time past due, based on historical recovery rates.
At the balance sheet date, gross trade accounts receivable were US $ 25,435,380 (2006- 16,404,509). No provision for doubtful debts was made at the balance sheet date.
Impairment of inventoriesInventories are held at the lower of cost and net realisable value. When inventories become old or obsolete, an estimate is made of their net realisable value. For individually significant amounts this estimation is performed on an individual basis. Amounts which are not individually significant, but which are old or obsolete, are assessed collectively and a provision applied according to the inventory type and the degree of ageing or obsolescence, based on historical selling prices.
At the balance sheet date, gross inventory was US $ 8,447,474 (2006 – US $ 7,473,756) and the provision for old and obsolete inventory was US $ 2,441,294 (2006 – US $ 2,282,417).
Abandonment provisionEstimated abandonment and restoration costs for oil production activities are based on current requirements, technology and price levels and discounted using real discount rates. The estimated discounted ultimate liability for the asset retirement obligation is recognised in the period in which it is incurred.
At the balance sheet date the undiscounted abandonment provision amounted to US $ 16,462,500 (2006 – US $ 15,060,000) which after discounting amounted to US $ 5,375,864 (2006 – US$ 4,554,343). The amount recognised in the income statement as of 31 December 2007 was US $ 821,521 (2006 – US $ 616,227).
23 FAIR VALUES OF FINANCIAL INSTRUMENTS
Financial instruments comprise of financial assets and financial liabilities.
Financial assets consist of due from related parties, cash and bank balances and receivables. Financial liabilities consist of term loans, payables and short term loans.
The fair values of financial instruments are not materially different from their carrying values.


Petrogas E&P LLCP O Box 353, Postal Code 112
Ruwi, Sultanate of OmanTel: +968-24527900, Fax: +968-24527909
E mail:[email protected]