a climate smart agriculture solution: the kazakhstan and
TRANSCRIPT

Turi Fileccia (FAO)
Maurizio Guadagni (World Bank)
Rome
December 17, 2013
Conservation Agriculture/No till
A Climate Smart Agriculture
Solution: the Kazakhstan
and Ukraine experiences

Conservation Agriculture Definition
FAO definition: 1. Minimal Soil Disturbance/No Till: the tilled area must be less than
15 cm wide or 25% of the cropped area (whichever is lower)
2. Soil permanent cover: Ground cover must be more than 30%
3. Crop rotation: Rotation should ideally involve at least 3 different crops. However, monocropping is not an exclusion factor

CA/No till: a paradigm shift Ploughing used to be essential to control weeds, but it causes soil erosion and
consequent loss of fertility (with variations according to local conditions)
Soil carbon mineralization
Decrease soil carbon stock
Increase soil carbon stock
Residues
From Martial Bernoux, Institut de Recherche pour le Développement (IRD)
CA/NT increases soil organic matter with the
following benefits: • reduced soil erosion; • improved soil structure; • reduced leaching; • Increased water
infiltration; • earthworms proliferation
which creates channels that foster root growth

Technologies at comparison
Tillage No tillage
Soil de-structured
High erosion
Improved soil structure
Less erosion
Low water holding capacity
High yields variability
Increased water holding capacity
High yields stability
Higher tillage costs and time
Low competitiveness
Decreased seed bed preparation
costs and time
Improved competitiveness
Low C sequestration
High environmental impact
Moderate C sequestration
Decreasing environmental impact

CA Triple Win-Win
• Increased profitability by reducing soil preparation costs
• Possibility to have two crops/catch crops (in warmer climates)
• Reduced soil erosion and its related costs
• Improving rainfall efficiency and soil moisture storing • Increased soil organic matter, biodiversity and fertility
• Reduced green house gas emissions
Economic/Financial benefits
Climate Change Mitigation
Climate Change Adaptation

CA/NT History

Global Adoption of CA/No Till
Country Conservation
Agriculture area (1000 ha)
1 United States of America 26,500
2 Argentina 25,553
3 Brazil 25,502
4 Australia 17,000
5 Canada 13,481
6 Russia 4,500
7 China 3,100
8 Paraguay 2,400
9 Kazakhstan 1,850
10 Bolivia 706
11 Uruguay 655
12 Spain 650
13 Ukraine 600
14 South Africa 368
15 Venezuela 300
16 France 200
17 Zambia 200
18 Chile 180
19 New Zealand 162
20 Finland 160
TOTAL 124,067 Others 1,000 France
Ukraine
South Africa
China
Russia
Spain
Zambia
Kazakhstan
Finland
Venezuela
Chile
United States
Bolivia
Canada
New Zealand
Uruguay
Australia
Brasil
Paraguay
Argentina
0 20 40 60 80 100
1
2
2
2
4
4
6
7
7
9
10
16
18
26
30
34
36
37
62
80
Conservation Agriculture area as % of cultivated area (%)
1
2
3
4
5
6
7
8
9
10
11
12
13 14
15
16
17 18 19
20

USA 26.6
Canada 13.5
Australia 12.0
Europe 1.1
Brazil 25.5
Global adoption in 2010: ~125 Million ha (9% of arable land)
Argentina 19.7
Paraguay 2.4
Other South
America 2.0
Africa 0.4
Asia 2.5
From Martial Bernoux (IRD) on data from Derpsch and Friedrich (FAO), and *Roberts and Johnston, 2009.
Russia 2.0 *
Global Adoption of CA/No Till Latest database update


Obstacles to Adoption Significant investments required to update farm
machinery
More evident and durable benefits when technology is applied for several continued years (issue when land tenure is insecure )
Challenging technological changes & steep learning curve
New weed management approach & increased herbicides cost (at least initially)
Difficulty to handle crop residues, which cannot be used for animal feed or fuel
Psychological and cultural bias
Adoption is easier in larger farms, and more challenging (but not impossible nor less beneficial) in smaller farms. That is why adoption takes time

0300060009000
12000150001800021000240002700030000330003600039000
1978-1982 1988-1992 1998-2002 2008-2012
Tho
usa
nd
ha
Argentina
05000
1000015000200002500030000350004000045000500005500060000650007000075000
1973-1977 1983-1987 1993-1997 2003-2007
Tho
usa
nd
ha
Brazil
0
4000
8000
12000
16000
20000
24000
20
02
20
04
20
07
20
10
20
11
20
12
Tho
usa
nd
ha
Kazakhstan
The “S” curve of Technology Adoption

‘China must be in the forefront of promoting intensified sustainable
agricultural practices since it only has 7% of global arable land
but 22% of the global population. Conservation agriculture is
an opportunity to increase sustainable development of agriculture
in China now and in the future’
Professor Li Hongwen, lead CA expert in China Agriculture University
China’s recipe: •High-level championship and ownership •R&D (on machinery, cropping patterns, etc.) •Widespread demonstrations/awareness raising •Enabling policies and targeted subsidies •Good governance
“Adoption is easier in larger farms, and more challenging (but not impossible nor less beneficial) in smaller farms. That is why adoption takes time “
What about China?

The Kazakhstan Experience: TCI Implementation Support to the WB-ACP

Kazakhstan is a major wheat exporter
12,538
17,051
9,638
22,732
10,700
6,152
8,254
4,862
11,844
7,719 7,500 7,600
6,200
7,400
8,019
-
5,000
10,000
15,000
20,000
25,000
2008 2009 2010 2011 2012
Production (1000 MT)
Exports (1000 MT)
Domestic Consumption (1000 MT)
Linear (Exports (1000 MT))
Linear (Domestic Consumption(1000 MT))
0%
10%
20%
30%
40%
50%
60%
70%
2008 2009 2010 2011 2012
exports/production

15%
13%
13%
11% 9%
6%
6%
5%
5%
4%
13% Azerbaijan
Turkey
Iran
Tajikistan
Uzbekistan
Kyrgyzstan
Georgia
Sudan
Yemen
United Arab Emirates
Others
Total export 7.3 Mln MT
Kazakhstan cereals exports and their destinations (2012)

RUK is challenging the US as the largest wheat exporter in the world (global food security
factor)
0
20,000
40,000
60,000
80,000
100,000
120,000
0
5,000
10,000
15,000
20,000
25,000
30,000
35,000
40,000
45,000
Wheat Production (1000 MT) Wheat Export (1000 MT)

Wheat is produced mostly in the northern part of Kazakhstan
KAZAKHSTAN
Ranks the 9th place in the area extent. Around 20 mln ha is used for crop production, mainly for wheat – 14 mln ha
Mostly spring wheat, planted in spring and harvested in autumn because winters are too cold

250-300 mm, rainfed
250-300 mm, rainfed 250 mm, rainfed
350-400 mm, rainfed
300-350 mm, irrigated, rainfed
Rainfed wheat with limited precipitation

The importance of stubble
• 50% of yield depends on soil moisture
• Snow 30-40 % of all precipitations
• Snow is taken away by the strong wind of the steppe or through runoff (causing erosion)
• Stubbles of preceding crop trap snow
• Snow melts more gradually and more water becomes available to growing crop
• The higher the stubble the better (35 to 40-45 cm for best results)
(LL from Saskatchewan, Canada)

Snow trapping

CA/NT Adoption in Kazakhstan
• Kazakhstan together with Russia has the highest adoption in ECA
• The area has grown more than 200% during the last 5 years
• Now it is practiced on at least 1.85 million ha (CIMMYT, 2012 based on rigorous latest assessment)
• The country is ranked 9th in the world for adoption

CA/NT area in Kazakhstan
50 100
600
1220
1440
1850
0
200
400
600
800
1000
1200
1400
1600
1800
2000
2002 2004 2007 2010 2011 2012
Progress of No-till Area in Kazakhstan
'000 Hectares
FAO TCP
ACP START
ACP END

Speed of adoption
In terms of speed of adoption,
during the last three years,
Kazakhstan shares the
1st position with China

Graph 2: Financial Benefits of Conservation Agriculture in Wheat Production in
Northern Kazakhstan (F-IRR = 28%)
-400
-300
-200
-100
0
100
200
1 2 3 4 5 6 7 8 9 10 11 12 13 14
Years
US
$/h
a
Investment
Tillage saving
Higher yield
Chemical w eeding
Benefit
A good business for farmers
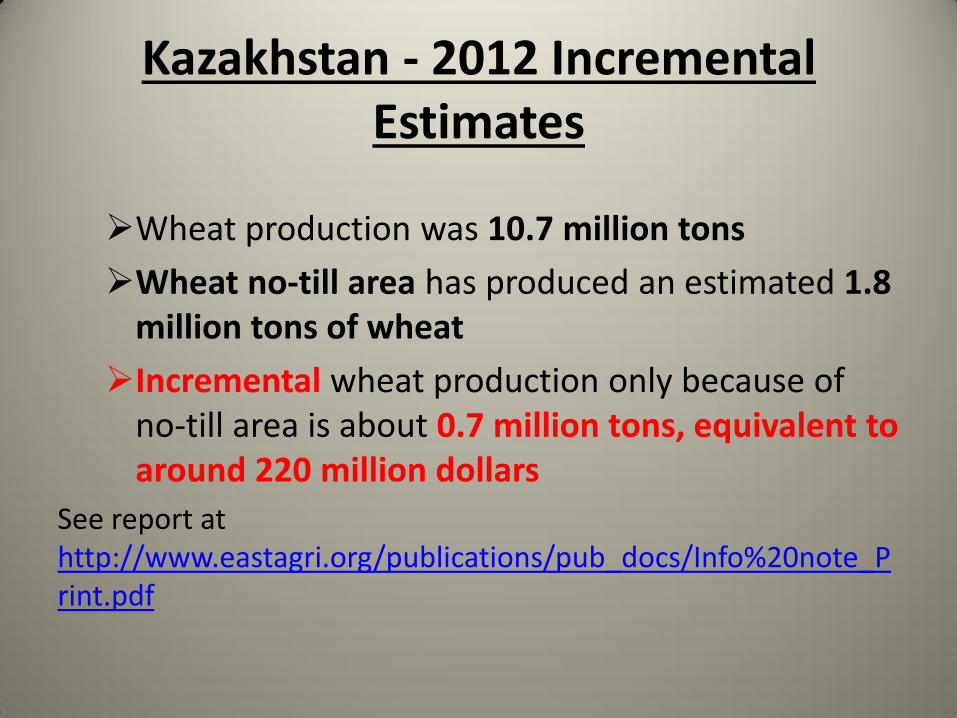
Kazakhstan - 2012 Incremental Estimates
Wheat production was 10.7 million tons
Wheat no-till area has produced an estimated 1.8 million tons of wheat
Incremental wheat production only because of no-till area is about 0.7 million tons, equivalent to around 220 million dollars
See report at http://www.eastagri.org/publications/pub_docs/Info%20note_Print.pdf

Kazakhstan - Yield Increases
0.00
0.50
1.00
1.50
2.00
2.50
20102011
2012
0.65
1.58
0.83
1.02
2.34
1.23 Traditional technology(t/ha)
No till technology (t/ha)
Wheat Productivity

National Benefits from CA/NT Adoption - Wheat only
0
200
400
600
800
1000
2010 2011 2012
Thousand ton
$0.0
$100.0
$200.0
$300.0
2010 2011 2012
US$ million
0%
2%
4%
6%
8%
2010 2011 2012
Percent of Total Production
0
1
2
3
4
5
6
7
2010 2011 2012
Million People Fed

Kazakhstan - Impact of CA/NT
• Increased income and food security during the last three years:
– An estimated 580 million dollars incremental income;
– satisfied cereals requirements of about 5 million people annually
• Climate Change mitigation: Kazakhstan contributes to the annual sequestration of about 1.3 million tons of CO2 equivalent to the emissions of 270,000 cars

The Agricultural Competitiveness Project (ACP)
• 42 out of 585 Competitive Grants awarded for no-till/minimum tillage activities.
• Beneficiary farmers have expanded the technology to the rest of their farm areas (about 45,000 ha)
• Extension activities of KazAgroInnovation contributed to further expansion through seminars in knowledge centers, direct consultancies and call centers. High demand topic

ACP Contribution • Due to replication effect, extrapolation can be
made for the entire country which would allow the assumption that some 350,000-400,000 ha of NT area have been promoted thanks to ACP
• Strengthened links between research centers and farmers reduced failures
• ACP supported the CIMMYT assessment

Kazakhstan – CA/NT State of art and needs
• GOK and the national research system have done a lot: policy, incentives, investment, R&D
• The private sector has invested (specifically) over 200 million dollars
• CA/NT specialized machinery companies are expanding, but farmers depend excessively on machinery suppliers
• Some farmers reversed adoption because of organizational challenges
• To enable further expansion and avoid reversals more investment is required
• More farm/business specific R&D, Knowledge Dissemination, and expert advice

The Ukraine Experience: Study on Potential Benefits of CA/No till Adoption in Ukraine

Ukraine cereals exports and their destination (2012) State Customs Committee of the Ukraine, Global Trade Atlas

Erosion in Ukraine is a major issue
• The country is gifted by nature with a strategic production asset: the Chernozems
• These soils over the years have been widely degraded by erosion
• Erosion is causing every year a loss of soil fertility currently valued at US$5 billion, which is 1/3 of Ag. GDP
• 10 tons of soil eroded per ton of grain produced!!

Erosion: the Steppe example

Interlinked issues • Comparative advantage of crop production systems in
Ukraine is threatened: – Output volatility and high costs of production
• Competiveness is at risk (agricultural enterprises contribute over 85 percent to the agricultural GDP*)
• Siltation of rivers, harbors, and dams (feeding hydroelectric power stations water intakes): not quantified yet.
* 13.7 billion USD

Interlinked issues
Soil Moisture in Ukraine with respect to 1971-2000 mean
Winter and Spring Wheat yield dynamics (Dnepropetrovsk, Steppe)
-25
-20
-15
-10
-5
0
5
10
15
20
1996 2000 2004 2008
У, q/hа
-10
-8
-6
-4
-2
0
2
4
6
8
10
1996 1998 2000 2002 2004 2006 2008
У, q/hа
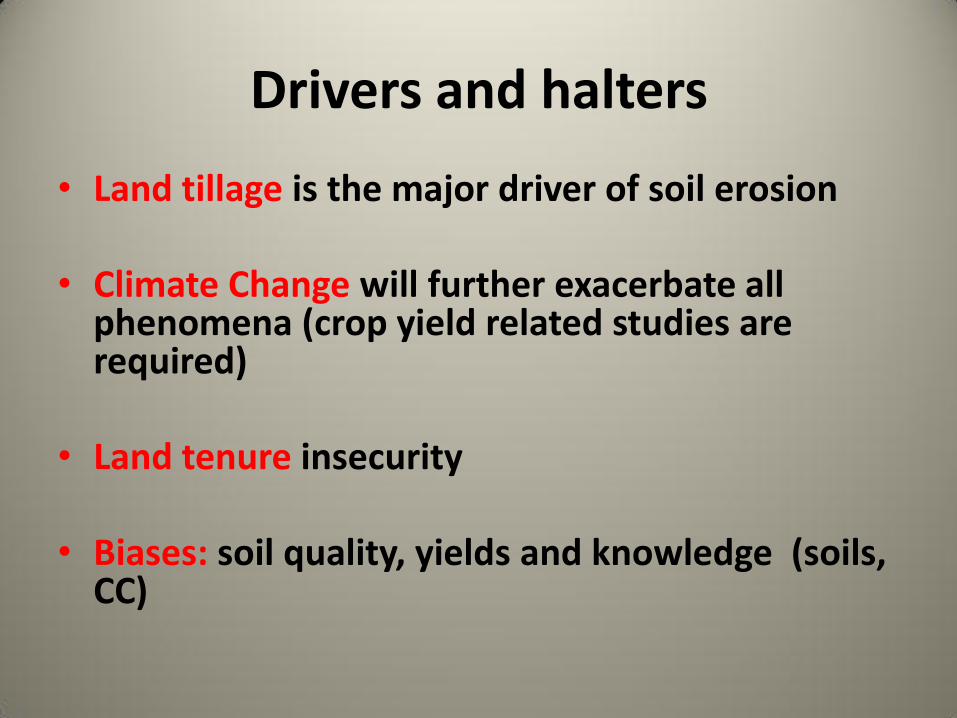
Drivers and halters
• Land tillage is the major driver of soil erosion
• Climate Change will further exacerbate all phenomena (crop yield related studies are required)
• Land tenure insecurity • Biases: soil quality, yields and knowledge (soils,
CC)

Actions: current
• MAPF advocates resource saving technologies
• Academics continue their analyses
• Farmers have moved decisively to Minimum Tillage (estimated on over 20 million ha).
An important step forward but not effective in a sustainable manner: soil degradation will continue
• Few sparse progressive farmers exist: CA is applied on 600-700 thd ha, mainly in Steppe

Actions: future
• CA/ No till:
– contrasts erosion, maintains soil fertility, and enhances drought resilience (evidence-based)
– abates costs of production by minimizing fuel consumption (evidence-based)
• Growing interest among academics and enterprises in Ukraine
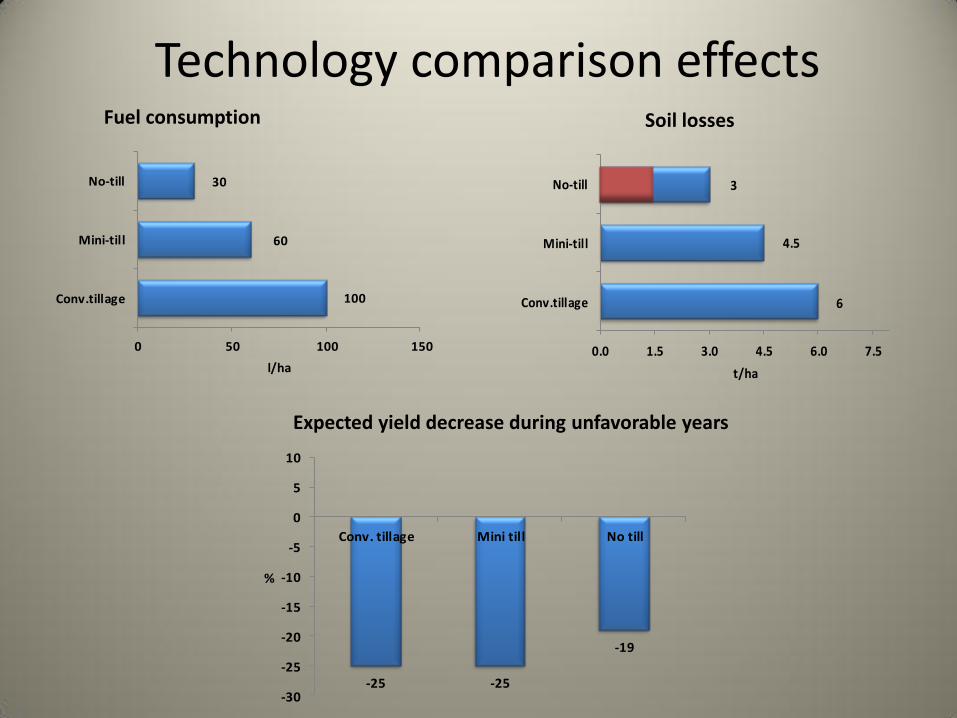
6
4.5
3
0.0 1.5 3.0 4.5 6.0 7.5
Conv.tillage
Mini-till
No-till
t/ha
-25 -25
-19
-30
-25
-20
-15
-10
-5
0
5
10
Conv. tillage Mini till No till
%
Soil losses Fuel consumption
Expected yield decrease during unfavorable years
100
60
30
0 50 100 150
Conv.tillage
Mini-till
No-till
l/ha
Technology comparison effects
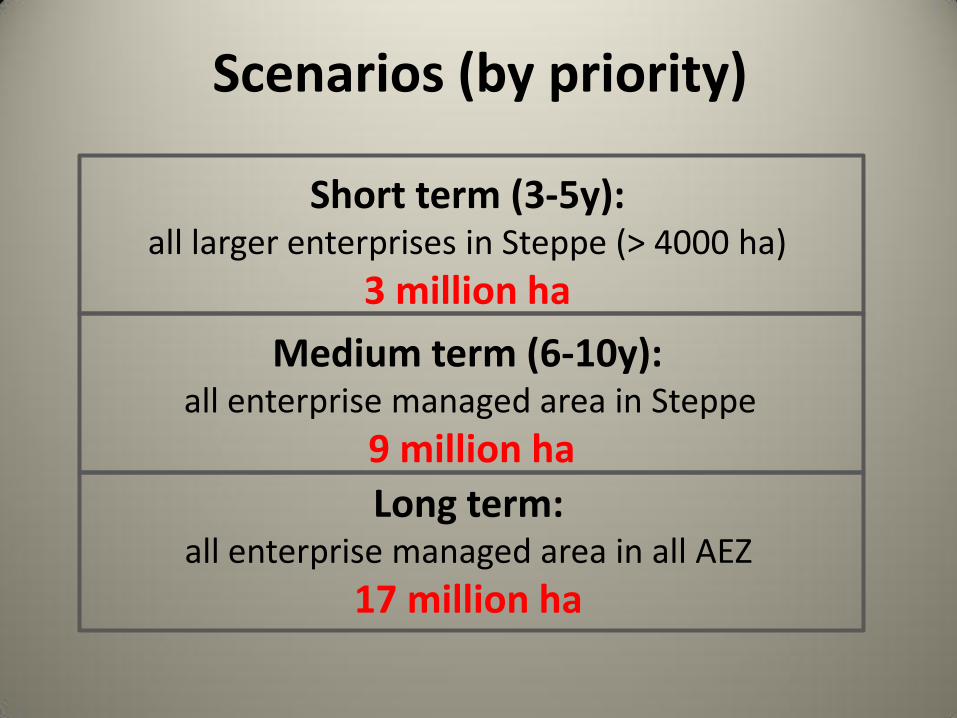
Scenarios (by priority)
Short term (3-5y): all larger enterprises in Steppe (> 4000 ha)
3 million ha
Medium term (6-10y): all enterprise managed area in Steppe
9 million ha
Long term: all enterprise managed area in all AEZ
17 million ha

Potential benefits: farm level

Potential benefits: global level
C sequestration in million tons CO2 (climatic options average)
Past Future
2000-2013 Short term Medium term Long term Total
2013-2017 2017-2023 2023-2039 2013-2039
Baseline 2.2 1.4 3.5 15 19.9
Adoption scenario
2.2 3.3 31.1 100.2 134.6
Average benefits
0 1.9 28 85.2 114.7
Short term Medium term Long term Total
2013-2017 2017-2023 2023-2039 2013-2039
Reduced fuel burning emissions in CO2 million
tons 0.2 1.8 2.3 45.7

CA technology adoption in Ukraine would provide important benefits
Aggregated Benefits at Different Levels (monetary and non)
Level Type Short term
(3 million ha) Medium term (9 million ha)
Long term (17 million ha)
Farm/Enterprise
incremental annual net income
US$0.41 billion US$1.23 billion US$2.31 billion
National
off farm additional output value (on annual basis)
additional soil fertility value (on annual basis)
US$0.37 billion US$1.11 billion US$2.10 billion
Total (annual) US$0.78billion US$2.34 billion US$4.41 billion
Global
Improved Food Security (additional people fed during drought years)
5.4 million people
16.1 million people
30.4 million people
reduced annual CO2 emission
0.5 million CO2
tons 4.6 million CO2
tons 5.6 million CO2
tons

Check these media
http://www.worldbank.org/en/results/2013/08/08/no-till-climate-smart-agriculture-solution-for-kazakhstan
http://www.youtube.com/watch?v=q1aR5OLgcc0
http://www.economist.com/blogs/multimedia/2011/02/future_food_production

Thank you for your attention