4/27/2015 ieng 471 facilities planning 1 ieng 471 - lecture 04 schedule design
TRANSCRIPT
04/18/23 IENG 471 Facilities Planning 1
IENG 471 - Lecture 04
Schedule Design
04/18/23 IENG 471 Facilities Planning 2
Agenda
AssignmentsSchedule Design
Required DataEstimating Production VolumeEstimating Equipment Needs (Equip. Frac.)Facilities Project Management Tools
Questions & Issues
04/18/23 IENG 471 Facilities Planning 3
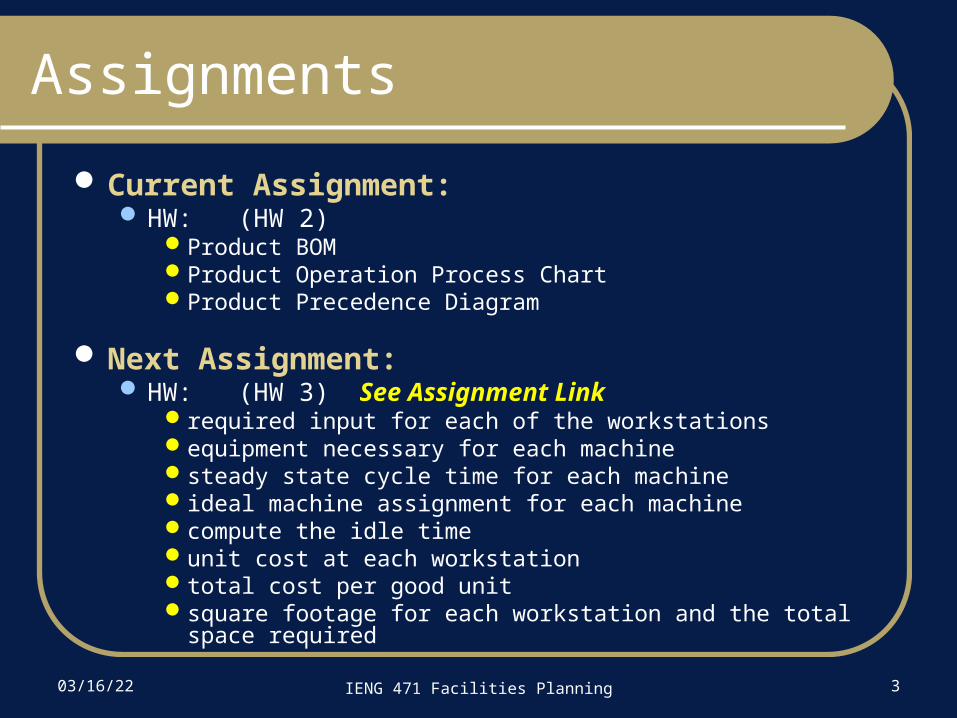
Assignments
Current Assignment: HW: (HW 2)
Product BOMProduct Operation Process ChartProduct Precedence Diagram
Next Assignment: HW: (HW 3) See Assignment Link
required input for each of the workstationsequipment necessary for each machinesteady state cycle time for each machineideal machine assignment for each machinecompute the idle time unit cost at each workstationtotal cost per good unit square footage for each workstation and the total space required
04/18/23 IENG 471 Facilities Planning 4
Schedule Design Overview
Schedule Design is undertaken to decide for a facility design:How much should the facility be designed
to produceWhen should the facility be able to produce
the product
04/18/23 IENG 471 Facilities Planning 5
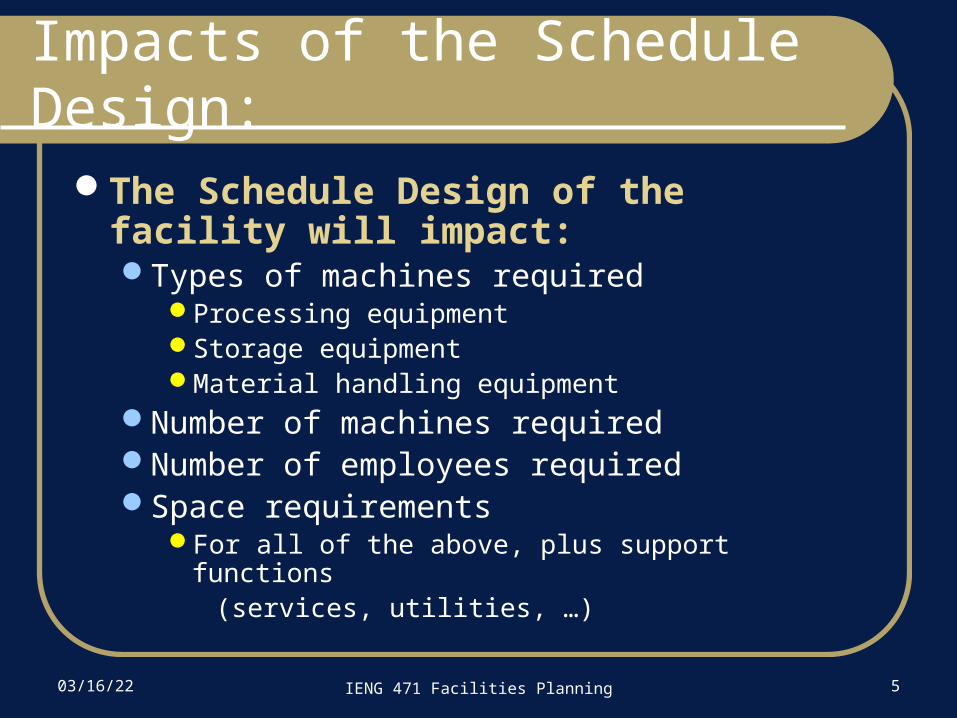
Impacts of the Schedule Design:
The Schedule Design of the facility will impact:Types of machines required
Processing equipmentStorage equipmentMaterial handling equipment
Number of machines requiredNumber of employees requiredSpace requirements
For all of the above, plus support functions (services, utilities, …)

04/18/23 IENG 471 Facilities Planning 6
Information Req’d: Marketing
What products are to be producedWhat volume of each product is
expected to be produced (and when)How probable are the production requirementsSeasonality and life cycle considerations
Where are the products to be acquiredWho will acquire the productsWhat are the product development plans
04/18/23 IENG 471 Facilities Planning 7
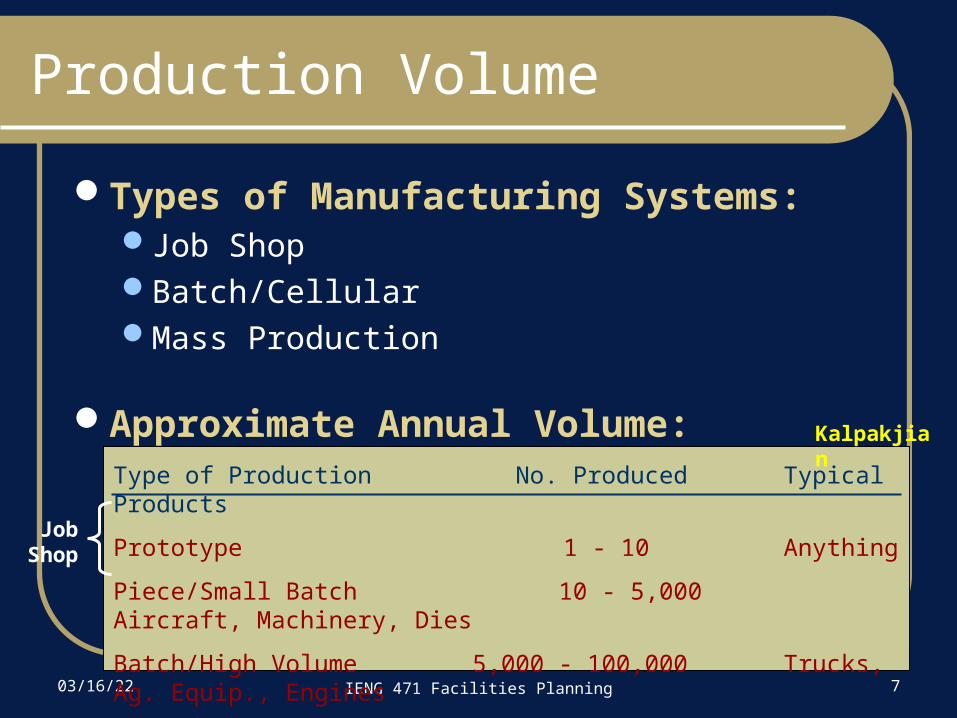
Types of Manufacturing Systems:Job ShopBatch/CellularMass Production
Approximate Annual Volume:
Production Volume
Type of Production No. Produced Typical Products
Prototype 1 - 10 Anything
Piece/Small Batch 10 - 5,000 Aircraft, Machinery, Dies
Batch/High Volume 5,000 - 100,000 Trucks, Ag. Equip., Engines
Mass Production Over 100,000 Cars, Appliances, Fasteners
Kalpakjian
Job Shop
04/18/23 IENG 471 Facilities Planning 8
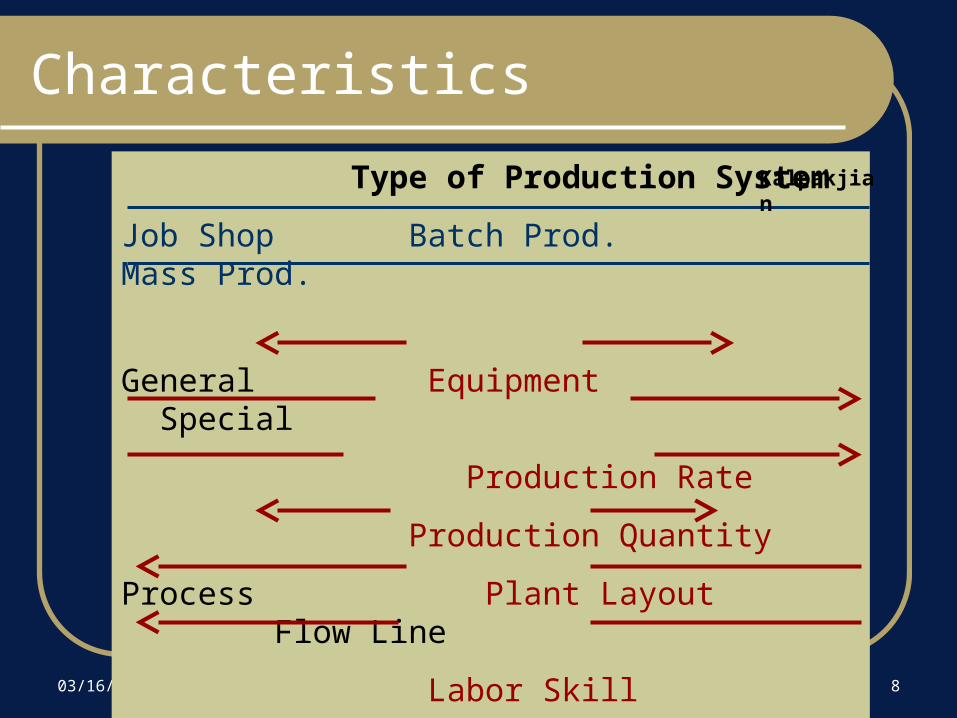
Type of Production System
Job Shop Batch Prod. Mass Prod.
General Equipment Special
Production Rate
Production Quantity
Process Plant Layout Flow Line
Labor Skill
Part Variety
Characteristics
Kalpakjian
04/18/23 IENG 471 Facilities Planning 9
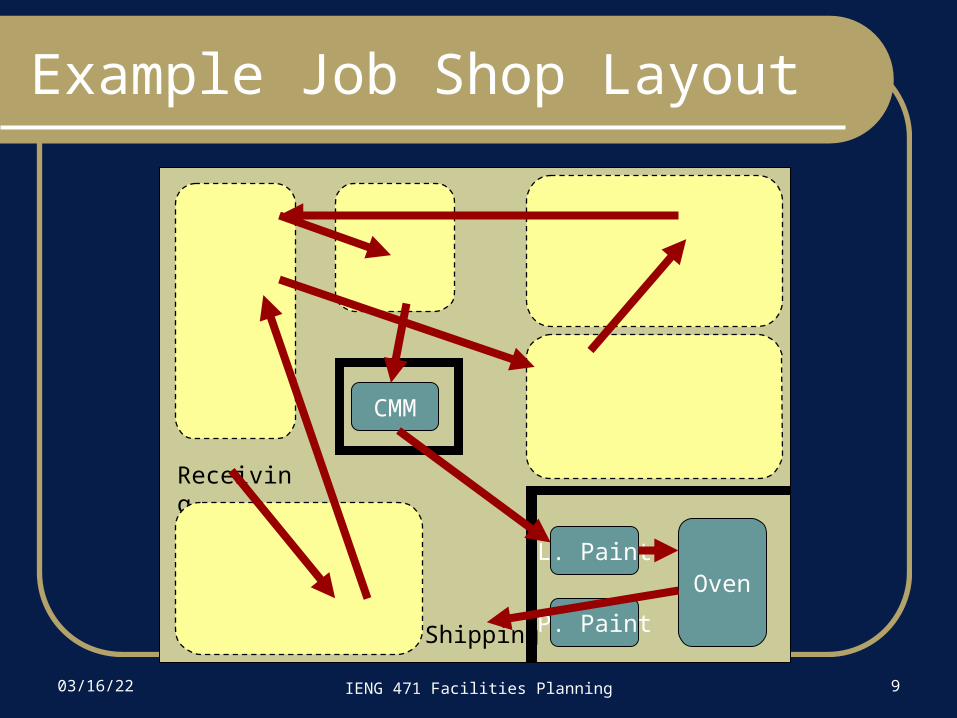
Example Job Shop Layout
Drill
V. Mill
Lathe L. PaintOven
H. Mill
P. Paint
Drill
Drill
Drill
Lathe Lathe
Lathe
V. Mill
V. MillV. Mill
H. Mill
H. Mill
H. Mill
Grind
Grind
CMM
Receiving
Shipping
04/18/23 IENG 471 Facilities Planning 10
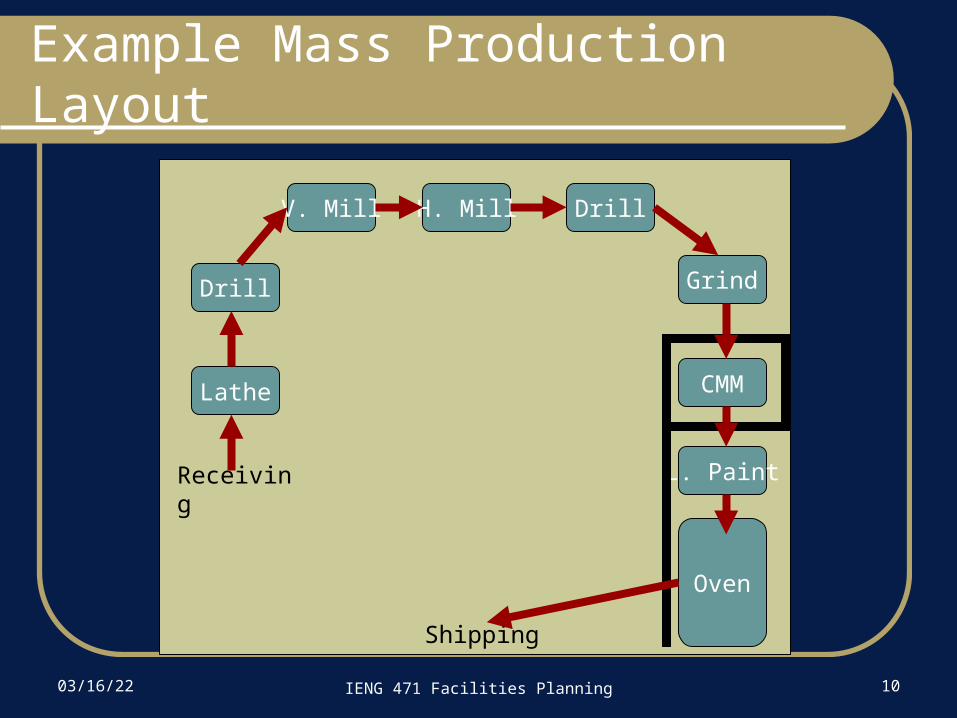
Example Mass Production Layout
DrillV. Mill
L. Paint
Oven
Drill
Lathe
H. Mill
Grind
CMM
Receiving
Shipping
04/18/23 IENG 471 Facilities Planning 11
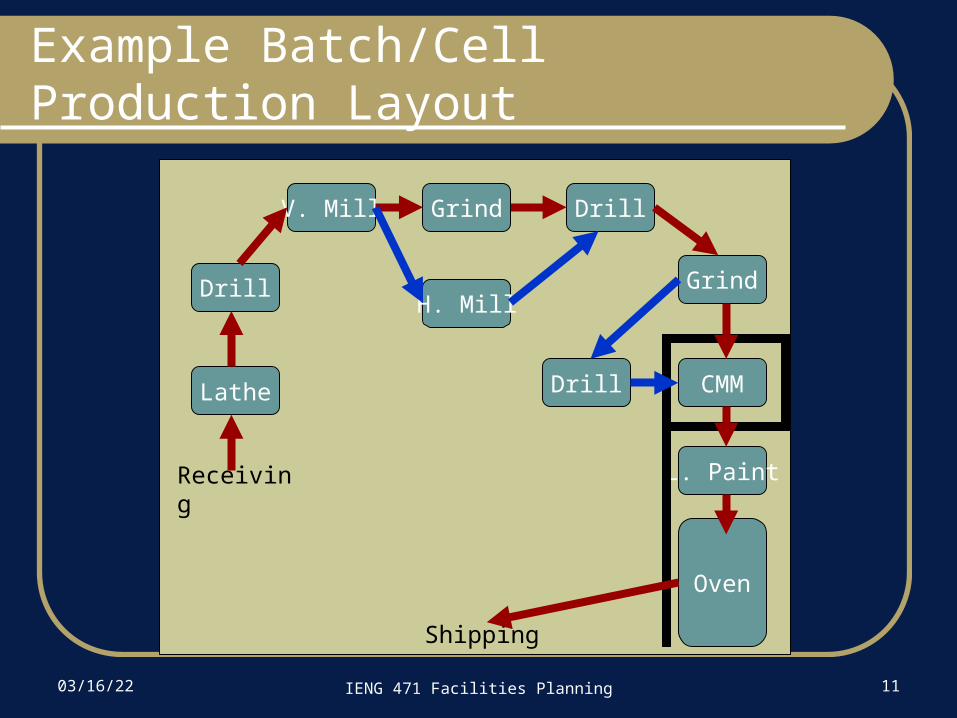
Example Batch/Cell Production Layout
DrillV. Mill
L. Paint
Oven
Drill
Lathe
H. MillGrind
CMM
Receiving
Shipping
Drill
Grind
04/18/23 IENG 471 Facilities Planning 12
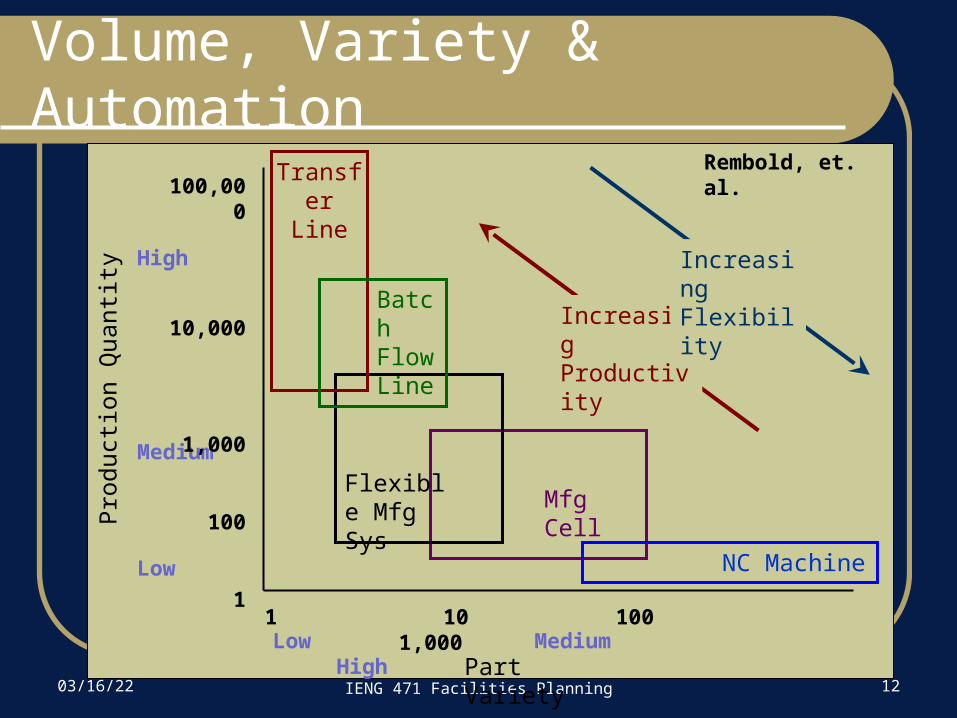
Volume, Variety & AutomationP
rodu
ctio
n Q
uant
ity
Part VarietyLow Medium High
High
Medium
Low
1 10 100 1,000
100,000
10,000
1,000
100
1
Mfg Cell
NC Machine
Flexible Mfg Sys
Transfer Line
Batch Flow Line
Increasing Productivity
Increasing Flexibility
Rembold, et. al.
04/18/23 IENG 471 Facilities Planning 13
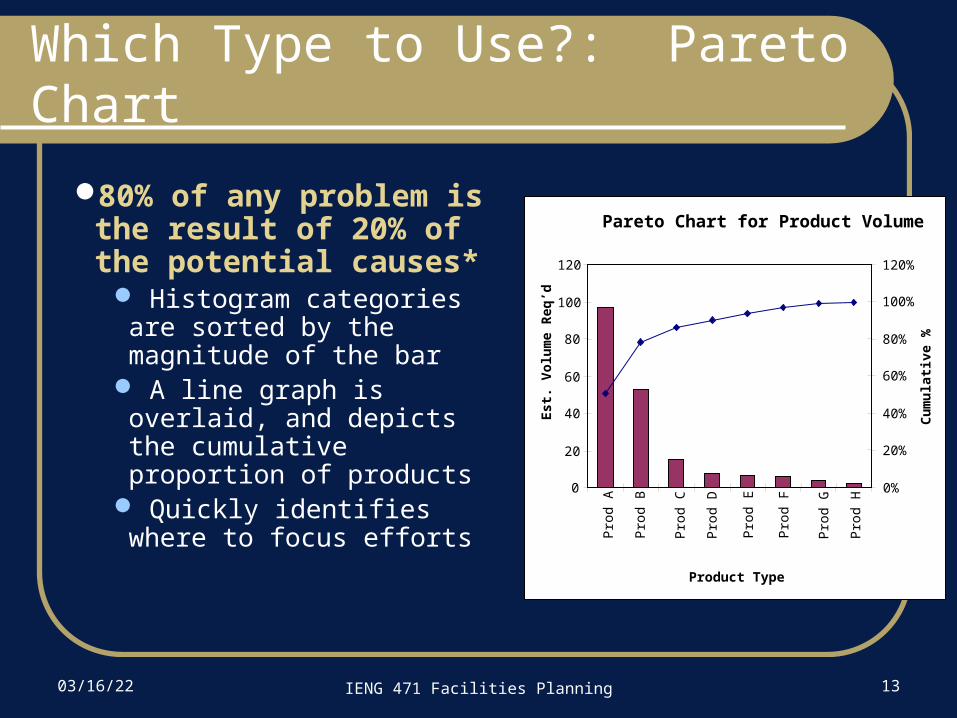
Which Type to Use?: Pareto Chart
80% of any problem is the result of 20% of the potential causes*
Histogram categories are sorted by the magnitude of the bar
A line graph is overlaid, and depicts the cumulative proportion of products
Quickly identifies where to focus efforts
Pareto Chart for Product Volume
0
20
40
60
80
100
120
Pro
d A
Pro
d B
Pro
d C
Pro
d D
Pro
d E
Pro
d F
Pro
d G
Pro
d H
Product Type
Est
. Vo
lum
e R
eq’d
0%
20%
40%
60%
80%
100%
120%
Cu
mu
lati
ve %
04/18/23 IENG 471 Facilities Planning 14
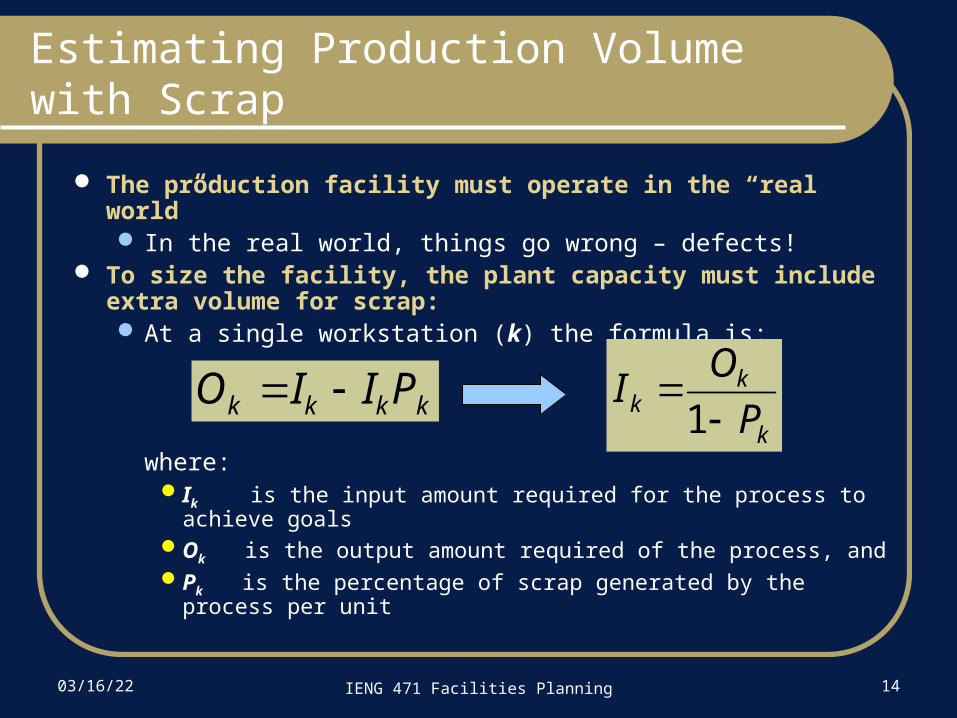
Estimating Production Volume with Scrap
The production facility must operate in the “real world” In the real world, things go wrong – defects!
To size the facility, the plant capacity must include extra volume for scrap: At a single workstation (k) the formula is:
where:Ik is the input amount required for the process to achieve goalsOk is the output amount required of the process, and Pk is the percentage of scrap generated by the process per unit
k
kk P
OI
1kkkk PIIO
04/18/23 IENG 471 Facilities Planning 15
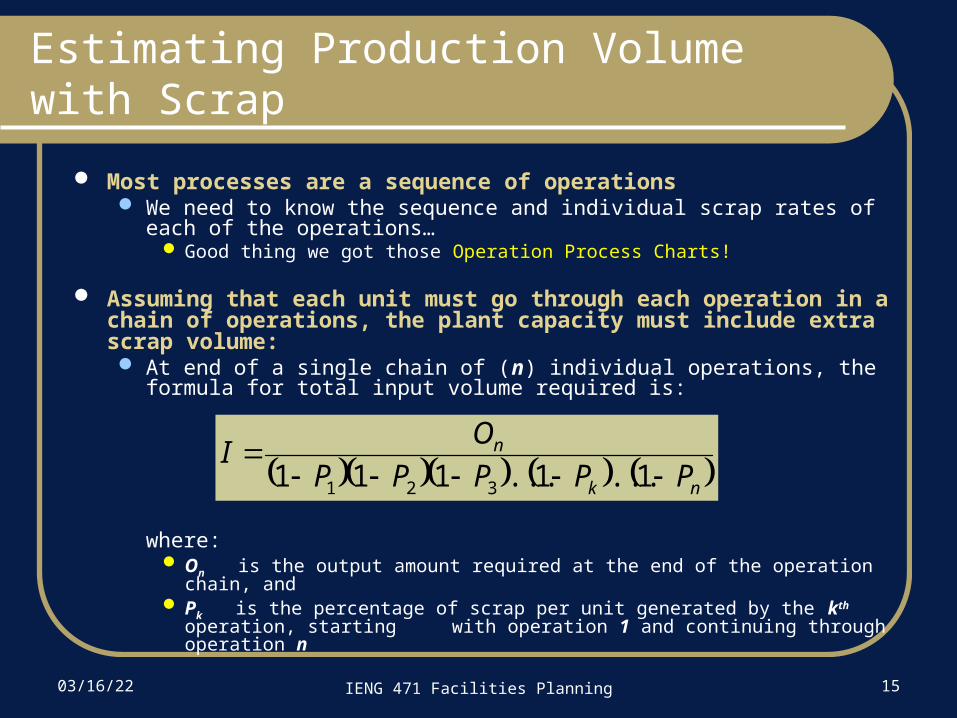
Estimating Production Volume with Scrap
Most processes are a sequence of operations We need to know the sequence and individual scrap rates of each of the
operations… Good thing we got those Operation Process Charts!
Assuming that each unit must go through each operation in a chain of operations, the plant capacity must include extra scrap volume: At end of a single chain of (n) individual operations, the formula for total
input volume required is:
where: On is the output amount required at the end of the operation chain, and Pk is the percentage of scrap per unit generated by the kth operation, starting
with operation 1 and continuing through operation n
nk
n
PPPPP
OI
1...1...111 321
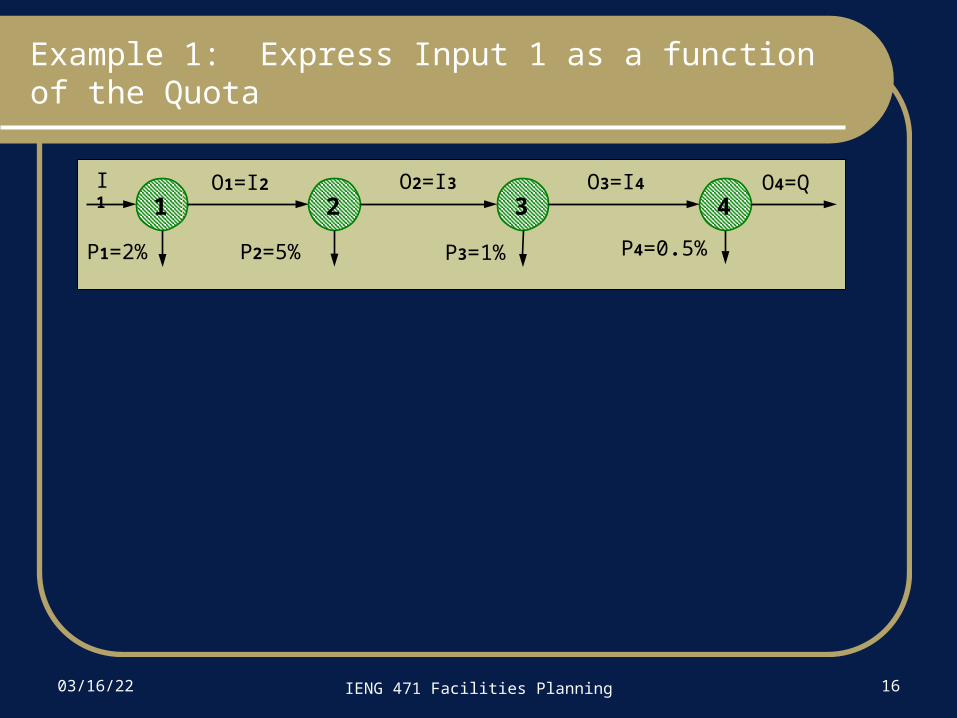
Example 1: Express Input 1 as a function of the Quota
04/18/23 IENG 471 Facilities Planning 16
1 2 3 4I1 O1=I2 O2=I3 O3=I4 O4=Q
P1=2% P2=5% P3=1% P4=0.5%
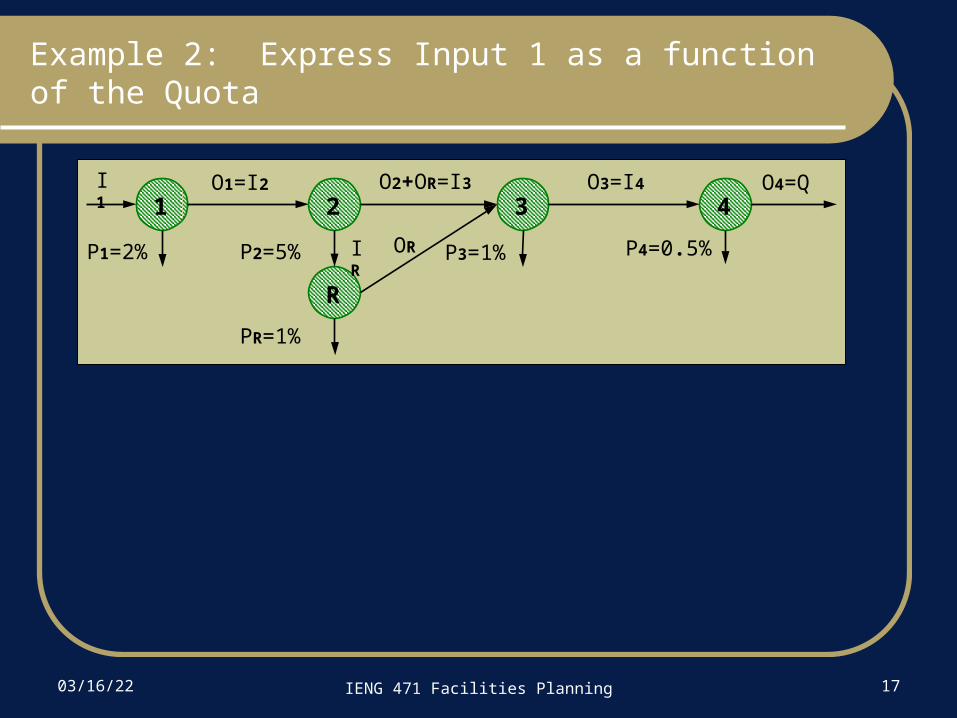
Example 2: Express Input 1 as a function of the Quota
04/18/23 IENG 471 Facilities Planning 17
1 2 3 4
R
I1 O1=I2 O2+OR=I3
O3=I4 O4=Q
P1=2% P2=5%
PR=1%
P3=1% P4=0.5%IR OR

04/18/23 IENG 471 Facilities Planning 18
1 2 3 4
R
I1 O1+OR=I2
O2=I3 O3=I4 O4=Q
P1=2% P2=5%
PR=1%
P3=1% P4=0.5%IR OR
Example 3: Express Input 1 as a function of the Quota
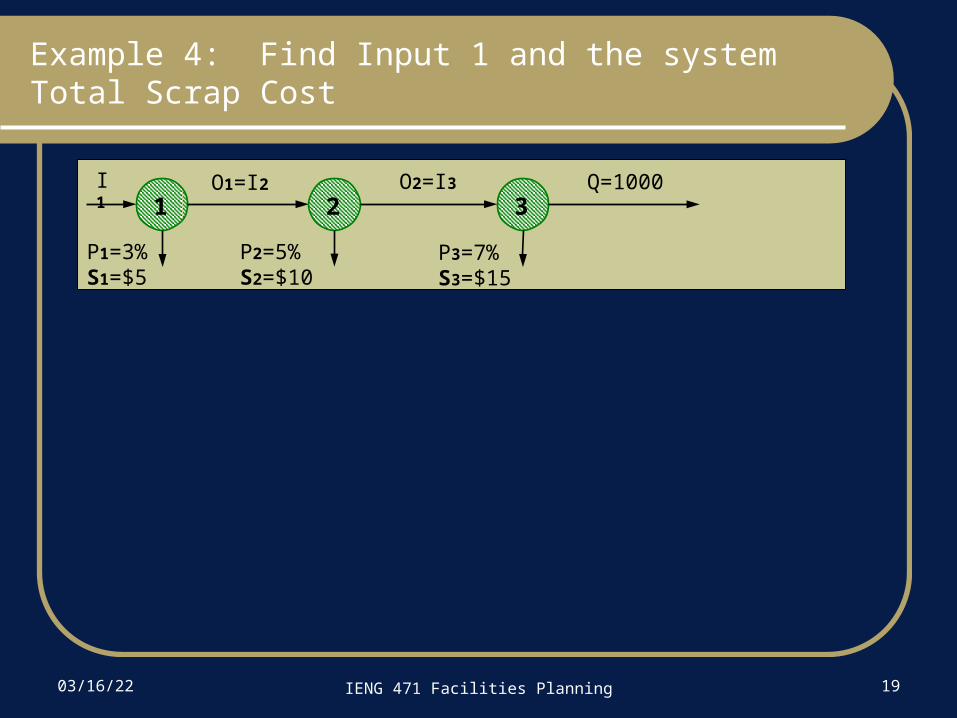
Example 4: Find Input 1 and the system Total Scrap Cost
04/18/23 IENG 471 Facilities Planning 19
1 2 3I1 O1=I2 O2=I3 Q=1000
P1=3%S1=$5
P2=5%S2=$10
P3=7%S3=$15
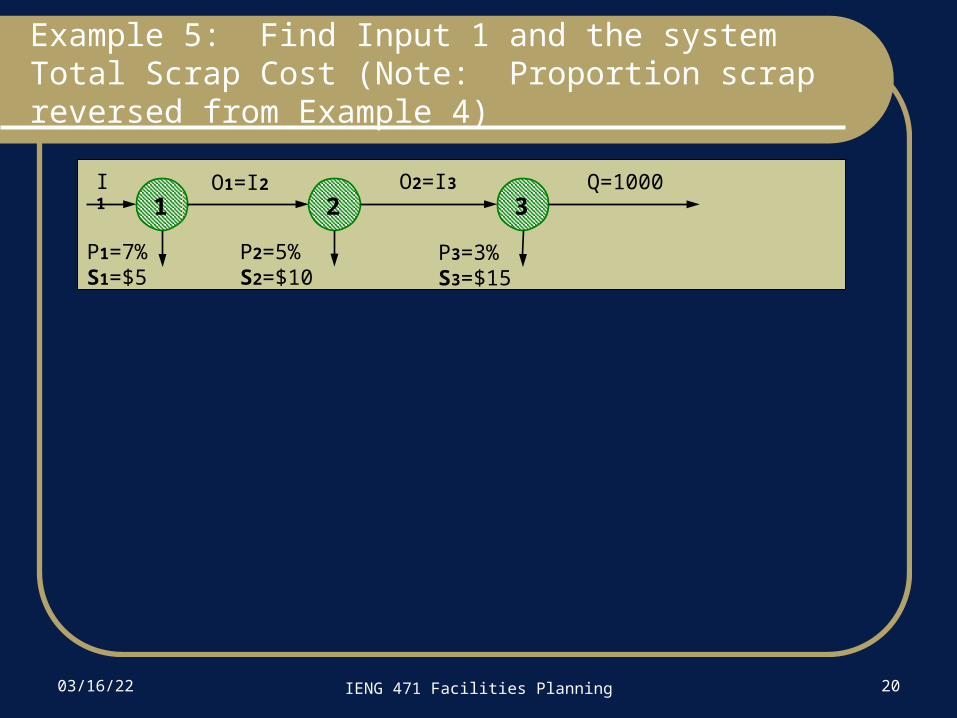
Example 5: Find Input 1 and the system Total Scrap Cost (Note: Proportion scrap reversed from Example 4)
04/18/23 IENG 471 Facilities Planning 20
1 2 3I1 O1=I2 O2=I3 Q=1000
P1=7%S1=$5
P2=5%S2=$10
P3=3%S3=$15