1 submitted may 24, 2002 revised june25, 2002 re-revised july
TRANSCRIPT
1
Submitted May 24, 2002Revised June25, 2002Re-revised July 10,2002
BIOCHEMISTRY OF MITOCHONDRIAL NITRIC-OXIDE SYNTHASE*
Elfering, Sarah Liv, Sarkela, Theresa Marie, and Giulivi, Cecilia†
Department of ChemistryUniversity of Minnesota
Duluth, MN 55812
* This work was supported by National Institutes of Health (ES011407-01), MinnesotaMedical Foundation (3048-9227-01), and partially by Grant-In-Aid from University ofMinnesota, Graduate School, United Mitochondrial Disease Foundation (99-1) and CottrellResearch Corporation (CC5675).
SHORT TITLE: mitochondrial nitric-oxide synthase
†To whom correspondence should be addressed:Dr. Cecilia GiuliviDepartment of Chemistry,University of Minnesota,10 University Drive,Duluth, MN 55812e-mail: [email protected]
Copyright 2002 by The American Society for Biochemistry and Molecular Biology, Inc.
JBC Papers in Press. Published on August 1, 2002 as Manuscript M205256200 by guest on A
pril 12, 2018http://w
ww
.jbc.org/D
ownloaded from
by guest on A
pril 12, 2018http://w
ww
.jbc.org/D
ownloaded from
by guest on A
pril 12, 2018http://w
ww
.jbc.org/D
ownloaded from
2
ABSTRACT
We reported that the generation of nitric oxide by mitochondria is catalyzed by a constitutive,
mitochondrial nitric-oxide synthase (mtNOS). Given that this production may establish the
basis for a novel regulatory pathway of energy metabolism, oxygen consumption, and oxygen
free radicals production, it becomes imperative to identify unequivocally and characterize this
enzyme to provide basis for its regulation. The mitochondrial localization of mtNOS was
supported by following the hepatic distribution of mtNOS, immunoblotting submitochondrial
fractions, and immunohistochemistry of liver tissues. mtNOS was identified as bNOSα by
various methods (mass spectrometry of proteolytic fragments, amino acid analysis, MW, pI
and analysis of PCR fragments), excluding the occurrence of a novel isoform or other splice
variants. Distribution of mtNOS transcript indicated its occurrence in liver, brain, heart,
muscle, kidney, lung, testis, and spleen. In contrast to bNOS, mtNOS has two
posttranslational modifications: acylation with myristic acid and phosphorylation at the C-
terminus. The former modification is a reversible and posttranslational process, which may
serve for subcellular targeting or membrane anchoring. The latter modification could be
linked to enzymatic regulation. These results are discussed in terms of the role that nitric
oxide may have in cellular bioenergetics.
by guest on April 12, 2018
http://ww
w.jbc.org/
Dow
nloaded from
3
INTRODUCTION
Our (1-5) and other studies (6-10) provided evidence for production of nitric oxide (NO. 1) by
intact, purified mitochondria and by mitochondria-rich fractions, respectively. In our lab the
production of NO. by mitochondria was demonstrated by using two spectroscopic
techniques, i.e., oxidation of oxymyoglobin inhibitable by a nitric oxide synthase (NOS)
inhibitor, and by electron paramagnetic resonance with a spin trapping technique (1-4). In
other labs, the production of NO. has been followed by the formation of L-citrulline from
radiolabeled L-arginine (8-10). These measurements along with the use of purified, intact
mitochondria, provided experimental support for production of NO. by these organelles.
Later, we isolated and purified a protein with nitric oxide synthase activity mainly localized at
the mitochondrial membranes (mtNOS; 2). This mtNOS has characteristics similar to the mac-
isoform (antigenic crossreactivity, and tight-binding of calmodulin). In contrast, mtNOS is
constitutively expressed and membrane-bound (2).
The identification of mtNOS is a required step to assign this protein to one of the known
isoforms (brain NOS, endothelial NOS, or inducible NOS), or to depict it as a novel isoform.
The relevance of this assignment resides on understanding the expression and regulation of
mtNOS, considering the biochemical differences of NOSs. For example, the constitutive
forms, i.e., b-NOS and e-NOS, account for the rapid, transient, Ca2+- dependent production of
NO. (11-13); the inducible form, i.e., mac-NOS, causes the slow onset of Ca2+- independent
NO. synthesis in inflammatory cells (after stimulation by cytokines or lipopolysaccharides; 14-
15).
Considering the relevant role that NO. may have at modulating the O2 consumption (3)
and O2 free radical formation (5, 16) by mitochondria, it is important to gain insight on the
biochemical characterization of this protein. The goals of this study are the following: first, to
identify mtNOS; second, to study the molecular expression of mtNOS in different tissues, and
1
by guest on April 12, 2018
http://ww
w.jbc.org/
Dow
nloaded from
4
third, to investigate putative posttranslational modifications that may target this protein to
mitochondria or may affect enzymatic activity.
by guest on April 12, 2018
http://ww
w.jbc.org/
Dow
nloaded from
5
MATERIALS AND METHODS
Biological Materials
Isolation of rat liver mitochondria and Submitochondrial Fractions___ Liver mitochondria were
isolated from adult Wistar rats (180-200 g) by differential centrifugation (1, 17). Purified
mitochondria were obtained by Percoll gradient centrifugation (1, 18), subsequently washed
with 150 mM KCl to dissociate arginase (1, 19) and other nonspecifically bound proteins. The
preparations contained a contamination of non-mitochondrial origin from 1 to 4%, assessed
by evaluating enzymatic markers of liver fractions (20 and references therein). The
respiratory control ratio (RCR) of these mitochondria was 8 ± 1 and the ADP:O ratio was 1.8 ±
0.2 with succinate. Mitoplasts were obtained from Percoll-purified mitochondria subjected to
a controlled digitonin treatment. Mitoplasts, separated from OM and IMS by centrifugation,
were sonicated, and this suspension was separated in two fractions by centrifugation: soluble
(M) and particulate (IM and CS). The IM was purified using a sucrose gradient, sonicated in
water, and washed twice with KCl, to yield SMP (21). The recovery of cytochrome oxidase, a
marker for mitochondrial IM, was 43.5%. The resultant SMP contained less than 0.06% of
the OM marker, monoamine oxidase, and the IM marker, adenylate kinase, and about 2% of
the matrix-specific marker enzyme Mn-superoxide dismutase. The recoveries were based on
the total activity of the mitochondrial markers in mitochondria and SMP.
Purification of mtNOS ___ mtNOS was isolated from purified mitochondria from 6-8 rat livers,
obtained as described before (2).
Measurement of NO. production ___ The reaction medium used to follow NO
. production by
purified mtNOS or crude fractions contained 1 mM L-Arg, 1 mM magnesium acetate, 1 mM
CaCl2, 0.1 mM NADPH, 20 µM tetrahydrobiopterin, 10 mM CHAPS, 1-5 µg/ml calmodulin, in
0.1M Hepes buffer, pH 7.5 (22), and 0.05-0.5 mg of protein. mtNOS activity was followed by
absorption spectrophotometry by following the oxidation of oxymyoglobin. This assay is
based on the oxidation of oxy- to met-myoglobin by NO. (1, 23-24). This oxidation was
by guest on April 12, 2018
http://ww
w.jbc.org/
Dow
nloaded from
6
followed at 581-592 nm in a double-beam, dual-wavelength Aminco DW-2C UV-Vis
spectrophotometer at 22˚C in the presence of 1-mM oxymyoglobin (1). Albeit the detection
limit of the oxymyoglobin assay is low (nM concentrations), its specificity could be rather
broad. To overcome this shortcoming, the rate of oxymyoglobin oxidation sensitive to NG-
monomethyl-L-arginine (NMMA), an inhibitor of NOS, was considered representative of an
enzymatic production of NO. (1). The identification of NO
. as a product was performed by
electron paramagnetic resonance with a spin trapping technique as described before (1, 25-
26). Protein was determined by the Lowry assay using bovine serum albumin as a standard
(27).
Two-dimensional electrophoresis of mtNOS and MALDI-ToF analyses___ Immobilized pH
gradient (IPG) strips were rehydrated overnight in Rehydration Buffer (6 M urea, 2 M
thiourea, 2% NP-40, 2% ampholytes, 0.1 M dithiothreitol) using the Immobiline DryStrip
Reswelling Tray. One mg of crude fraction or 50 µg of purified mtNOS was solubilized in
Rehydration Buffer for 30 minutes at room temperature. The samples were then applied to
the strip during the first dimension run. The IEF was performed using the Multiphor II and the
Immobiline DryStrip Kit (Amersham Pharmacia Biotech) for 14-17 kVh (depending on the
length and pH range of the strip being used). Following the first dimension run, the strips
were equilibrated for the second dimension for 10 minutes in 0.05 M Tris, pH 6.8, 6 M urea,
30% glycerol, 1% SDS, and 25 mg/ml of dithiothreitol. Subsequently, the IPG strips were laid
atop a 10% SDS-PAGE gel and layered with 0.5% agarose in 1x Laemmli running buffer.
The electrophoresis was performed using the Hoefer SE 600 at 50 V overnight at 4˚C. After
electrophoresis, one of the gels was electroblotted to PVDF membrane (Immobilon-P,
Millipore Inc., Bedford, MA) and incubated in blocking buffer (1% nonfat dry milk, 10% goat
by guest on April 12, 2018
http://ww
w.jbc.org/
Dow
nloaded from
7
serum in Tris-buffered saline with Tween (TBST; 0.3 M NaCl, 40 mM Tris-HCl, pH 7.6, 0.1%
Tween-20) for 1 h. The blot was treated with a 1:2,000 dilution of anti-iNOS monoclonal
antibodies (catalog # N32020; Transduction Laboratories, Lexington, NY) for 1 h in blocking
buffer. The membranes were washed three times with TBST and then anti-mouse IgG,
horseradish peroxidase-conjugate antibody (Upstate Biotechnology, Lake Placid, NY) was
added in a 1:10,000 dilution. The blots were washed 3 times with TBST, and were developed
using ECL reagents. The blots were exposed to chemiluminescent-sensitive Kodak X-Omat
Blue XB-1 film (Eastman Kodak, Co.). The other gels were stained with SYPRO Ruby
(Molecular Probes) and superimposed to the films to identify the spot(s) that crossreacted
with the antibodies to iNOS. Those spots were excised from the gels, and in-gel digestion
was performed with either trypsin (sequencing grade bovine trypsin modified by reductive
methylation, obtained from Promega, Madison, WI) or endoproteinase Glu-C (protease V8,
sequencing grade from Staphylococcus aureus V8; Roche Diagnostics, Germany). The
eluted peptides were analyzed by MALDI-ToF. These analyses were performed at the
University of Minnesota, Mass Spectrometry Facilities (Minneapolis, MN). The mass
fragments were analyzed using two programs which are based on different algorithms: MS-
Fit (ProteinProspector, version 3.4.1.) and ProFound (version 4.10.5).
RT-PCR and PCR conditions ___ RNA was extracted from 1 to 2 g of freshly isolated rat
liver by the guanidium isothiocyanate method (Trizol; Gibco, Grand Island, NY) essentially as
described before (28-29). The enrichment of poly(A)+RNA was performed by using oligodT
resin (MessageMaker, Gibco). The integrity of RNA or poly(A)+-enriched fractions were
assessed by running a minigel and examining ethidium bromide staining of 18S and 28S
rRNA. To prevent the problem created by genomic DNA contamination which may lead to
false-positives (30), we used DNase-treated poly(A)+ RNA for reverse transcription. Half µg
by guest on April 12, 2018
http://ww
w.jbc.org/
Dow
nloaded from
8
of rat liver poly(A)+ RNA was treated with RQ1 RNase-Free DNase (Promega, Madison, WI)
at 37˚C for 30 minutes, then heated at 65˚C for 10 minutes to inactivate the DNase. RT-PCR
was performed using Superscript™ One-Step RT-PCR with PLATINUM® Taq (Life
Technologies, Rockville, MD). The reaction contained 1x reaction mix (containing 0.2 mM
dNTP, 1.2 mM MgSO4), 0.5 mg mRNA, 1 µl RT/Taq Mix, and 0.2 mM of both the sense and
anti-sense primers, 40 U RNaseOUT (Gibco BRL, Rockville, MD), and DEPC-treated ddH2O
to bring the final volume to 50 µl. No additional MgSO4 was required owed to the residual salt
carried over from the DNase treatment. The RT-PCR reactions, and other PCR reactions,
were carried out in a Perkin Elmer Gene Amp 2400 PCR System. Reverse transcription was
performed at 50˚C for 60 minutes. PCR amplification followed after a 2 min denaturation at
94˚C. Forty amplification cycles were performed as follows: denaturation at 94˚C for 30s,
annealing at 55˚C for 30s, and elongation at 68˚C for 3 min. A final extension was performed
at 72˚C for 7 min, and then sustained at 4û˚C. Parallel amplification of monocarboxylate
transporter-1 was performed for reference and as a positive control. PCR products were
electrophoresed on a 1.0% agarose gel using TAE buffer containing ethidium bromide and
visualized on a MultiImageFC using FluorChem 2.0 software (AlphaInnotech, San Leandro,
CA). Nested PCR reactions contained 1.25 U AmpliTaq Gold (Applied Biosystems, Foster
City, CA), 1x PCR Buffer II, 1.8 mM MgCl2, 200 mM dNTPs, 0.2 mM of both sense and anti-
sense primers, and 1 µl template from the RT-PCR reaction in a final volume of 50 µl. The
samples were denatured at 94˚C for 5 min, followed by 40 cycles of denaturation at 94˚C for
30s, annealing at 55˚C for 1 min, and extension at 68˚C for 2 min. The final extension was
held at 68˚C for 7min, then set at 4˚C until analyzed by gel electrophoresis as described
above.
PCR reactions for Figure 3 (panel A, lanes 6 and 7, and panels B & C) were performed using
the Rat MTC Panel I (Clontech, Palo Alto, CA) as the template and PCR Master Mix
(Promega, Madison, WI). The PCR conditions for the products obtained in Fig. 3A (lanes 6 &
7) were performed using 1x Master mix (1.25 U Taq DNA polymerase, 200 mM dNTPs, 1.5
by guest on April 12, 2018
http://ww
w.jbc.org/
Dow
nloaded from

9
mM MgCl2), 0.5 mM sense and anti-sense primers, and 1 ng template cDNA in a final volume
of 50 µl. Initial denaturation was carried out for 2 min at 95˚C followed by PCR. The PCR
conditions were as follows: 40 cycles of 30s denaturation at 95˚C, 30s annealing at 55˚C, and
3 min elongation at 72˚C. The final extension was performed at 72˚C for 5 min and
maintained at 4˚C until analyzed by gel electrophoresis. Nested PCR reactions were carried
out with the same reaction components and cycling conditions as the parent reactions,
except the cDNA template was substituted for 1 µl of the parent reaction and different sense
and anti-sense primers were used as indicated in the figure legend. Although the PCR
products depicted in Fig. 3B & C were also performed with cDNA from MTC panel, the
experimental conditions were slightly different from those in Fig. 3A with the following
modifications: The parent PCR reactions contained 1.25 U AmpliTaq Gold (Applied
Biosystems, Foster City, CA), 1X PCR Buffer II, 1.8 mM MgCl2, 200 mM dNTPs, 0.2 mM of
both sense and anti-sense primers, 1 ng MTC Panel cDNA in a final volume of 50 µl. The
reactions were amplified under the following conditions: denaturation at 94˚C for 5 min,
followed by 40 cycles of denaturation at 94˚C for 30s, annealing at 55˚C for 1 min, and
extension at 68˚C for 2 min. The final extension was held at 68˚C for 7 min and maintained at
4˚C.
Release and identification of mtNOS-bound fatty acid ___ Purified mtNOS (about 1 mg
protein/ml), obtained following the isolation procedure, was precipitated with 5 V of cold
acetone and kept for 30 min at –20˚C. The solution was centrifuged in a Dupont® centrifuge
in a SS-34 rotor at 10,000 g for 15 min at 4˚C. The pellet was dissolved in 0.5 ml of 2% SDS
W/V and precipitated again with 5 V of cold acetone. The solution was kept at –20˚C for 30
min and centrifuged at 10,000 g for 10 min at 4˚C. This latter procedure (SDS-treatment,
precipitation with acetone, and centrifugation) was repeated twice. The pellet was extracted
with 2 ml Cl3CH-methanol (2/1, v/v), washed with 2 ml of diethyl ether, and dried under a
stream of N2. Deacylation of the protein ___ The delipidated protein pellet was treated with 2
by guest on April 12, 2018
http://ww
w.jbc.org/
Dow
nloaded from
10
ml of 0.1 M KOH/anhydrous methanol (less than 0.01% H2O), vortexed, and incubated at
30˚C for 30 min. The solution was centrifuged at 3,000 g for 5 min, and the protein pellet was
saved for acid hydrolysis (See below). The supernatant was acidified with 6 M HCl, and
extracted three times with hexane. These extractions were combined and dried under N2.
The residue, containing the methyl esters of fatty acids originally bound to the protein by oxy-
or thio-ester linkages, was subjected to MS analysis. The protein pellet procured after the
centrifugation at 3,000 g was washed three times with ethanol and dried under N2. This pellet
was resuspended in 1 ml of 3 M HCl in anhydrous methanol and incubated at 105˚C for 20 h
in sealed tubes (earlier purged with a N2 stream) under N2 to release amide-linked fatty acids
from the protein as the corresponding methyl esters. The tubes were cooled and extracted
three times with hexane. The extracts were combined and dried under a stream of N2. The
residue was subjected to MS analysis.
Immunohystochemistry ___ NOS was immunolocalized in paraformaldehyde-fixed rat liver
slices, essentially following the procedure described in ref. 31 with the following
modifications. After fixation, the slices were permeabilized by incubating in ice-cold acetone
for 5 min, then washed 3-times with 0.1% Triton X-100 in phosphate-buffered saline (PBS-T).
The slices were blocked with 10% normal goat serum, 1% bovine serum albumin in PBS-T
for 30 min at room temperature. Primary antibody incubations were performed using a 1:500
dilution of monoclonal antibodies to bNOS (Transduction Labs) and to subunit I of
cytochrome oxidase (Molecular Probes, Eugene, OR) in blocking solution. The bNOS
antibody was labeled with Alexa Fluor™ 594 according to manufacturer's instructions
(Molecular Probes). After labeling the antibody to bNOS, the specificity of these was
confirmed by immunoblotting samples of rat liver and isolated mitochondria, using positive
and negative controls. The antibody to cytochrome oxidase was commercially available as a
conjugate with Alexa Fluor™ 488. Overnight incubation of the slices with primary antibodies
was performed in the dark in moist chambers, at 4˚C. The slices were washed 3-times for 15
by guest on April 12, 2018
http://ww
w.jbc.org/
Dow
nloaded from
11
min each with PBS-T. In some experiments, instead of the antibody to cytochrome oxidase,
mitochondria were labeled with MitoTracker Green FM (Molecular Probes) according to
manufacturer's conditions. The slices were washed with PBS-T, the nuclei labeled with 4', 6-
diamidino-2-phenylindole, dihydrochloride (DAPI) according to manufacturer's conditions
(Molecular Probes), air dried, and protected from light. The slides were mounted using
ProLong Antifade medium (Molecular Probes). Rat liver slices were observed with
epifluorescence microscopy using appropriate filters (Nikon E600) and photographed using a
digital camera (Spot II). The digital images were acquired using Metamorph software.
Brightness, contrast and background (the latter defined as areas without cells or with cells
without antibody addition) were adjusted and the images were overlaid using Adobe
Photoshop (Mountain View, CA).
by guest on April 12, 2018
http://ww
w.jbc.org/
Dow
nloaded from
12
RESULTS AND DISCUSSION
Distribution Of Nitric Oxide Synthase Activity In Liver
The recovery of rat liver NOS’ activity (followed by either the oxidation of oxymyoglobin or
14C-L-citrulline, inhibitable by an inhibitor of NOS, NG-monomethyl-L-arginine) was 70% in the
mitochondrial fraction and 45 to 50% in Percoll-purified mitochondria, supporting the
mitochondrial localization of this enzyme. The submitochondrial distribution of mtNOS
indicated that inner membrane and contact sites were the only fractions that exhibited the
presence of mtNOS by western blotting. The almost complete recovery (60 to 70%) of
mtNOS activity from mitochondria isolated from purified rat hepatocytes (>98% purity and
>98% viability by trypan blue exclusion) indicated that this enzyme was originated from
parenchymal cells, excluding contribution from other cell types. These observations were
confirmed further by (i) immunoprobing formalin-fixed liver slices for cytochrome oxidase and
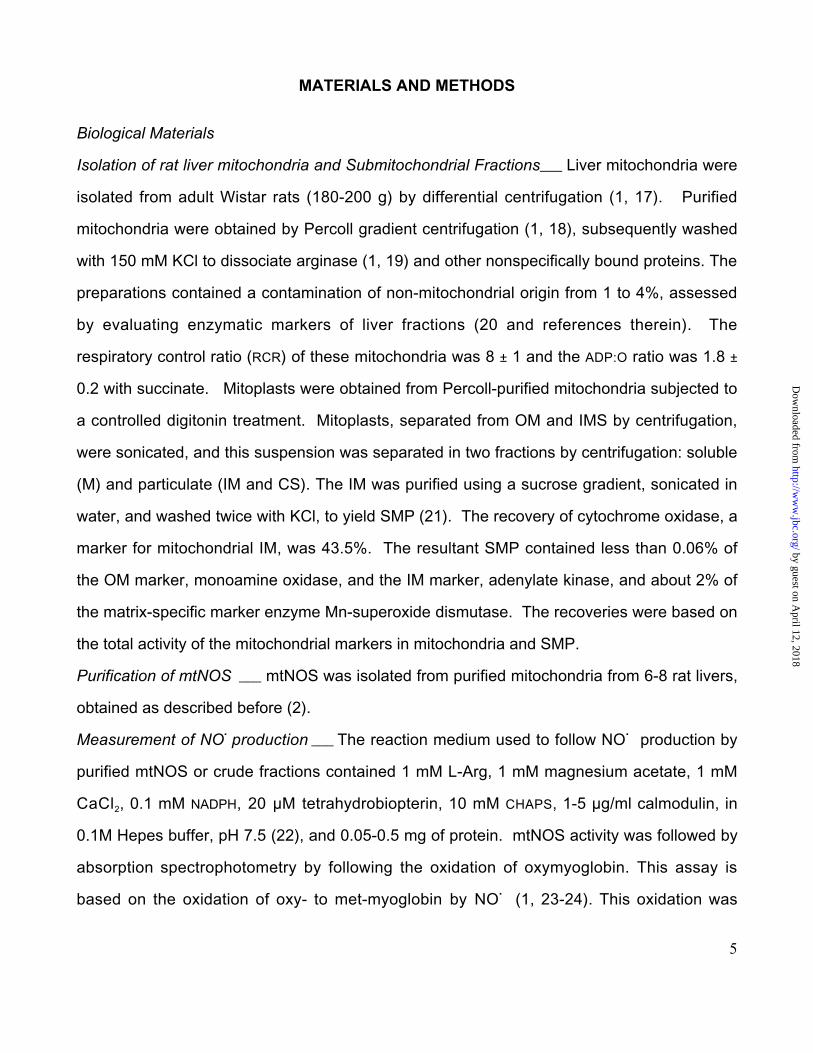
NOS, resulting in the colocalization of these proteins in parenchymal mitochondria (Fig. 1;
similar results were obtained by using MitoTracker Green instead of antibodies to cytochrome
oxidase.), and (ii) considering the high contribution of hepatocytes to liver cellular
composition (92.5%; 33) and mitochondrial volume (98.4%; 33).
Identification Of Mitochondrial Nitric-Oxide Synthase
As reported before, isolated rat liver mtNOS shared certain properties with macNOS
(antigenic crossreactivity, Vmax of the purified form), whereas the constitutive expression of
mtNOS, requirement of cofactors, and the main membrane localization suggested the
presence of either a novel isoform, or one of the well-characterized isoforms with co- or post-
translational modifications. To gain insight of the protein sequence, microsequencing of
purified mtNOS from blots was attempted; however, the finding of a blocked N-terminal
residue precluded a direct Edman degradation since the chemistry requires a free NH2 group
(or imino for Pro; ref. 34). Thus, mtNOS was separated by 2D-electrophoresis, followed by
in-gel digestion with either trypsin or endoproteinase V8. MALDI-ToF and/or Q-ToF analyses
by guest on April 12, 2018
http://ww
w.jbc.org/
Dow
nloaded from
13
were performed on the eluted fragments. The resulting peptide masses and sequences were
blasted against in-silico trypsin- or V8-digested proteins from the PDB to permit the
identification of mtNOS based on the digest profile (MALDI-ToF) and amino acid sequences
(Q-ToF). The peptidic fragments from both treatments (i.e., trypsin and endoproteinase)
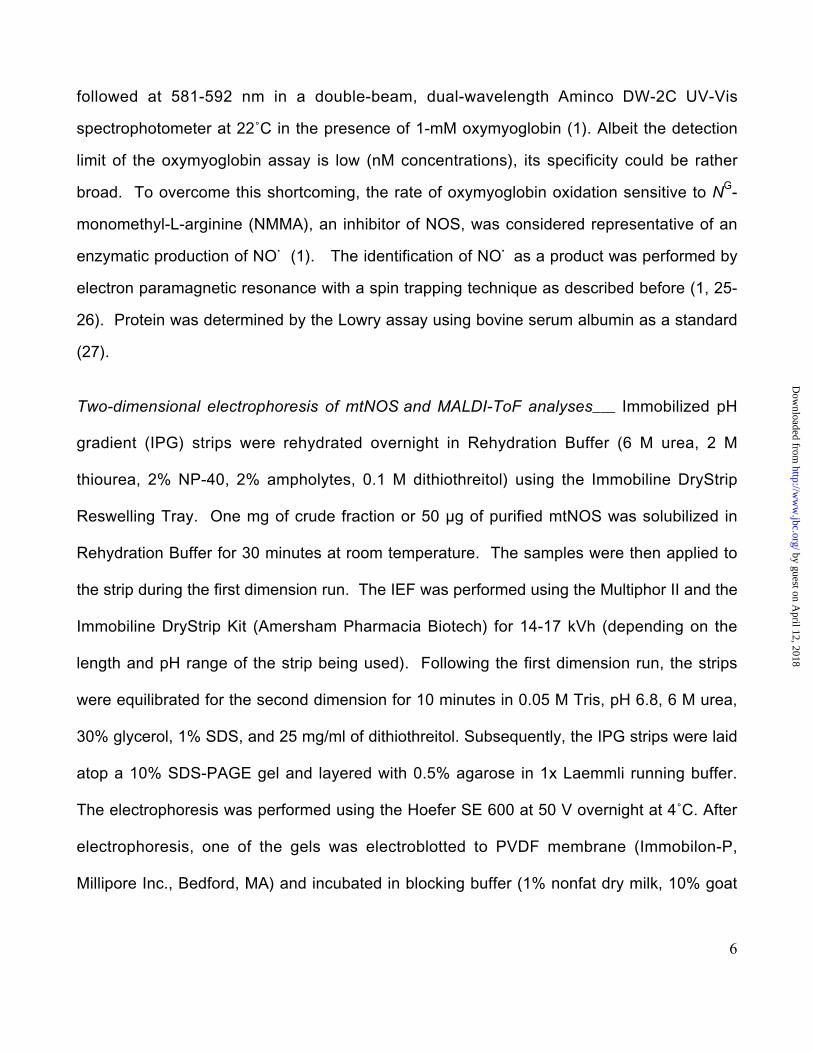
matched sequences of constitutive rat bNOS (Fig. 2). All fragments had a 100% homology to
bNOS, and only between 21 to 78% to mac- and eNOSs precluding these isoforms as
mtNOS. A minor percentage of fragments (5-10%) matched those from mature
carbamoylphosphate synthetase2 and iNOS.
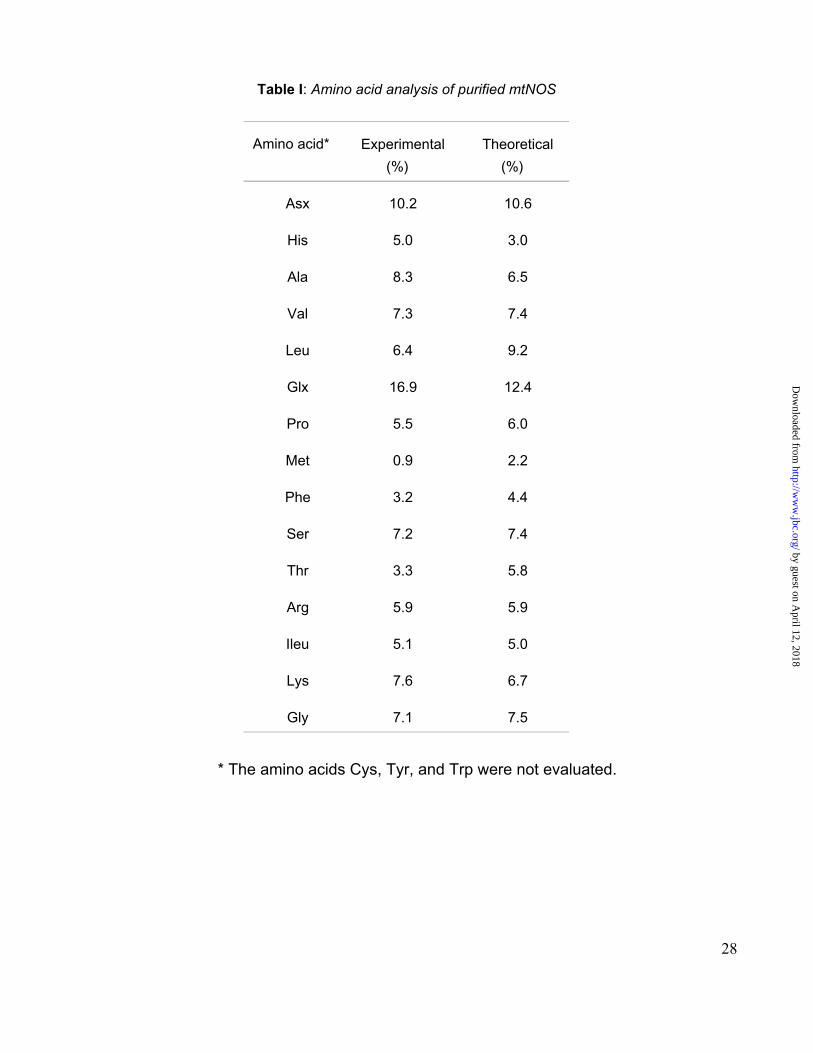
The amino acid composition of mtNOS, obtained after acid hydrolysis of the protein, closely
matched that of bNOS (Table I). The amino acid analysis combined with pI (7.0 ± 0.5) and
MW (130,000 ± 26,000) extracted from 2D-gels, in addition to the peptide mass fingerprinting
and amino acid sequences were used to perform a protein identification search using the
MultiIdent Protein Identification on the ExPASy server. The best integrated score in terms of
amino acid composition, pI, MW, and best-matching set of peptide masses for the species
Rattus resulted in bNOS (Swiss-Prot P29476).
mtNOS And Splice Variants Of bNOS
From these results (vide supra), it could be surmised that mtNOS is the brain isoform.
However, given that four splice variants of full length bNOS (nNOSα) have been identified
(nNOSβ, nNOSγ, nNOSµ, and nNOS-2; 38-40), the question remained whether mtNOS was
one of these products or represented a novel alternative splicing product. Fragments from
amino acids 238 to 242 and from 278 to 290 excluded NOSγ, whereas fragments from amino
acids 512 to 516 and from 548 to 555 precluded NOS-2. Given that the other fragments were
present in all 3 remaining isoforms (NOSα, β, and µ), the identification was not possible by
using data from MALDI or Q-ToF.
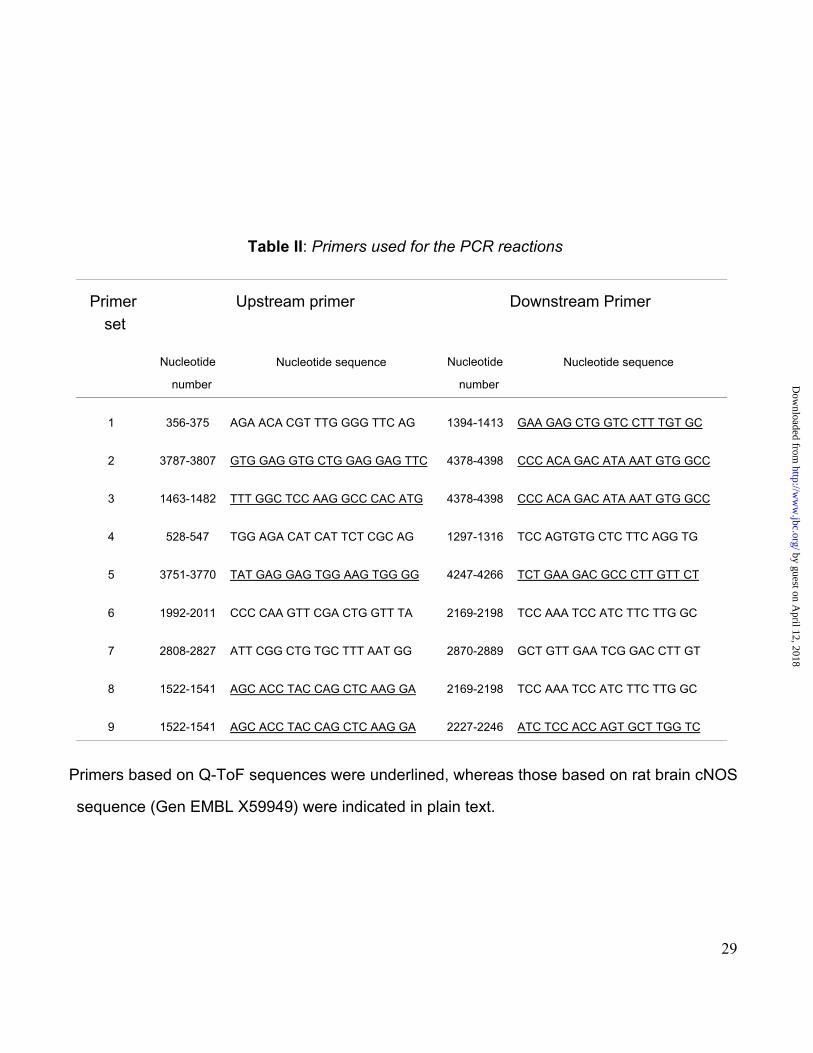
To gather more information on what type of isoform is expressed in liver, RT-PCR
experiments were performed on mRNA using primers based on either Q-ToF sequences
by guest on April 12, 2018
http://ww
w.jbc.org/
Dow
nloaded from
14
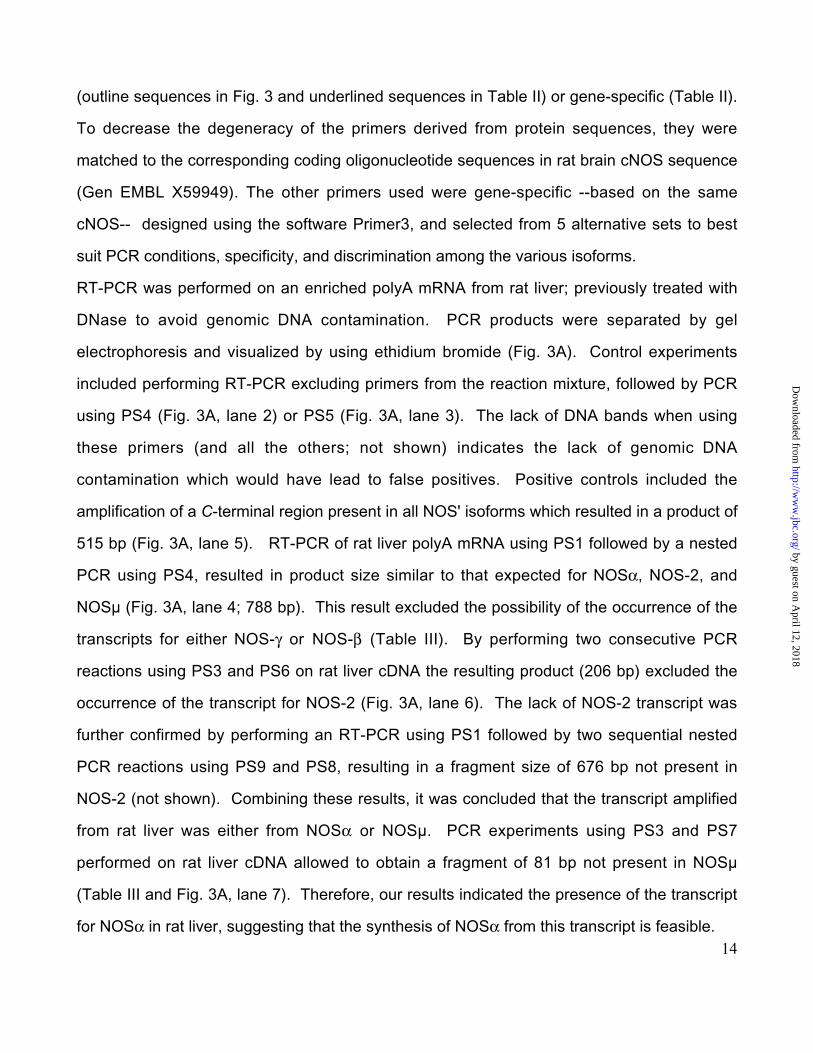
(outline sequences in Fig. 3 and underlined sequences in Table II) or gene-specific (Table II).
To decrease the degeneracy of the primers derived from protein sequences, they were
matched to the corresponding coding oligonucleotide sequences in rat brain cNOS sequence
(Gen EMBL X59949). The other primers used were gene-specific --based on the same
cNOS-- designed using the software Primer3, and selected from 5 alternative sets to best
suit PCR conditions, specificity, and discrimination among the various isoforms.
RT-PCR was performed on an enriched polyA mRNA from rat liver; previously treated with
DNase to avoid genomic DNA contamination. PCR products were separated by gel
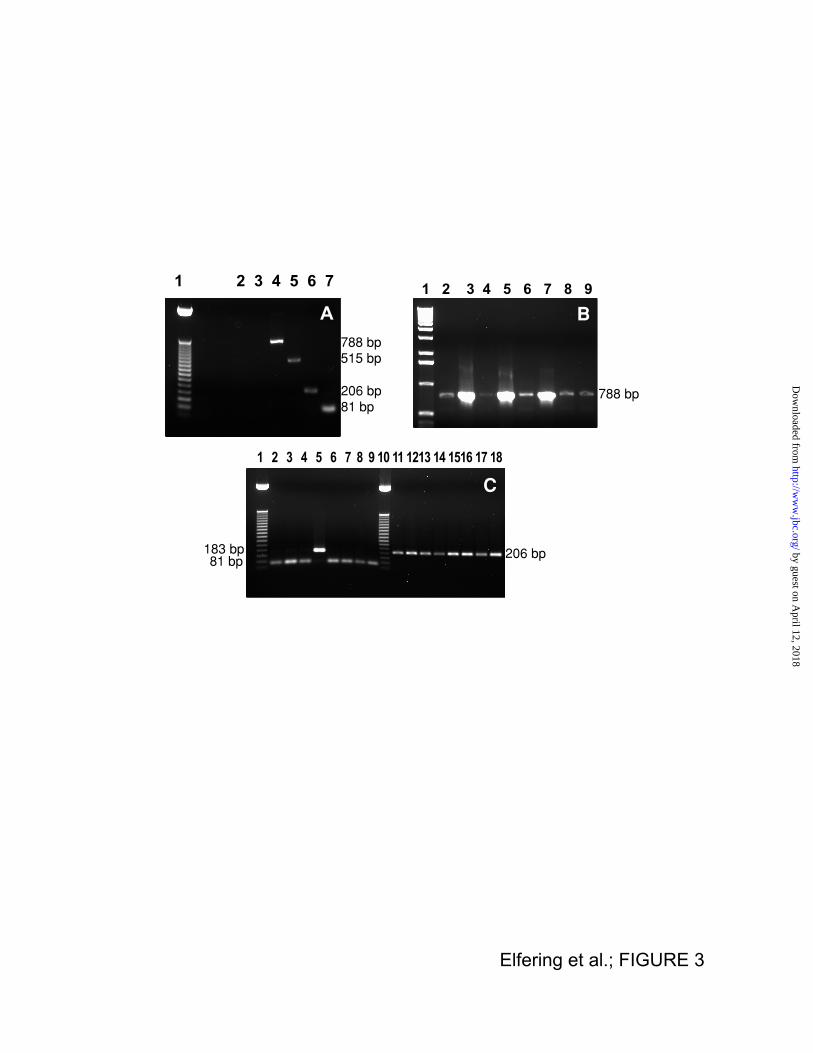
electrophoresis and visualized by using ethidium bromide (Fig. 3A). Control experiments
included performing RT-PCR excluding primers from the reaction mixture, followed by PCR
using PS4 (Fig. 3A, lane 2) or PS5 (Fig. 3A, lane 3). The lack of DNA bands when using
these primers (and all the others; not shown) indicates the lack of genomic DNA
contamination which would have lead to false positives. Positive controls included the
amplification of a C-terminal region present in all NOS' isoforms which resulted in a product of
515 bp (Fig. 3A, lane 5). RT-PCR of rat liver polyA mRNA using PS1 followed by a nested
PCR using PS4, resulted in product size similar to that expected for NOSα, NOS-2, and
NOSµ (Fig. 3A, lane 4; 788 bp). This result excluded the possibility of the occurrence of the
transcripts for either NOS-γ or NOS-β (Table III). By performing two consecutive PCR
reactions using PS3 and PS6 on rat liver cDNA the resulting product (206 bp) excluded the
occurrence of the transcript for NOS-2 (Fig. 3A, lane 6). The lack of NOS-2 transcript was
further confirmed by performing an RT-PCR using PS1 followed by two sequential nested
PCR reactions using PS9 and PS8, resulting in a fragment size of 676 bp not present in
NOS-2 (not shown). Combining these results, it was concluded that the transcript amplified
from rat liver was either from NOSα or NOSµ. PCR experiments using PS3 and PS7
performed on rat liver cDNA allowed to obtain a fragment of 81 bp not present in NOSµ
(Table III and Fig. 3A, lane 7). Therefore, our results indicated the presence of the transcript
for NOSα in rat liver, suggesting that the synthesis of NOSα from this transcript is feasible.
by guest on April 12, 2018
http://ww
w.jbc.org/
Dow
nloaded from
15
Confirmation of the identity of these PCR products was obtained by purifying the fragments
from the gel, and sequencing them and/or performing restriction maps with Not I (not shown).
The DNA sequences were blasted against the Genome rodent database and the results
matched those from rat brain NOS-1 (Fig. 2, bold sequences).
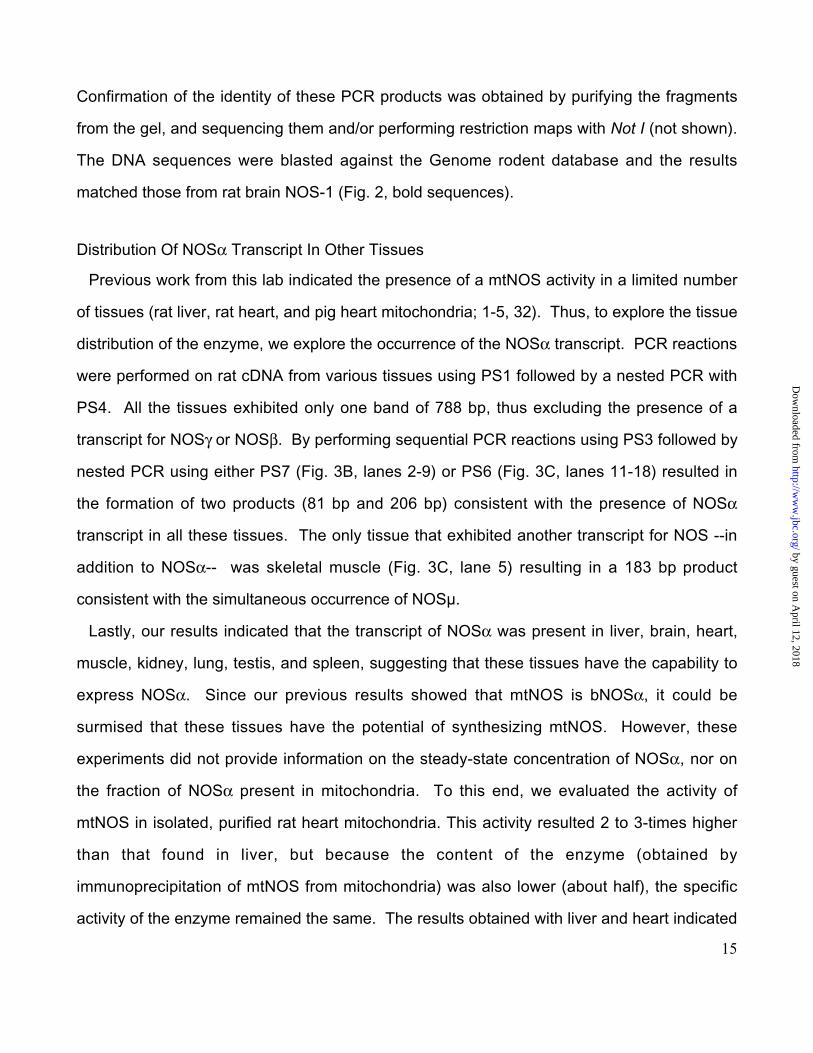
Distribution Of NOSα Transcript In Other Tissues
Previous work from this lab indicated the presence of a mtNOS activity in a limited number
of tissues (rat liver, rat heart, and pig heart mitochondria; 1-5, 32). Thus, to explore the tissue
distribution of the enzyme, we explore the occurrence of the NOSα transcript. PCR reactions
were performed on rat cDNA from various tissues using PS1 followed by a nested PCR with
PS4. All the tissues exhibited only one band of 788 bp, thus excluding the presence of a
transcript for NOSγ or NOSβ. By performing sequential PCR reactions using PS3 followed by
nested PCR using either PS7 (Fig. 3B, lanes 2-9) or PS6 (Fig. 3C, lanes 11-18) resulted in
the formation of two products (81 bp and 206 bp) consistent with the presence of NOSα
transcript in all these tissues. The only tissue that exhibited another transcript for NOS --in
addition to NOSα-- was skeletal muscle (Fig. 3C, lane 5) resulting in a 183 bp product
consistent with the simultaneous occurrence of NOSµ.
Lastly, our results indicated that the transcript of NOSα was present in liver, brain, heart,
muscle, kidney, lung, testis, and spleen, suggesting that these tissues have the capability to
express NOSα. Since our previous results showed that mtNOS is bNOSα, it could be
surmised that these tissues have the potential of synthesizing mtNOS. However, these
experiments did not provide information on the steady-state concentration of NOSα, nor on
the fraction of NOSα present in mitochondria. To this end, we evaluated the activity of
mtNOS in isolated, purified rat heart mitochondria. This activity resulted 2 to 3-times higher
than that found in liver, but because the content of the enzyme (obtained by
immunoprecipitation of mtNOS from mitochondria) was also lower (about half), the specific
activity of the enzyme remained the same. The results obtained with liver and heart indicated
by guest on April 12, 2018
http://ww
w.jbc.org/
Dow
nloaded from
16
that the content of active mtNOS followed that of the transcripts, with the understanding that
this association between activity and content of transcript might not be applicable to other
tissues.
Acylation Of Mitochondrial Nitric-Oxide Synthase
Comparison of the activities of permeabilized mitochondria and SMP indicated that most
NOS activity (30-40%) was detected in the latter fraction, suggesting a localization of the
enzyme at the inner mitochondrial membrane (1-2). The association of mtNOS with
membranes was further supported using a mild detergent to solubilize the enzyme during the
purification procedure (2). The main particulate distribution of mtNOS resembled that of
eNOS (41). The specific distribution of eNOS has been attributed to the presence of an N-
myristoylated terminal and palmitoylated Cys residues (42-43) which may allow a protein-
membrane association. The presence of a blocked N-terminal group in mtNOS, aside from
its membrane distribution, lead us to investigate whether mtNOS was acylated.
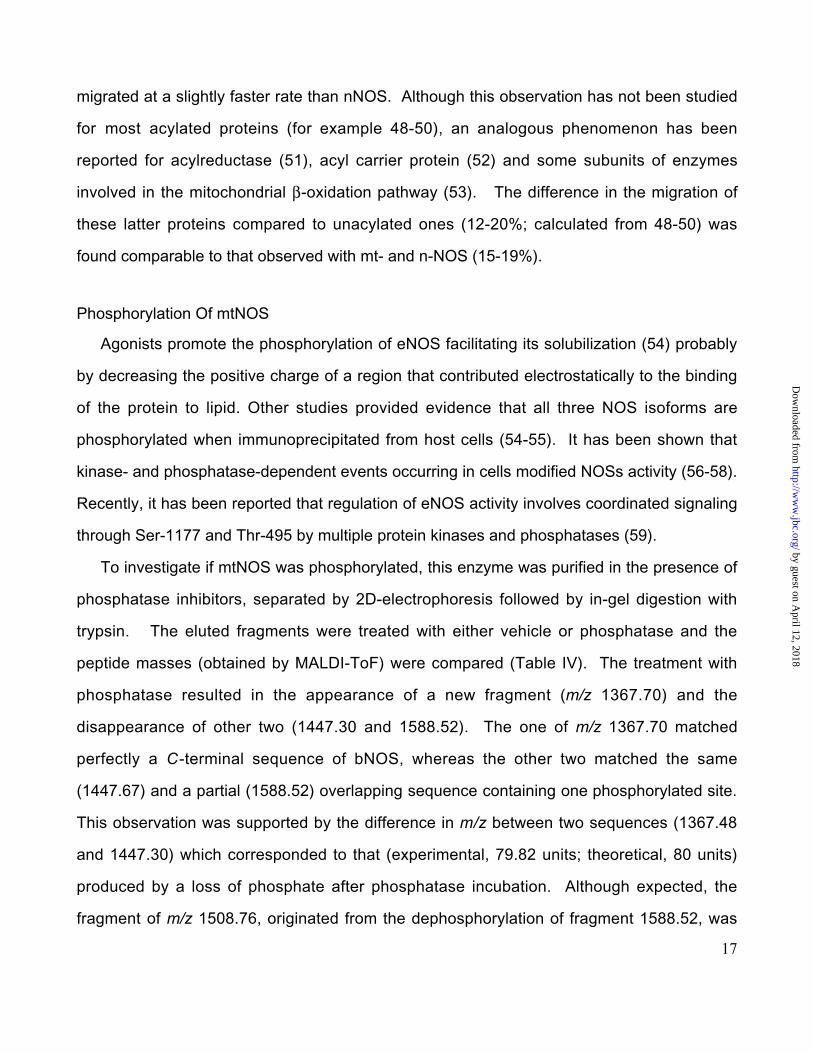
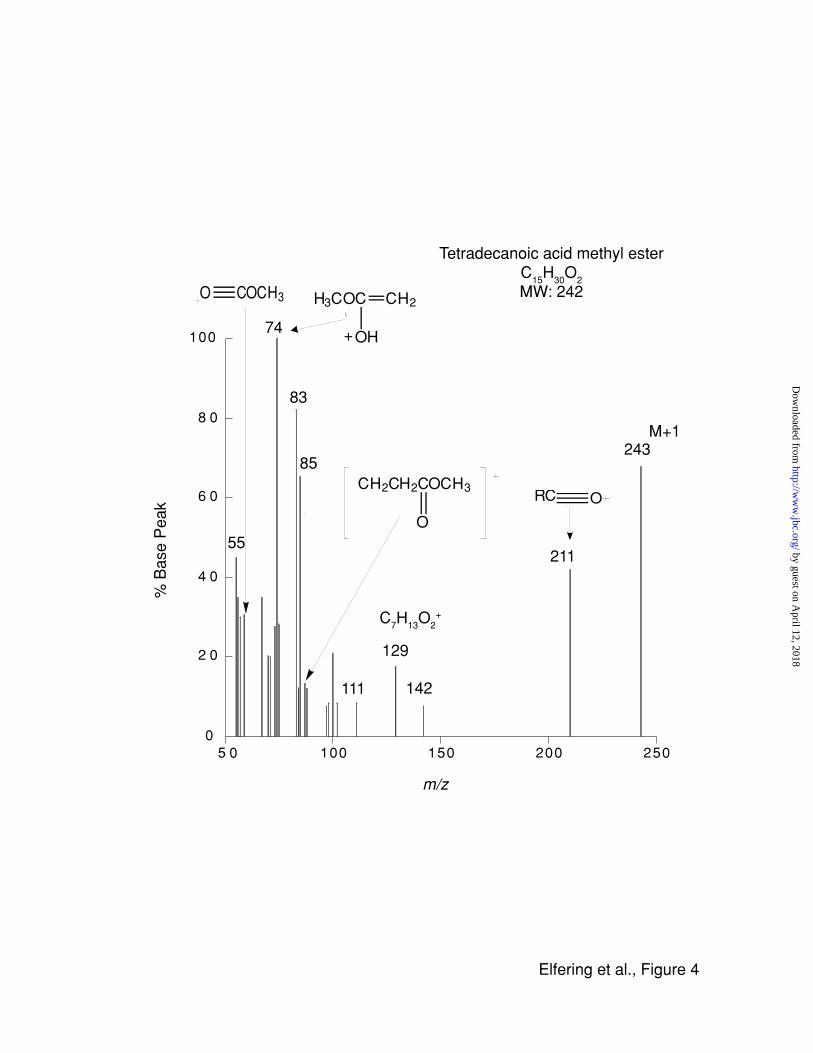
To this end, samples of purified mtNOS were precipitated with acetone, washed with organic
solvents (to remove any unspecifically bound lipids), and finally subjected to alkaline
methanolysis to release methyl esters derivatives of the fatty acids. The derivatives were
extracted with hexane, and the fatty acids were identified by mass spectrometry upon
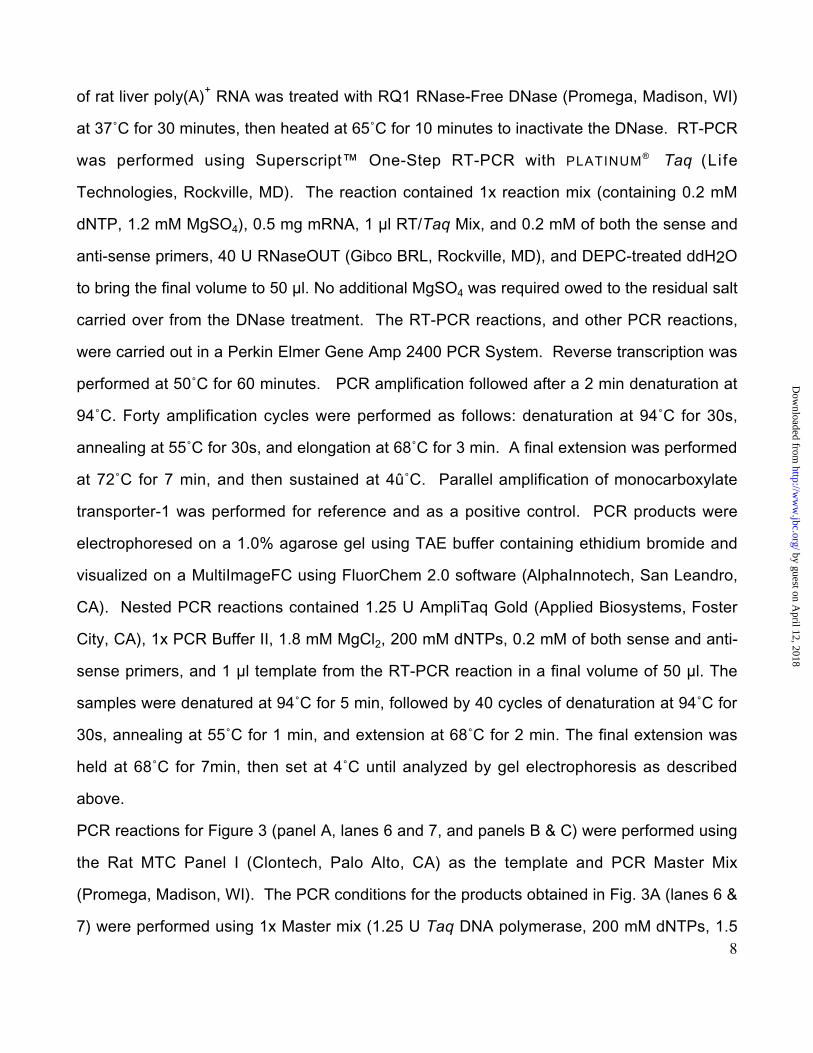
comparison with standards. About 80 to 100% of the fatty acids were recovered as the
methyl ester derivative of myristic acid (Fig. 4) after alkaline methanolysis indicating that this
fatty acid was linked through an oxy- or thio-ester. The starting material had 0.56 nmol of
enzyme and 0.7 nmol of fatty acid was recovered in this procedure indicating that the ratio of
lipid: protein was near unity. The present finding, that mtNOS is acylated with myristic acid
via an ester bond, is consistent with a reversible and posttranslational process, probably
catalyzed by acyltransferases (44-47).
The acylation of mtNOS might explain the discrepancy between the MW of NOSα (160 kDa)
and that obtained from SDS-PAGE and immunoblotting which indicated that mtNOS
by guest on April 12, 2018
http://ww
w.jbc.org/
Dow
nloaded from
17
migrated at a slightly faster rate than nNOS. Although this observation has not been studied
for most acylated proteins (for example 48-50), an analogous phenomenon has been
reported for acylreductase (51), acyl carrier protein (52) and some subunits of enzymes
involved in the mitochondrial β-oxidation pathway (53). The difference in the migration of
these latter proteins compared to unacylated ones (12-20%; calculated from 48-50) was
found comparable to that observed with mt- and n-NOS (15-19%).
Phosphorylation Of mtNOS
Agonists promote the phosphorylation of eNOS facilitating its solubilization (54) probably
by decreasing the positive charge of a region that contributed electrostatically to the binding
of the protein to lipid. Other studies provided evidence that all three NOS isoforms are
phosphorylated when immunoprecipitated from host cells (54-55). It has been shown that
kinase- and phosphatase-dependent events occurring in cells modified NOSs activity (56-58).
Recently, it has been reported that regulation of eNOS activity involves coordinated signaling
through Ser-1177 and Thr-495 by multiple protein kinases and phosphatases (59).
To investigate if mtNOS was phosphorylated, this enzyme was purified in the presence of
phosphatase inhibitors, separated by 2D-electrophoresis followed by in-gel digestion with
trypsin. The eluted fragments were treated with either vehicle or phosphatase and the
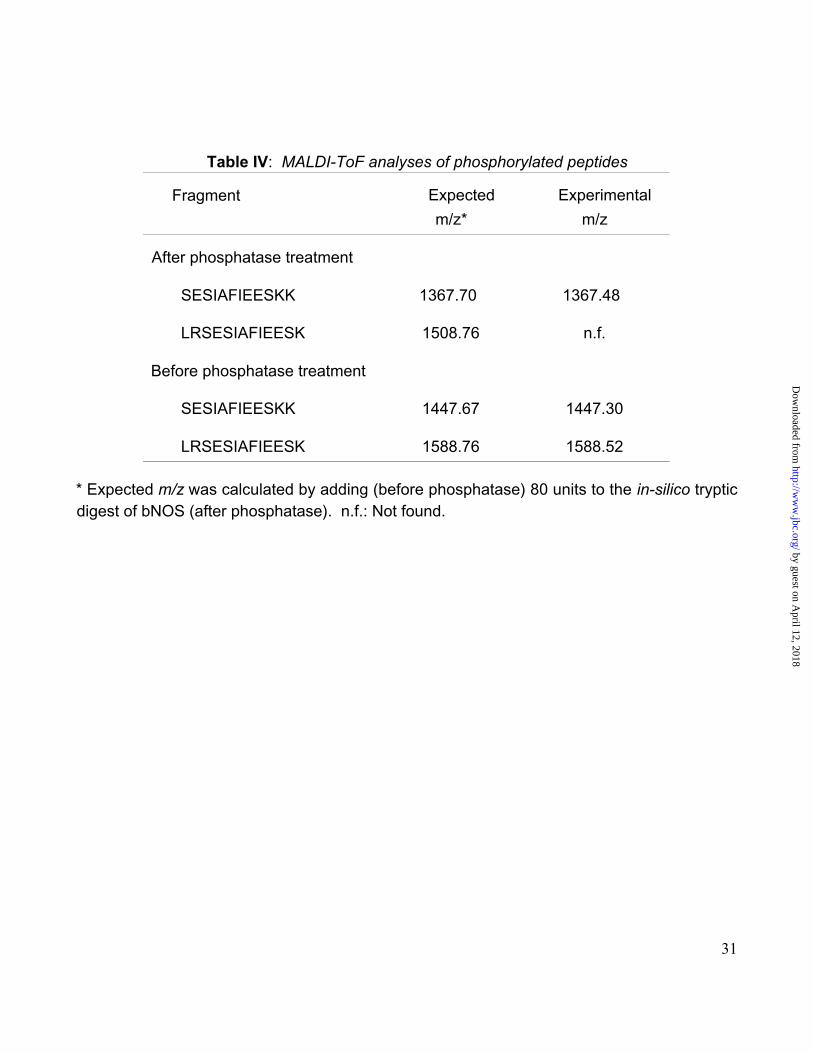
peptide masses (obtained by MALDI-ToF) were compared (Table IV). The treatment with
phosphatase resulted in the appearance of a new fragment (m/z 1367.70) and the
disappearance of other two (1447.30 and 1588.52). The one of m/z 1367.70 matched
perfectly a C-terminal sequence of bNOS, whereas the other two matched the same
(1447.67) and a partial (1588.52) overlapping sequence containing one phosphorylated site.
This observation was supported by the difference in m/z between two sequences (1367.48
and 1447.30) which corresponded to that (experimental, 79.82 units; theoretical, 80 units)
produced by a loss of phosphate after phosphatase incubation. Although expected, the
fragment of m/z 1508.76, originated from the dephosphorylation of fragment 1588.52, was
by guest on April 12, 2018
http://ww
w.jbc.org/
Dow
nloaded from
18
not obtained.
These results indicated that mtNOS isolated from rat liver was phosphorylated, and we
identified the fragment in which this phosphorylation was present. It is evident from our
results that Ser is the phosphorylation site for no Thr or Tyr is present in that fragment (Table
IV). Although our experiments did not indicate which Ser from the 3 possible ones present in
this fragment was phosphorylated, two indications pointed out to Ser-1412: first, two putative
Akt phoshorylation motifs (RXRXXS/T; underlined sequences see below) are present in
eNOS (Ser 635 and 1179 in bovine eNOS; Ser 633 and 1177 in human eNOS) and one motif
is present in nNOS (Ser 1412 in rat, 1415 in human, and 1179 in bovine nNOS), with no
obvious motifs found in iNOS (60); second, by aligning the 3 rat NOS isoforms using
CLUSTALW (see below), the phosphorylated Ser found in bovine (Ser-1179) or human
eNOS (Ser-1177) is homologous to rat bNOS Ser-1412 :
>TQQGKLSEEDAGVFISRLRDDNRYHEDIFGVTLRTYEVTNRLRSESIAFIEESKK---------DADEVFSS nNOS
>ATEGGMELDEAGDVIGVLRDQQRYHEDIFGLTLRTQEVTSRIRTQSFSLQERQLRGAVPWSFDPPGPEIPGS eNOS
>AAKLNLSEEQVEDYFFQLKSQKRYHEDIFGAVFSYGAKKGNTLEEPKGTRL--------------------- iNOS
The phosphorylation of this fragment (in addition to the acylation) might add to the faster
migration of mtNOS compared to nNOS, and provides support for the lower affinity to
monoclonal antibodies to the C-terminal region of nNOS and the crossreactivity to iNOS
earlier observed (1-5).
Conclusions
Our results unequivocally indicate that mitochondria are endowed with a NOS, extending
and confirming our (1-5, 16, 32) and others' (6-10) previous results. mtNOS was identified as
bNOSα with posttranslational modifications. This conclusion is supported by the amino acid
analysis, pI, MW, tryptic- and endoproteinase-peptidic maps, and peptide sequences. The
identification of mtNOS with bNOS has also been suggested through functional studies
performed on isolated cardiac mitochondria of bNOS wild-type and knockout mice (61).
by guest on April 12, 2018
http://ww
w.jbc.org/
Dow
nloaded from
19
Given the important role that endogenous NO. has on regulating the O2 consumption and
ATP production of mitochondria (3-5) it is not surprising that the enzyme is localized close to
its target site, cytochrome oxidase. We have showed (3-4) that the production of NO. by
mitochondria modulated the O2 consumption of the organelle by competitive inhibition of
cytochrome oxidase; and, as a consequence, the O2 free radical production (5). In this
regard, the broader implications of our work can help to redefine the way we view regulation
of O2 consumption in vivo. Based on our initial findings, it can be proposed that mitochondrial
production of NO. helps average O2 utilization between cells at different distances from
capillaries. The basic concept is that NO. will slow O2 consumption by cells closest to blood
vessels, allowing O2 to penetrate to cells at the boundary of becoming hypoxic (65). In
addition, NO. might help dilate blood vessels and potentially increase O2 delivery to
borderline hypoxic cells (65).
Regarding the covalent modifications found in mtNOS, i.e., acylation and phosphorylation, it
could be speculated that they are important to target (as with other proteins, e.g., ref. 62)
and regulate mtNOS' activity. Interest in covalent modifications of proteins has been
strengthened by the observations that several viral transforming proteins have covalently
attached lipid. The observations that mutants of the transforming proteins p21 and p60src
that lack acylation are transformation-defective and no longer associated with the plasma
membrane (63-64) serve to underline the importance of the attachment of lipid to these
proteins for full expression of their transforming potential. In the case of mtNOS, and
considering that the acylation pattern of eNOS is required for localization to plasmalemmal
caveolae of endothelial cells (43), it could be speculated that acylation is a required step to
target the protein to mitochondria after its cytosolic synthesis, or its acylation (once inside
mitochondria) facilitates its membrane localization closer to cytochrome oxidase.
The other covalent modification, phosphorylation of Ser, may indicate a more direct pathway
to regulate mtNOS' activity. In fact, phosphorylation of eNOS Ser-1179 enhances the ability
of the enzyme to generate NO. (59-60). Although the mechanism by which this
by guest on April 12, 2018
http://ww
w.jbc.org/
Dow
nloaded from
20
phosphorylation increases NO. production has not been elucidated, it has been proposed
that the addition of a negative charge at this site may permit the binding of calmodulin at
resting Ca2+ concentrations (60). If this is the case for mtNOS, then phosphorylation could
represent the main pathway by which this enzyme is regulated without the need for increases
in mitochondrial Ca2+, operating continuously under "resting" Ca2+ concentrations, regulating
the O2 consumption by the [NO. ]/[O2] ratios as it was proposed by our lab before (3-5).
by guest on April 12, 2018
http://ww
w.jbc.org/
Dow
nloaded from
21
REFERENCES
1. Giulivi, C., Poderoso, J. J. and Boveris, A. (1998). J. Biol. Chem. 273, 11038-43.
2. Tatoyan, A. and Giulivi, C. (1998) J. Biol. Chem. 273, 11044-48.
3. Giulivi, C. (1998) Biochem. J. 332, 673-679.
4. Giulivi, C., Sarkela, T. M., Berthiaume, J., and Elfering, S. (1999) FASEB J. 13, A1554.
5. Sarkela, T., Berthiaume, J., Elfering, S., Gybina, A. and Giulivi, C. (2001) J. Biol. Chem.
276, 6945-6949.
6. Bates, T.E., Loesch, A., Burnstock, G., and Clark, J. B. (1995) Biochem. Biophys. Res.
Commun. 213, 896-898.
7. Bates, T.E., Loesch, A., Burnstock, G., and Clark, J. B. (1996) Biochem. Biophys. Res.
Commun. 218, 40-44.
8. Kobzik, L., Stringer, B., Ballingand, J-L., Reid, M. B., and Stamler, J. S. (1995) Biochem.
Biophys. Res. Commun. 211, 375-381.
9. Ghafourifar, P. and Richter, C. (1997) FEBS Lett. 418:291-296.
10. Ghafourifar, P., Schenk, U., Klein, S.D., and Richter, C. (1999) J. Biol Chem. 274, 31185-
31188.
11. Bredt, D. S. and Snyder, S. H. (1990) Proc. Natl. Acad. Sci. U.S.A. 87, 682-685.
12. Mayer, B., John, M., and Bohme, E. (1990) FEBS Lett. 277, 215-219.
13. Schmidt, H. H. W., Pollock, J. S., Nakane, M., Gorsky, L. D., F_rstermann, U., and Murad,
F. (1991) Proc. Natl. Acad. Sci. U.S.A. 88, 365-369.
14. Stuehr, D.J. and Marletta, M.A. (1987) J. Immunol. 139, 518-525.
15. Förstermann, U., Schmidt, H.H.H.W., Kohlhaas, K.L., and Murad, F (1992) Eur. J.
Pharmacol. 225, 161-165.
16. Steffen, M., Sarkela, T. M., Gybina, A. A., Steele, T. W., Traaseth, N. J., Kuehl, D., and
Giulivi, C. (2001) Biochem. J. 356, 395-402.
by guest on April 12, 2018
http://ww
w.jbc.org/
Dow
nloaded from
22
17. Chance, B. and Hagihara, B. (1963) Proc. 5th Internatl. Congress Biochem. Moscow:
Intracellular Respiration: Phosphorylating and non-phosphorylating oxidation reactions.
(Slater, E. C., ed.) vol. V, pp.3-37, Pergamon Press, New York.
18. Hovius, R., Lambechts, H., Nicolay, K., and de Kruijff (1990) Biochim. Biophys. Acta 1021,
217-226.
19. Cheung, C-W., and Raijman, L. (1981) Arch. Biochem. Biophys. 209, 643-649.
20. Reinhart, P. H., Taylor, W. M., and Bygrave, F. (1982) Biochem. J. 204, 731-735.
21. Pedersen, P. L., Greenawalt, J. W., Reynafarje, B., Hullihen, J., Decker, G. L., Soper, J.
W. and Bustamante, E. (1979) Meth. Cell Biol. 20, 411-481.
22. Hevel, J. M. and Marletta, M. A. (1994) Meth. Enzymol. 233, 250-258.
23. Doyle, M.P and Hoekstra, J.W. (1981) J. Inorg. Biochem. 14, 351-358.
24. Murphy, M.E. and Noack, E. (1994) Meth. Enzymol. 233, 240-250.
25. Kotake, Y. (1996) Meth. Enzymol. 268, 222-229.
26. Kotake, Y., Tanigawa, T., Tanigawa, M., Ueno, I., Allen, D. R., and Lai, C-S. (1996)
Biochim. Biophys. Acta 1289, 362-368.
27. Lowry, O. H., Rosenbrough, N. H., Farr, A.L., and Randall, J.R. (1951) J. Biol. Chem. 193,
265-275.
28. Tsukamoto, H., Lin, M., Ohata, M., Giulivi, C., French, S. W., and Brittenham, G. (1999)
Am. J. Physiol. 277, G1240-G1250.
29. Liu, R-M., Shi, M. M., Giulivi, C., and Forman, H. J. (1998) Am. J. Physiol. 274, L330-L336.
30. Minc-Golomb, D. and Schwartz, J. P. (1996) Expression of constitutive brain nitric oxide
synthase and inducible nitric oxide synthase by cultured neurons and glia. In: Nitric oxide
synthase: Characterization and functional analysis (M. D. Maines, ed.) Academic Press, New
York, NY.
31. Nakane, P. K. (1996) Immunohistochemical methods for nitric oxide synthase. In: Nitric
by guest on April 12, 2018
http://ww
w.jbc.org/
Dow
nloaded from
23
oxide synthase: Characterization and functional analysis. (Maines, M. D., ed.) Academic
Press, San Diego, CA. pp. 54-56.
32. French, S., Giulivi, C., and Balaban, R. S. (2001) Am. J. Physiol. 280, H2863-7.
33. Blouin, A., Bolender, R.P., and Weibel, E.R. (1977) J. Cell Biol. 72, 441-455.
34. Geisow, M. J. and Aitken, A. (1989) In: Protein Sequencing: A Practical Approach (Findlay
and M. J. GIesow, eds.), pp. 85-99. IRL Press, Oxford.
35. Gamble, J. G. and Lehninger, A. L. (1973) J. Biol. Chem. 248, 610-8.
36. Raijman, L. and Jones, M. E. (1976) Arch. Biochem. Biophys. 175, 270-8.
37. Lusty, C. J. (1978) Eur. J. Biochem. 85, 373-383.
38. Ogura, T., Yokoyama, T., Fujisawa, H., Kurashima, Y., and Esumi, H. (1993) Biochem.
Biophys. Res. Commun. 193, 1014-1022.
39. Silvagno, F., Xia, H., and Bredt, D. S. (1996) J. Biol. Chem. 271, 11204-08.
40. Brenman, J. E., Xia, H., Chao, D. S., Black, S. M., and Bredt, D. S. (1997) Dev. Neurosci.
19, 224-231.
41. Pollock, J.S., F_rstermann, U., Mitchell, J.A., Wraner, T.D., Schmidt, H.H.H.W., Nakane, M.,
and Murad, F. (1991) Proc. Natl. Acad. Sci. USA 88, 10480-10484.
42. Liu, J. and Sessa, W. (1994) J. Biol. Chem. 269, 11691-11694.
43. Busconi, L., and Michel, T. (1993) J. Biol. Chem. 268, 8410-8413.
44. Magee, A. I., Koyama, A. H., Malfer, C., Wen, D., and Schlesinger, M. J. (1984) Biochim.
Biophys. Acta 798, 156-66.
45. Olson, E. N., Towler, D. A., and Glaser, L. (1985) J. Biol. Chem. 260, 3784-90.
46. Simon, S. M. and Aderem, A. (1992) J. Biol. Chem. 267, 3922-31.
47. Towler, D. and Glaser, L. (1986) Biochemistry 25, 878-84.
48. Adam, M., Rodriguez, A., Turbide, C., Larrick, J., Meighen, E., and Johnstone, R. M.
(1984) J. Biol. Chem. 259, 15460-63.
by guest on April 12, 2018
http://ww
w.jbc.org/
Dow
nloaded from
24
49. Schmidt, M. F. G., Bracha, M., and Schlesinger, M. J. (1979) Proc. Natl. Acad. Sci.
U.S.A. 76, 1687-91.
50. Magee, A. I., and Schlesinger, M. J. (1982) Biochim. Biophys. Acta 694, 279-89.
51. Wall, L., Rodriguez, A. and Meighen, E. (1986) J. Biol. Chem. 261, 15981-88.
52. Jaworski, J. G., and Stumpf, P. K. (1974) Arch. Biochem. Biophys. 162, 166-73.
53. Stucki, J. W., Lehmann, L. H. and Siegel, E. (1989) J. Biol. Chem. 264, 6376-6380.
54. Michel, T., Li, G. K., and Busconi, L. (1993) Proc. Natl. Acad. Sci. USA 90, 6252-6256.
55. Dawson, T. M., Steiner, J. P., Dawson, V. L., Dinerman, J. L., Uhl, G. R., and Snyder, S. H.
(1993) Proc. Natl. Acad. Sci. USA 90, 9808-9812.
56. Bredt, D. S., Ferris, C. D., and Snyder, S. H. (1992) J. Biol. Chem. 267, 10976-10981.
57. Nakane, M., Mitchell, J., F_rstermann, U., and Murad, F. (1991) Biochem. Biophys. Res.
Commun. 180, 1396-1402.
58. Brune, B., and Lapetina, E. G. (1991) Biochem. Biophys. Res. Commun. 181, 921-926.
59. Michell, B. J., Chen, Z-p., Tiganis, T., Stapleton, D., Katsis, F., Power, D. A., Sim, A. T.,
and Kemp, B. E. (2001) J. Biol. Chem. 276, 17625-17628.
60. Fulton, D., Gratton, J-P., McCabe, T. J., Fontana, J., Fujio, Y., Walsh, K., Franke, T. F.,
Papapetropoulos, A., and Sessa, W. C. (1999) Nature 399, 597-601.
61. Kanai, A.J.; Pearce, L.L.; Clemens, P.R.; Birder, L.A.; VanBibber, M.M.; Choi, S.Y.; de
Groat, W.C.; Peterson, J. (2001) Proc. Natl. Acad. Sci. USA 98:14126-141231.
62. Olson, E. N. and Spizz, G. (1986) J. Biol. Chem. 261, 2458-2466.
63. Willumsen, B. M., Norris, K., Papageorge, A. G., Hubbert, N. L., and Lowy, D. R. (1984)
EMBO J. 3, 2581-2585.
64. Kamps, M. P., Buss, J. E., and Sefton, B. M. (1985) Proc. Natl. Acad. Sci. USA 82,
4625-8.
65. Giulivi, C. (2002) Free Radical Biol. Med. , submitted.
by guest on April 12, 2018
http://ww
w.jbc.org/
Dow
nloaded from
25
FOOTNOTES:
1.Abbreviations: NO. , nitric oxide; NOS, nitric-oxide synthase; b- or n-NOS, brain or
neuronal NOS; eNOS, endothelial NOS; iNOS, inducible NOS; mtNOS, mitochondrial NOS;
NMMA, NG-monomethyl-L-arginine; SMP, submitochondrial particles; OM, outer membrane;
IM, inner membrane; CS, contact sites; IMS, intermembrane space; M, matrix; MALDI-ToF;
matrix-assisted laser desorption ionization with time of flight; Q-ToF; quadrupole mass
spectrometry with time of flight; PS, primer set.
2. Although carbamoylphosphate synthetase I is present in the mitochondrial matrix (35),
contamination with this protein is not unexpected given its high concentration (estimated to
represent between 13 to 17% of total mitochondrial protein; 0.4-0.5 mM (36) or 1-1.5 mM
(37)). Assuming that contamination with this enzyme resulted from its entrapment in
membrane vesicles during the sonication procedure, the latter procedure was performed in
water, followed by washes with 0.15 M KCl. The resulting preparation resulted in
undetectable activity of carbamoylphosphate synthetase, without affecting the MS profile of
bNOS.
ACKNOWLEDGEMENTS
We thank Drs. Kent Froberg (Dept. Anatomy), Janet Fitzakerley (Dept. Pharmacology), and
Matthew Ruona with their assistance with the microscopy studies. We appreciate the support
of the staff and the use of imaging software at the Visualization and Digital Imaging
Laboratory, University of Minnesota.
by guest on April 12, 2018
http://ww
w.jbc.org/
Dow
nloaded from
26
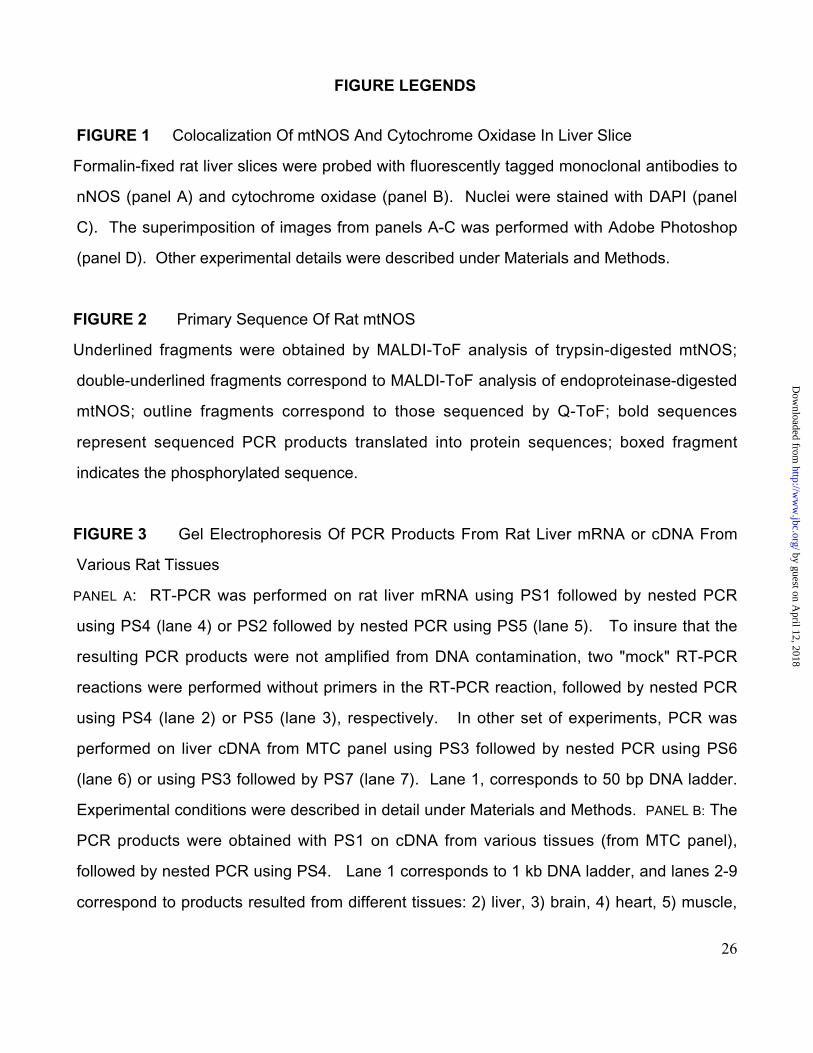
FIGURE LEGENDS
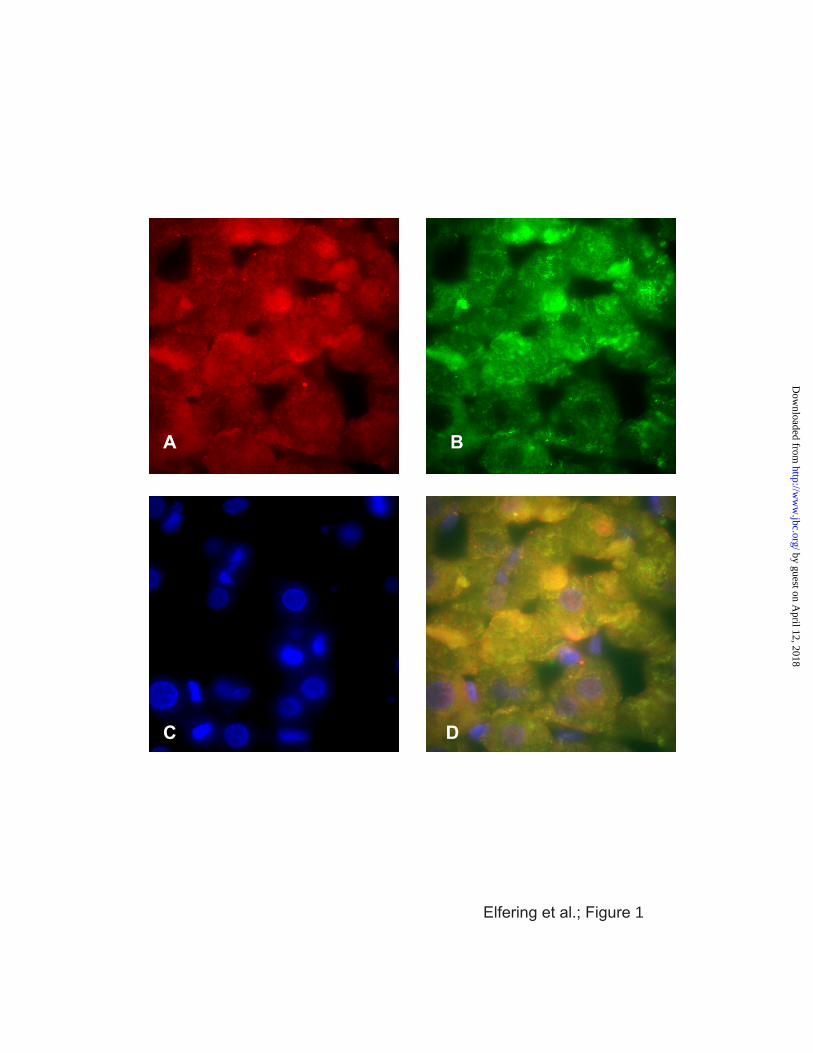
FIGURE 1 Colocalization Of mtNOS And Cytochrome Oxidase In Liver Slice
Formalin-fixed rat liver slices were probed with fluorescently tagged monoclonal antibodies to
nNOS (panel A) and cytochrome oxidase (panel B). Nuclei were stained with DAPI (panel
C). The superimposition of images from panels A-C was performed with Adobe Photoshop
(panel D). Other experimental details were described under Materials and Methods.
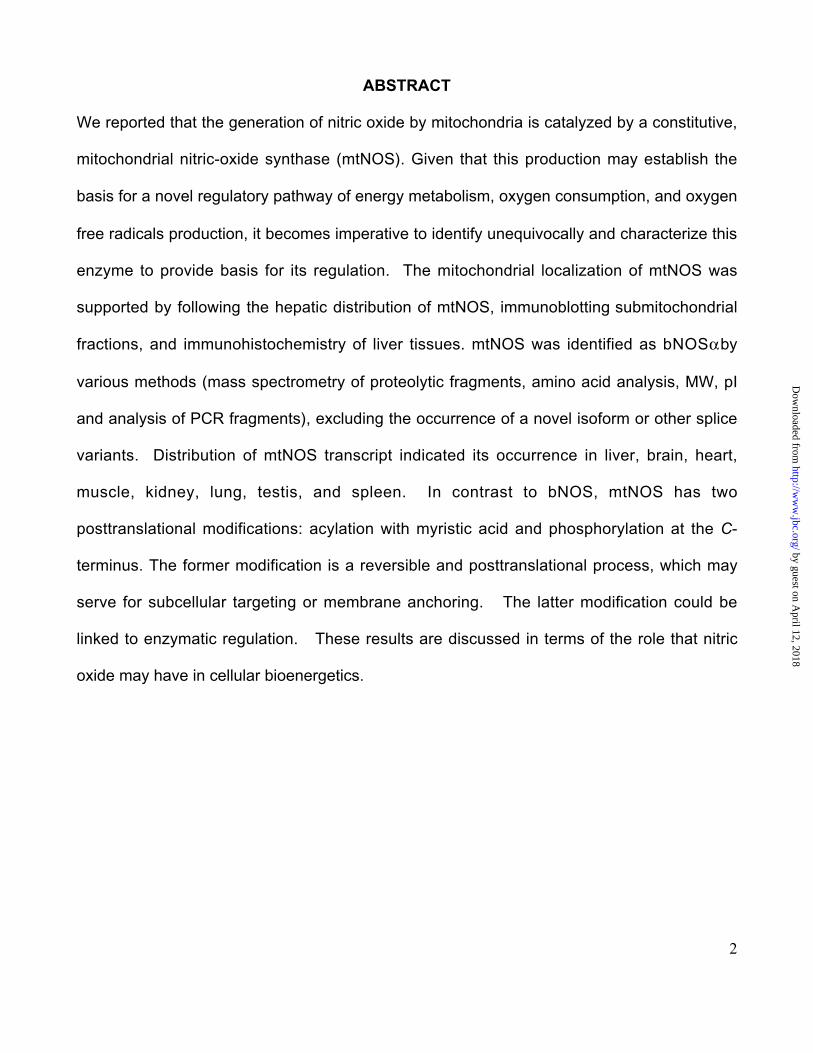
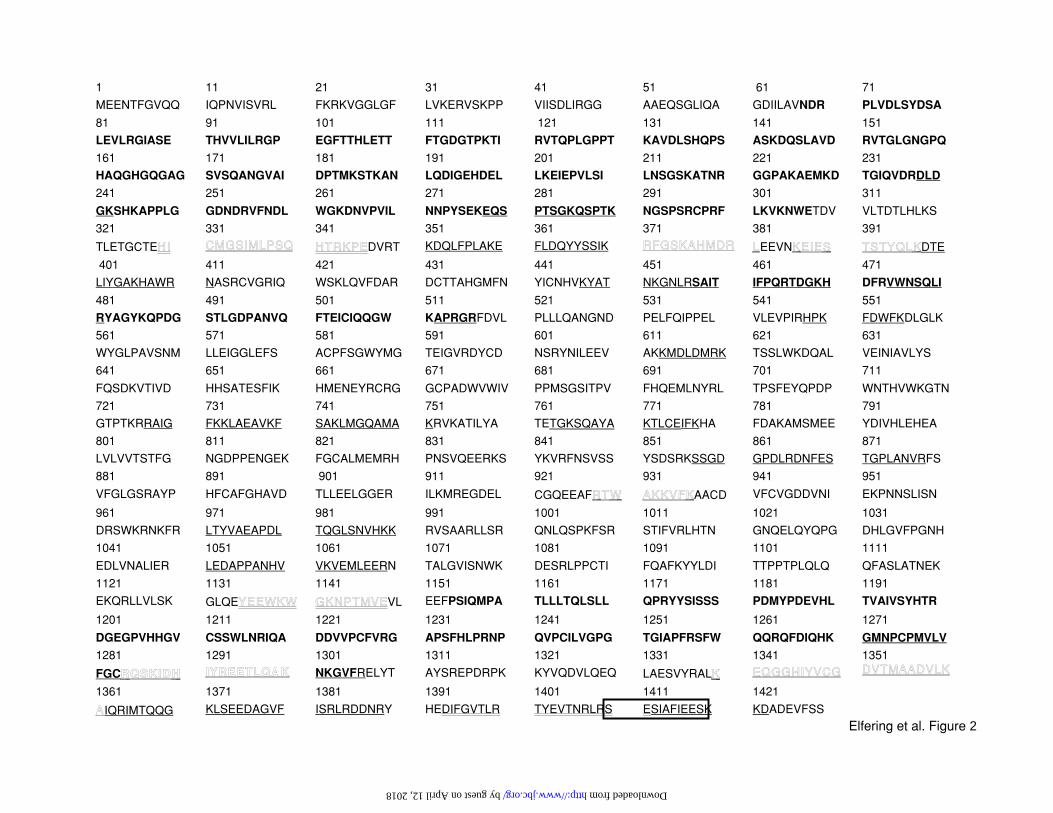
FIGURE 2 Primary Sequence Of Rat mtNOS
Underlined fragments were obtained by MALDI-ToF analysis of trypsin-digested mtNOS;
double-underlined fragments correspond to MALDI-ToF analysis of endoproteinase-digested
mtNOS; outline fragments correspond to those sequenced by Q-ToF; bold sequences
represent sequenced PCR products translated into protein sequences; boxed fragment
indicates the phosphorylated sequence.
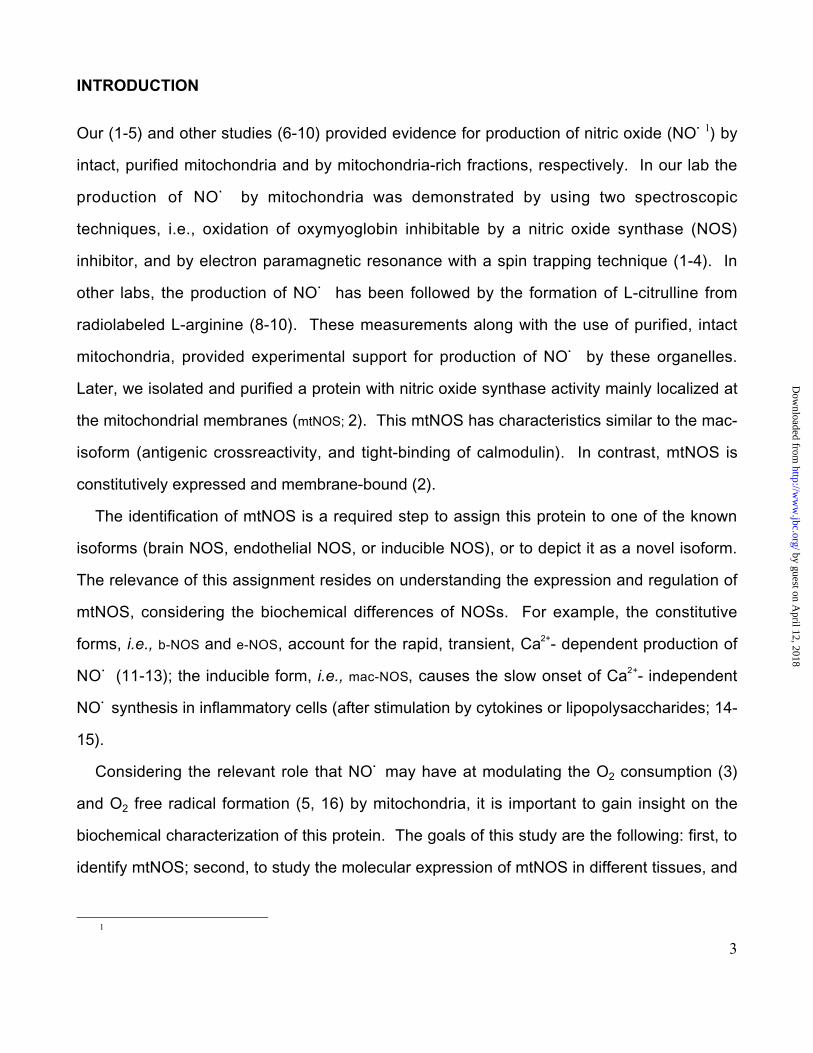
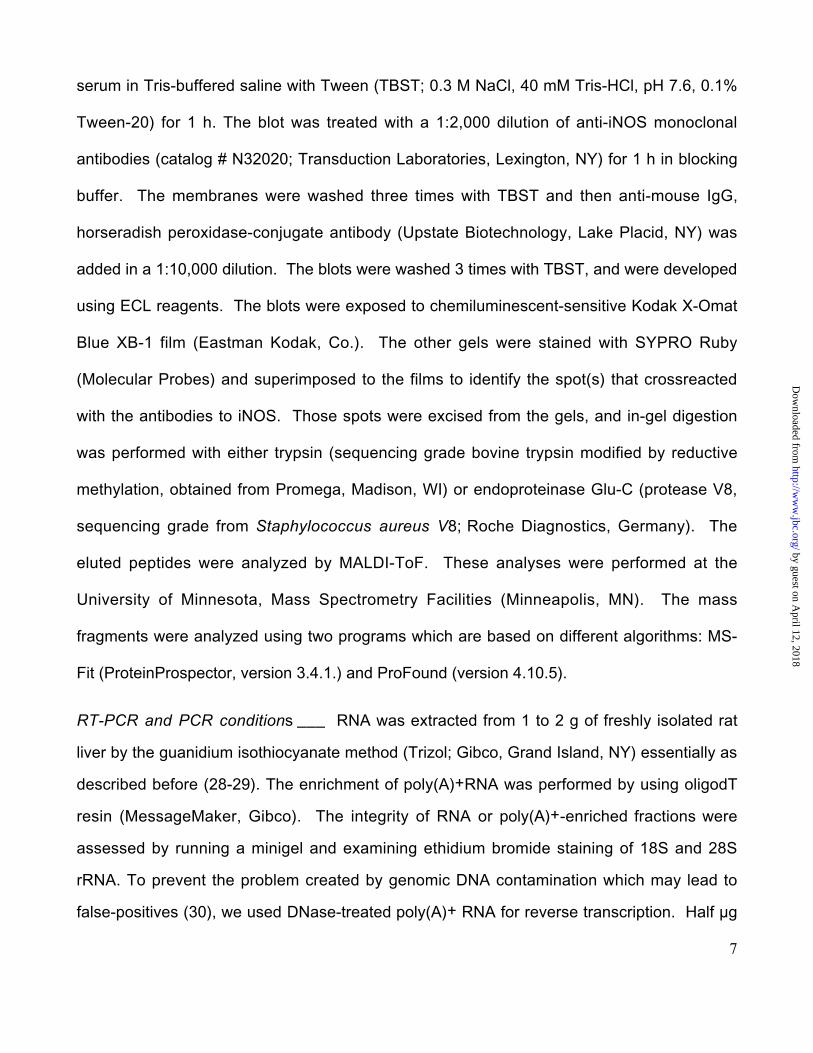
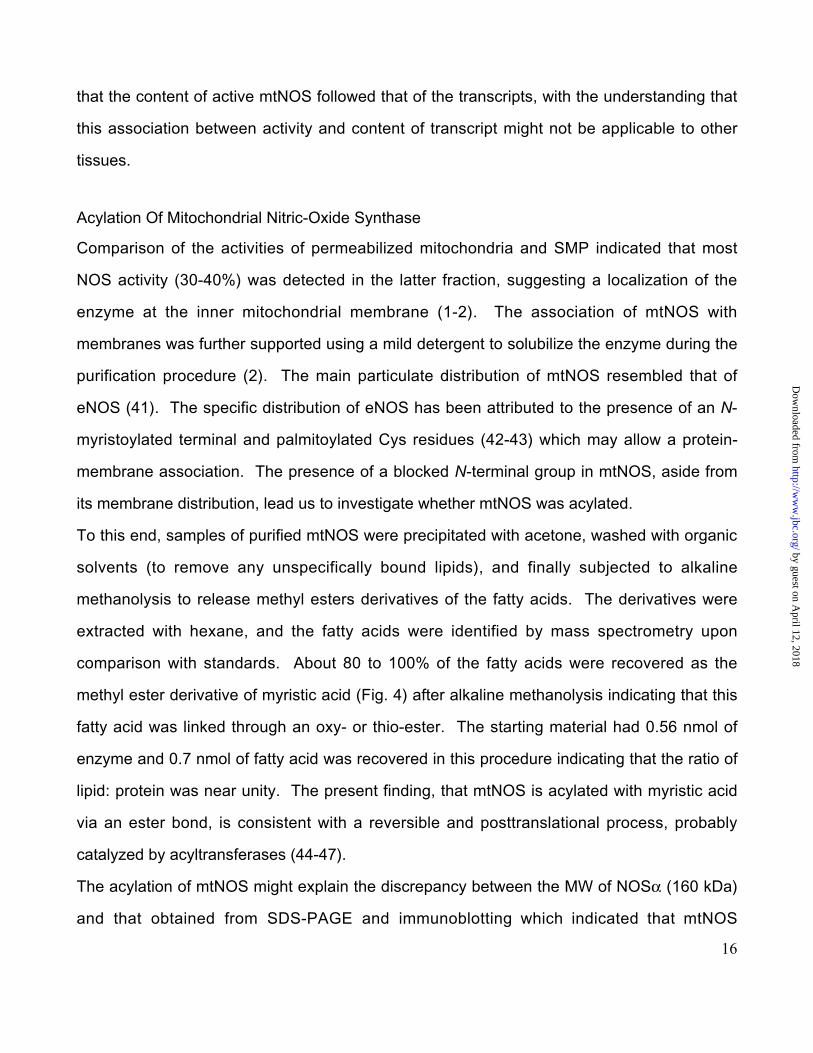
FIGURE 3 Gel Electrophoresis Of PCR Products From Rat Liver mRNA or cDNA From
Various Rat Tissues
PANEL A: RT-PCR was performed on rat liver mRNA using PS1 followed by nested PCR
using PS4 (lane 4) or PS2 followed by nested PCR using PS5 (lane 5). To insure that the
resulting PCR products were not amplified from DNA contamination, two "mock" RT-PCR
reactions were performed without primers in the RT-PCR reaction, followed by nested PCR
using PS4 (lane 2) or PS5 (lane 3), respectively. In other set of experiments, PCR was
performed on liver cDNA from MTC panel using PS3 followed by nested PCR using PS6
(lane 6) or using PS3 followed by PS7 (lane 7). Lane 1, corresponds to 50 bp DNA ladder.
Experimental conditions were described in detail under Materials and Methods. PANEL B: The
PCR products were obtained with PS1 on cDNA from various tissues (from MTC panel),
followed by nested PCR using PS4. Lane 1 corresponds to 1 kb DNA ladder, and lanes 2-9
correspond to products resulted from different tissues: 2) liver, 3) brain, 4) heart, 5) muscle,
by guest on April 12, 2018
http://ww
w.jbc.org/
Dow
nloaded from
27
6) kidney, 7) lung, 8) testis, and 9) spleen. PANEL C: PCR products obtained using PS3 on
cDNA from the MTC panel followed by nested PCR using PS7 (lanes 2-9) or PS6 (lanes 11-
18). Lanes 1 and 10 correspond to the 50 bp DNA ladder; liver (2 and 11), brain (3 and 12),
heart (4 and 13), muscle (5 and 14), kidney (6 and 15), lung (7 and 16), testis (8 and 17),
spleen (9 and 18).
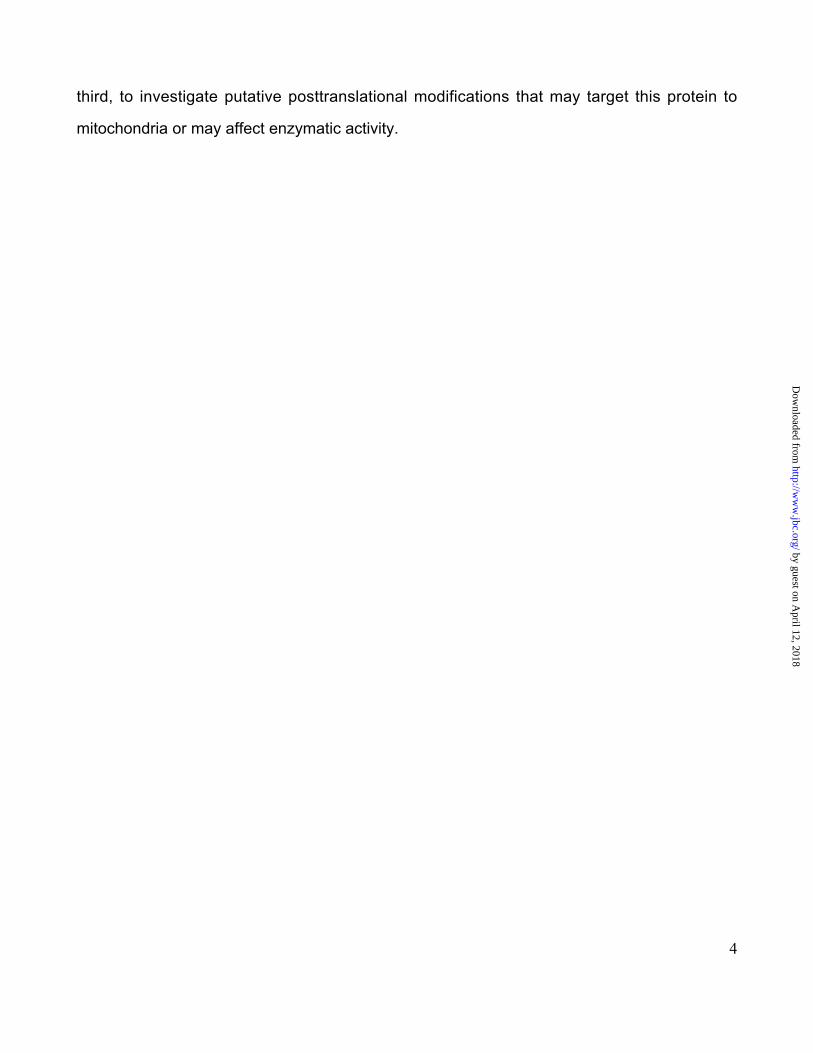
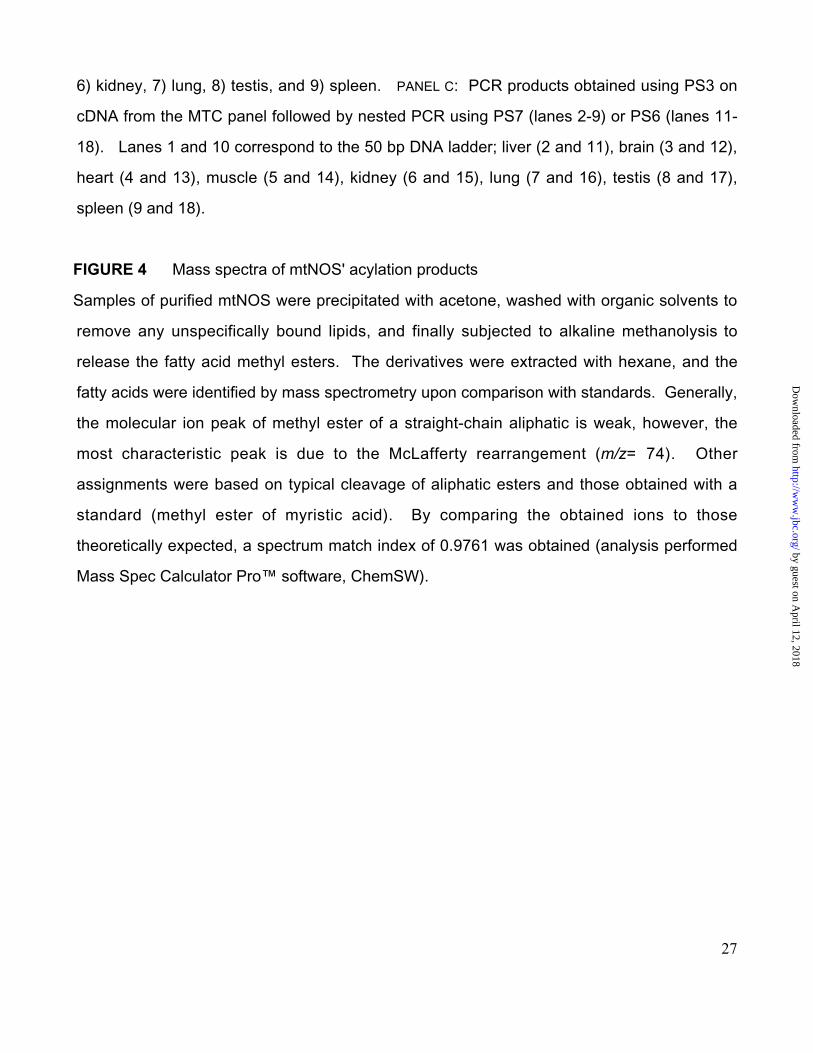
FIGURE 4 Mass spectra of mtNOS' acylation products
Samples of purified mtNOS were precipitated with acetone, washed with organic solvents to
remove any unspecifically bound lipids, and finally subjected to alkaline methanolysis to
release the fatty acid methyl esters. The derivatives were extracted with hexane, and the
fatty acids were identified by mass spectrometry upon comparison with standards. Generally,
the molecular ion peak of methyl ester of a straight-chain aliphatic is weak, however, the
most characteristic peak is due to the McLafferty rearrangement (m/z= 74). Other
assignments were based on typical cleavage of aliphatic esters and those obtained with a
standard (methyl ester of myristic acid). By comparing the obtained ions to those
theoretically expected, a spectrum match index of 0.9761 was obtained (analysis performed
Mass Spec Calculator Pro™ software, ChemSW).
by guest on April 12, 2018
http://ww
w.jbc.org/
Dow
nloaded from
28
Table I: Amino acid analysis of purified mtNOS
Amino acid* Experimental
(%)
Theoretical
(%)
Asx 10.2 10.6
His 5.0 3.0
Ala 8.3 6.5
Val 7.3 7.4
Leu 6.4 9.2
Glx 16.9 12.4
Pro 5.5 6.0
Met 0.9 2.2
Phe 3.2 4.4
Ser 7.2 7.4
Thr 3.3 5.8
Arg 5.9 5.9
Ileu 5.1 5.0
Lys 7.6 6.7
Gly 7.1 7.5
* The amino acids Cys, Tyr, and Trp were not evaluated.
by guest on April 12, 2018
http://ww
w.jbc.org/
Dow
nloaded from
29
Table II: Primers used for the PCR reactions
Primer
set
Upstream primer Downstream Primer
Nucleotide
number
Nucleotide sequence Nucleotide
number
Nucleotide sequence
1 356-375 AGA ACA CGT TTG GGG TTC AG 1394-1413 GAA GAG CTG GTC CTT TGT GC
2 3787-3807 GTG GAG GTG CTG GAG GAG TTC 4378-4398 CCC ACA GAC ATA AAT GTG GCC
3 1463-1482 TTT GGC TCC AAG GCC CAC ATG 4378-4398 CCC ACA GAC ATA AAT GTG GCC
4 528-547 TGG AGA CAT CAT TCT CGC AG 1297-1316 TCC AGTGTG CTC TTC AGG TG
5 3751-3770 TAT GAG GAG TGG AAG TGG GG 4247-4266 TCT GAA GAC GCC CTT GTT CT
6 1992-2011 CCC CAA GTT CGA CTG GTT TA 2169-2198 TCC AAA TCC ATC TTC TTG GC
7 2808-2827 ATT CGG CTG TGC TTT AAT GG 2870-2889 GCT GTT GAA TCG GAC CTT GT
8 1522-1541 AGC ACC TAC CAG CTC AAG GA 2169-2198 TCC AAA TCC ATC TTC TTG GC
9 1522-1541 AGC ACC TAC CAG CTC AAG GA 2227-2246 ATC TCC ACC AGT GCT TGG TC
Primers based on Q-ToF sequences were underlined, whereas those based on rat brain cNOS
sequence (Gen EMBL X59949) were indicated in plain text.
by guest on April 12, 2018
http://ww
w.jbc.org/
Dow
nloaded from
30
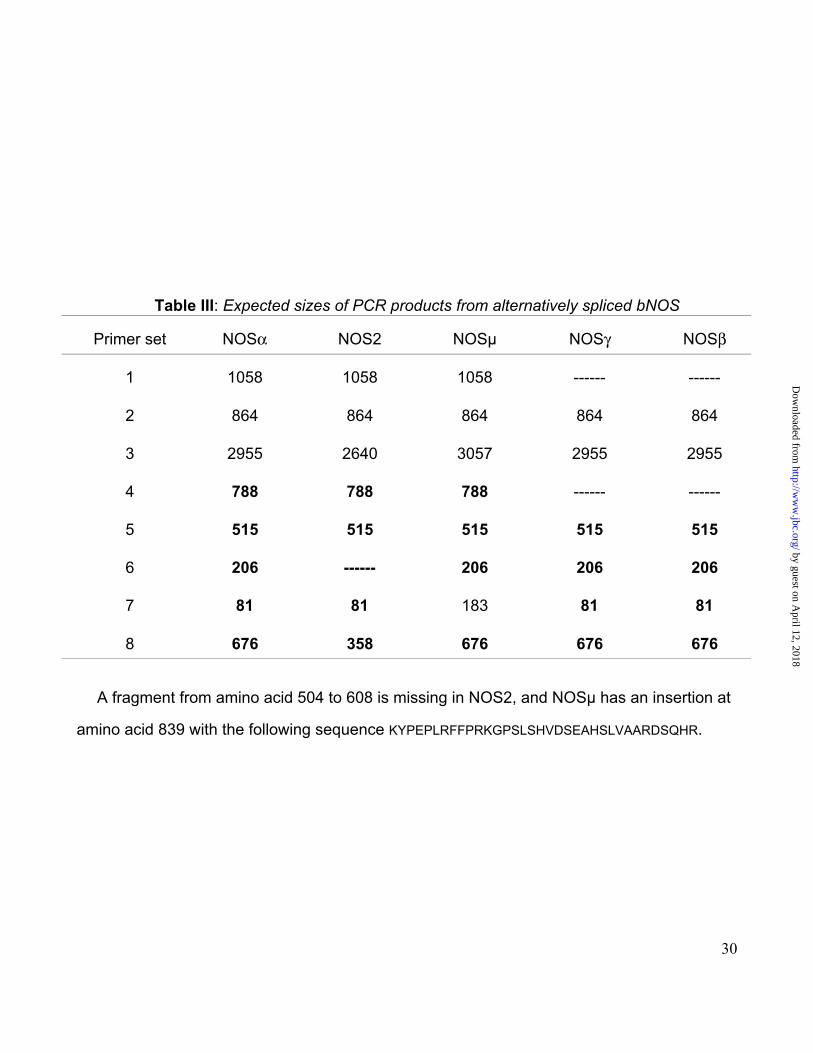
Table III: Expected sizes of PCR products from alternatively spliced bNOS
Primer set NOSα NOS2 NOSµ NOSγ NOSβ
1 1058 1058 1058 ------ ------
2 864 864 864 864 864
3 2955 2640 3057 2955 2955
4 788 788 788 ------ ------
5 515 515 515 515 515
6 206 ------ 206 206 206
7 81 81 183 81 81
8 676 358 676 676 676
A fragment from amino acid 504 to 608 is missing in NOS2, and NOSµ has an insertion at
amino acid 839 with the following sequence KYPEPLRFFPRKGPSLSHVDSEAHSLVAARDSQHR.
by guest on April 12, 2018
http://ww
w.jbc.org/
Dow
nloaded from
31
Table IV: MALDI-ToF analyses of phosphorylated peptides
Fragment Expected
m/z*
Experimental
m/z
After phosphatase treatment
SESIAFIEESKK 1367.70 1367.48
LRSESIAFIEESK 1508.76 n.f.
Before phosphatase treatment
SESIAFIEESKK 1447.67 1447.30
LRSESIAFIEESK 1588.76 1588.52
* Expected m/z was calculated by adding (before phosphatase) 80 units to the in-silico trypticdigest of bNOS (after phosphatase). n.f.: Not found.
by guest on April 12, 2018
http://ww
w.jbc.org/
Dow
nloaded from
A B
C D
Elfering et al.; Figure 1
by guest on April 12, 2018
http://ww
w.jbc.org/
Dow
nloaded from
1 11 21 31 41 51 61 71
MEENTFGVQQ IQPNVISVRL FKRKVGGLGF LVKERVSKPP VIISDLIRGG AAEQSGLIQA GDIILAVNDR PLVDLSYDSA
81 91 101 111 121 131 141 151
LEVLRGIASE THVVLILRGP EGFTTHLETT FTGDGTPKTI RVTQPLGPPT KAVDLSHQPS ASKDQSLAVD RVTGLGNGPQ161 171 181 191 201 211 221 231
HAQGHGQGAG SVSQANGVAI DPTMKSTKAN LQDIGEHDEL LKEIEPVLSI LNSGSKATNR GGPAKAEMKD TGIQVDRDLD241 251 261 271 281 291 301 311
GKSHKAPPLG GDNDRVFNDL WGKDNVPVIL NNPYSEKEQS PTSGKQSPTK NGSPSRCPRF LKVKNWETDV VLTDTLHLKS
321 331 341 351 361 371 381 391
TLETGCTE H I CMGSIMLPSQ HTRKPE DVRT KDQLFPLAKE FLDQYYSSIK RFGSKAHMDR L EEVN KEIES TSTYQLK DTE
401 411 421 431 441 451 461 471
LIYGAKHAWR NASRCVGRIQ WSKLQVFDAR DCTTAHGMFN YICNHVKYAT NKGNLRSAIT IFPQRTDGKH DFRVWNSQLI
481 491 501 511 521 531 541 551
RYAGYKQPDG STLGDPANVQ FTEICIQQGW KAPRGRFDVL PLLLQANGND PELFQIPPEL VLEVPIRHPK FDWFKDLGLK
561 571 581 591 601 611 621 631
WYGLPAVSNM LLEIGGLEFS ACPFSGWYMG TEIGVRDYCD NSRYNILEEV AKKMDLDMRK TSSLWKDQAL VEINIAVLYS
641 651 661 671 681 691 701 711
FQSDKVTIVD HHSATESFIK HMENEYRCRG GCPADWVWIV PPMSGSITPV FHQEMLNYRL TPSFEYQPDP WNTHVWKGTN
721 731 741 751 761 771 781 791
GTPTKRRAIG FKKLAEAVKF SAKLMGQAMA KRVKATILYA TETGKSQAYA KTLCEIFKHA FDAKAMSMEE YDIVHLEHEA
801 811 821 831 841 851 861 871
LVLVVTSTFG NGDPPENGEK FGCALMEMRH PNSVQEERKS YKVRFNSVSS YSDSRKSSGD GPDLRDNFES TGPLANVRFS
881 891 901 911 921 931 941 951
VFGLGSRAYP HFCAFGHAVD TLLEELGGER ILKMREGDEL CGQEEAF RTW AKKVFK AACD VFCVGDDVNI EKPNNSLISN
961 971 981 991 1001 1011 1021 1031
DRSWKRNKFR LTYVAEAPDL TQGLSNVHKK RVSAARLLSR QNLQSPKFSR STIFVRLHTN GNQELQYQPG DHLGVFPGNH
1041 1051 1061 1071 1081 1091 1101 1111
EDLVNALIER LEDAPPANHV VKVEMLEERN TALGVISNWK DESRLPPCTI FQAFKYYLDI TTPPTPLQLQ QFASLATNEK
1121 1131 1141 1151 1161 1171 1181 1191
EKQRLLVLSK GLQE YEEWKW GKNPTMVE VL EEFPSIQMPA TLLLTQLSLL QPRYYSISSS PDMYPDEVHL TVAIVSYHTR
1201 1211 1221 1231 1241 1251 1261 1271
DGEGPVHHGV CSSWLNRIQA DDVVPCFVRG APSFHLPRNP QVPCILVGPG TGIAPFRSFW QQRQFDIQHK GMNPCPMVLV1281 1291 1301 1311 1321 1331 1341 1351
FGC RQSKIDH IYREETLQAK NKGVFRELYT AYSREPDRPK KYVQDVLQEQ LAESVYRAL K EQGGHIYVCG DVTMAADVLK
1361 1371 1381 1391 1401 1411 1421
A IQRIMTQQG KLSEEDAGVF ISRLRDDNRY HEDIFGVTLR TYEVTNRLRS ESIAFIEESK KDADEVFSS
Elfering et al. Figure 2
by guest on April 12, 2018 http://www.jbc.org/ Downloaded from
Elfering et al.; FIGURE 3
1 2 3 4 5 6 7
A
788 bp515 bp
206 bp81 bp
1 2 3 4 5 6 7 8 9 10 11 1213 14 1516 17 18
183 bp81 bp
206 bp
1 2 3 4 5 6 7 8 9
788 bp
B
C
by guest on April 12, 2018
http://ww
w.jbc.org/
Dow
nloaded from
0
2 0
4 0
6 0
8 0
100
5 0 100 150 200 250
COCH3O
243
211
142
129
111
74
83
85
55
M+1
C7H13O2+
% B
ase
Pea
k
m/z
CH2CH2COCH3
O
+
Elfering et al., Figure 4
H3COC CH2
OH
RC O
Tetradecanoic acid methyl esterC
15H
30O
2
MW: 242
by guest on April 12, 2018
http://ww
w.jbc.org/
Dow
nloaded from
Sarah Liv Elfering, Theresa Maria Sarkela and Cecilia GiuliviBiochemistry of mitochondrial nitric-oxide synthase
published online August 1, 2002J. Biol. Chem.
10.1074/jbc.M205256200Access the most updated version of this article at doi:
Alerts:
When a correction for this article is posted•
When this article is cited•
to choose from all of JBC's e-mail alertsClick here
by guest on April 12, 2018
http://ww
w.jbc.org/
Dow
nloaded from
Additions and Corrections
Vol. 277 (2002) 47564–47571
Function and solution structure of huwentoxin-IV,a potent neuronal tetrodotoxin (TTX)-sensitive sodiumchannel antagonist from Chinese bird spider Seleno-cosmia huwena.
Kuan Peng, Qin Shu, Zhonghua Liu, and Songping Liang
Page 47567, Fig. 4 legend: The following sentence is missingfrom the figure legend.
“An asterisk indicates that the C-terminal carboxyl group isamidated.”
The figure with the corrected legend is shown below.
Vol. 277 (2002) 38079–38086
Biochemistry of mitochondrial nitric-oxide synthase.
Sarah Liv Elfering, Theresa Maria Sarkela, and CeciliaGiulivi
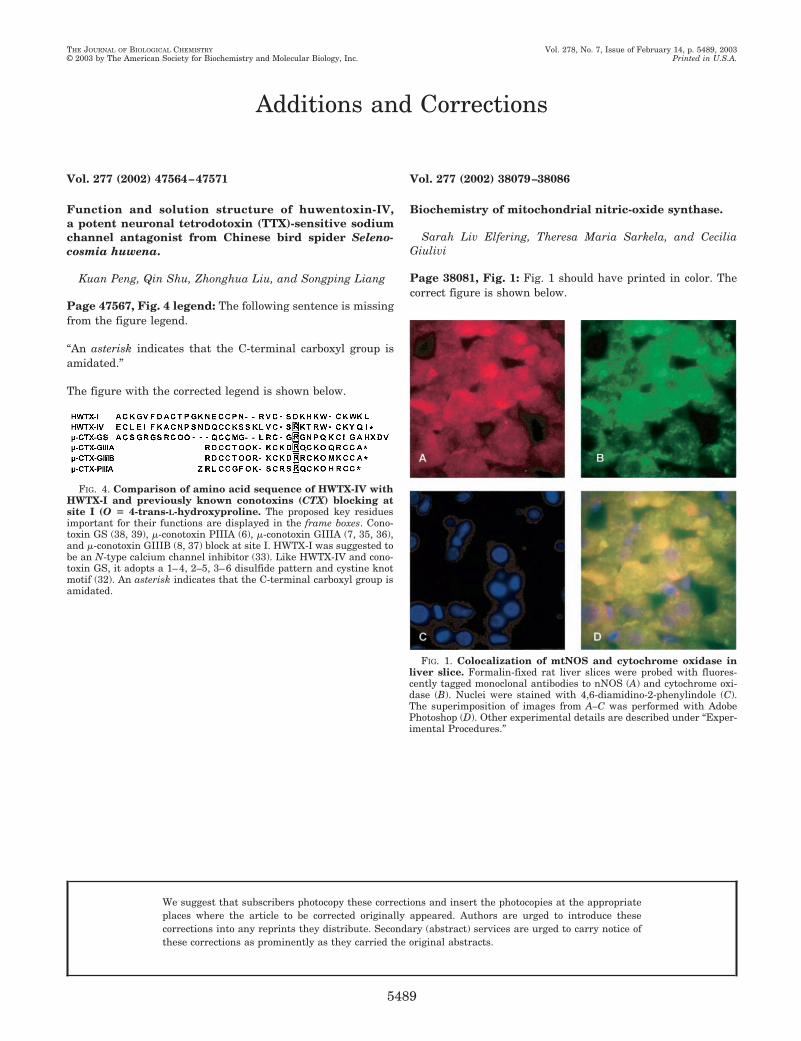
Page 38081, Fig. 1: Fig. 1 should have printed in color. Thecorrect figure is shown below.
FIG. 4. Comparison of amino acid sequence of HWTX-IV withHWTX-I and previously known conotoxins (CTX) blocking atsite I (O � 4-trans-L-hydroxyproline. The proposed key residuesimportant for their functions are displayed in the frame boxes. Cono-toxin GS (38, 39), �-conotoxin PIIIA (6), �-conotoxin GIIIA (7, 35, 36),and �-conotoxin GIIIB (8, 37) block at site I. HWTX-I was suggested tobe an N-type calcium channel inhibitor (33). Like HWTX-IV and cono-toxin GS, it adopts a 1–4, 2–5, 3–6 disulfide pattern and cystine knotmotif (32). An asterisk indicates that the C-terminal carboxyl group isamidated.
FIG. 1. Colocalization of mtNOS and cytochrome oxidase inliver slice. Formalin-fixed rat liver slices were probed with fluores-cently tagged monoclonal antibodies to nNOS (A) and cytochrome oxi-dase (B). Nuclei were stained with 4,6-diamidino-2-phenylindole (C).The superimposition of images from A–C was performed with AdobePhotoshop (D). Other experimental details are described under “Exper-imental Procedures.”
THE JOURNAL OF BIOLOGICAL CHEMISTRY Vol. 278, No. 7, Issue of February 14, p. 5489, 2003© 2003 by The American Society for Biochemistry and Molecular Biology, Inc. Printed in U.S.A.
We suggest that subscribers photocopy these corrections and insert the photocopies at the appropriateplaces where the article to be corrected originally appeared. Authors are urged to introduce thesecorrections into any reprints they distribute. Secondary (abstract) services are urged to carry notice ofthese corrections as prominently as they carried the original abstracts.
5489