service engineering september, 2002 last revised:...
TRANSCRIPT

Service Engineering September, 2002
Last Revised: May, 2004
Why Queues ?
via Dynamic Stochastic PERT/CPM Networks
• Product/Service development
• Project management
Both "enjoy":
− Stochastic environment
− Multi-projects
− Scarce resources
1

History
• Product Development
− with Adler, P., Nguyen, V., Schwerer, E. (Management Science, HBR)
• Project Management
− Lamberg, Y. (M.Sc.) – Israeli Electric
− Baron, Y. (M.Sc.) – Conceptual Framework
− IE&M Projects – Software Development
− Cohen, I. (Ph.D.) – TOC vs. DS-PERT/CPM

3
• Teaching
− Static Deterministic Models
− Static Probabilistic
− Dynamic Stochastic
• Models: DS-PERTs (Fork-Join, Split-Match, ...).
− Important theoretically and practically.
− Intractable theoretically: simulation, approx.
3

4
Stochastic PERT / CPM
Activities A B C
Avg. Durat n 3 4 5
Distri tion 3 4 1 or 9
wp ½ and ½ A
Project time
io
bu
B
C
F S
max {3, 4, 1} = 4 wp ½
max {3, 4, 9} = 9 wp ½ =
4
5
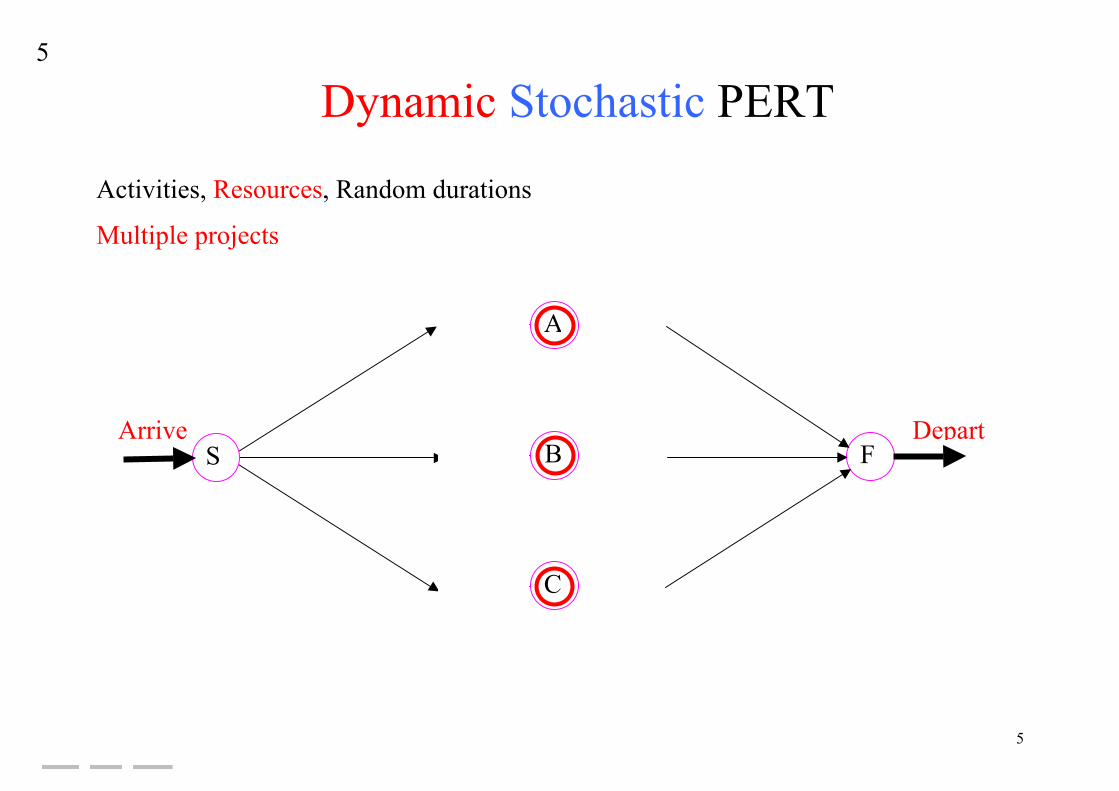
Dynamic Stochastic PERT
Activities, Resources, Random durations
Multiple projects
FS
A
C
Depart ArriveB
Queues due to
Scarce Resources
Queues due to
Synchronization Gaps
5
6
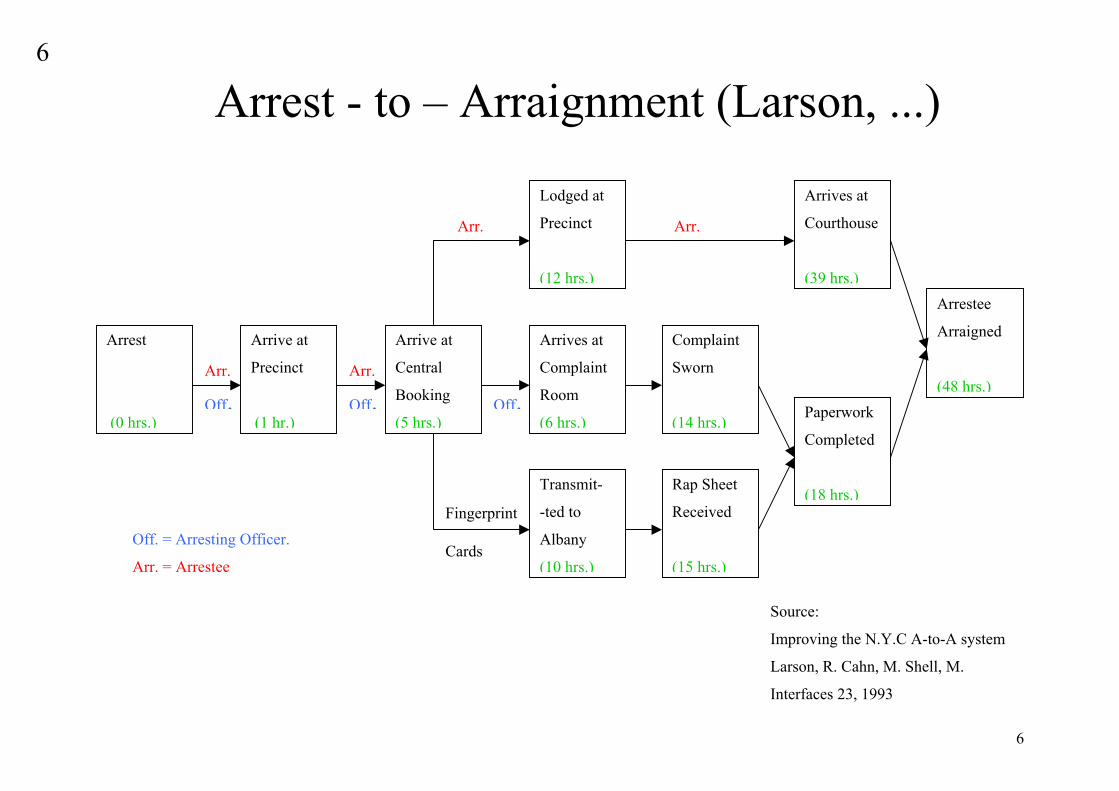
Arrest - to – Arraignment (Lars
Arr.
Off.Arr.
Off.
Arrive at
Central
Booking
(5 hrs.)
Arrives at
Complaint
Room
(6 hrs.)
Complaint
Sworn
(14 hrs.)
A
C
(
Lodged at
Precinct
(12 hrs.)
Transmit-
-ted to
Albany
(10 hrs.)
Rap Sheet
Received
(15 hrs.)
P
C
(Fingerprint.
Off.
Arrive at
Precinct
(1 hr.)
Arrest
(0 hrs.)
Arr. Arr.
Off. = Arresting Officer.
Arr. = Arrestee Cards
Sourc
Impro
Larso
Interfa
3
1
e
v
n
on, ...)
rrives at
ourthouse
9 hrs.)
aperwork
ompleted
8 hrs.)
Arrestee
Arraigned
(48 hrs.)
:
ing the N.Y.C A-to-A system
, R. Cahn, M. Shell, M.
ces 23, 1993
6

Stochastic dynamic model:
Avg. 44.0 hoursStd. 16.2
Should be less than24 hours.
Arrest to Arraignment Time7
0%
2%
4%
6%
8%
10%
12%
14%
16%
18%
0-20
20-25
25-30
30-35
35-40
40-45
45-50
50-55
55-60
60-65
65-70
70-75
75-80
80-85
85-90
90-100
>100
Total Elapsed Arrest to Arraignment Time (in Hours)
Prob
abili
ty
7

8
Traditional PERT/CPM Representation
Project View
Specifications w50
Construction w110
General Layout w15
Locating Area w40
Conceptual Design w10
Build Permit w25
Electrical Design w40
Repartition
Start w0
Equipment w50
Electro- Mechanics Design w20
Conceptual Schema w15
Civil Eng. Programs w40
critical path End w0
80 activities 25 departments 500 projects
T = 250 weeks ? 8
w75

9
Processing Network Representation
Electrical Eng.
Purchasing
Civil Eng. Research EConstruction
Assets
Conceptual
Design Conceptual
Schema
Equipment
Mechanical Eng.
Electro Mechanic
Design
Electric
Design
Build Permit
Repartition
General
Layout Conceptual
Design
Conceptual
Design
S
Specifications
Civil
Programs Area
Location
Resource
Synchronization Queue
Service Queue
Workflow
9

Electrical Electro-Mechanic Electro-Mechanic Electro-Mechanic
Combined Outdoor IndoorEmployees Utilization Employees Utilization Employees Utilization Employees Utilization
6 129% 10 107% 4 79% 6 131%
7 117% 12 96% 5 67% 7 120%8 108% 14 88% 6 59% 8 112%9 101% 16 82% 7 54% 9 105%
10 95% 17 80% 7 54% 10 100%11 91% 18 78% 7 54% 11 96%12 87% 19 76% 7 54% 12 93%
Can We Do It ?10
of the number of employees:
Capacity Analysis -
Utilization as a function
[= Fluid-view (first moments)]
10
1214
16 17 18 194
56
7 7 7 7
121110
98
7
6
0.4
0.6
0.8
1
1.2
1.4
Employees
Util
izat
ion
ElectricalMech-CombinedMech-OutdoorMech-Indoor
10

Stochastic static model (single project):
Avg. 338 weeksStd. 10090% 475Det. 250
How long Will It Take ?11
0
0.05
0.1
0.15
0.2
0.25
0 150 300 450 600 750 900 1050
Completion Time in Weeks
Prob
abili
ty
0
0.1
0.2
0.3
0.4
0.5
0.6
0.7
0.8
0.9
1
Cum
ulat
ive
Dis
tribu
tion
11

Stochastic dynamic model:4 Types:TypeNew sub-station 3.27New switching stations 0.6Improvements 3.4Additional capacity 1.9
Avg. 485 weeksStd. 19990% 770Det. 250
Per year
How Long Will It Take ?12
0
0.02
0.04
0.06
0.08
0.1
0.12
0.14
0 150 300 450 600 750 900 1050
Completion Time in Weeks
Prob
abili
ty
0
0.1
0.2
0.3
0.4
0.5
0.6
0.7
0.8
0.9
1
Cum
ulat
ive
Dis
tribu
tion
12

Relieving bottlenecks:Unlimited resources:( = Stochastic static)Avg. 6 years.10% over 9 years.
6 years avg. too long.=> Resources NOT the
problem !
(Infinite-server modelsare important).
Can We Do Better ?13
0
0.05
0.1
0.15
0.2
0.25
0 150 300 450 600 750 900 1050
Completion Time in Weeks
Prob
abili
ty
Unlimited resources (static) - 338 weeks
Civil Eng. dept. - 458
Base case - 485 weeks
Electrical dept. - 394 weeks
13

New location management and standardization:Base New
New location mgt:40 weeks, 8 weeks0.5 prob. of repeat 0.8 prob.
Standardization:8000 hrs. planning, 2000repeats, nonelong execution times 25%
Avg. 485 weeks 189Std. 199 5590% 770 294
Can We Do Better ?14
0
0.1
0.2
0.3
0.4
0.5
0 100 200 300 400 500 600 700 800 900 1000 1100
Completion Time in Weeks
Prob
abili
ty
14

15
Summary
E σ 90%
Deterministic 251 weeks 0 251
Stochastic Static
Single-Project
338 100 475
Stochastic Dynamic
Multi-Projects
485 200 770 (14 years)
Infinite Resources 338 ... ...
Re-Engineering 189 55 294
15