1 gpw 2007 – nowa jakoŚĆ investors in exchange trading – h1 2010 - summary of survey findings
TRANSCRIPT

1
GPW 2007 – NOWA JAKOŚĆINVESTORS IN EXCHANGE
TRADING – H1 2010
- summary of survey findings
2
• Type of survey: questionnaire; the respondents quoted exact values
• Survey participants: 27 national WSE members• Survey timing: July 2010 • Data for: H1 2010 • The activities of market maker and customer portfolio
management were treated as activities of national institutional investors
• The survey covered WSE session trading data
Methodological Notes

3
WSE MAIN LIST
4
Major Highlights
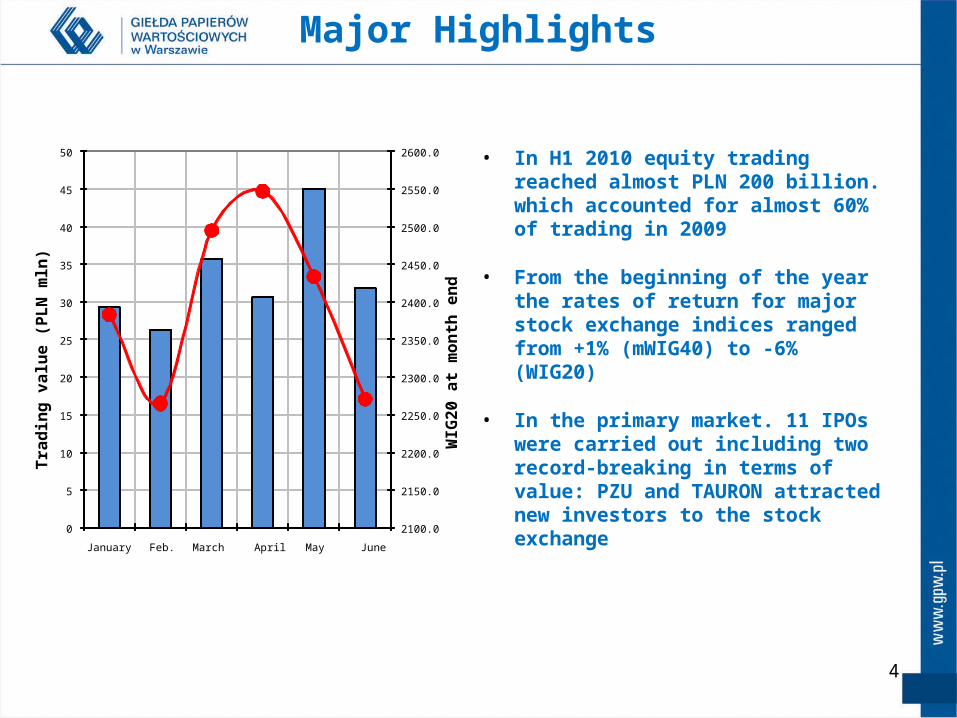
• In H1 2010 equity trading reached almost PLN 200 billion. which accounted for almost 60% of trading in 2009
• From the beginning of the year the rates of return for major stock exchange indices ranged from +1% (mWIG40) to -6% (WIG20)
• In the primary market. 11 IPOs were carried out including two record-breaking in terms of value: PZU and TAURON attracted new investors to the stock exchange
2100.0
2150.0
2200.0
2250.0
2300.0
2350.0
2400.0
2450.0
2500.0
2550.0
2600.0
0
5
10
15
20
25
30
35
40
45
50
January Feb. March April May June
WIG
20 a
t mon
th e
nd
Trad
ing
valu
e (P
LN m
ln)

5
UnitedKingdom; 60%
France; 13 %
Czech Republic; 8%
Austria; 6%
Other 13%
• UK brokers continue to lead in terms of the origin of foreign orders at the WSE
• In H2 2009 the runner-up position was held by the Czech brokers (at present French brokers)
41%
31% 33%
43%
36%
47%
2005 2006 2007 2008 2009 2010H
Foreign Investors
• Foreign investors accounted for the highest share in stock trading in the history of WSE surveys
• In value terms foreign investors’ trading exceeded PLN 94 billion
6
Investment Companies 44%
Pension Funds 21%
Market maker 17%
Dealer; 5%
Other 13%
33%34%
37%
39%
37%
33%
2005 2006 2007 2008 2009 2010H
Institutional Investors
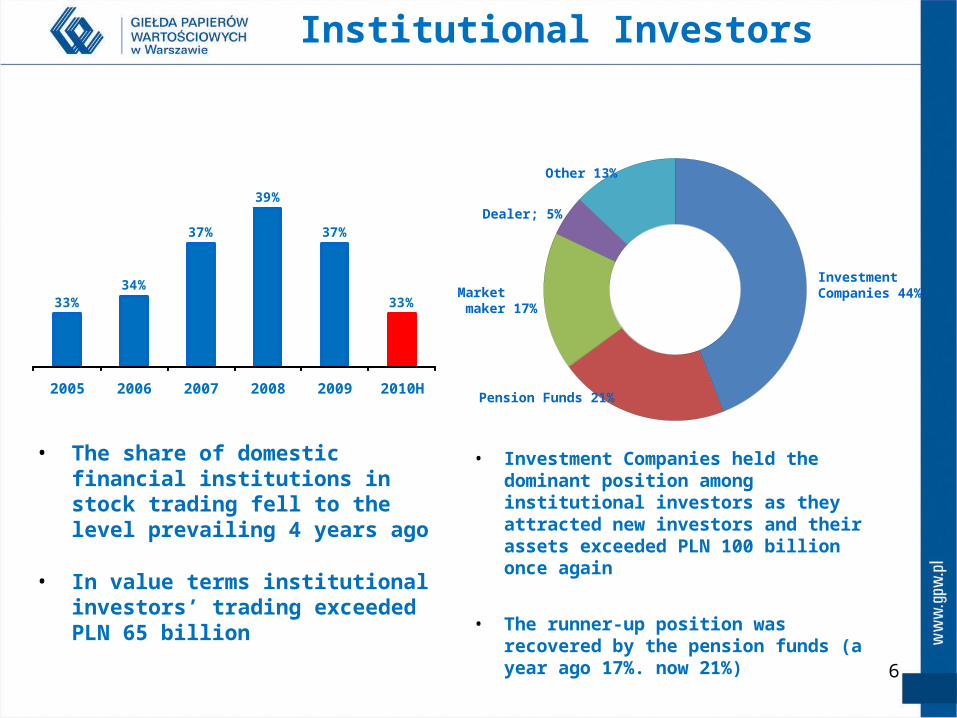
• The share of domestic financial institutions in stock trading fell to the level prevailing 4 years ago
• In value terms institutional investors’ trading exceeded PLN 65 billion
• Investment Companies held the dominant position among institutional investors as they attracted new investors and their assets exceeded PLN 100 billion once again
• The runner-up position was recovered by the pension funds (a year ago 17%. now 21%)
7
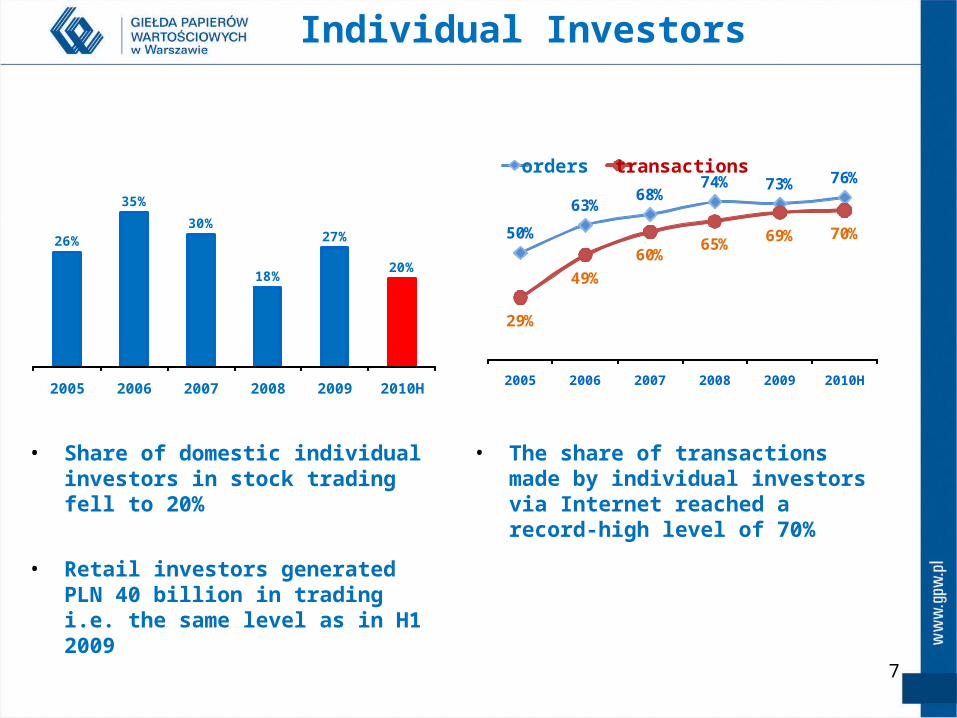
• The share of transactions made by individual investors via Internet reached a record-high level of 70%
26%
35%
30%
18%
27%
20%
2005 2006 2007 2008 2009 2010H
Individual Investors
• Share of domestic individual investors in stock trading fell to 20%
• Retail investors generated PLN 40 billion in trading i.e. the same level as in H1 2009
50%
63%68%
74% 73% 76%
29%
49%60%
65% 69% 70%
2005 2006 2007 2008 2009 2010H
orders transactions
8
NEWCONNECT MARKET
9
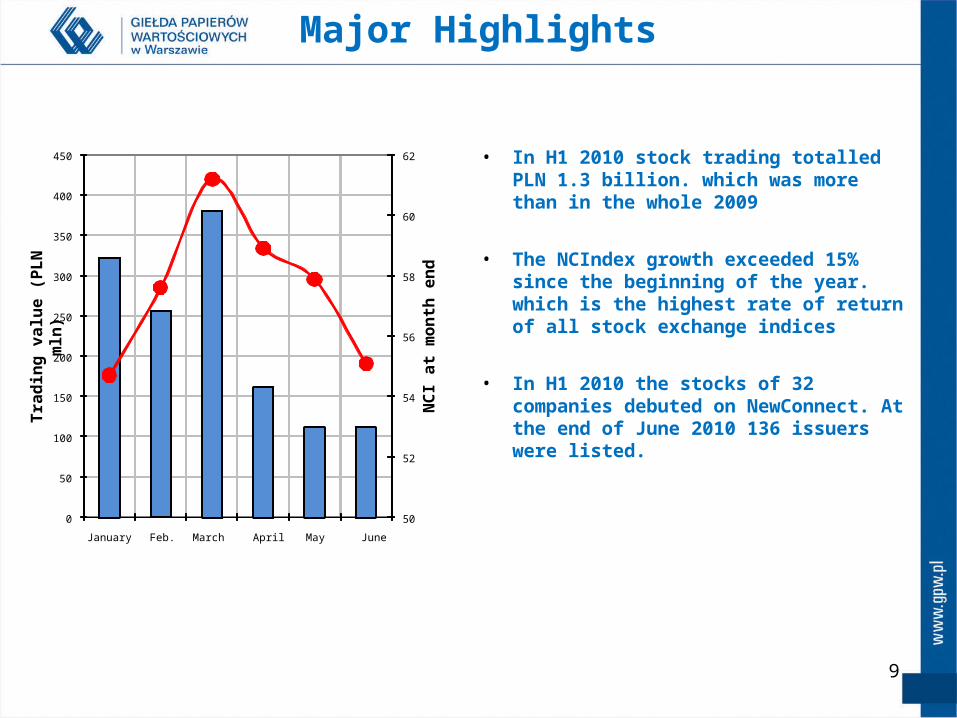
Major Highlights
• In H1 2010 stock trading totalled PLN 1.3 billion. which was more than in the whole 2009
• The NCIndex growth exceeded 15% since the beginning of the year. which is the highest rate of return of all stock exchange indices
• In H1 2010 the stocks of 32 companies debuted on NewConnect. At the end of June 2010 136 issuers were listed.
50
52
54
56
58
60
62
0
50
100
150
200
250
300
350
400
450
January Feb. March April May June
NCI
at m
onth
end
Trad
ing
valu
e (P
LN m
ln)
10
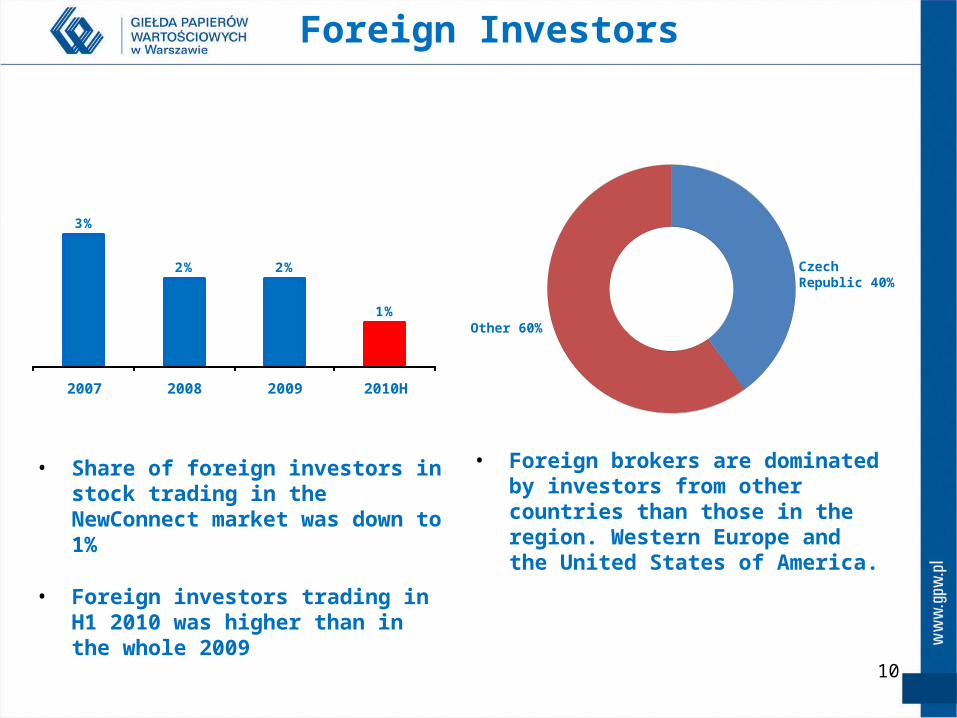
Czech Republic 40%
Other 60%
• Foreign brokers are dominated by investors from other countries than those in the region. Western Europe and the United States of America.
3%
2% 2%
1%
2007 2008 2009 2010H
Foreign Investors
• Share of foreign investors in stock trading in the NewConnect market was down to 1%
• Foreign investors trading in H1 2010 was higher than in the whole 2009
11
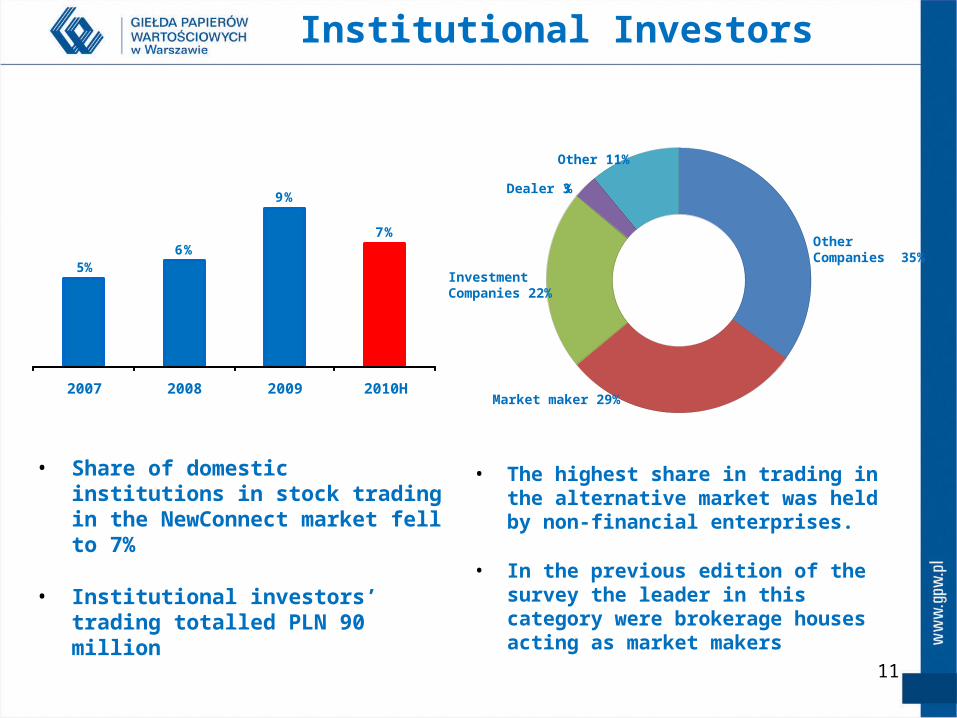
Other Companies 35%
Market maker 29%
Investment Companies 22%
Dealer 3 %
Other 11%
• The highest share in trading in the alternative market was held by non-financial enterprises.
• In the previous edition of the survey the leader in this category were brokerage houses acting as market makers
5%6%
9%
7%
2007 2008 2009 2010H
Institutional Investors
• Share of domestic institutions in stock trading in the NewConnect market fell to 7%
• Institutional investors’ trading totalled PLN 90 million

12
• Most of IPOs on the NewConnect market were carried out through private placements
• In 2007 private placements accounted for 79%. whereas this year private placements accounted for 97% of offerings
92% 92%
89%
92%
2007 2008 2009 2010H
Individual Investors
79%88% 96% 97%
2007 2008 2009 2010H
• The share of domestic individuals in stock trading in the NewConnect market exceeded again 90%
• Domestic retail investors generated PLN 1.2 billion in trading in H1 2010.
13
DERIVATIVE INSTRUMENTS
14
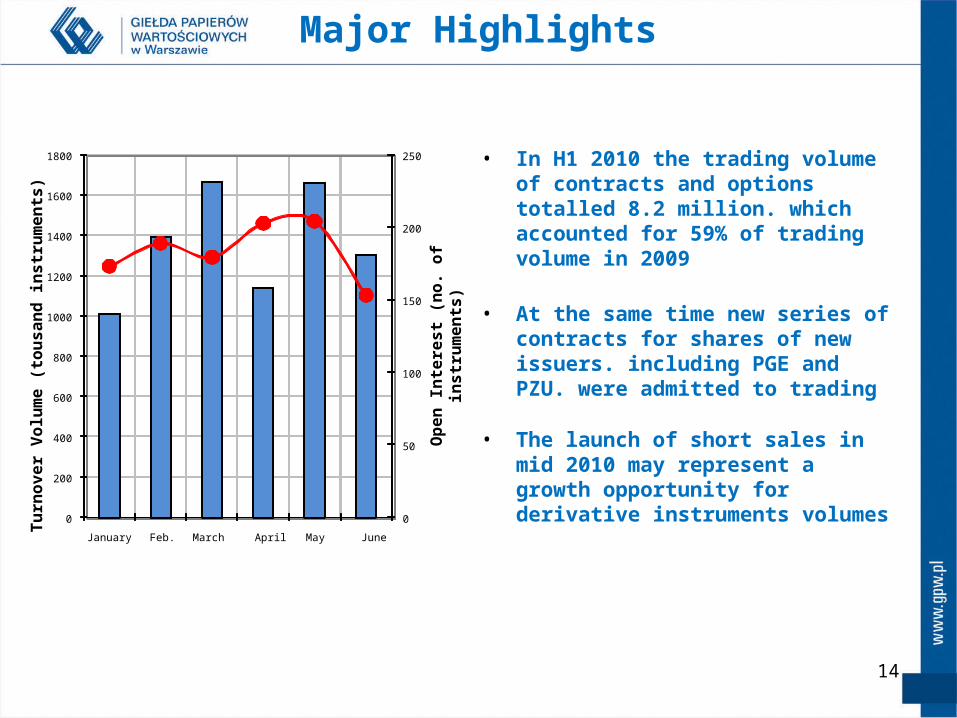
Major Highlights
• In H1 2010 the trading volume of contracts and options totalled 8.2 million. which accounted for 59% of trading volume in 2009
• At the same time new series of contracts for shares of new issuers. including PGE and PZU. were admitted to trading
• The launch of short sales in mid 2010 may represent a growth opportunity for derivative instruments volumes
0
50
100
150
200
250
0
200
400
600
800
1000
1200
1400
1600
1800
January Feb. March April May June
Ope
n In
tere
st (n
o. o
f ins
trum
ents
)
Turn
over
Vol
ume
(tou
sand
inst
rum
ents
)
15
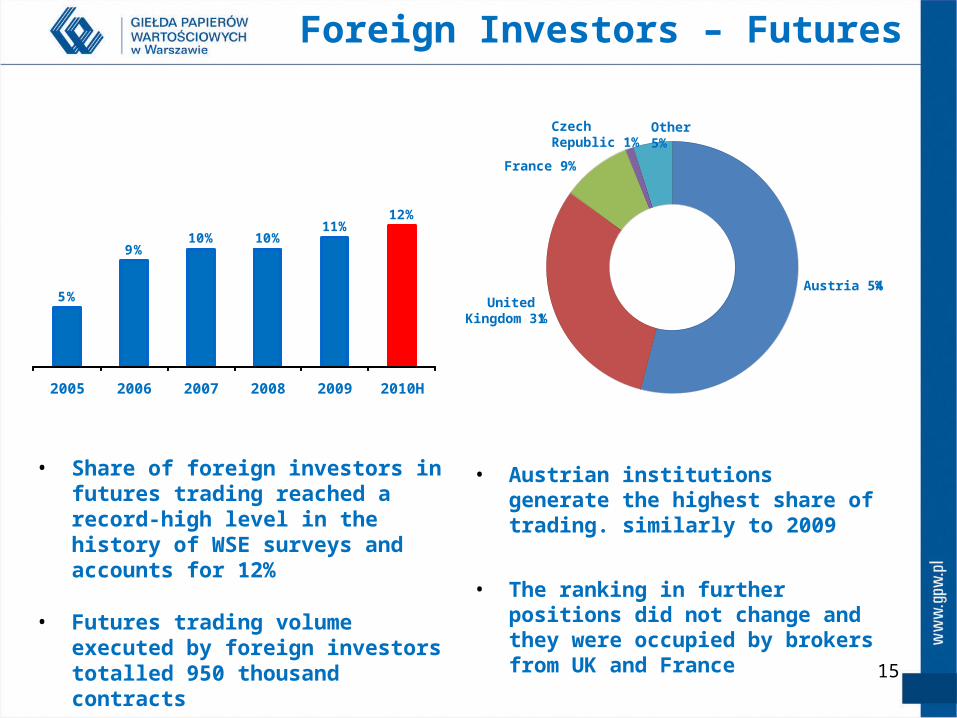
Austria 54 %United
Kingdom 31%
France 9%
Czech Republic 1%
Other 5%
• Austrian institutions generate the highest share of trading. similarly to 2009
• The ranking in further positions did not change and they were occupied by brokers from UK and France
5%
9%10% 10%
11%12%
2005 2006 2007 2008 2009 2010H
Foreign Investors – Futures
• Share of foreign investors in futures trading reached a record-high level in the history of WSE surveys and accounts for 12%
• Futures trading volume executed by foreign investors totalled 950 thousand contracts

16
Market maker 67%
Investment Companies 17%
Dealer 6 %
Other 10%
• In the category of institutions the lead in contract trading was held by market makers (67% vs. 61% last year)
• Compared to last year the activity of investment companies declined (last year they accounted for 23%)
18%
25%
34%37% 37% 36%
2005 2006 2007 2008 2009 2010H
Institutional Investors – Futures
• Share of domestic financial institutions in futures trading was slightly down to 36%
• Trading volume executed by institutional investors in H1 2010 totalled 2.8 million contracts

17
• 73% of orders in futures market are placed on the stock exchange through Internet accounts
• The share of Internet transactions in retail trading rose to a record-high level of 85%
77%
66%56% 53% 52% 52%
2005 2006 2007 2008 2009 2010H
Individual Investors – Futures
54% 51%63%
72%64%
73%53%
69%75% 78% 83% 85%
2005 2006 2007 2008 2009 2010H
orders transactions
• Share of individual investors remained at the 2009 level and amounted to 52%
• In H1 2010 the trading volume executed by retail investors accounted for 60% of 2009 volume
18
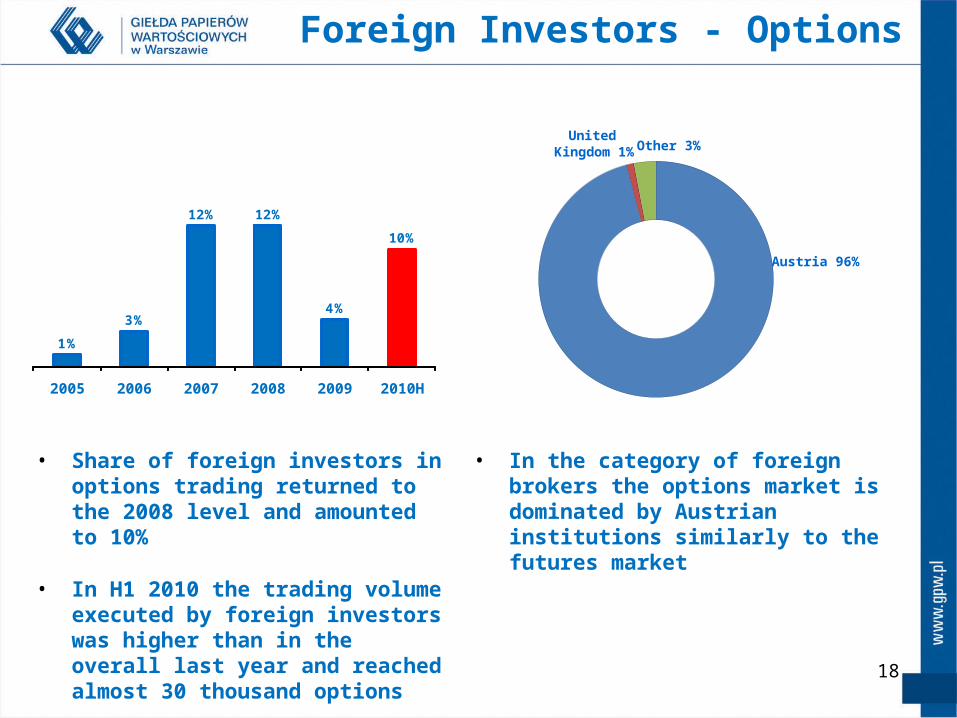
Austria 96%
United Kingdom 1% Other 3%
• In the category of foreign brokers the options market is dominated by Austrian institutions similarly to the futures market
1%
3%
12% 12%
4%
10%
2005 2006 2007 2008 2009 2010H
Foreign Investors - Options
• Share of foreign investors in options trading returned to the 2008 level and amounted to 10%
• In H1 2010 the trading volume executed by foreign investors was higher than in the overall last year and reached almost 30 thousand options

19
Banks 66 %
Market makers 27%
InvestmentCompanies 4%
Other 3%
• In the category of domestic institutions a predominant position in options trading belongs to market makers (also acting on the account of the bank)
• They accounted for 93% of options trading volume
24%26%
35%
30% 30%32%
2005 2006 2007 2008 2009 2010H
Institutional Investors - Options
• Share of institutional investors in options trading rose to 32%
• In H1 2010 options trading volume executed by domestic institutions reached 102 thousand options
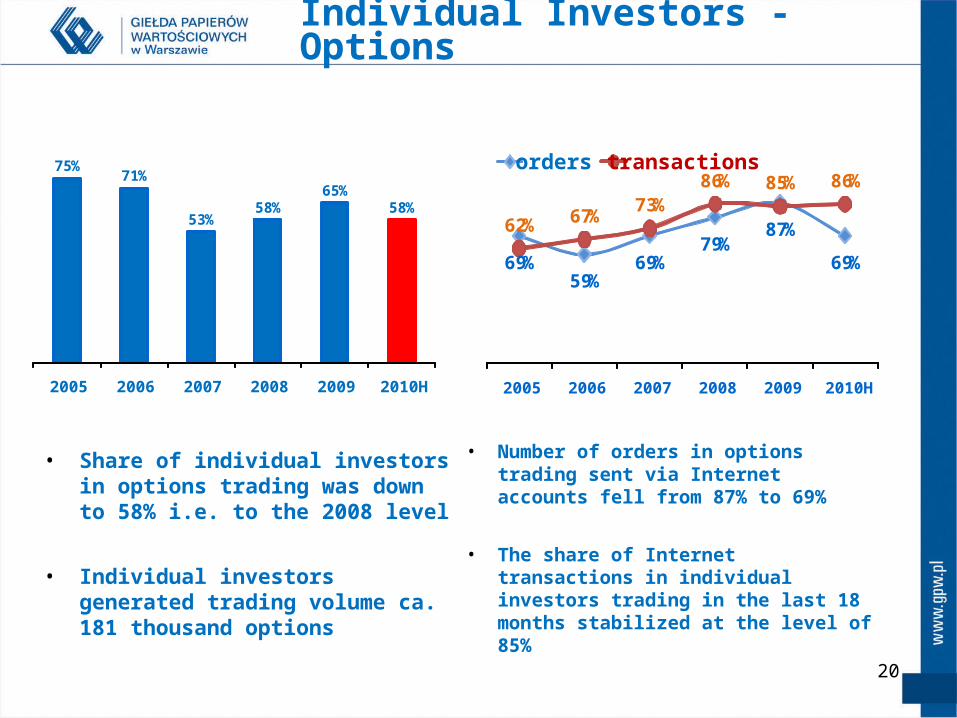
20
• Number of orders in options trading sent via Internet accounts fell from 87% to 69%
• The share of Internet transactions in individual investors trading in the last 18 months stabilized at the level of 85%
75%71%
53%58%
65%58%
2005 2006 2007 2008 2009 2010H
Individual Investors - Options
69%59%
69%79%
87%
69%
62% 67% 73%86% 85% 86%
2005 2006 2007 2008 2009 2010H
orders transactions
• Share of individual investors in options trading was down to 58% i.e. to the 2008 level
• Individual investors generated trading volume ca. 181 thousand options
21
CATALYST BONDS MARKET
22
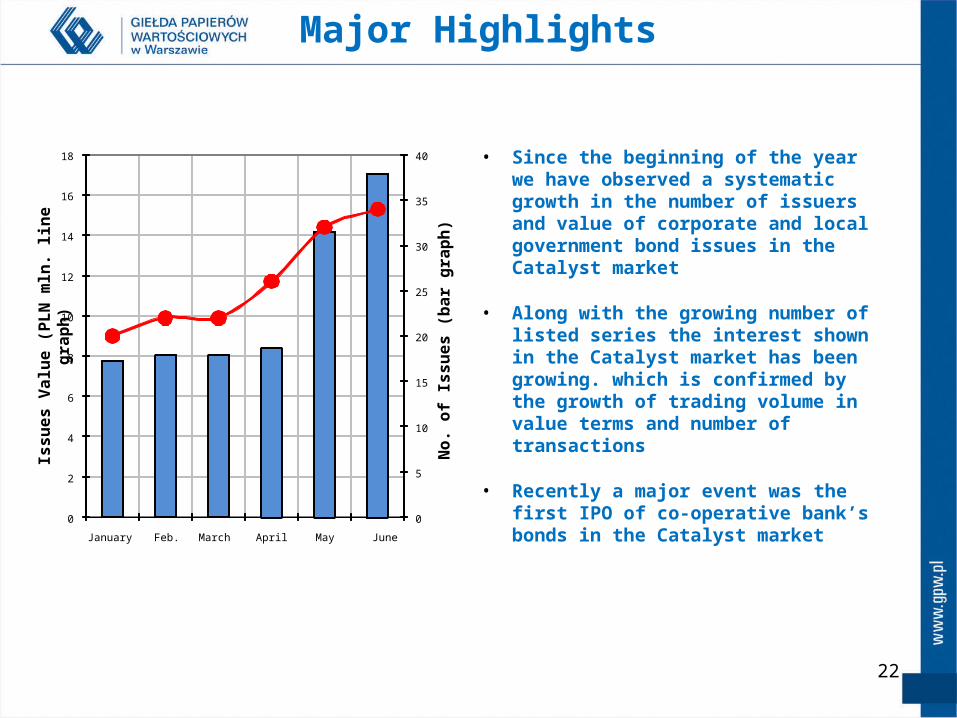
Major Highlights
• Since the beginning of the year we have observed a systematic growth in the number of issuers and value of corporate and local government bond issues in the Catalyst market
• Along with the growing number of listed series the interest shown in the Catalyst market has been growing. which is confirmed by the growth of trading volume in value terms and number of transactions
• Recently a major event was the first IPO of co-operative bank’s bonds in the Catalyst market
0
5
10
15
20
25
30
35
40
0
2
4
6
8
10
12
14
16
18
January Feb. March April May June
No.
of I
ssue
s (b
ar g
raph
)
Issu
es V
alue
(PLN
mln
. lin
e gr
aph)

23
SUMMING UP
24
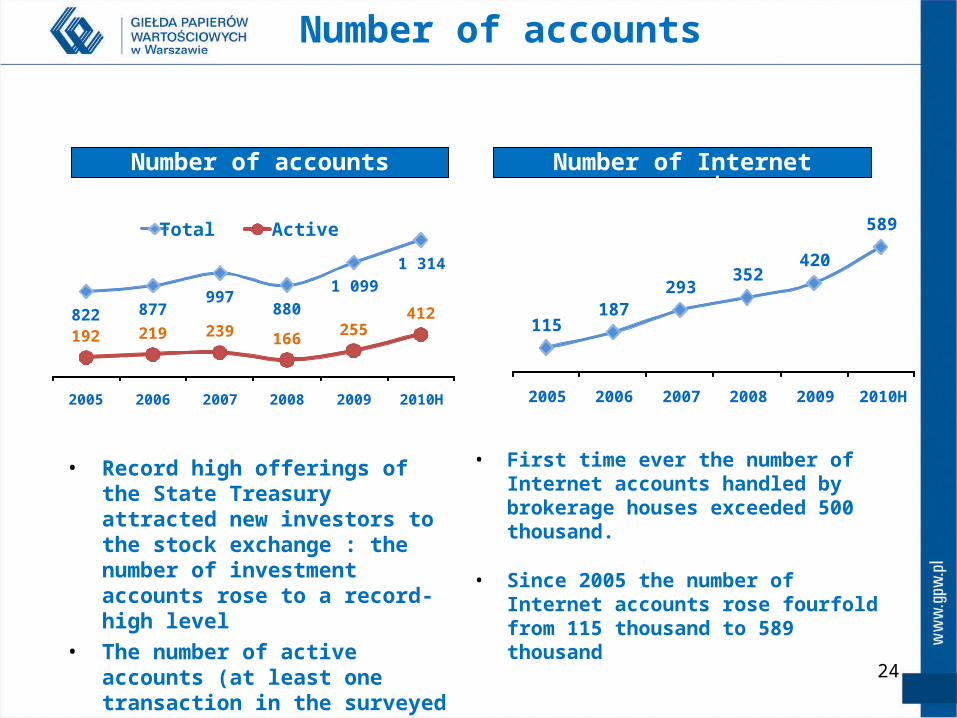
• First time ever the number of Internet accounts handled by brokerage houses exceeded 500 thousand.
• Since 2005 the number of Internet accounts rose fourfold from 115 thousand to 589 thousand
Number of accounts
822 877997
8801 099
1 314
192 219 239 166 255412
2005 2006 2007 2008 2009 2010H
Total Active
115187
293352
420
589
2005 2006 2007 2008 2009 2010H
• Record high offerings of the State Treasury attracted new investors to the stock exchange : the number of investment accounts rose to a record-high level
• The number of active accounts (at least one transaction in the surveyed period) accounts for 31%
Number of accounts Number of Internet accounts

25
Investor Instrument 2005 2006 2007 2008 2009 2010H
Foreign stocks ML* 41 31 33 43 36 47
stocks NC* 3 2 2 1
contracts 5 9 10 10 11 12
options 1 3 12 12 4 10
Individual stocks ML* 26 35 30 18 27 20
stocks NC* 92 92 89 92
contracts 77 66 56 53 52 52
options 75 71 53 58 65 58
Institutional stocks ML* 33 34 37 39 37 33
stocks NC* 5 6 9 7
contracts 18 25 34 37 37 36
options 24 26 35 30 31 32
Summing Up – Data In Percentage Terms
Key: *ML – Main List; *NC – NewConnect market
26
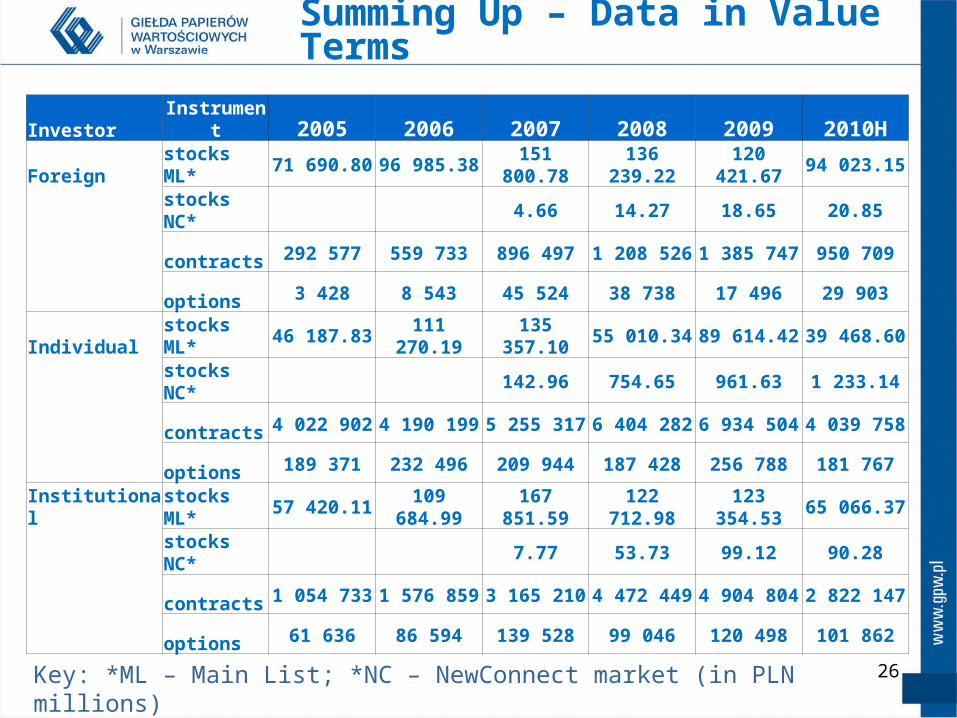
Investor Instrument 2005 2006 2007 2008 2009 2010H
Foreign stocks ML* 71 690.80 96 985.38 151 800.78 136 239.22 120 421.67 94 023.15
stocks NC* 4.66 14.27 18.65 20.85
contracts 292 577 559 733 896 497 1 208 526 1 385 747 950 709
options 3 428 8 543 45 524 38 738 17 496 29 903
Individual stocks ML* 46 187.83 111 270.19 135 357.10 55 010.34 89 614.42 39 468.60
stocks NC* 142.96 754.65 961.63 1 233.14
contracts 4 022 902 4 190 199 5 255 317 6 404 282 6 934 504 4 039 758
options 189 371 232 496 209 944 187 428 256 788 181 767
Institutional stocks ML* 57 420.11 109 684.99 167 851.59 122 712.98 123 354.53 65 066.37
stocks NC* 7.77 53.73 99.12 90.28
contracts 1 054 733 1 576 859 3 165 210 4 472 449 4 904 804 2 822 147
options 61 636 86 594 139 528 99 046 120 498 101 862
Summing Up – Data in Value Terms
Key: *ML – Main List; *NC – NewConnect market (in PLN millions)

27
More information:WSE Marketing Communications Department
Marcin Przeszł[email protected]
Anna [email protected]