© 2006 prentice hall, inc.9 – 1 operations management chapter 9 – layout strategy © 2006...
Post on 21-Dec-2015
231 views
TRANSCRIPT
© 2006 Prentice Hall, Inc. 9 – 1
Operations ManagementOperations ManagementChapter 9 – Layout StrategyChapter 9 – Layout Strategy
© 2006 Prentice Hall, Inc.
PowerPoint presentation to accompanyPowerPoint presentation to accompany Heizer/Render Heizer/Render Principles of Operations Management, 6ePrinciples of Operations Management, 6eOperations Management, 8e Operations Management, 8e
© 2006 Prentice Hall, Inc. 9 – 2
Innovations at McDonald’sInnovations at McDonald’s
Indoor seating (1950s)Indoor seating (1950s) Drive-through window (1970s)Drive-through window (1970s) Adding breakfast to the menu Adding breakfast to the menu
(1980s)(1980s) Adding play areas (1990s)Adding play areas (1990s)
Three out of the four are Three out of the four are layout decisions!layout decisions!
© 2006 Prentice Hall, Inc. 9 – 3
McDonald’s New Kitchen McDonald’s New Kitchen LayoutLayout
Fifth major innovation Fifth major innovation Sandwiches assembled in order Sandwiches assembled in order Elimination of some steps, shortening of Elimination of some steps, shortening of
others others No food prepared ahead except pattyNo food prepared ahead except patty New bun toasting machine and new bun New bun toasting machine and new bun
formulationformulation Repositioning condiment containersRepositioning condiment containers Savings of $100,000,000 per year in food Savings of $100,000,000 per year in food
costscosts
© 2006 Prentice Hall, Inc. 9 – 4
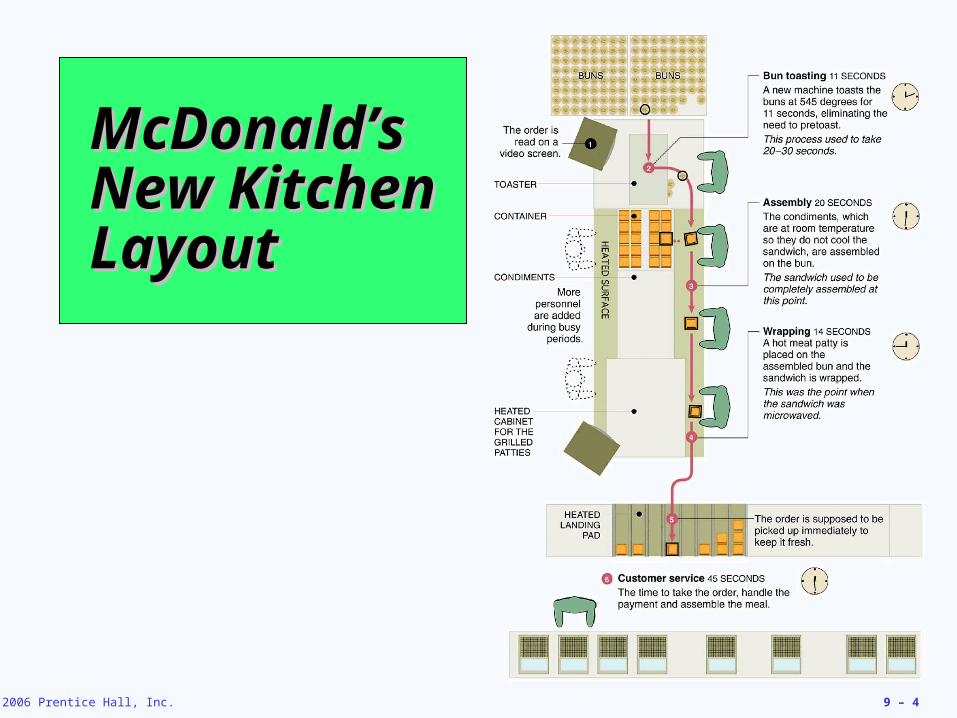
McDonald’s McDonald’s New Kitchen New Kitchen LayoutLayout
© 2006 Prentice Hall, Inc. 9 – 5
Layout Design Layout Design ConsiderationsConsiderations
Higher utilization of space, equipment, Higher utilization of space, equipment, and peopleand people
Improved flow of information, materials, Improved flow of information, materials, or peopleor people
Improved employee morale and safer Improved employee morale and safer working conditionsworking conditions
Improved customer/client interactionImproved customer/client interaction
FlexibilityFlexibility
© 2006 Prentice Hall, Inc. 9 – 6
Layout Design ConsiderationsLayout Design Considerations
• Process FlowchartsProcess Flowcharts
• Process DiagramsProcess Diagrams
Analyzing Service Analyzing Service ProcessesProcesses
© 2006 Prentice Hall, Inc. 9 – 7
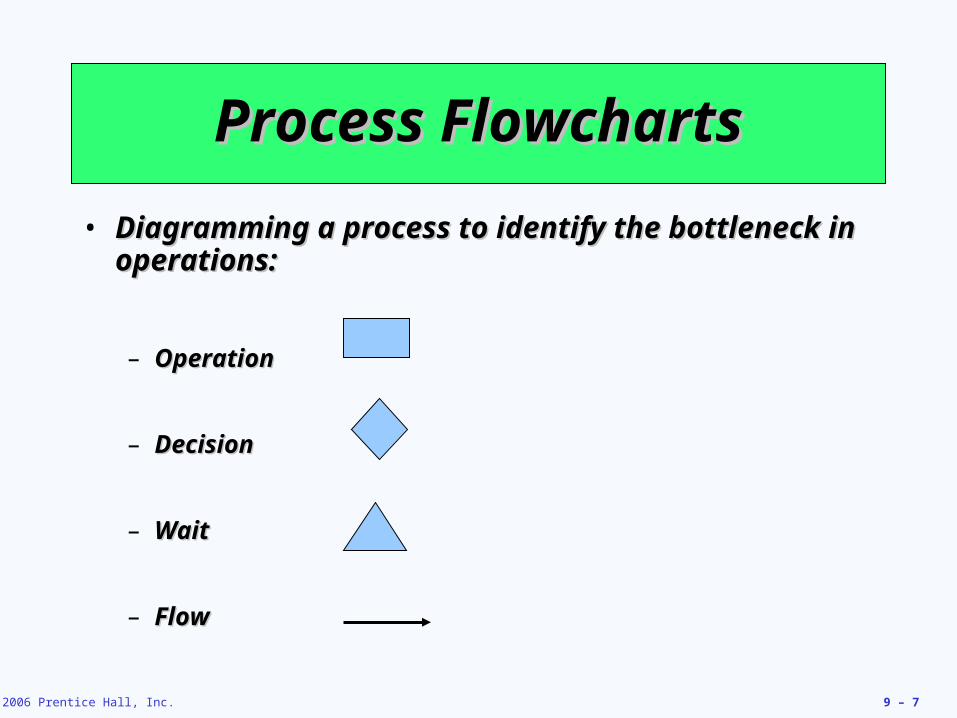
• Diagramming a process to identify the bottleneck Diagramming a process to identify the bottleneck in operations:in operations:
– Operation Operation
– Decision Decision
– Wait Wait
– FlowFlow
Process FlowchartsProcess Flowcharts
© 2006 Prentice Hall, Inc. 9 – 8
Process FlowchartsProcess Flowcharts
• Cycle Time – the average time between Cycle Time – the average time between completions of successive unitscompletions of successive units
• Bottleneck – the factor that limits Bottleneck – the factor that limits production. A bottleneck is a constraint production. A bottleneck is a constraint on the output of the system and could on the output of the system and could arise from several sources. arise from several sources.
© 2006 Prentice Hall, Inc. 9 – 9
• Capacity – measure of output per unit of Capacity – measure of output per unit of time when the system is fully busytime when the system is fully busy
• Capacity Utilization – measure of how Capacity Utilization – measure of how much output is actually achieved when the much output is actually achieved when the system is fully busysystem is fully busy
Process FlowchartsProcess Flowcharts
© 2006 Prentice Hall, Inc. 9 – 10
• Throughput Time – the time it takes to Throughput Time – the time it takes to complete a process from time of arrival to complete a process from time of arrival to time of exit. It is the sum of the critical time of exit. It is the sum of the critical path and the average time spent waiting.path and the average time spent waiting.
• Rush Order Flow Time – the time it takes Rush Order Flow Time – the time it takes to go through the system from beginning to go through the system from beginning to end without the waiting time.to end without the waiting time.
Process FlowchartsProcess Flowcharts
© 2006 Prentice Hall, Inc. 9 – 11
• See Handout – Problem 1See Handout – Problem 1
Sample ProblemSample Problem
© 2006 Prentice Hall, Inc. 9 – 12
• Also used to diagram a process and Also used to diagram a process and bottlenecksbottlenecks
• Also used to study labor utilizationAlso used to study labor utilization
Process DiagramsProcess Diagrams
© 2006 Prentice Hall, Inc. 9 – 13
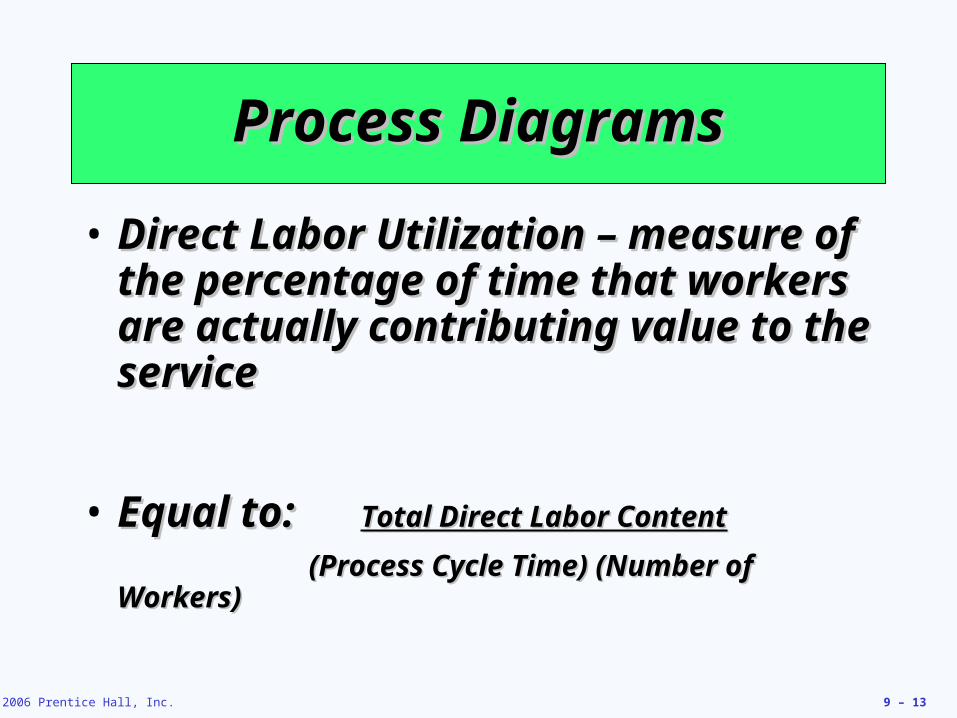
Process DiagramsProcess Diagrams
• Direct Labor Utilization – measure of Direct Labor Utilization – measure of the percentage of time that workers the percentage of time that workers are actually contributing value to the are actually contributing value to the serviceservice
• Equal to: Equal to: Total Direct Labor ContentTotal Direct Labor Content
(Process Cycle Time) (Number of (Process Cycle Time) (Number of Workers)Workers)
© 2006 Prentice Hall, Inc. 9 – 14
ExampleExample
• Drivers license office is under Drivers license office is under pressure to increase productivity to pressure to increase productivity to accommodate 120 license renewal accommodate 120 license renewal applicants per hourapplicants per hour
• One clerk will be added to the staffOne clerk will be added to the staff
• How can the system be changed to How can the system be changed to meet this goal?meet this goal?
© 2006 Prentice Hall, Inc. 9 – 15
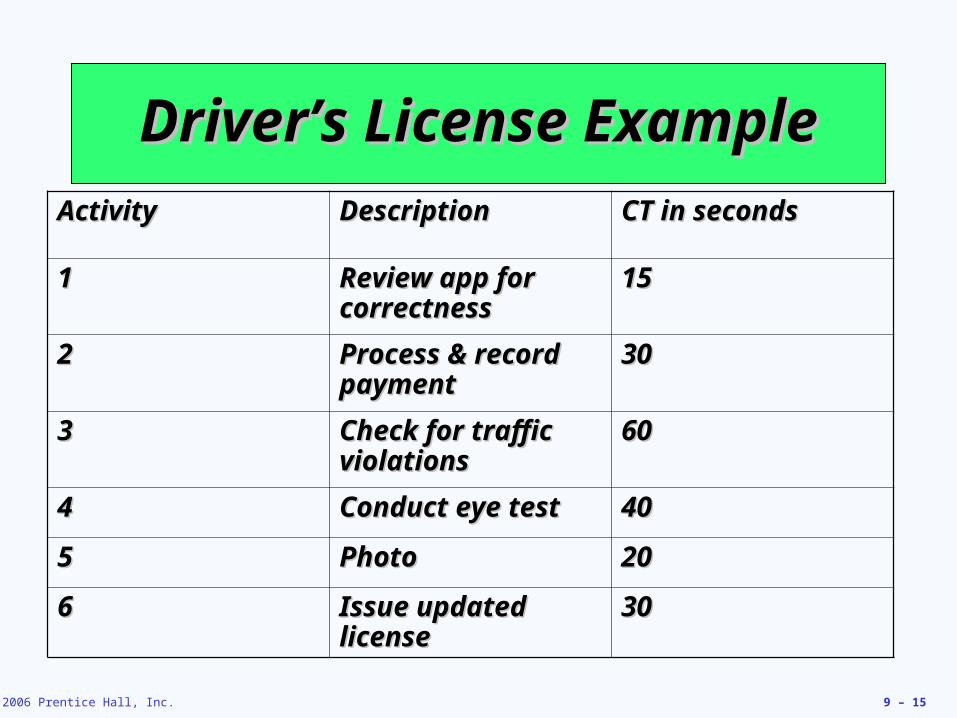
Driver’s License ExampleDriver’s License ExampleActivityActivity DescriptionDescription CT in secondsCT in seconds
11 Review app for Review app for correctnesscorrectness
1515
22 Process & record Process & record paymentpayment
3030
33 Check for traffic Check for traffic violations violations
6060
44 Conduct eye testConduct eye test 4040
55 PhotoPhoto 2020
66 Issue updated Issue updated licenselicense
3030
© 2006 Prentice Hall, Inc. 9 – 16
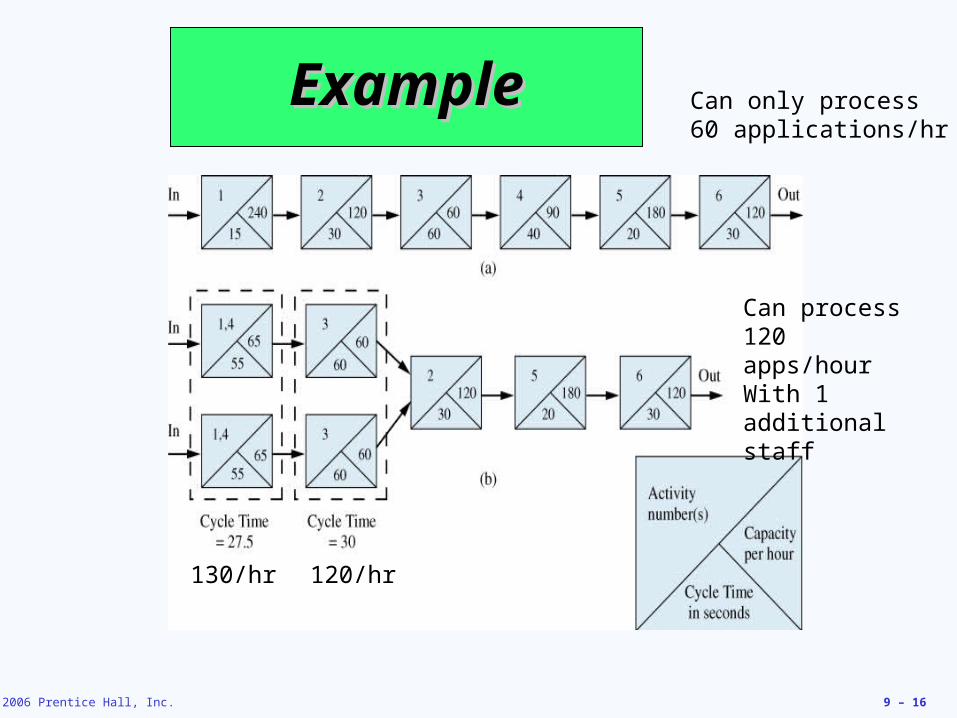
ExampleExample
120/hr130/hr
Can process 120 apps/hourWith 1 additional staff
Can only process60 applications/hr
© 2006 Prentice Hall, Inc. 9 – 17
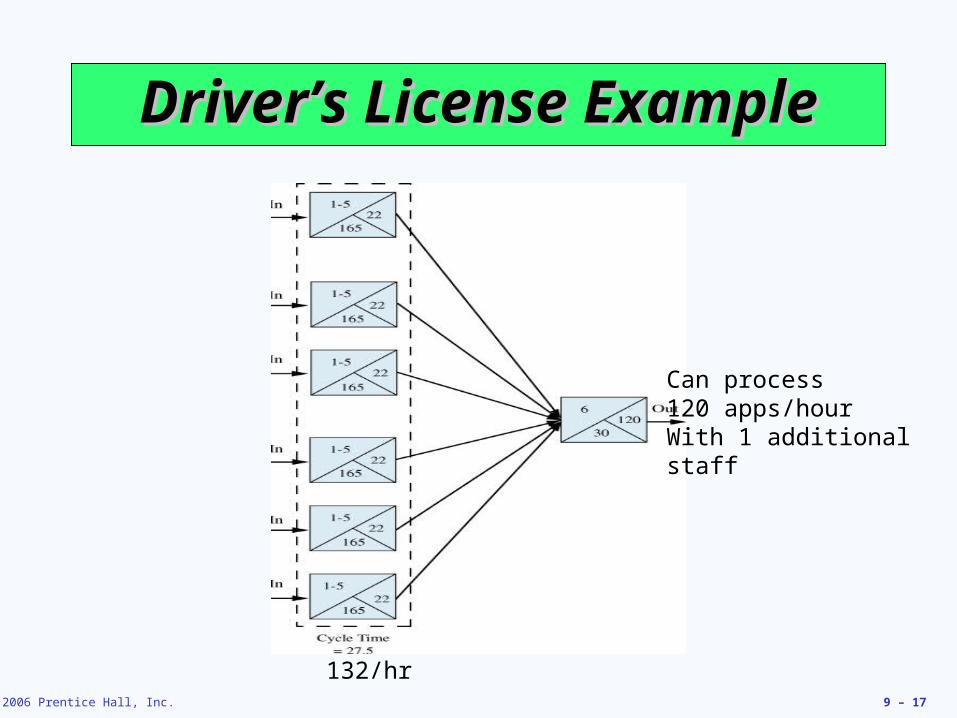
Driver’s License ExampleDriver’s License Example
132/hr
Can process 120 apps/hourWith 1 additional staff
© 2006 Prentice Hall, Inc. 9 – 18
ServicescapesServicescapes Ambient conditions - background Ambient conditions - background
characteristics such as lighting, characteristics such as lighting, sound, smell, and temperaturesound, smell, and temperature
Spatial layout and functionality - Spatial layout and functionality - which involve customer circulation which involve customer circulation path planning, aisle characteristics, path planning, aisle characteristics, and product groupingand product grouping
Signs, symbols, and artifacts - Signs, symbols, and artifacts - characteristics of building design characteristics of building design that carry social significancethat carry social significance
© 2006 Prentice Hall, Inc. 9 – 19
ServicescapesServicescapes
• Operations Sequence AnalysisOperations Sequence Analysis
• See handout for exampleSee handout for example
Service LayoutsService Layouts