operations management chapter 12 – inventory management © 2006 prentice hall, inc. powerpoint...
Post on 20-Dec-2015
348 views
TRANSCRIPT

Operations ManagementOperations ManagementChapter 12 – Inventory ManagementChapter 12 – Inventory Management
© 2006 Prentice Hall, Inc.
PowerPoint presentation to accompanyPowerPoint presentation to accompany Heizer/Render Heizer/Render Principles of Operations Management, 6ePrinciples of Operations Management, 6eOperations Management, 8e Operations Management, 8e

Safety stock 16.5 units
ROP ROP
Place Place orderorder
Probabilistic DemandIn
ven
tory
lev
elIn
ven
tory
lev
el
TimeTime00
Minimum demand during lead timeMinimum demand during lead time
Maximum demand during lead timeMaximum demand during lead time
Mean demand during lead timeMean demand during lead time
Normal distribution probability of Normal distribution probability of demand during lead timedemand during lead time
Expected demand during lead time Expected demand during lead time (350(350 kits kits))
ROP ROP = 350 += 350 + safety stock of safety stock of 16.5 = 366.516.5 = 366.5
Receive Receive orderorder
Lead Lead timetime
Figure 12.8Figure 12.8

Probabilistic Demand
Safety Safety stockstock
Probability ofProbability ofno stockoutno stockout
95% of the time95% of the time
Mean Mean demand demand
350350
ROP = ? kitsROP = ? kits QuantityQuantity
Number of Number of standard deviationsstandard deviations
00 zz
Risk of a stockout Risk of a stockout (5% of area of (5% of area of normal curve)normal curve)

Probabilistic Demand
Use prescribed service levels to set safety stock when the cost of stockouts cannot be determined
ROP = demand during lead time + ZROP = demand during lead time + Zdltdlt
wherewhere Z Z ==number of standard number of standard deviationsdeviations
dltdlt = =standard deviation of standard deviation of demand during lead timedemand during lead time

Probabilistic Example
Average demand Average demand = = = 350 = 350 kits kitsStandard deviation of demand during lead time Standard deviation of demand during lead time = = dltdlt = 10 = 10 kits kits5%5% stockout policy stockout policy ((service level service level = 95%)= 95%)
Using Appendix I, for an area under the curve Using Appendix I, for an area under the curve of of 95%,95%, the Z the Z = 1.65= 1.65
Safety stock Safety stock == Z Zdltdlt = 1.65(10) = 16.5= 1.65(10) = 16.5 kits kits
Reorder pointReorder point ==expected demand during lead expected demand during lead time + safety stocktime + safety stock
==350350 kits kits + 16.5+ 16.5 kits of safety kits of safety stockstock
==366.5366.5 or or 367367 kits kits

Other Probabilistic Models
1. When demand is variable and lead time is constant
2. When lead time is variable and demand is constant
3. When both demand and lead time are variable
When data on demand during lead time is not available, there are other models available

Other Probabilistic Models
Demand is variable and lead time is constantDemand is variable and lead time is constant
ROP ROP == ((average daily demand average daily demand x lead time in daysx lead time in days) +) + Z Zdltdlt
wherewhere dd == standard deviation of demand per day standard deviation of demand per day
dltdlt = = dd lead timelead time

Probabilistic Example
Average daily demand Average daily demand ((normally distributednormally distributed) = 15) = 15Standard deviation Standard deviation = 5= 5Lead time is constant at Lead time is constant at 22 days days90%90% service level desired service level desired
Z for Z for 90%90% = 1.28= 1.28From Appendix IFrom Appendix I
ROPROP = (15 = (15 units x units x 22 days days) +) + Z Zdltdlt
= 30 + 1.28(5)( 2)= 30 + 1.28(5)( 2)
= 30 + 8.96 = 38.96 ≈ 39= 30 + 8.96 = 38.96 ≈ 39
Safety stock is about Safety stock is about 99 units units

Other Probabilistic Models
Lead time is variable and demand is constantLead time is variable and demand is constant
ROP ROP ==((daily demand x daily demand x average lead time in daysaverage lead time in days))
==Z xZ x ( (daily demanddaily demand) ) xx ltlt
wherewhere ltlt == standard deviation of lead time in days standard deviation of lead time in days

Probabilistic Example
Daily demand Daily demand ((constantconstant) = 10) = 10Average lead time Average lead time = 6= 6 days daysStandard deviation of lead time Standard deviation of lead time = = ltlt = 3 = 398%98% service level desired service level desired
Z for Z for 98%98% = 2.055= 2.055From Appendix IFrom Appendix I
ROPROP = (10 = (10 units x units x 66 days days) + 2.055(10) + 2.055(10 units units)(3))(3)
= 60 + 61.55 = 121.65= 60 + 61.55 = 121.65
Reorder point is about Reorder point is about 122 122 unitsunits
Other Probabilistic Models
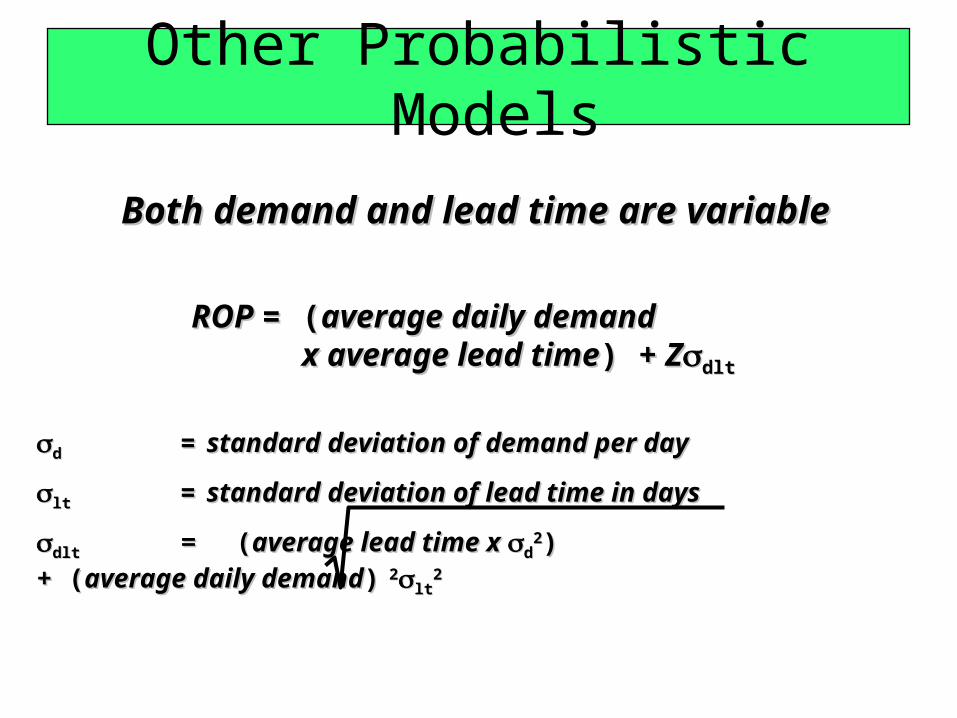
Both demand and lead time are variableBoth demand and lead time are variable
ROP ROP == ((average daily demand average daily demand x average lead timex average lead time) +) + Z Zdltdlt
wherewhere dd == standard deviation of demand per daystandard deviation of demand per day
ltlt == standard deviation of lead time in daysstandard deviation of lead time in days
dltdlt == ((average lead time x average lead time x dd22) )
+ (+ (average daily demandaverage daily demand)) 2 2ltlt22

Probabilistic Example
Average daily demand Average daily demand ((normally distributednormally distributed) = 150) = 150Standard deviation Standard deviation = = dd = 16 = 16Average lead time Average lead time 55 days days ((normally distributednormally distributed))Standard deviationStandard deviation = = ltlt = 1 = 1 dayday95%95% service level desired service level desired Z for Z for 95%95% = 1.65= 1.65
From Appendix IFrom Appendix I
ROPROP = (150 = (150 packs x 5 dayspacks x 5 days) + 1.65) + 1.65dltdlt
= (150 x 5) + 1.65 (5 days x 16= (150 x 5) + 1.65 (5 days x 1622) + (150) + (15022 x 1 x 122))
= 750 + 1.65(154) = 1,004 = 750 + 1.65(154) = 1,004 packspacks

Fixed-Period (P) Systems
Orders placed at the end of a fixed period
Inventory counted only at end of period
Order brings inventory up to target level
Only relevant costs are ordering and holding
Lead times are known and constant
Items are independent from one another
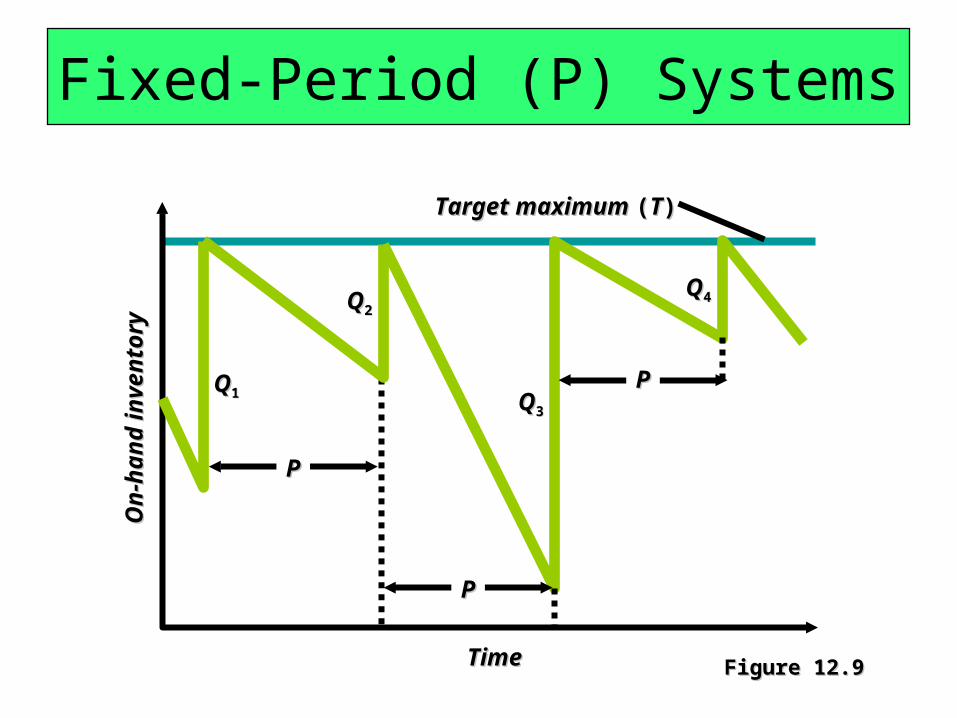
Fixed-Period (P) SystemsO
n-h
and
in
ven
tory
On
-han
d i
nve
nto
ry
TimeTime
QQ11
QQ22
Target maximum Target maximum ((TT))
PP
QQ33
QQ44
PP
PP
Figure 12.9Figure 12.9

Fixed-Period (P) Example
Order amount Order amount ((QQ)) = Target = Target ((TT)) - On- - On-hand inventory - Earlier orders not yet hand inventory - Earlier orders not yet
received + Back ordersreceived + Back orders
Q Q = 50 - 0 - 0 + 3 = 53= 50 - 0 - 0 + 3 = 53 jackets jackets
3 3 jackets are back orderedjackets are back ordered No jackets are in stockNo jackets are in stockIt is time to place an orderIt is time to place an order Target value Target value = 50= 50
Fixed-Period Systems
Inventory is only counted at each review period
May be scheduled at convenient times
Appropriate in routine situations
May result in stockouts between periods
May require increased safety stock