yukon visitor tracking program summer 2012 visitor survey draft key yukon findings
DESCRIPTION
Yukon Visitor Tracking Program Summer 2012 Visitor Survey DRAFT Key Yukon Findings. Presented to TIAY AGM May 3, 2013. Box 2180 Marsh Lake, Yukon 867.660-4600. In collaboration with: Advanced Analytics – Dr. Rick Pollack Arizona State University - Dr. Tim Tyrell McDowell Group - Alaska. - PowerPoint PPT PresentationTRANSCRIPT

Yukon Visitor Tracking ProgramSummer 2012 Visitor Survey
DRAFT Key Yukon Findings
Presented to TIAY AGMMay 3, 2013
In collaboration with: Advanced Analytics – Dr. Rick PollackArizona State University - Dr. Tim TyrellMcDowell Group - Alaska
Box 2180Marsh Lake, Yukon867.660-4600

Why we did the study
Who responded to the survey
What are the results – Some Key Findings
Background and Process
Draft 2012 Key Yukon Findings - Summer 2012

Primary Goal: To develop a sustainable system to monitor visitors behaviour and volumes
Objectives: 1. Conduct a survey of visitors exploring options to
reduce survey costs while having the ability to compile representative and accurate findings.
2. Create a volume estimation tool that can be used with minimum costs.
Goals/Objectives
Draft 2012 Key Yukon Findings - Summer 2012

Random/Representative Sample
Traditional Sample
Contest
PaperInquirers
Industry
Normal weighting : Exit/Entrance Point and Mode of Transportation weights
Requires Normal weighting : (Exit/Entrance Point and Mode of Transportation) PLUSActivity Indicators weights, sample source, and country of origin.
Convenience Tablets
Least Accurate Most AccurateConvenience Sample
Merging low cost and representative sample
Draft 2012 Key Yukon Findings - Summer 2012

Traditional Exit Study Interviews
Convenience Study Interviews

Final Summer Sample
Margin of Error on Total = +/- 1.57
Data Collection for travel months June 1 to Sept. 30, 2012
Total Final Sample – Summer Main survey = 3,844
Draft 2012 Key Yukon Findings - Summer 2012
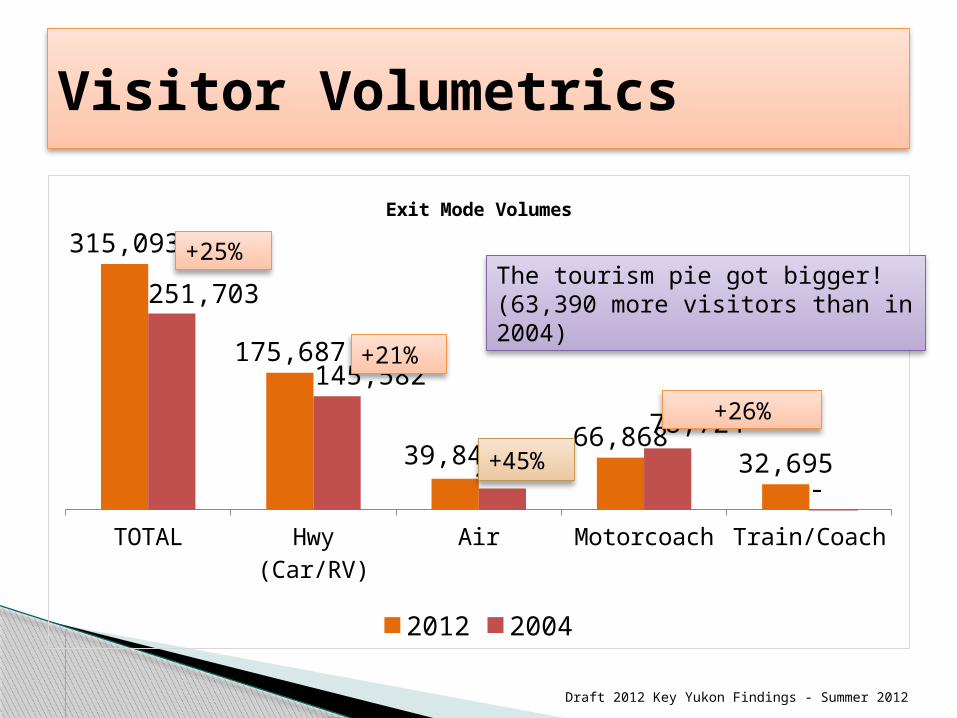
TOTAL Hwy (Car/RV) Air Motorcoach Train/Coach
315,093
175,687
39,843 66,868
32,695
251,703
145,582
27,397
78,724
-
Exit Mode Volumes
2012 2004
+45%
Visitor Volumetrics
The tourism pie got bigger! (63,390 more visitors than in 2004)
+25%
+21%
+26%
Draft 2012 Key Yukon Findings - Summer 2012

1987 1994 1999 2004 20120
50000100000150000200000250000300000350000
Visitors
Visitors
Visitor Volume Growth
Time Period between Studies
Visitor Change
Between 1987 to 1994 1% per yearBetween 1994-1999 3% per yearBetween 1999-2004 2% per yearBetween 2004 - 2012 3% per yearDraft 2012 Key Yukon Findings - Summer 2012

Visitor Volume
Canada United States Primary/Secondary Mkts
All Other
79,500
208,000
17,200 10,800
Total Visitors
Visitors - Summer 2012

Visitor Volume
Canada25%
United States66%
Primary/Secondary Mkts5%All Other
3%
Total Visitors

Purpose of Trip
Visit Alaska39%
Visit the
Yukon
specifically 20%
Other15%
Take a road trip/drive the Alaska Highway
14%
Take a
cruise12%
When you first started thinking about travelling for this trip, was it PRIMAR-ILY :
Draft 2012 Key Yukon Findings - Summer 2012

Business Personal/Leisure
8%
92%Was your trip PRIMARILY for: Business, Leisure/Personal
Summer 2012
Purpose of Trip
2004 = 7% Business
Draft 2012 Key Yukon Findings - Summer 2012

Conference, Convention at -
tendee20%
Other Business/Work/re-
lated: 80%
Which of the following is your primary purpose of this trip: Conference/Convention, Other Business/Work/ related
2004 = 10% of Business was Conference/Convention
Purpose of Trip – Among Business Travellers
Government Mining Other
5% 10%
84%
Which of the following is your primary purpose of this trip: Min-
ing, Government, Other
Draft 2012 Key Yukon Findings - Summer 2012

Other Leisure Wilderness VFR Personal Family Festival
77%
10% 8%2% 2%
Which of the following is your primary purpose of this trip?
Summer 2012
Purpose of Trip – Among Leisure Travellers
2004 = 6% VFR, 6% Wilderness
Draft 2012 Key Yukon Findings - Summer 2012

Trip Profile - Accommodations
44%30%
18%8% 9% 8%
18%
On this trip, in Yukon, did you stay at a:
Summer 2012
2004 = 40% Hotel, 24% RV/commercial campground, 13% gov’t cg, 4% Friends/Family
Draft 2012 Key Yukon Findings - Summer 2012

One day (0 nights)
2 days (1 night) 3 - 7 days 8 - 14 days 15+ days
16%8%
49%
15% 12%
Days in the Yukon (nights +1)
Summer 2012
Avg = 8.2 days7.2 nights
Trip Profile – Length of Stay
2004 – used nights rather than days… 2004 - 24% day trips vs. 16% in 2012 (but 10% in 1999) - 30% 1 – 2 Nights (24% in 2012) - 34% 3 – 7 nights (35% in 2012) - 12% 8+ nights (25% in 2012)Overall drop in day trip and 1 – 2 night trips, increase in 8+ night trips
Avg in 2004 = 5.5 nights

Length of Stay
Canada United States Primary/Secondary Mkts
All Other
16.1
3.8
8.56.9
Nights in the Yukon
Avg Nights - Summer 2012

Trip Profile – Length of Stay
Away from home
In Alaska
In Yukon
24
9.2
7.2
How many total nights were you away from home?
Mean

1 2 3 4-10 11+
5%
35%
11%
32%
16%
Total Party Size (adults + kids)
Summer 2012
Tri-mean = 3.1 peopleMedian = 3.0
Trip Profile – Party Size
2004 – average = 2.3 person
Draft 2012 Key Yukon Findings - Summer 2012

44% 42% 39% 39% 35% 31% 29% 24%18% 18% 18% 17% 16% 12%
Here is a list of activities you may have done while on your recent trip to the Yukon. While in the Yukon did you:
Summer 2012
Trip Profile – Activities
2004 = Natural attractions = 58%, Shopping = 64%, Man-made attractions = 58% Draft 2012 Key Yukon Findings - Summer 2012

Transportation
Personal Vehicle
56%
Bus21%
Train10%
Air13%
Did you enter the Yukon by
Personal Vehicle decreased slightly from 58% in 2004 while Air increased from 11% to 13%.
Draft 2012 Key Yukon Findings - Summer 2012

Draft 2012 Key Yukon Findings - Summer 2012
Car/Truck/Van RVCamper Motorcycle
68%
28%
4%
(IF PERSONAL VEHICLE) Was that by: Car/truck/van, RV/camper, Motorcycle
Summer 2012
Transportation – Personal Vehicle
2004 – 70% Car/Truck/Van/Motorcycle, 30% RV/Camper

Camp in an RV or camper/trailer
Camp in a Tent Both
56%
41%
3%
On this trip, in Yukon, did you stay at a: Camp in an RV or camper/trailer, Camp in a Tent, Both
Summer 2012
Transportation

Drove into
Canada40%
Flew into Canada15%
Came on the
train from Sk-ag-way8%
Cruised, fer-ried or
boated into Cana
da7%
Came in a mo-tor-
coach/bus6%
None, we
live in Cana
da25%
On this trip, how did you first enter Canada?
Transportation

Vanco
uver, B
ritish
Columbia
Don't know/re
member
Toronto, Ontar
io
Calgary
, Alberta
Whitehorse
, Yuko
nOther
75%
9% 5% 5% 3% 2%
Which city in Canada did you first land in?
Summer 2012
Transportation

Day Trip Tour Coach/Bus Independent Greyhound Other
25%
69%
4% 1% 2%
(IF COACH/TRAIN). Were you: Multi-day tour, Shore excursion/day tour, Greyhound or other bus, Travelling independently, Other
Summer 2012
Transportation
2004 Exit Study data reported $75.8 M total spend. That is $87.2M adjusted for inflation.
Based on the inflation adjustment for 2004, spending is up $25.8M compared to 2004. A 29% increase
A rough comparison on $ per person per day spending suggests a drop from 2004.
NOTE: spending questions in 2012 were more detailed and more likely to increase recall of spending. Survey was also post-trip, after all bills and total expenses could be recalled.
Spending changes
Draft 2012 Key Yukon Findings - Summer 2012

All Yukon related activities, including Pre-Trip Purchases of Hotels, Guided Tour or Activity, Yukon Rental Car or RV plus In Yukon purchases exclude all pre-trip spending, but include spending in the Yukon on Accommodations, Rental Vehicles, Groceries, Alcohol, Meals, Souvenirs/Arts and Crafts, Outdoor Activities, Organized Day tours, Admissions, Entertainment, Gasoline/fuel, Vehicle repair, Local Transportation, Other, plus pre-trip spending on non-cruise (airline) packages and shore excursions.
Spending – Yukon Related Spending
$64Per Person Per Day
$112,440,000 Total Spend
Most similar to past
studies and best fit for
Yukon spend
Draft 2012 Key Yukon Findings - Summer 2012

Other Spending
$10Per Person Per Day
Spending Group $ per person per
day
Total Spend
Pre-Trip Spending $10 $ 15,460,000Packages excluding transportation
$10 $ 18,210,000
In-Yukon Spend $44 $ 78,770,000 - Sum of Yukon total
$64 $112, 440,000
Transportation $14 $ 28,110,000TOTAL w/Transportation $78 $140,550,000
Pre-trip = purchases of hotels, guided tours or activities, Yukon rental car/RV/In Yukon purchases exclude all pre-trip spending, but include spending in the Yukon on Accommodations, Rental Vehicles, Groceries, Alcohol, Meals, Souvenirs/Arts and Crafts, Outdoor Activities, Organized Day tours, Admissions, Entertainment, Gasoline/fuel, Vehicle repair, Local Transportation, OtherPackages = pre-trip spending on non-cruise (airline) packages and shore excursions. Transportation = cruise, airline tickets, non-Yukon vehicle rentals
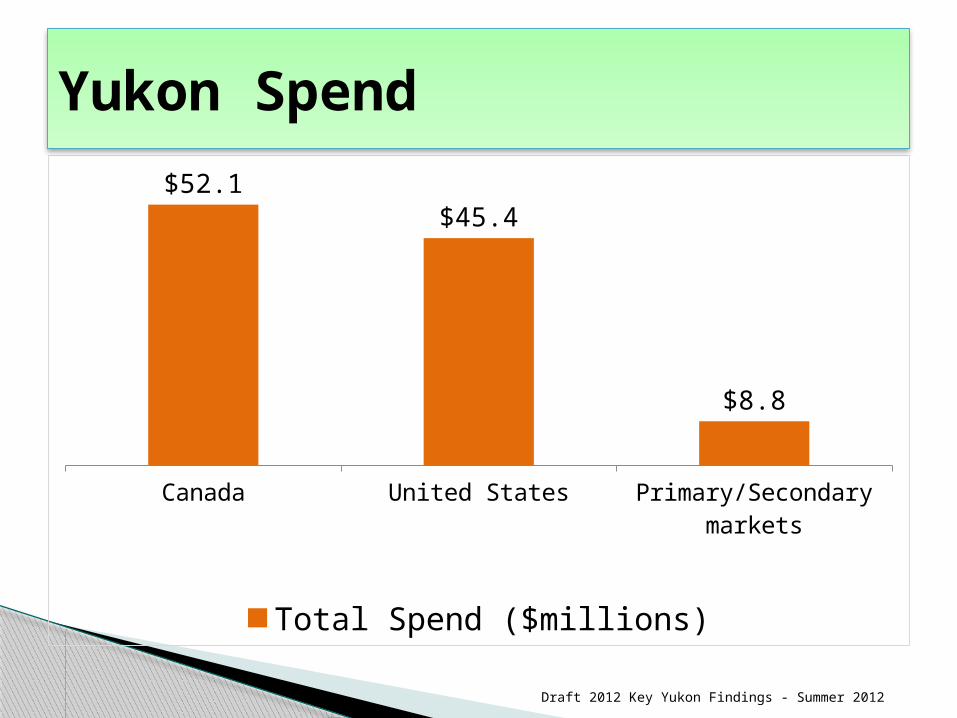
Canada United States Primary/Secondary markets
$52.1 $45.4
$8.8
Total Spend ($millions)
Yukon Spend
Draft 2012 Key Yukon Findings - Summer 2012

Primary/Secondary Mkts Canada United States
$70
$67
$62
Person/Day
Yukon Spend – Person per day
Draft 2012 Key Yukon Findings - Summer 2012

33. Gender: Male, Female?
Male54%
Fe-male46%
Gender
Demographics
2004 = female 47%, 53% male
Draft 2012 Key Yukon Findings - Summer 2012

Under 24 25-34 35-44 45-54 55-64 65+
4%6%
17%
27%24%
22%
Age of Respondent
Summer 2012
Avg. = 52.6 yearsMedian = 52
Demographics
Draft 2012 Key Yukon Findings - Summer 2012

Canada United States Other
79,500
208,000
27,900
775,700728,800
182,200
Origin
Visitors Person-Days
Demographics

Draft 2012 Key Yukon Findings - Summer 2012
Motivations/Lifestyle
Yes37%
No63%
Prior to this trip, had you ever been to the Yukon before?
2004 – No = 65%, Yes = 35%

Authentic Exp
erience
r
Cultural
Explorer
Gentle Exp
lorer
Free Sp
irit
Cultural
History
Buff
No Hassle Trav
eller
Rejuvenato
r
Personal
History
Explorer
Virtual
Travelle
r
25%
18% 18%14%
7% 7% 7%2% 1%
EQ Segments
Summer 2012
Motivations/Lifestyle - EQ
Draft 2012 Key Yukon Findings - Summer 2012

Authentic Exp
erience
r
Cultural
Explorer
Gentle Exp
lorer
Free Sp
irit
Cultural
History
Buff
No Hassle Trav
eller
Rejuvenato
r
Personal
History
Explorer
Virtual
Travelle
r
25%18% 18%
14%7% 7% 7%
2% 1%
38%
11%
22%19%
2% 2% 3% 2% 2%
EQ Segments
% of Visitors % of Person-Days
Motivations/Lifestyle - EQ
Draft 2012 Key Yukon Findings - Summer 2012

Draft 2012 Key Yukon Findings - Summer 2012
Importance & Satisfaction – Top Ratings
To be physically active
Challenge myself
Experience midnight sun
Klondike Gold Rush history
Museums and historical attractions.
Visit a place that few others have been to
Visit and experience Alaska.
Wildlife viewing opportunities
59%
52%
61%
73%
67%
64%
70%
73%
37%
38%
39%
40%
43%
45%
55%
58%
Important (4/5) Satisfaction (4/5)
Draft 2012 Key Yukon Findings - Summer 2012
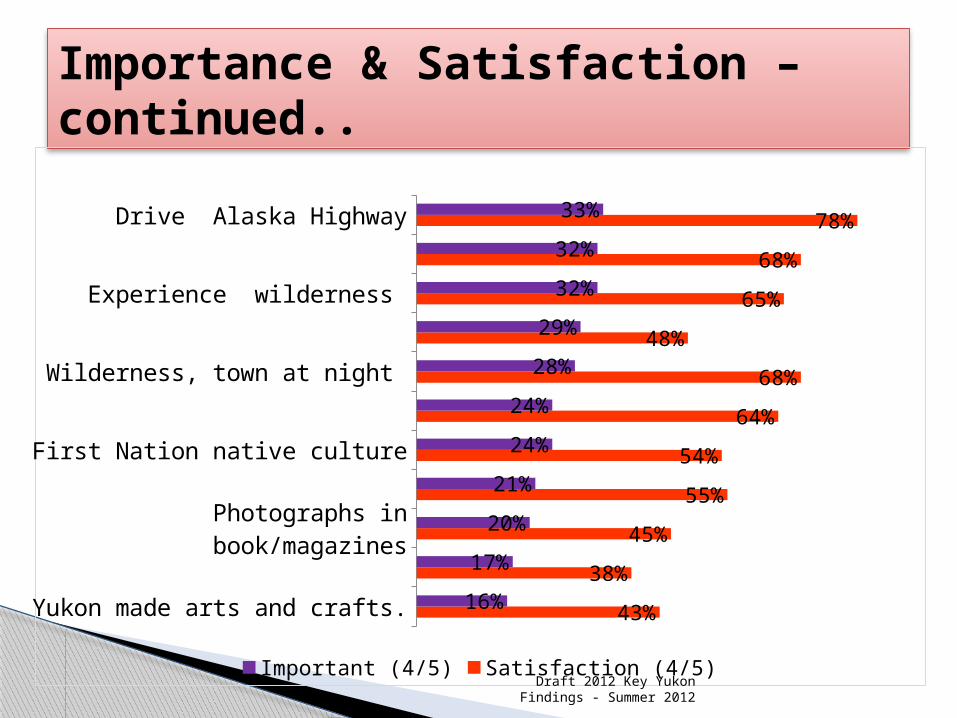
Importance & Satisfaction – continued..
Yukon made arts and crafts.
Excellent value for the money.
Photographs in book/magazines
Connect to my Yukon heritage
First Nation native culture
Quiet time to relax/reflect
Wilderness, town at night
Tag on YT land tour to cruise.
Experience wilderness
Visit Dawson City
Drive Alaska Highway
43%
38%
45%
55%
54%
64%
68%
48%
65%
68%
78%
16%
17%
20%
21%
24%
24%
28%
29%
32%
32%
33%
Important (4/5) Satisfaction (4/5)

Not At All Somewhat Likely
Likely Very Likely Definitely Will
6% 4%
37%
27% 26%
46. How likely are you to visit the Yukon again?
Summer 2012
Satisfaction – Visit Again
2004 – yes = 61%Draft 2012 Key Yukon Findings - Summer 2012

Not At All Somewhat Likely
Likely Very Likely Definitely Will
1%
30% 30%
38%
44. How likely are you to refer the Yukon as a destination to visit to your friends and family? 1 = Not at all likely, 5 = Definitely will.
Summer 2012
Satisfaction – Refer
Draft 2012 Key Yukon Findings - Summer 2012

1...Least Favorite
2... 3.... 4... 5...Most Favorite
0.28
0.56
0.16
Comparing the Yukon to other destinations you have visited, how would you rate the Yukon: 1 = Least Favorite and 5 = Most Favorite
Summer 2012
Satisfaction – Compared to others…

Computer Tablet Smart Phone None of These
81%
32%25%
2%
Which of the following do you use to access travel websites:
Summer 2012
Pre-Trip Planning

City, S
tate, Province
, Country
.
Travel co
mpany’s w
ebsit
es.
Socia
l Netw
orking sit
es, such
as Face
book.
Review sit
es, such
as Trip
Advisor
Booking sit
es such
as Kayak
and Trave
locity.
Video/photo sit
es such
as YouTube, F
lickr.
None of th
ese.
67%
37%
11%
47%33%
10% 10%
Which of the following travel websites do you typically use when planning your trips:
Summer 2012
Pre-Trip Planning

YT Vaca
tion Planner
Yukon Adverti
sing
Travel
Guides/Books
Travel
Agent
Frien
ds or R
elatives w
ho had visite
d Yukon
News/Maga
zine (p
rinted or o
nline).
www.trav
elyukon.co
m
Frien
ds or R
elatives who liv
e in Yu
kon
Review sit
es, su
ch as T
ripAdviso
r
Booking sit
es, such
as Kayak a
nd Travelo
city
Travel
company w
ebsites
Loca
l Trav
el or O
utdoor Show
Video/photo sit
es such
as YouTube, F
lickr
66% 63% 62% 57% 56% 54% 51% 45% 40% 35% 33% 33% 25%
49% 56%40%
20%
39%26%
58%
18%
38%23%
36%
5%12%
How much did each of those influence your decision to visit the Yukon:.
Used the source Strong Influence (4/5) among Users
Pre-Trip Planning

Magazine/Printed ma-
terial.
Internet. Other Billboards or public signs.
On TV.
57%
29% 29%
6% 5%
Was that Yukon Advertising you saw....
Summer 2012
Pre-Trip Planning

Accessi
ng the in
ternet
Yukon go
v Visitor In
fo Centres
Broch
ures/sales fl
yers
People m
eet/talked to
in th
e Yukon
Yukon Vacati
on Planner/G
uide.
Travel b
ooks
Community guide b
ooks.
Yukon W
ildlife
viewing guide
www.travely
ukon.co
m
local Yukon newsp
aper
Travel co
mpany w
ebsites
Socia
l Netw
orking sites,
ie Face
book
Yukon hunting or fi
shing guides
Video/photo sit
es such
as YouTube, F
lickr
Review
sites, s
uch as T
ripAdviso
r
73% 70%60% 55% 51% 49% 40% 37%34% 32% 28% 24%22% 21% 20%
67%93%
80%62%
77%87%
53% 48%
89%
41%
72%
9%22% 14%
61%
Rate the quality of the sources of information while travelling IN Yukon:
Used the sourceRated the source high quality (4/5) among users
In Yukon - Trip Planning

Less
than one m
onth
1-2 months
3-4 months
5-6 months
7-12 months
13+ (ove
r one ye
ar in ad
vance
)
1%
13%
30%
16%
33%
6%
How many months in advance did you decide to come on this trip to the Yukon? _____ # of months.
Summer 2012
Mean/Avg. = 6.5 months
Pre-Trip Planning (Booking)

Pre-Trip Planning (Booking)
43%
28% 28%20%
12%4%
Before arriving in the Yukon, which of the following did you do?
Summer 2012

Yes68%
No32%
Spend any money on pre-trip purchases
Pre-Trip Planning (Booking)

What we have learned so far…
◦ Visitor Volume is up 25%◦ Visitor Spending is up 29%
◦ Highlights : Increases experienced in:
Length of stay Visitors Arriving by Air Party Size Canadian visitors (and Overseas)
Decreases experienced in: Spending per person per day
Strong satisfaction rating Strong interest in visiting again and referring the destination
Summary
Draft 2012 Key Yukon Findings - Summer 2012

Continued cross check with 2004 data Compilation of Map/Pathway data Preparation of Main Summer Report
(summary and detailed) Distribution of Summer Reports on Origin/
markets, Mode of Transportation, Key Activities, EQ Segments, Pathways, Trip Purpose and planning ,etc.
Collection, weighting, analysis and reporting of Winter Survey
Next Steps
Draft 2012 Key Yukon Findings - Summer 2012

THANKS TO:
Air North Westmark Hotels High Country Inn (Coast High Country) Gold Rush Hotel North of Ordinary Many other tourism operators too numerous
to mention!
Industry Supporters
Draft 2012 Key Yukon Findings - Summer 2012