work-life balance: determinants of housework and labour
TRANSCRIPT

Work-Life Balance:
Determinants of housework
and labour activities
overload.
November, 2021

I N F O R M A C I Ó N P A R A T O D O SI N F O R M A C I Ó N P A R A T O D O S
Content
Adaptation of surveys: Great Integrated
Household Survey and National Time-Use
Survey
Emerging data needs: Social Pulse Survey
Work-life Balance: Determinants of
housework and labor activities overload

Adaptation of surveys: Great Integrated
Household Survey and National Time-Use Survey

I N F O R M A C I Ó N P A R A T O D O S
Great Integrated Household SurveyData Sheet
Objetive
To provide basic information on the size and structure of the labour force
(employment, unemployment and inactivity) of the country's population, as
well as the socio-demographic characteristics of the Colombian
population.
Results publication periodicity
• Monthly (continuous weekly collection)
Geographical coverage:
• National Total Net.
• Municipal centres, population centres and dispersed
rural areas.
Adapted from an in-person collection
methodology to a CATI methodology to avoid
face-to-face meetings during the pandemic
(March-April period)

I N F O R M A C I Ó N P A R A T O D O S
National Time-Use SurveyStatistical Operation Adjustments
• To adapt the questionnaire to a CATI operation, a reduce form was
designed going from 200 to 39 questions.
• With this reduction in the number of questions, telephone
interviews last a maximum of 20 minutes, while face-to-face
interviews do not exceed 45 minutes.
• The reduced form retains questions on sex and age, job
classification, and characteristics of employed persons such as:
economic activity, occupation performed, income from main activity,
occupational position and hours worked (normal and effective).
• During this period, only income sources
corresponding to wages and net earnings were
collected, which represent about 65% of the
aggregate income of Colombian households.
• Between November and December 2020 DANE
implemented a telephone recovery operation to
re-contact households to collect information not
covered by the reduced questionnaire.
• In addition, DANE developed different analyses of
the consistency of the information from the
recovery operation that allowed contrasting the
different sources of income using administrative
records.

I N F O R M A C I Ó N P A R A T O D O S
National Time-Use SurveyData Sheet
Objetive
To produce statistical information that allows the characterization
of the time spent by the population aged 10 and over to work
activities, paid and unpaid, and to personal activities.
Collection periodicity
• Triennial – continuous data collection for 52 weeks
(1 year of collection).
• Applications 2012-2013 and 2016-2017. In
collection 2020-2021 September 2020 to August
2021.
Geographical coverage:
• National Total Net.
• Municipal centres, population centres and dispersed
rural areas.
• Regions: Bogotá, San Andrés, Caribbean, Pacific,
Central and Eastern.
Due to the collection periodicity, it was decided
not to change the in-person collection
methodology. A CATI operation would have
jeopardized time comparability
I N F O R M A C I Ó N P A R A T O D O S
National Time-Use SurveyStatistical Operation Adjustments
• Inclusion of a chapter with specialized interview
questions in relation to the health emergency. For
example, questions related to the time spent
shopping online and disinfecting objects and food
were added.
• In rural areas, the direct interview mechanism was
maintained. As a protective measure during the
operation, DANE field personnel received a biosafety
kit with a mask, nitrile gloves, goggles,
antibacterial gel and antiseptic alcohol.
• Awareness and direct communication with
households, through communication strategies to
reduce rejections during the operation.
• As a last alternative to ensure their participation in the
survey, households that expressed fear of covid-19
had the possibility of responding the survey by
telephone.
Selected sample coverage
98%

Emerging data needs: Social Pulse Survey

I N F O R M A C I Ó N P A R A T O D O S
Social Pulse SurveyData Sheet
Objetive
In response to the health emergency caused by COVID-19, DANE
generated a new statistical operation about:
• Consumer's confidence (13 questions)
• Labor market and home-based work (6 questions)
• Subjective well being (38 questions)
• Household support networks (8 questions)
• Education of children and adolescents in the household. (3
questions)
• Access to national and local household support policies. (2
questions)
• Violence (3 questions)
• Sexual Planning and Menstruation (10 questions)
Collection periodicity
• Monthly
Geographical coverage:
• National Total.
• 23 main cities and metropolitan areas
The Survey uses a subsample of the Great
Integrated Household Survey (GEIH), the
official source for the measurement of
income poverty and employment rates,
allowing to disaggregate the people who
reside in low-income and high-income
households.
I N F O R M A C I Ó N P A R A T O D O S
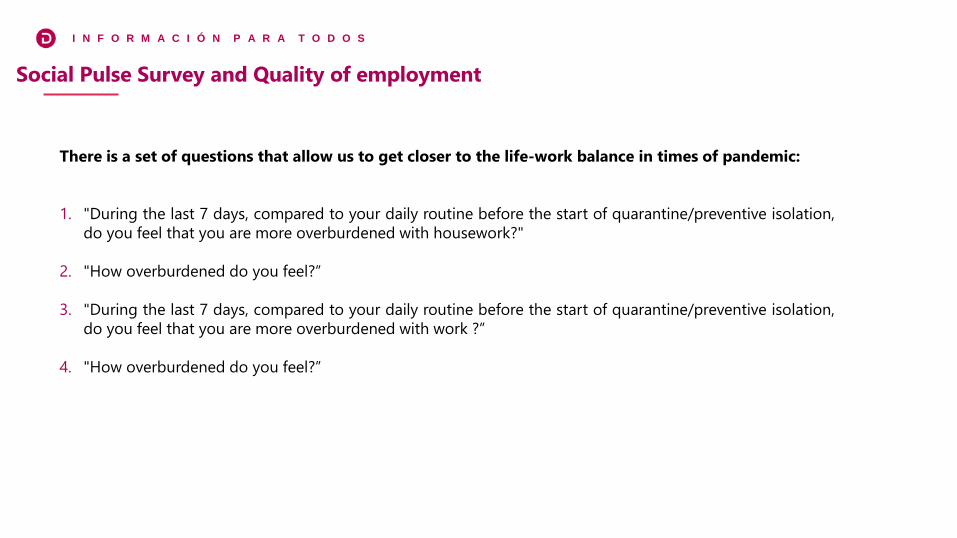
Social Pulse Survey and Quality of employment
There is a set of questions that allow us to get closer to the life-work balance in times of pandemic:
1. "During the last 7 days, compared to your daily routine before the start of quarantine/preventive isolation,
do you feel that you are more overburdened with housework?"
2. "How overburdened do you feel?”
3. "During the last 7 days, compared to your daily routine before the start of quarantine/preventive isolation,
do you feel that you are more overburdened with work ?”
4. "How overburdened do you feel?”

Work-life Balance: Determinants of housework
and labour activities overload

I N F O R M A C I Ó N P A R A T O D O S
Participation in work activities by sexNational Total Net
Source: DANE, National Time-Use Survey.
Higher limit
Lower limit
95% confidence level
54.9%
33.8%
60.0%
89.1%
52.6%
29.3%
61.3%
88.9%
52.6%
28.9%
63.8%
90.8%
0%
10%
20%
30%
40%
50%
60%
70%
80%
90%
100%
Men Women Men Women
Participation in paid work activities Participation in unpaid work activities
Perc
en
tag
e (
%)
January to April 2017 September to December 2020 January to April 2021

I N F O R M A C I Ó N P A R A T O D O S
Average daily time spent per participant in work activities by sex National Total Net
For the period from January to April 2021, by calculating the average daily hours dedicated to paid and unpaid work activities, the time for
men is 12 hours and 12 minutes compared to 15 hours and 34 minutes for women.
Source: DANE, National Time-Use Survey.
9:11
(73.1%)7:36
(52.2%)
8:59
(74.2%)7:49
(49.4%)
9:02
(74.0%)7:39
(49.1%)
3:23
(26.9%)
6:57
(47.8%)3:07
(25.8%)
8:00
(50.6%) 3:10
(26.0%)
7:55
(50.9%)
0:00
2:24
4:48
7:12
9:36
12:00
14:24
16:48
Men Women Men Women Men Women
January to April 2017 September to December 2020 January to April 2021
Participation in paid work activities Participation in unpaid work activities
12:34
14:33
12:06
15:49
12:12
15:34

I N F O R M A C I Ó N P A R A T O D O S
Average daily time per participant spent in unpaid work
activities and their related activities, by sexNational Total Net In the case of food supply
activities, the average
time spent by women is
approximately twice of
the time spent by men on
the same activities.
Compared to January-April
2017, the time dedicated
to passive care activities
has increased, especially in
women. However, when
compared with the period
from September to
December 2020, although
women spend more time,
the greatest increase was
generated in men.
Source: DANE, National Time-Use Survey.
Higher limit
Lower limit
95% confidence level
0:57
0:45
1:02
0:57
1:21
0:46
0:59
2:15
0:27
6:21
3:19
1:01
0:51
1:10
0:56
1:37
1:06
1:15
2:39
0:29
5:49
3:10
1:02
0:50
1:06
0:55
1:32
0:54
1:09
2:49
0:33
6:52
3:38
0:00 2:24 4:48 7:12 9:36 12:00
Provision of food
Clothes maintenance
Cleaning and maintenance
Shopping and household…
Activities with children under 5…
Physical care of household…
Support to household members
Volunteer activities
Related transfers
Passive attention (being aware…
Related activities
hh:mm
Men
January to April 2017
September to december 2020
2:04
1:16
1:21
0:56
1:32
1:24
1:07
3:03
0:25
7:12
2:56
2:02
1:20
1:26
0:58
1:49
1:42
2:00
3:30
0:31
10:14
3:00
2:08
1:18
1:24
0:55
1:45
1:38
1:44
3:38
0:31
10:56
2:43
0:00 2:24 4:48 7:12 9:36 12:00
hh:mm
Women
I N F O R M A C I Ó N P A R A T O D O S
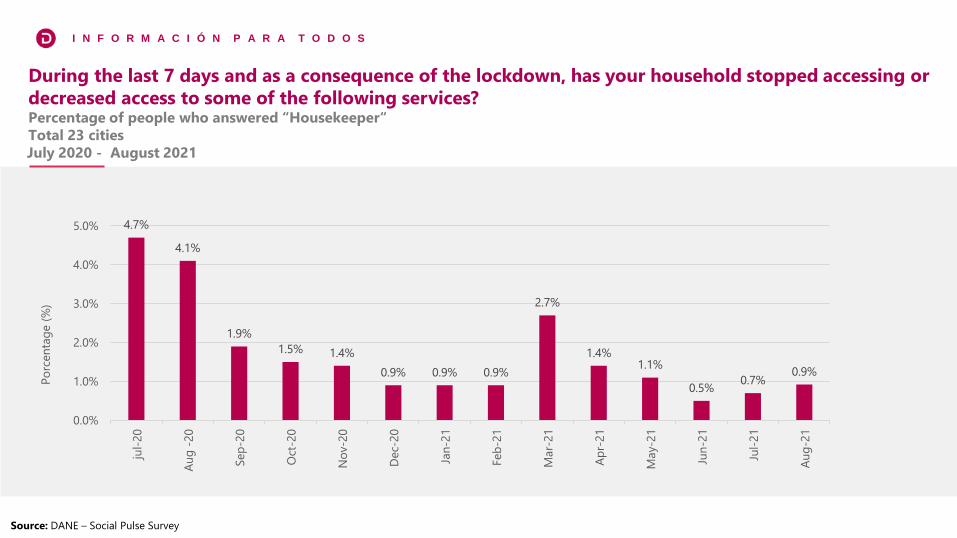
Source: DANE – Social Pulse Survey
During the last 7 days and as a consequence of the lockdown, has your household stopped accessing or
decreased access to some of the following services?Percentage of people who answered “Housekeeper“
Total 23 cities
July 2020 - August 2021
4.7%
4.1%
1.9%
1.5% 1.4%
0.9% 0.9% 0.9%
2.7%
1.4%1.1%
0.5%0.7%
0.9%
0.0%
1.0%
2.0%
3.0%
4.0%
5.0%
jul-
20
Au
g -
20
Sep
-20
Oct
-20
No
v-2
0
Dec-
20
Jan
-21
Feb
-21
Mar-
21
Ap
r-21
May-2
1
Jun
-21
Jul-
21
Au
g-2
1
Po
rcen
tag
e (
%)

I N F O R M A C I Ó N P A R A T O D O S
Percentage of people who feel overloaded with work tasksBy sex
Total 23 cities
July 2020 - August 2021
Source: DANE – Social Pulse Survey
23.2
%
22.1
%
20.2
% 23.8
%
21.2
% 24.5
%
23.0
%
18.9
%
20.2
%
22.1
%
17.6
%
16.2
% 18.7
%
23.1
%
19.5
%
18.4
%
19.4
%
17.6
%
19.8
%
18.4
%
17.0
%
17.1
% 20.2
%
19.8
%
14.1
%
13.2
%
14.9
%
16.9
%
0.0%
5.0%
10.0%
15.0%
20.0%
25.0%
30.0%
jul-
20
Au
g -
20
Sep
-20
Oct
-20
No
v-2
0
Dec-
20
Jan
-21
Feb
-21
Mar-
21
Ap
r-21
May-2
1
Jun
-21
Jul-
21
Au
g-2
1
Po
rcen
tag
e (
%)
Men Women
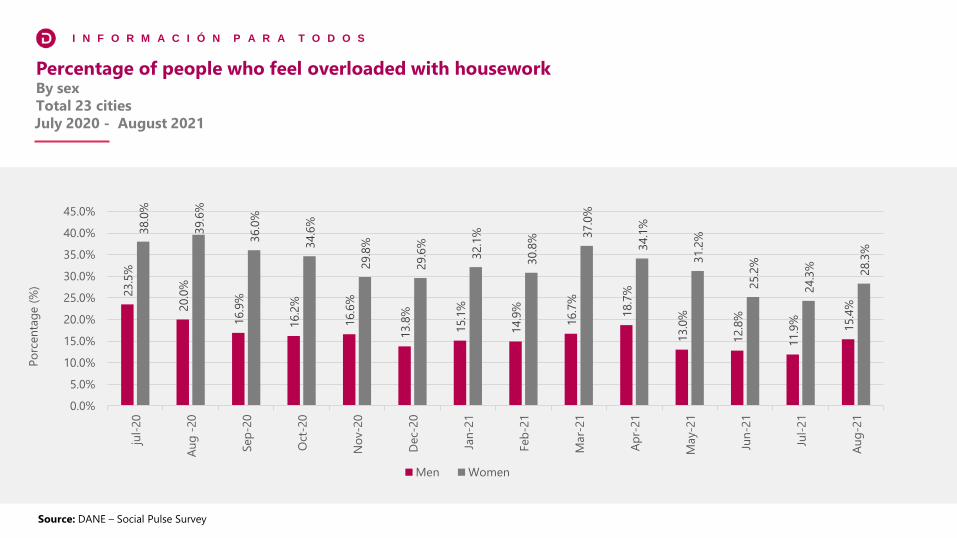
I N F O R M A C I Ó N P A R A T O D O S
Percentage of people who feel overloaded with houseworkBy sex
Total 23 cities
July 2020 - August 2021
Source: DANE – Social Pulse Survey
23.5
%
20.0
%
16.9
%
16.2
%
16.6
%
13.8
%
15.1
%
14.9
%
16.7
%
18.7
%
13.0
%
12.8
%
11.9
%
15.4
%
38.0
%
39.6
%
36.0
%
34.6
%
29.8
%
29.6
%
32.1
%
30.8
% 37.0
%
34.1
%
31.2
%
25.2
%
24.3
% 28.3
%
0.0%
5.0%
10.0%
15.0%
20.0%
25.0%
30.0%
35.0%
40.0%
45.0%
jul-
20
Au
g -
20
Sep
-20
Oct
-20
No
v-2
0
Dec-
20
Jan
-21
Feb
-21
Mar-
21
Ap
r-21
May-2
1
Jun
-21
Jul-
21
Au
g-2
1
Po
rcen
tag
e (
%)
Men Women
I N F O R M A C I Ó N P A R A T O D O S
Determinants of housework and labor activities overload
Source: DANE – Social Pulse Survey
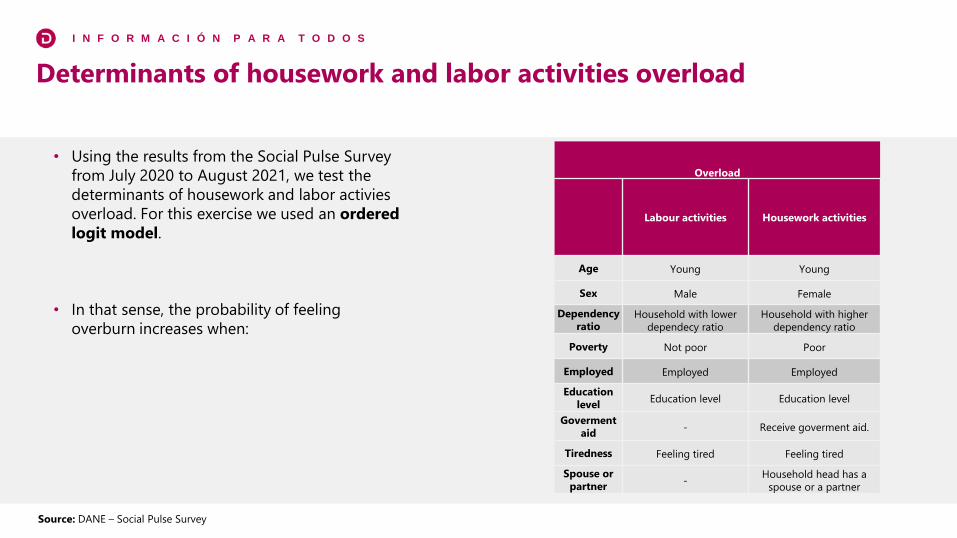
• Using the results from the Social Pulse Survey
from July 2020 to August 2021, we test the
determinants of housework and labor activies
overload. For this exercise we used an ordered
logit model.
• In that sense, the probability of feeling
overburn increases when:
Overload
Labour activities Housework activities
Age Young Young
Sex Male Female
Dependency
ratioHousehold with lower
dependecy ratio
Household with higher
dependency ratio
Poverty Not poor Poor
Employed Employed Employed
Education
levelEducation level Education level
Goverment
aid- Receive goverment aid.
Tiredness Feeling tired Feeling tired
Spouse or
partner-
Household head has a
spouse or a partner

Work-Life Balance:
Determinants of housework
and labour activities
overload.
November, 2021