does housework lower wages? evidence for britain housework lower wages? evidence for britain ......
TRANSCRIPT
Does housework lower wages? Evidence forBritain
By Mark L Bryan* and Almudena Sevilla-Sanzy
*Institute for Social and Economic Research (ISER), University of Essex,
Colchester CO4 3SQ; e-mail: [email protected]
yDepartment of Economics, University of Oxford, Oxford OX1 3UQ;
e-mail: [email protected]
This paper uses the British Household Panel Survey to present the first estimates of the
housework-wage relationship in Britain. Controlling for permanent unobserved het-
erogeneity, we find that housework has a negative impact on the wages of men and
women, both married and single, who work full-time. Among women working part-
time, only single women suffer a housework penalty. The housework penalty is uni-
form across occupations within full-time jobs but some part-time jobs appear to be
more compatible with housework than others. We find tentative evidence that the
housework penalty is larger when there are children present.
JEL classifications: J12, J16, J31.
1. IntroductionThere is a growing empirical literature that investigates housework as a factor
affecting wages in addition to conventional human capital and job characteristics
(for a recent survey see Maani and Cruickshank, 2009). This paper contributes to
this literature by documenting the effect of housework on wages for Britain, a
country that has never been analysed before in this context. Using panel data to
control for unobserved individual heterogeneity, we estimate the effect of house-
work on wages for single and married men and women. We find that housework
lowers the wages of both men and women, especially those who are full-time
workers, married, and have children.
Various theories have been put forward to explain why housework might affect
wages. Becker (1985) first described a model in which a fixed amount of energy or
effort has to be allocated amongst different activities. Housework activities are
tiring and so reduce the amount of effort available for market work, resulting in
lower productivity and wages. Bonke et al. (2005) presented a similar model but
! Oxford University Press 2010All rights reserved
Oxford Economic Papers 63 (2011), 187–210 187doi:10.1093/oep/gpq011
at Queen M
ary, University of L
ondon on February 12, 2014http://oep.oxfordjournals.org/
Dow
nloaded from
focussed on the timing and flexibility of housework. If housework has to be done at
times of the day that interfere with market work (for instance by limiting the ability
to stay for late meetings, for training courses, for travelling to and from work, or
networking after work), overall productivity will be lower. Other theories focus
more explicitly on labour market structure and job characteristics. Workers with
high housework burdens may select into jobs with convenient hours or lighter
working conditions, and these jobs may carry a negative compensating differential
(see for example Hersch, 1991b, and 2009), or pay less because monopsonistic
employers take account of workers’ preferences for these jobs (Sigle-Rushton and
Waldfogel, 2007).
In view of these different theories, we follow the traditional approach in the
literature and estimate standard wage equations augmented by measures of house-
work. Our analysis is based on panel data from the British Household Panel Survey
(1992–2004). The panel nature of the survey allows us to take into account in-
dividual permanent unobserved heterogeneity which may cause a spurious negative
correlation between housework and wages. For example, individuals with more
housework responsibilities may be less career oriented and thus earn lower wages
because either they put less effort into their work (the so-called ‘lack of interest’
argument; Hersch, 2009), or because they are discriminated against by their em-
ployer. We perform an analysis that allows for the role of job characteristics and
estimates separate effects by gender and marital status. This distinction is important
given the gendered nature of housework and the fact that marriage is characterized
by the presence of specialization and economies of scale that affect how much time
individuals spend doing housework and also what housework activities they engage
in (Gupta, 1999; Hersch and Stratton, 2002).1 Because work time and other time-
use arrangements are different between part-time and full-time workers, we also
look at these groups in a separate way.
After controlling for permanent unobserved heterogeneity and for the usual wage
determinants such as age and education, we find a negative housework effect on
wages for all groups considered, except for married women working part-time. The
wages of full-time workers decrease by about 0.25% per hour of weekly housework,
implying that an extra ten hours of housework per week would lower wages by
2.5%. We cannot reject that the effects are the same across marital status and
gender, and the impact appears to be linear in housework. Our findings confirm
the negative effects of housework on women’s wages generally found in US studies
(Coverman, 1983; Hersch, 1985; Shelton and Firestone, 1988; Hersch, 1991a,b;
Hersch and Stratton, 1994, 1997; Hundley, 2000, 2001; Noonan, 2001; Stratton,
2001; Hersch and Stratton, 2002; Shirley and Wallace, 2004; Keith and Malone,
..........................................................................................................................................................................1Some have attributed the positive relationship between marriage and men’s wages (Ribar, 2004) to
specialization within the household (see Bardasi and Taylor, 2008, for recent UK evidence), although
Hersch and Stratton (2000) find no support for this hypothesis using US data.
188 does housework lower wages?
at Queen M
ary, University of L
ondon on February 12, 2014http://oep.oxfordjournals.org/
Dow
nloaded from
2005; Hersch, 2009). A similar relationship has been found in Australia (McAllister,
1990), in Canada (Phipps et al., 2001), and in Denmark (Bonke et al., 2005). To our
knowledge there is only one previous study that has analysed housework and wages
by marital status, as we do (Hersch and Stratton, 2002). The authors also find a
negative effect for both married and single individuals working full-time, with
stronger effects among married women. In line with the small number of studies
that have examined part-time workers separately (e.g., McAllister, 1990), we find
the effect for married part-time workers is lower.
Consistent with previous literature (Hersch, 2009) we also find that the effect of
housework is constant within occupations for full-time workers, suggesting that the
negative effect of housework on wages cannot be explained by differing levels of
required effort or other work conditions that make housework difficult to combine
with certain jobs. We also fail to find differential effects for workers with flexible
work schedules. Occupation seems to play a role for single women working part
time, however, suggesting that these women may end up in jobs with less conveni-
ent schedules. The negative housework-wage relation appears whether or not there
are children in the household, although we do find some evidence that housework
has a larger effect on the wages of married women with children, so having children
seems to worsen the trade-off between housework and market work for this group
of women.
The paper is organized as follows: Section 2 describes the empirical strategy,
Section 3 describes the BHPS, Section 4 shows that housework has a negative
effect on wages for most groups, and especially for married women working full
time. Section 5 presents some robustness checks and Section 6 concludes.
2. Empirical strategy2.1 General specification: housework and wages
Following the standard approach in the literature, our analysis is based on the
following wage equation augmented by measures of housework:
wit¼xit0�þ�0ptitþ�1hitþ�2ptit�hitþ�iþ"it ð1Þ
where wit is the log of the real gross hourly wage of individual i measured at time t,
xit is a vector of characteristics assumed to affect wages, ptit is an indicator variable
for part-time work (30 hours or less per week), and hit is the number of hours of
housework per week. The error term consists of an individual effect �i representing
unmeasured characteristics that do not vary over time and a transitory component
"it. The parameters of interest are �1, which is the marginal effect of housework on
wages for full-time workers holding constant other relevant characteristics; and �2,
the additional effect for part-timers. Because part and full-time workers have very
different time allocations we include the part-time interaction to allow for different
mechanisms in the housework-wage relationship.
To allow for permanent unobserved heterogeneity, we present results from fixed
effects (FE) models. Controlling for permanent unobserved heterogeneity is
m. bryan and a. sevilla-sanz 189
at Queen M
ary, University of L
ondon on February 12, 2014http://oep.oxfordjournals.org/
Dow
nloaded from
important in this context because the permanent error in eq. (1) is likely to be
correlated with housework, resulting in biased coefficients if OLS is used. For
example, more career-oriented individuals are likely to earn more (have a high
individual effect �i in the wage equation) and also do less housework. In this case,
�i will be negatively correlated with housework, and the OLS estimate of �1 will be
negatively biased.
We perform the analysis by gender and marital status throughout.2 This distinc-
tion is important given the gendered nature of housework and the fact that mar-
riage is associated with specialization in housework tasks (Gupta, 1999; Hersch and
Stratton, 2002). We define married as being married or cohabiting in the current
period, thus individuals switch between the married and single samples when they
change status (about 20% change status at some point in the panel).
The controls in eq. (1) include human capital variables (educational qualifica-
tions and quadratics in age and job tenure), the number of children in the house-
hold, job characteristics such as trade union coverage and temporary contract
status, and firm characteristics such as establishment size and industry.
3. Data and sampleWe use data from the BHPS, which has followed a nationally representative sample
of about 5,500 private households (containing about 10,000 individuals) since
1991. The survey aims to interview all adults (over 16 years old) from the original
sample every year, as well as all other adult members of their current households
(including newly formed households). Children in sample households become full
sample members when they reach age 16. The BHPS contains rich information
on household structure, socio-demographic characteristics, individuals’ labour
market experience and job characteristics. Since wave 2 it has asked respondents
how long on average they spend on housework per week. Our sample comprises
waves 2–14, corresponding to 1992 to 2004, and we restrict estimation to employ-
ees of working age (16–59 years for women and 16–64 years for men) who
completed the full interview and gave valid information on all variables of interest.
Our final sample contains 4533 men (observed over 5.8 waves on average) and
4592 women (5.7 waves).
As well as using age to proxy labour market experience, we also experiment with
a measure of actual experience (total time spent in employment, including self-
employment) based on the retrospective BHPS data (see Mare, 2006). Using actual
experience allows us to control for the effects of past career interruptions, but
unfortunately we lose observations for about 30% of the sample who do not give
full information about their employment histories (irrespective of whether their
true work histories are continuous or not). In the main regressions we use age as a
control but test the robustness of the results to using actual experience.
..........................................................................................................................................................................2Chow tests reject equal coefficients across marital status in all the specifications estimated.
190 does housework lower wages?
at Queen M
ary, University of L
ondon on February 12, 2014http://oep.oxfordjournals.org/
Dow
nloaded from
In particular, we estimate the equation using the main sample and an indicator for
missing values of experience. Results do not vary greatly between the two
specifications.
The housework variable is the response to the question ‘About how many hours
do you spend on housework in an average week, such as time spent cooking,
cleaning, and doing the laundry?’ The hourly wage is derived from respondents’
usual gross pay per month and their usual weekly working hours, and is indexed to
2004 prices.3 Part-time status is constructed from the total number of usual weekly
hours reported by workers, and defined as 30 hours or less. We also restrict the
sample to those working more than five hours per week to alleviate problems of
extreme measurement error.
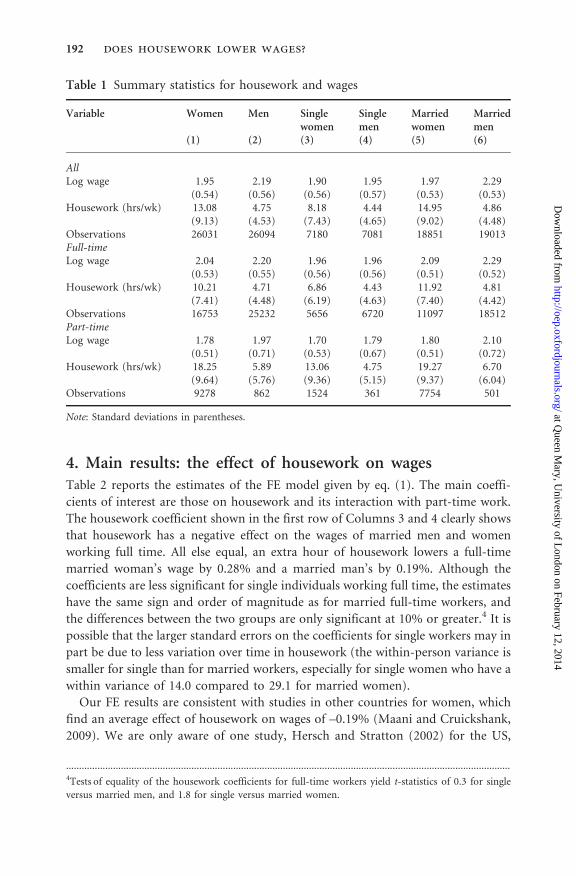
Table 1 presents summary statistics for housework and hourly wages for full- and
part-time workers, broken down by gender and marital status. The means of the
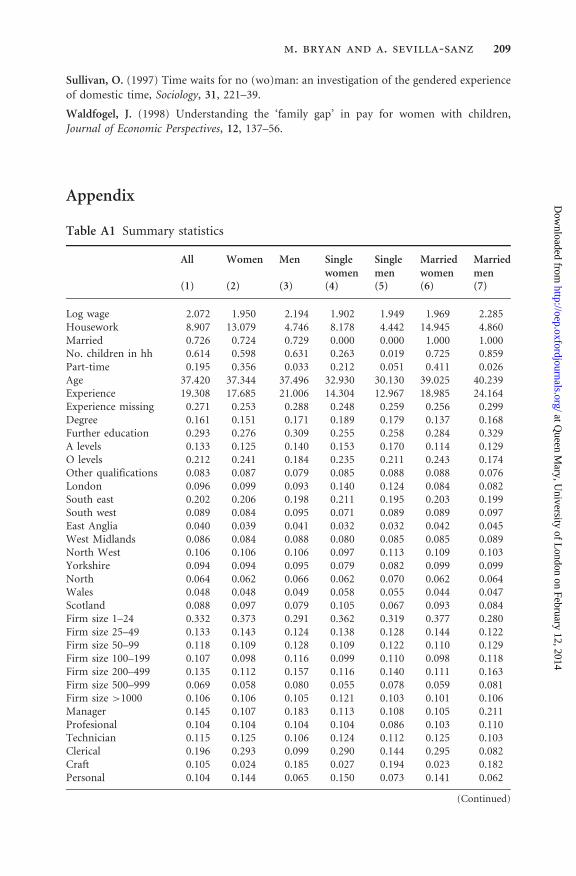
remaining variables used in the analysis are reported in Appendix Table A1.
Columns 1 and 2 in Table 1 show that there are considerable differences between
men and women. Women undertake about 13 hours of housework per week
compared to under five hours for men. The high level of housework among
women is partly driven by the large amounts done by part-timers (18 hours per
week), but even full-time working women put in ten hours per week of housework.
The gap between men and women’s housework is even larger among couples: full-
time married women do nearly 12 hours a week and part-time married women do
over 19 hours, compared to only five hours for (full-time) married men (columns
5–6). While part-time married men do a little more housework (6.7 hours), part-
time work is very uncommon among men (only 3.3% of the sample). There is
hardly any increase in men’s housework associated with marriage, while women’s
housework almost doubles (from eight to 15 hours). Overall, the figures in Table 1
underline the high share of housework done by women and the large increases in
female housework associated with marriage, consistent with other studies such as
Gupta (1999) and Hersch and Stratton (2002).
Table 1 also shows that the overall gender wage gap is about 25% (columns 1
and 2), falling to about 16% for full-timers. The gap is nearly 38% (0.32 log points)
among married workers (columns 5 and 6), mirroring the large difference in
housework between married men and women. In general, Table 1 shows that
those earning lower wages do more housework. While these raw figures are sug-
gestive of a negative relationship between housework and wages, we now turn to a
multivariate analysis in order to control for the other determinants of wages, in-
cluding permanent unobserved heterogeneity.
..........................................................................................................................................................................3The wage is calculated as hourly wage = (usual gross pay per month)/[(usual standard weekly
hours) + 1.5*(usual paid overtime weekly hours)] *(12/52). This assumes that paid overtime is paid
at time and a half (the results are robust to other premia, e.g. assuming that all hours are paid at the
same rate). Unpaid overtime is not included. Wages are indexed to 2004 levels using the CHAWRPI
non-seasonally adjusted retail price index from the Office for National Statistics.
m. bryan and a. sevilla-sanz 191
at Queen M
ary, University of L
ondon on February 12, 2014http://oep.oxfordjournals.org/
Dow
nloaded from
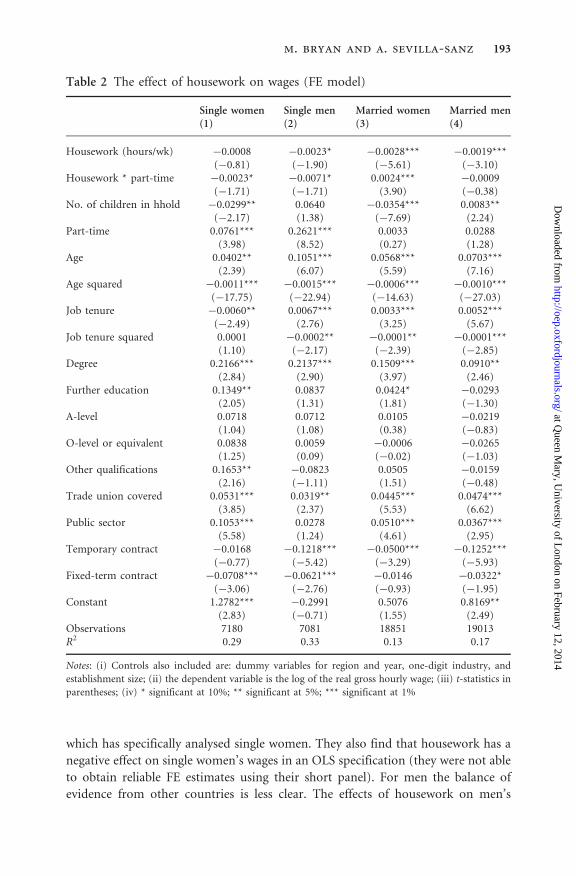
4. Main results: the effect of housework on wagesTable 2 reports the estimates of the FE model given by eq. (1). The main coeffi-
cients of interest are those on housework and its interaction with part-time work.
The housework coefficient shown in the first row of Columns 3 and 4 clearly shows
that housework has a negative effect on the wages of married men and women
working full time. All else equal, an extra hour of housework lowers a full-time
married woman’s wage by 0.28% and a married man’s by 0.19%. Although the
coefficients are less significant for single individuals working full time, the estimates
have the same sign and order of magnitude as for married full-time workers, and
the differences between the two groups are only significant at 10% or greater.4 It is
possible that the larger standard errors on the coefficients for single workers may in
part be due to less variation over time in housework (the within-person variance is
smaller for single than for married workers, especially for single women who have a
within variance of 14.0 compared to 29.1 for married women).
Our FE results are consistent with studies in other countries for women, which
find an average effect of housework on wages of –0.19% (Maani and Cruickshank,
2009). We are only aware of one study, Hersch and Stratton (2002) for the US,
Table 1 Summary statistics for housework and wages
Variable Women Men Single Single Married Marriedwomen men women men
(1) (2) (3) (4) (5) (6)
AllLog wage 1.95 2.19 1.90 1.95 1.97 2.29
(0.54) (0.56) (0.56) (0.57) (0.53) (0.53)Housework (hrs/wk) 13.08 4.75 8.18 4.44 14.95 4.86
(9.13) (4.53) (7.43) (4.65) (9.02) (4.48)Observations 26031 26094 7180 7081 18851 19013Full-timeLog wage 2.04 2.20 1.96 1.96 2.09 2.29
(0.53) (0.55) (0.56) (0.56) (0.51) (0.52)Housework (hrs/wk) 10.21 4.71 6.86 4.43 11.92 4.81
(7.41) (4.48) (6.19) (4.63) (7.40) (4.42)Observations 16753 25232 5656 6720 11097 18512Part-timeLog wage 1.78 1.97 1.70 1.79 1.80 2.10
(0.51) (0.71) (0.53) (0.67) (0.51) (0.72)Housework (hrs/wk) 18.25 5.89 13.06 4.75 19.27 6.70
(9.64) (5.76) (9.36) (5.15) (9.37) (6.04)Observations 9278 862 1524 361 7754 501
Note: Standard deviations in parentheses.
..........................................................................................................................................................................4Tests of equality of the housework coefficients for full-time workers yield t-statistics of 0.3 for single
versus married men, and 1.8 for single versus married women.
192 does housework lower wages?
at Queen M
ary, University of L
ondon on February 12, 2014http://oep.oxfordjournals.org/
Dow
nloaded from
which has specifically analysed single women. They also find that housework has a
negative effect on single women’s wages in an OLS specification (they were not able
to obtain reliable FE estimates using their short panel). For men the balance of
evidence from other countries is less clear. The effects of housework on men’s
Table 2 The effect of housework on wages (FE model)
Single women Single men Married women Married men(1) (2) (3) (4)
Housework (hours/wk) �0.0008 �0.0023* �0.0028*** �0.0019***(�0.81) (�1.90) (�5.61) (�3.10)
Housework * part-time �0.0023* �0.0071* 0.0024*** �0.0009(�1.71) (�1.71) (3.90) (�0.38)
No. of children in hhold �0.0299** 0.0640 �0.0354*** 0.0083**(�2.17) (1.38) (�7.69) (2.24)
Part-time 0.0761*** 0.2621*** 0.0033 0.0288(3.98) (8.52) (0.27) (1.28)
Age 0.0402** 0.1051*** 0.0568*** 0.0703***(2.39) (6.07) (5.59) (7.16)
Age squared �0.0011*** �0.0015*** �0.0006*** �0.0010***(�17.75) (�22.94) (�14.63) (�27.03)
Job tenure �0.0060** 0.0067*** 0.0033*** 0.0052***(�2.49) (2.76) (3.25) (5.67)
Job tenure squared 0.0001 �0.0002** �0.0001** �0.0001***(1.10) (�2.17) (�2.39) (�2.85)
Degree 0.2166*** 0.2137*** 0.1509*** 0.0910**(2.84) (2.90) (3.97) (2.46)
Further education 0.1349** 0.0837 0.0424* �0.0293(2.05) (1.31) (1.81) (�1.30)
A-level 0.0718 0.0712 0.0105 �0.0219(1.04) (1.08) (0.38) (�0.83)
O-level or equivalent 0.0838 0.0059 �0.0006 �0.0265(1.25) (0.09) (�0.02) (�1.03)
Other qualifications 0.1653** �0.0823 0.0505 �0.0159(2.16) (�1.11) (1.51) (�0.48)
Trade union covered 0.0531*** 0.0319** 0.0445*** 0.0474***(3.85) (2.37) (5.53) (6.62)
Public sector 0.1053*** 0.0278 0.0510*** 0.0367***(5.58) (1.24) (4.61) (2.95)
Temporary contract �0.0168 �0.1218*** �0.0500*** �0.1252***(�0.77) (�5.42) (�3.29) (�5.93)
Fixed-term contract �0.0708*** �0.0621*** �0.0146 �0.0322*(�3.06) (�2.76) (�0.93) (�1.95)
Constant 1.2782*** �0.2991 0.5076 0.8169**(2.83) (�0.71) (1.55) (2.49)
Observations 7180 7081 18851 19013R2 0.29 0.33 0.13 0.17
Notes: (i) Controls also included are: dummy variables for region and year, one-digit industry, and
establishment size; (ii) the dependent variable is the log of the real gross hourly wage; (iii) t-statistics in
parentheses; (iv) * significant at 10%; ** significant at 5%; *** significant at 1%
m. bryan and a. sevilla-sanz 193
at Queen M
ary, University of L
ondon on February 12, 2014http://oep.oxfordjournals.org/
Dow
nloaded from
wages is typically smaller than the effect on women’s wages (Maani and
Cruickshank, 2009), and for single men Hersch and Stratton (2002) find a mar-
ginally significant negative housework penalty using OLS. FE estimates of the
housework coefficient for men are usually found to be negative but insignificant
(Hersch and Stratton, 1997; Noonan, 2001). Our estimate for married men
(Table 2) is significant and smaller than the effect for married women, though
the two are not significantly different.
Returning to the main estimates, the second row of Table 2 shows the interaction
term between housework and part-time status. Columns 2 and 4 show an addition-
al negative effect of housework on the wages of men working part-time, although
the coefficients are not significant at 5% (possibly due to small cell sizes, since very
few men work part-time). For women working part-time, whereas there seems to
be no effect of housework on the wages of part-time married women, there is an
extra negative effect of housework among part-time single women. Column 3
shows that the interaction of housework and part-time status carries a positive
and highly significant coefficient for married women (+0.24%), which cancels
out the negative main effect (the total effect is –0.04%, t = 1.0).5 However the
interaction coefficient for single women presented in Column 1 shows a negative
effect of housework on wages that reinforces the main effect, so that the total effect
for single women working part-time is –0.31%, t = 2.7. The difference between the
interaction coefficients is indeed highly significant (t = 3.2).
Our results for married women working part-time are in line with the small
number of studies that have examined part-time workers separately (e.g.
McAllister, 1990). There are various possibilities for why the housework penalty
may be smaller in part-time jobs. One reason may be that part-time workers have
more time to rest and recuperate after doing the housework, even if they do more
housework overall. (Table 1 shows indeed that part-timers also do much more
housework: 19 hours per week for part-time married women compared to
12 hours for full-time married women.) Another possibility is that part time work-
ers may have some choice over their hours and can choose work schedules that do
not clash with their housework commitments, as suggested by McAllister (1990).
Neither hypothesis alone can however explain why there is a negative housework
effect in part-time jobs done by single women and not by married women.
The BHPS data do not contain any information on when housework is per-
formed (neither during the week, nor during the day), or the type of housework
activities. The data are, however, very rich in other contextual information that can
offer some indirect evidence in regards to the different magnitudes of the house-
work coefficient between single and married women working part-time. Table 3
lists selected characteristics of the jobs held by married and single part-time
..........................................................................................................................................................................5The insignificant overall effect for married women working part-time does not appear to arise from
insufficient variation over time in housework. The within-person variance in housework is 33.2 for part-
time married women, compared to 18.2 for full-time married women.
194 does housework lower wages?
at Queen M
ary, University of L
ondon on February 12, 2014http://oep.oxfordjournals.org/
Dow
nloaded from
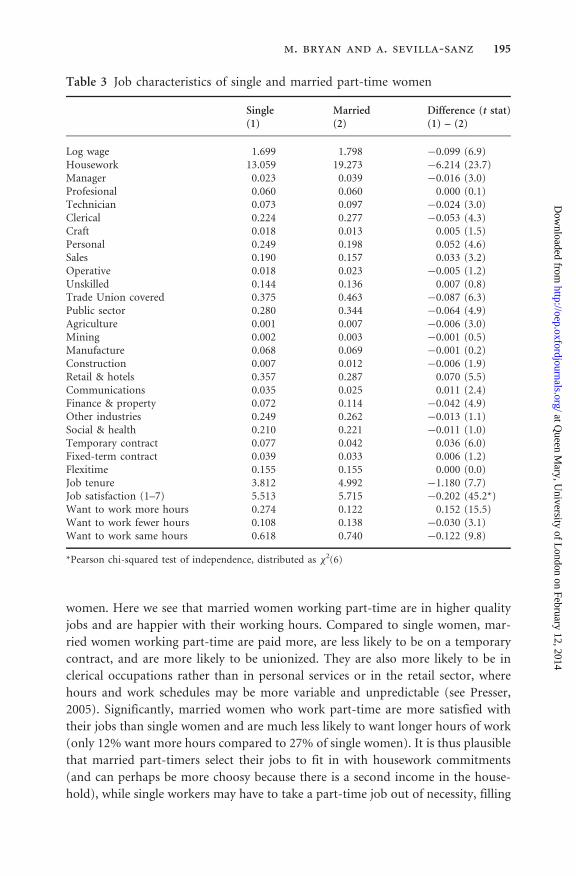
women. Here we see that married women working part-time are in higher quality
jobs and are happier with their working hours. Compared to single women, mar-
ried women working part-time are paid more, are less likely to be on a temporary
contract, and are more likely to be unionized. They are also more likely to be in
clerical occupations rather than in personal services or in the retail sector, where
hours and work schedules may be more variable and unpredictable (see Presser,
2005). Significantly, married women who work part-time are more satisfied with
their jobs than single women and are much less likely to want longer hours of work
(only 12% want more hours compared to 27% of single women). It is thus plausible
that married part-timers select their jobs to fit in with housework commitments
(and can perhaps be more choosy because there is a second income in the house-
hold), while single workers may have to take a part-time job out of necessity, filling
Table 3 Job characteristics of single and married part-time women
Single Married Difference (t stat)(1) (2) (1) – (2)
Log wage 1.699 1.798 �0.099 (6.9)Housework 13.059 19.273 �6.214 (23.7)Manager 0.023 0.039 �0.016 (3.0)Profesional 0.060 0.060 0.000 (0.1)Technician 0.073 0.097 �0.024 (3.0)Clerical 0.224 0.277 �0.053 (4.3)Craft 0.018 0.013 0.005 (1.5)Personal 0.249 0.198 0.052 (4.6)Sales 0.190 0.157 0.033 (3.2)Operative 0.018 0.023 �0.005 (1.2)Unskilled 0.144 0.136 0.007 (0.8)Trade Union covered 0.375 0.463 �0.087 (6.3)Public sector 0.280 0.344 �0.064 (4.9)Agriculture 0.001 0.007 �0.006 (3.0)Mining 0.002 0.003 �0.001 (0.5)Manufacture 0.068 0.069 �0.001 (0.2)Construction 0.007 0.012 �0.006 (1.9)Retail & hotels 0.357 0.287 0.070 (5.5)Communications 0.035 0.025 0.011 (2.4)Finance & property 0.072 0.114 �0.042 (4.9)Other industries 0.249 0.262 �0.013 (1.1)Social & health 0.210 0.221 �0.011 (1.0)Temporary contract 0.077 0.042 0.036 (6.0)Fixed-term contract 0.039 0.033 0.006 (1.2)Flexitime 0.155 0.155 0.000 (0.0)Job tenure 3.812 4.992 �1.180 (7.7)Job satisfaction (1–7) 5.513 5.715 �0.202 (45.2*)Want to work more hours 0.274 0.122 0.152 (15.5)Want to work fewer hours 0.108 0.138 �0.030 (3.1)Want to work same hours 0.618 0.740 �0.122 (9.8)
*Pearson chi-squared test of independence, distributed as �2(6)
m. bryan and a. sevilla-sanz 195
at Queen M
ary, University of L
ondon on February 12, 2014http://oep.oxfordjournals.org/
Dow
nloaded from
in undesirable hours that are less compatible with housework activities. We come
back to the association between work flexibility and housework below.
The coefficients on the control variables in Table 2 generally have the expected
signs. Wages follow an inverse-U shaped profile in age, there are positive returns to
education, a positive premium to union coverage and a wage penalty associated
with temporary work. Consistent with the family gap literature (see for example
Waldfogel, 1998), having children has a negative effect on a woman’s wage (either
single or married), and a positive effect on a man’s wage. However, the negative
effect of housework on wages still remains. Given that the association between
having children and getting married has weakened in recent years, we explore
the relationship between housework and wages according to parental status (in
addition to marital status) in more depth below.
The part-time coefficients are positive, suggesting there is a premium rather than
a penalty attached to part-time work. While a large body of work has found a part-
time penalty using cross-sectional methods, some studies have reported positive
coefficients on part-time work in longitudinal analysis (for example, see Manning
and Petrongolo, 2005). These authors note that a plausible explanation for the
opposite sign in FE estimates is measurement error in the hours variable. To
take an example, if a full-time worker just above the 30 hour threshold understates
her working time by even a small amount, she will be misclassified as a part-timer.
At the same time, her hourly wage will be overestimated (because reported hours
are in the denominator), resulting in an upward bias to the part-time coefficient.
FE results are particularly susceptible to this type of misclassification because the
part-time coefficient is identified from transitions between full-time and part-time
status, which are relatively infrequent (in our data, only 9% of women and 2% of
men change between full-time and part-time from year to year). Cross-sectional
methods should thus yield smaller (and probably negative) coefficients. We also
estimate a pooled (OLS) version of the model and results are in line with cross-
sectional studies. We find a significant part-time penalty for women, while the part-
time coefficient for men is insignificant6.
4.1 Non-linear effects of housework on wages
Given the large differences between the amounts of housework done by women
(especially married women) and men, some studies have tested for non-linear or
threshold effects in the housework-wage relation. Hersch and Stratton (1997) find
some evidence of a wage penalty for women once housework exceeds ten hours per
week, whereas the men’s penalty is similar across the range of housework hours.
Hersch (2009) also finds evidence of a threshold effect, and shows that the coeffi-
cient on housework becomes statistically significant for both men and women only
after one hour of housework per day. To investigate non-linear effects in the BHPS
..........................................................................................................................................................................6Estimates available from authors on request.
196 does housework lower wages?
at Queen M
ary, University of L
ondon on February 12, 2014http://oep.oxfordjournals.org/
Dow
nloaded from
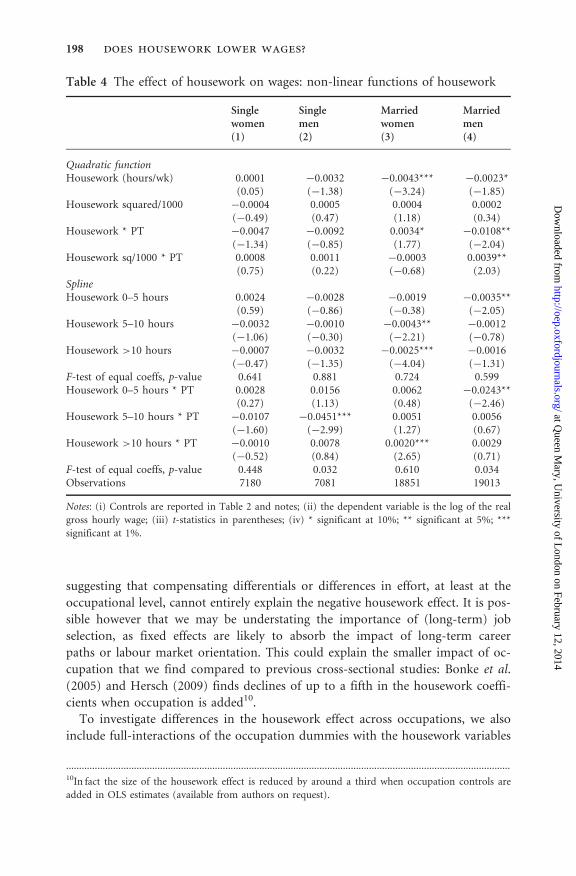
sample we experiment with a quadratic specification and with splines that allow the
coefficients to vary over different hours ranges. For full-time workers, the upper
panel of Table 4 shows that a squared term in housework is not statistically sig-
nificant. The lower panel presents the estimates using a spline with nodes at five
and ten hours (approximately the mean housework levels for men and women).
For full-time married women, the housework coefficients are only significant at
more than five hours per week, however we cannot reject equality of all the coeffi-
cients (p = 0.72). For married men, only the coefficient for housework of less than
five hours is significant, but again we cannot reject joint equality.7 Overall, we find
little evidence of threshold effects among full-time workers. Among the small mi-
nority of men working part-time, there is some evidence of convexity in the house-
work-wage relationship (the quadratic interaction term is positive and significant
for married men). There is also a suggestion that the smaller negative effect of
housework on the wages of part-time married women is concentrated above ten
hours per week (although we cannot reject joint equality of the spline coefficients).
But in general, housework seems to have a similar effect at all levels.
4.2 The role of occupation and flexibility
A possible mechanism for the negative effect on housework on wages reported in
Tables 2 and 3 is that workers may sort into jobs that fit in with housework because
they involve less effort or more convenient hours. Wages may be lower in these
housework-compatible jobs because lower effort reduces productivity, or because
convenient hours and amenable working conditions are costly to employers and
lead to negative compensating differentials (Hersch, 1991b, and 2009).8 The results
above already control for job characteristics such as firm size and industry, but in
this section we further investigate the mechanism by which housework might affect
wages by including additional characteristics (occupation and flexible working)
which should capture some variation in effort requirements and working condi-
tions. Following Hersch (2009), we also investigate the housework effect within
occupations (and flexible versus non-flexible jobs), to see whether systematic dif-
ferences across job types can provide some evidence for whether effort require-
ments or the amount of job flexibility may partly explain the negative housework-
wage relation.
The top panel of Table 5 shows the estimates when one-digit occupation dum-
mies are added to the regressions.9 Compared to our main results in Table 2,
inclusion of occupation makes little difference to the housework coefficients,
..........................................................................................................................................................................7It is likely that the greater statistical significance of the coefficients at high housework levels for women
and low levels for men can be explained by greater variation in these housework ranges, rather than true
differences in coefficients.8The evidence seems to suggest however that more work flexibility is associated with higher, not lower
wages (Gariety and Shaffer, 2001).9The occupations are the nine major groups of the UK Standard Occupational Classification.
m. bryan and a. sevilla-sanz 197
at Queen M
ary, University of L
ondon on February 12, 2014http://oep.oxfordjournals.org/
Dow
nloaded from
suggesting that compensating differentials or differences in effort, at least at the
occupational level, cannot entirely explain the negative housework effect. It is pos-
sible however that we may be understating the importance of (long-term) job
selection, as fixed effects are likely to absorb the impact of long-term career
paths or labour market orientation. This could explain the smaller impact of oc-
cupation that we find compared to previous cross-sectional studies: Bonke et al.
(2005) and Hersch (2009) finds declines of up to a fifth in the housework coeffi-
cients when occupation is added10.
To investigate differences in the housework effect across occupations, we also
include full-interactions of the occupation dummies with the housework variables
Table 4 The effect of housework on wages: non-linear functions of housework
Single Single Married Marriedwomen men women men(1) (2) (3) (4)
Quadratic functionHousework (hours/wk) 0.0001 �0.0032 �0.0043*** �0.0023*
(0.05) (�1.38) (�3.24) (�1.85)Housework squared/1000 �0.0004 0.0005 0.0004 0.0002
(�0.49) (0.47) (1.18) (0.34)Housework * PT �0.0047 �0.0092 0.0034* �0.0108**
(�1.34) (�0.85) (1.77) (�2.04)Housework sq/1000 * PT 0.0008 0.0011 �0.0003 0.0039**
(0.75) (0.22) (�0.68) (2.03)SplineHousework 0–5 hours 0.0024 �0.0028 �0.0019 �0.0035**
(0.59) (�0.86) (�0.38) (�2.05)Housework 5–10 hours �0.0032 �0.0010 �0.0043** �0.0012
(�1.06) (�0.30) (�2.21) (�0.78)Housework >10 hours �0.0007 �0.0032 �0.0025*** �0.0016
(�0.47) (�1.35) (�4.04) (�1.31)F-test of equal coeffs, p-value 0.641 0.881 0.724 0.599Housework 0–5 hours * PT 0.0028 0.0156 0.0062 �0.0243**
(0.27) (1.13) (0.48) (�2.46)Housework 5–10 hours * PT �0.0107 �0.0451*** 0.0051 0.0056
(�1.60) (�2.99) (1.27) (0.67)Housework >10 hours * PT �0.0010 0.0078 0.0020*** 0.0029
(�0.52) (0.84) (2.65) (0.71)F-test of equal coeffs, p-value 0.448 0.032 0.610 0.034Observations 7180 7081 18851 19013
Notes: (i) Controls are reported in Table 2 and notes; (ii) the dependent variable is the log of the real
gross hourly wage; (iii) t-statistics in parentheses; (iv) * significant at 10%; ** significant at 5%; ***
significant at 1%.
..........................................................................................................................................................................10In fact the size of the housework effect is reduced by around a third when occupation controls are
added in OLS estimates (available from authors on request).
198 does housework lower wages?
at Queen M
ary, University of L
ondon on February 12, 2014http://oep.oxfordjournals.org/
Dow
nloaded from
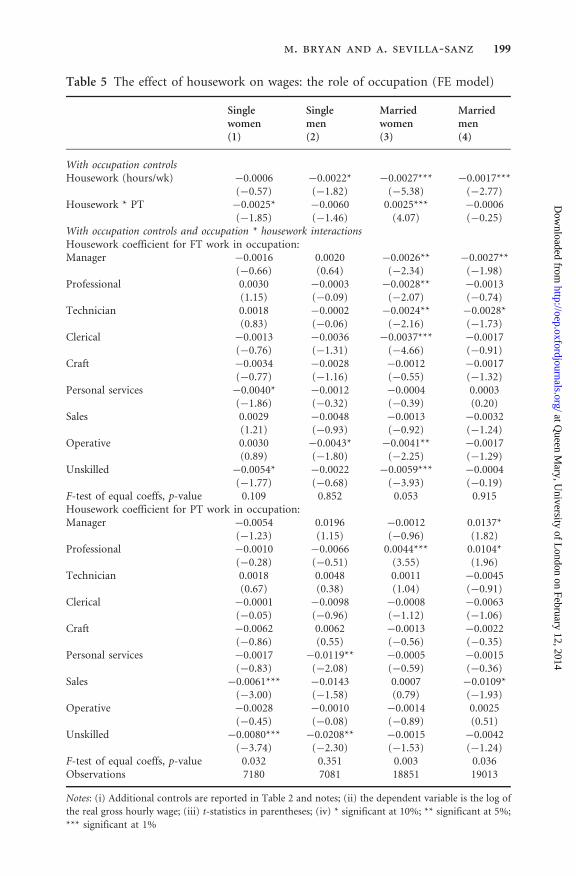
Table 5 The effect of housework on wages: the role of occupation (FE model)
Single Single Married Marriedwomen men women men(1) (2) (3) (4)
With occupation controlsHousework (hours/wk) �0.0006 �0.0022* �0.0027*** �0.0017***
(�0.57) (�1.82) (�5.38) (�2.77)Housework * PT �0.0025* �0.0060 0.0025*** �0.0006
(�1.85) (�1.46) (4.07) (�0.25)With occupation controls and occupation * housework interactionsHousework coefficient for FT work in occupation:Manager �0.0016 0.0020 �0.0026** �0.0027**
(�0.66) (0.64) (�2.34) (�1.98)Professional 0.0030 �0.0003 �0.0028** �0.0013
(1.15) (�0.09) (�2.07) (�0.74)Technician 0.0018 �0.0002 �0.0024** �0.0028*
(0.83) (�0.06) (�2.16) (�1.73)Clerical �0.0013 �0.0036 �0.0037*** �0.0017
(�0.76) (�1.31) (�4.66) (�0.91)Craft �0.0034 �0.0028 �0.0012 �0.0017
(�0.77) (�1.16) (�0.55) (�1.32)Personal services �0.0040* �0.0012 �0.0004 0.0003
(�1.86) (�0.32) (�0.39) (0.20)Sales 0.0029 �0.0048 �0.0013 �0.0032
(1.21) (�0.93) (�0.92) (�1.24)Operative 0.0030 �0.0043* �0.0041** �0.0017
(0.89) (�1.80) (�2.25) (�1.29)Unskilled �0.0054* �0.0022 �0.0059*** �0.0004
(�1.77) (�0.68) (�3.93) (�0.19)F-test of equal coeffs, p-value 0.109 0.852 0.053 0.915Housework coefficient for PT work in occupation:Manager �0.0054 0.0196 �0.0012 0.0137*
(�1.23) (1.15) (�0.96) (1.82)Professional �0.0010 �0.0066 0.0044*** 0.0104*
(�0.28) (�0.51) (3.55) (1.96)Technician 0.0018 0.0048 0.0011 �0.0045
(0.67) (0.38) (1.04) (�0.91)Clerical �0.0001 �0.0098 �0.0008 �0.0063
(�0.05) (�0.96) (�1.12) (�1.06)Craft �0.0062 0.0062 �0.0013 �0.0022
(�0.86) (0.55) (�0.56) (�0.35)Personal services �0.0017 �0.0119** �0.0005 �0.0015
(�0.83) (�2.08) (�0.59) (�0.36)Sales �0.0061*** �0.0143 0.0007 �0.0109*
(�3.00) (�1.58) (0.79) (�1.93)Operative �0.0028 �0.0010 �0.0014 0.0025
(�0.45) (�0.08) (�0.89) (0.51)Unskilled �0.0080*** �0.0208** �0.0015 �0.0042
(�3.74) (�2.30) (�1.53) (�1.24)F-test of equal coeffs, p-value 0.032 0.351 0.003 0.036Observations 7180 7081 18851 19013
Notes: (i) Additional controls are reported in Table 2 and notes; (ii) the dependent variable is the log of
the real gross hourly wage; (iii) t-statistics in parentheses; (iv) * significant at 10%; ** significant at 5%;
*** significant at 1%
m. bryan and a. sevilla-sanz 199
at Queen M
ary, University of L
ondon on February 12, 2014http://oep.oxfordjournals.org/
Dow
nloaded from
(as well as including occupation main effects as above). The lower panel of Table 5
reports the coefficients on the interactions. For clarity the equations were para-
meterized so that the coefficients refer directly to full and part-time workers in the
different occupations (i.e. there is no need to add the part-time interaction). Several
coefficients are individually significant, but tests show that they are not statistically
different across occupations for full-time workers (although the test for married
women only just fails to achieve significance at 5%). Thus like Hersch (2009), we
find that the negative housework effect appears to span occupations with very
different working conditions and job requirements, which is neither consistent
with the effort hypothesis nor with the compensating differential hypothesis. For
instance, married (full-time) women incur a housework penalty in both non-
manual occupations (ranging from clerical work to management) and manual
occupations (operatives and unskilled workers).
Whereas housework seems to have a uniform effect on full-time wages across
occupations, part-time work appears to be more compatible with housework in
some occupations than others. Focussing on women, we reject joint equality across
occupations and we see that for single women there is a strong negative effect of
housework on the wages of part-timers in sales and unskilled jobs, which cover a
third of all single part-time women (Table 3). As seen above single part-timers are
more likely to be in sales than married part-timers, and so our estimates are con-
sistent with the idea that these part-time jobs may involve inconvenient hours that
married workers manage to avoid. For married women working part-time, the only
individually significant coefficient is for professional workers and indicates that
housework raises wages. However, only 6% of married part-time women are pro-
fessionals, and there is no evidence of a housework penalty at all in the other
occupations.
Some workers have flexitime arrangements under which they can adjust their
daily start and finish times provided that they work a set number of hours per week
(or month). Flexible jobs may be more compatible with housework, especially if key
housework activities need to be done at the margins of the working day and may
otherwise interfere with market work. As before, we first see whether the housework
effect can be explained by a compensating differential for flexible work by including
flexitime as a control in the regressions, and then investigate any differential house-
work effect within flexible jobs. We use a measure of flexitime which has been
collected in the BHPS since wave 9 (thus we estimate using the sample from wave 9
only).11 The top panel of Table 6 shows that there is still a negative association
between housework and wages after controlling for flexitime (although the esti-
mates are less significant than previously, and the part-time interaction is not
significant, probably because of the smaller sample size). The flexitime coefficient
is not significant, providing no support for a compensating differential explanation.
..........................................................................................................................................................................11Omitting the flextime control, but estimating on the reduced sample, also yields the same pattern of
housework coefficients as in the full sample (available from authors on request).
200 does housework lower wages?
at Queen M
ary, University of L
ondon on February 12, 2014http://oep.oxfordjournals.org/
Dow
nloaded from
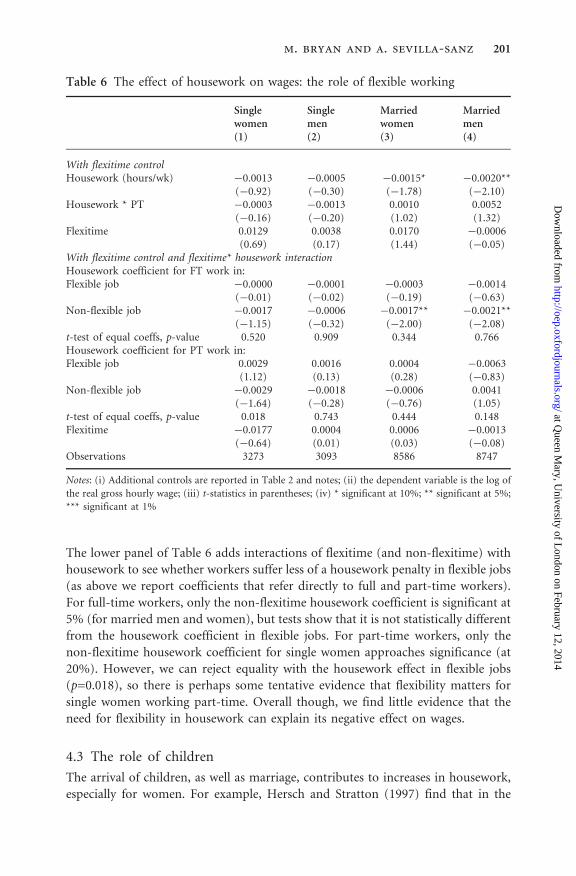
The lower panel of Table 6 adds interactions of flexitime (and non-flexitime) with
housework to see whether workers suffer less of a housework penalty in flexible jobs
(as above we report coefficients that refer directly to full and part-time workers).
For full-time workers, only the non-flexitime housework coefficient is significant at
5% (for married men and women), but tests show that it is not statistically different
from the housework coefficient in flexible jobs. For part-time workers, only the
non-flexitime housework coefficient for single women approaches significance (at
20%). However, we can reject equality with the housework effect in flexible jobs
(p=0.018), so there is perhaps some tentative evidence that flexibility matters for
single women working part-time. Overall though, we find little evidence that the
need for flexibility in housework can explain its negative effect on wages.
4.3 The role of children
The arrival of children, as well as marriage, contributes to increases in housework,
especially for women. For example, Hersch and Stratton (1997) find that in the
Table 6 The effect of housework on wages: the role of flexible working
Single Single Married Marriedwomen men women men(1) (2) (3) (4)
With flexitime controlHousework (hours/wk) �0.0013 �0.0005 �0.0015* �0.0020**
(�0.92) (�0.30) (�1.78) (�2.10)Housework * PT �0.0003 �0.0013 0.0010 0.0052
(�0.16) (�0.20) (1.02) (1.32)Flexitime 0.0129 0.0038 0.0170 �0.0006
(0.69) (0.17) (1.44) (�0.05)With flexitime control and flexitime* housework interactionHousework coefficient for FT work in:Flexible job �0.0000 �0.0001 �0.0003 �0.0014
(�0.01) (�0.02) (�0.19) (�0.63)Non-flexible job �0.0017 �0.0006 �0.0017** �0.0021**
(�1.15) (�0.32) (�2.00) (�2.08)t-test of equal coeffs, p-value 0.520 0.909 0.344 0.766Housework coefficient for PT work in:Flexible job 0.0029 0.0016 0.0004 �0.0063
(1.12) (0.13) (0.28) (�0.83)Non-flexible job �0.0029 �0.0018 �0.0006 0.0041
(�1.64) (�0.28) (�0.76) (1.05)t-test of equal coeffs, p-value 0.018 0.743 0.444 0.148Flexitime �0.0177 0.0004 0.0006 �0.0013
(�0.64) (0.01) (0.03) (�0.08)Observations 3273 3093 8586 8747
Notes: (i) Additional controls are reported in Table 2 and notes; (ii) the dependent variable is the log of
the real gross hourly wage; (iii) t-statistics in parentheses; (iv) * significant at 10%; ** significant at 5%;
*** significant at 1%
m. bryan and a. sevilla-sanz 201
at Queen M
ary, University of L
ondon on February 12, 2014http://oep.oxfordjournals.org/
Dow
nloaded from
United States the presence of children adds about five hours more of routine
housework for women. More recently Craig and Bittman (2008) analyse time-use
diaries for Australian men and women and find a positive relationship between
housework and the number and ages of children in the household, with women
disproportionably sharing the bulk of unpaid work (both housework and childcare)
following the birth of the first child. Looking at our sample, we find that women
with children devote about 17 hours to housework, six hours more than women
with no children who do about 11 hours per week. Consistent with Bittman and
Craig’s finding, the housework difference between men with and without children
is smaller. Men with children do about five hours of housework per week, about
half an hour of housework more per week than men without children.
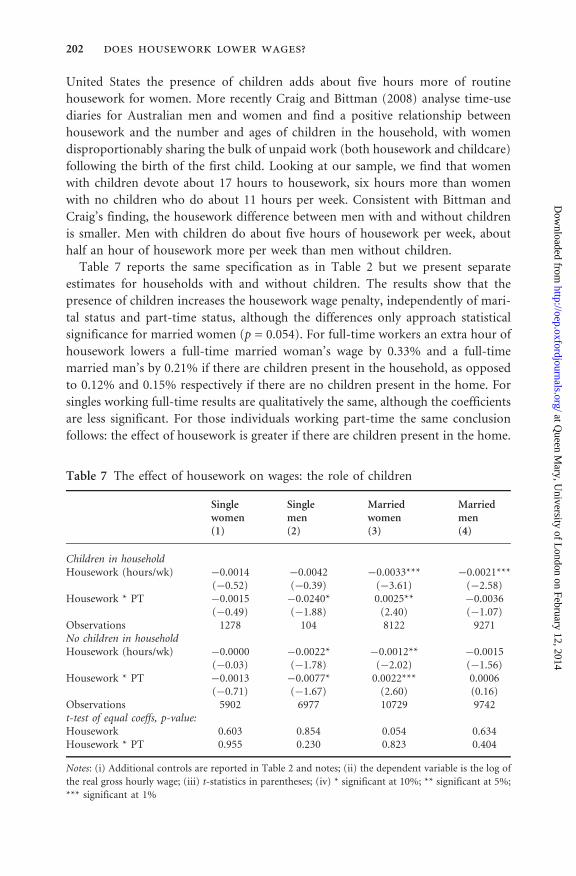
Table 7 reports the same specification as in Table 2 but we present separate
estimates for households with and without children. The results show that the
presence of children increases the housework wage penalty, independently of mari-
tal status and part-time status, although the differences only approach statistical
significance for married women (p = 0.054). For full-time workers an extra hour of
housework lowers a full-time married woman’s wage by 0.33% and a full-time
married man’s by 0.21% if there are children present in the household, as opposed
to 0.12% and 0.15% respectively if there are no children present in the home. For
singles working full-time results are qualitatively the same, although the coefficients
are less significant. For those individuals working part-time the same conclusion
follows: the effect of housework is greater if there are children present in the home.
Table 7 The effect of housework on wages: the role of children
Single Single Married Marriedwomen men women men(1) (2) (3) (4)
Children in householdHousework (hours/wk) �0.0014 �0.0042 �0.0033*** �0.0021***
(�0.52) (�0.39) (�3.61) (�2.58)Housework * PT �0.0015 �0.0240* 0.0025** �0.0036
(�0.49) (�1.88) (2.40) (�1.07)Observations 1278 104 8122 9271No children in householdHousework (hours/wk) �0.0000 �0.0022* �0.0012** �0.0015
(�0.03) (�1.78) (�2.02) (�1.56)Housework * PT �0.0013 �0.0077* 0.0022*** 0.0006
(�0.71) (�1.67) (2.60) (0.16)Observations 5902 6977 10729 9742t-test of equal coeffs, p-value:Housework 0.603 0.854 0.054 0.634Housework * PT 0.955 0.230 0.823 0.404
Notes: (i) Additional controls are reported in Table 2 and notes; (ii) the dependent variable is the log of
the real gross hourly wage; (iii) t-statistics in parentheses; (iv) * significant at 10%; ** significant at 5%;
*** significant at 1%
202 does housework lower wages?
at Queen M
ary, University of L
ondon on February 12, 2014http://oep.oxfordjournals.org/
Dow
nloaded from
These results are in line with those found in Keith and Malone (2005), who use
the PSID to show that housework has a negative effect for childbearing-age married
women. In turn, the findings seem to suggest that the housework effect is stronger
when combined with childcare, at least for married women working full time. Two
related articles, Sullivan (1997) and Bittman and Wajcman (2000), document that
women in employment with children are more likely to be engaged in more intense
domestic work, doing several housework activities at a time (such as childcare
accompanied by cooking and cleaning tasks). They also have more interrupted
leisure than men, and childcare and housework tasks such as cleaning, cooking,
and mending clothes are much more likely to interrupt leisure time for this group
of women.
Our results may thus reflect that housework is more tiring if it adds to or is done
simultaneously with an already large burden of childcare. It could also be that there
is a greater effort associated with those housework tasks that are complementary to
childcare (such as cleaning and cooking), especially if it is not followed by uninter-
rupted periods of leisure. Both may result in less effort for other activities such as
paid work. It is also possible that childcare responsibilities, which cannot be post-
poned until more convenient times, may impose timing constraints on when
housework can be done, affecting job availability and wages.
5. Further discussion and robustness checks5.1 Addressing simultaneity and measurement error issues
While the FE model controls for permanent unobserved heterogeneity, it does not
allow for any correlation between housework and the transitory error, "it. Such a
correlation could arise if housework and wages are determined simultaneously (for
example if individuals whose wages increase substitute own housework for market
services), or if housework is measured with error.12 This endogeneity can in prin-
ciple be dealt with using instrumental variables (IV) methods. Of the few studies
that have applied IV methods, Hersch and Stratton (1997, 2002) conclude that
housework is exogenous and therefore IV estimation is not necessary. Furthermore
it is difficult to find valid instruments (affecting housework but not wages) in
typical survey data (Noonan, 2001). Nevertheless we experiment with fixed effect
IV methods, using a set of spousal and household characteristics (spouse’s labour
market participation, hours of work, occupation and wage, and the total number of
employed household members). The identifying assumption is that changes in the
..........................................................................................................................................................................12Hersch and Stratton (1997) suggest that a significant part of the observed variation in housework over
time for men represents measurement error. Assuming that g is negative (and that other variables are
measured correctly), measurement error will induce a positive correlation between "it and measured
housework and thus result in a positive bias.
m. bryan and a. sevilla-sanz 203
at Queen M
ary, University of L
ondon on February 12, 2014http://oep.oxfordjournals.org/
Dow
nloaded from
labour market behaviour of the spouse and other household members affect an
individual’s own housework but are unrelated to any shock to their own wages. The
estimates are necessarily restricted to the married samples.
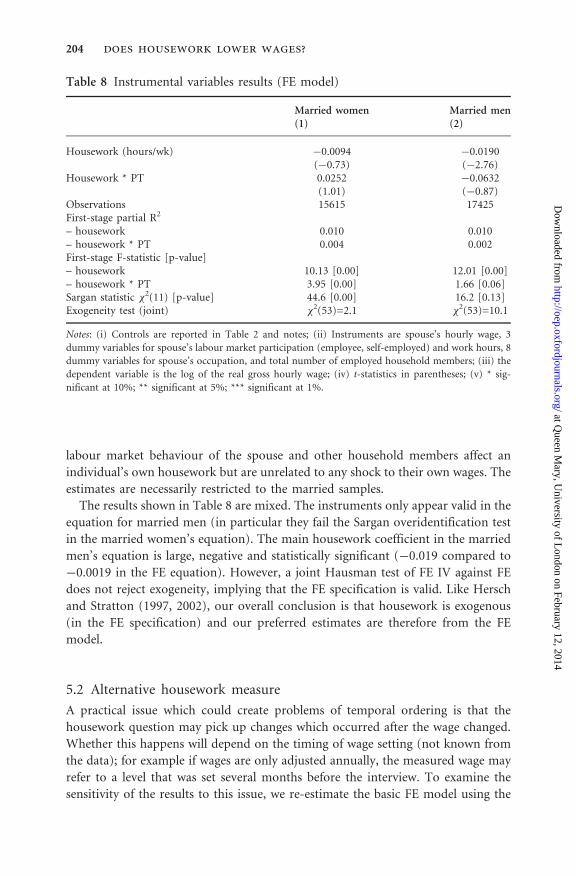
The results shown in Table 8 are mixed. The instruments only appear valid in the
equation for married men (in particular they fail the Sargan overidentification test
in the married women’s equation). The main housework coefficient in the married
men’s equation is large, negative and statistically significant (�0.019 compared to
�0.0019 in the FE equation). However, a joint Hausman test of FE IV against FE
does not reject exogeneity, implying that the FE specification is valid. Like Hersch
and Stratton (1997, 2002), our overall conclusion is that housework is exogenous
(in the FE specification) and our preferred estimates are therefore from the FE
model.
5.2 Alternative housework measure
A practical issue which could create problems of temporal ordering is that the
housework question may pick up changes which occurred after the wage changed.
Whether this happens will depend on the timing of wage setting (not known from
the data); for example if wages are only adjusted annually, the measured wage may
refer to a level that was set several months before the interview. To examine the
sensitivity of the results to this issue, we re-estimate the basic FE model using the
Table 8 Instrumental variables results (FE model)
Married women Married men(1) (2)
Housework (hours/wk) �0.0094 �0.0190(�0.73) (�2.76)
Housework * PT 0.0252 �0.0632(1.01) (�0.87)
Observations 15615 17425First-stage partial R2
– housework 0.010 0.010– housework * PT 0.004 0.002First-stage F-statistic [p-value]– housework 10.13 [0.00] 12.01 [0.00]– housework * PT 3.95 [0.00] 1.66 [0.06]Sargan statistic �2(11) [p-value] 44.6 [0.00] 16.2 [0.13]Exogeneity test (joint) �2(53)=2.1 �2(53)=10.1
Notes: (i) Controls are reported in Table 2 and notes; (ii) Instruments are spouse’s hourly wage, 3
dummy variables for spouse’s labour market participation (employee, self-employed) and work hours, 8
dummy variables for spouse’s occupation, and total number of employed household members; (iii) the
dependent variable is the log of the real gross hourly wage; (iv) t-statistics in parentheses; (v) * sig-
nificant at 10%; ** significant at 5%; *** significant at 1%.
204 does housework lower wages?
at Queen M
ary, University of L
ondon on February 12, 2014http://oep.oxfordjournals.org/
Dow
nloaded from
first lag of housework. If pay setting is at least annual then, by this measure,
housework always changes before the wage is adjusted13.
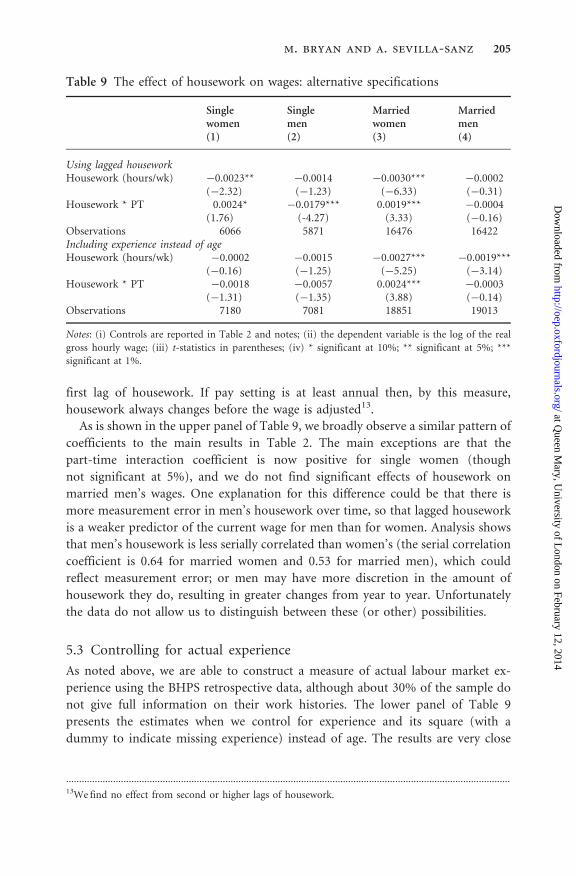
As is shown in the upper panel of Table 9, we broadly observe a similar pattern of
coefficients to the main results in Table 2. The main exceptions are that the
part-time interaction coefficient is now positive for single women (though
not significant at 5%), and we do not find significant effects of housework on
married men’s wages. One explanation for this difference could be that there is
more measurement error in men’s housework over time, so that lagged housework
is a weaker predictor of the current wage for men than for women. Analysis shows
that men’s housework is less serially correlated than women’s (the serial correlation
coefficient is 0.64 for married women and 0.53 for married men), which could
reflect measurement error; or men may have more discretion in the amount of
housework they do, resulting in greater changes from year to year. Unfortunately
the data do not allow us to distinguish between these (or other) possibilities.
5.3 Controlling for actual experience
As noted above, we are able to construct a measure of actual labour market ex-
perience using the BHPS retrospective data, although about 30% of the sample do
not give full information on their work histories. The lower panel of Table 9
presents the estimates when we control for experience and its square (with a
dummy to indicate missing experience) instead of age. The results are very close
Table 9 The effect of housework on wages: alternative specifications
Single Single Married Marriedwomen men women men(1) (2) (3) (4)
Using lagged houseworkHousework (hours/wk) �0.0023** �0.0014 �0.0030*** �0.0002
(�2.32) (�1.23) (�6.33) (�0.31)Housework * PT 0.0024* �0.0179*** 0.0019*** �0.0004
(1.76) (-4.27) (3.33) (�0.16)Observations 6066 5871 16476 16422Including experience instead of ageHousework (hours/wk) �0.0002 �0.0015 �0.0027*** �0.0019***
(�0.16) (�1.25) (�5.25) (�3.14)Housework * PT �0.0018 �0.0057 0.0024*** �0.0003
(�1.31) (�1.35) (3.88) (�0.14)Observations 7180 7081 18851 19013
Notes: (i) Controls are reported in Table 2 and notes; (ii) the dependent variable is the log of the real
gross hourly wage; (iii) t-statistics in parentheses; (iv) * significant at 10%; ** significant at 5%; ***
significant at 1%.
..........................................................................................................................................................................13We find no effect from second or higher lags of housework.
m. bryan and a. sevilla-sanz 205
at Queen M
ary, University of L
ondon on February 12, 2014http://oep.oxfordjournals.org/
Dow
nloaded from
to the main estimates that control for age, especially among married men and
women. We might have expected the results for women to differ somewhat given
that age and experience typically diverge due to career breaks or low labour market
attachment. Our results indicate that age may be a good proxy for experience in the
fixed-effects model where differences in the long-term labour market orientation of
individuals are absorbed by the fixed effect.
6. ConclusionThis paper has provided the first estimates of the housework-wage relationship in
Britain. Using longitudinal data to control for unobserved heterogeneity, we find a
negative effect of housework on the wages of full-time workers that spans gender
and marital status. In line with studies from other countries the estimated effect is
larger for (married) women than for men, although statistically we cannot reject
equality. Among part-time workers, we find a negative effect of housework on the
wages of single women (and the few men working part-time) of about the same size
as for full-timers, however there is no evidence of a housework penalty among
married women working part-time.
The similarity of the housework penalty across sub-groups which are character-
ized by different types and timing of housework could be an indication that the
amount of housework matters more than the type or timing; and indeed we find no
reduction of the housework penalty in flexible jobs. On the other hand, the house-
work penalty is also fairly uniform across full-time jobs with widely differing effort
requirements, suggesting the housework penalty does not reflect an effort trade-off
either. A possible explanation is that interaction of market and housework timing
does matter but that there is not enough variation in the timing of full-time work
for us to detect the effects. Thus it could be significant that we do detect occupa-
tional differences in the housework-wage relation among single part-timers, with
stronger effects in jobs that may involve inconvenient hours. It is also interesting
that the smallest penalty is among those doing the most housework (married
women working part-time). It is difficult to draw firm conclusions from these
pieces of evidence without direct information on housework and job timing, but
one possibility is that married women working part-time may be able to avoid jobs
with undesirable schedules; possibly because the presence of a second earner in the
household means that they are less constrained in the type of job they can take.
Our findings point to the need for longitudinal data with richer information on
time use in order to further explore the mechanisms behind the housework-wage
relation. Future research should in particular look at the timing of housework
relative to market work. The interaction between housework and part-time jobs
could prove informative here since there is likely to be more variation in the timing
of part-time work than full-time work. Future work should also probe the tentative
finding that children introduce domestic constraints that increase the housework
penalty. Again, direct timing information in a panel context would be invaluable.
206 does housework lower wages?
at Queen M
ary, University of L
ondon on February 12, 2014http://oep.oxfordjournals.org/
Dow
nloaded from
AcknowledgementsWe would like to thank Dave Mare for providing the code used to construct consistent work-
life history files. For helpful comments we are grateful to the editor and two anonymousreferees, as well as seminar participants at the University of Leicester, BHPS conference 2007
(Essex), European Economic Association Congress 2007 (Budapest), European Society forPopulation Economics Conference 2008 (London), University of Sheffield and Keele
University.
FundingEconomic and Social Research Council through the Centre for Time Use
Research to ASS (RES-060-25–0037); Research Centre on Micro-Social Change
to MLB (RES-518–28–5001).
ReferencesBardasi, E. and Taylor, M. (2008) Marriage and wages: a test of the specialization hypothesis,Economica, 75, 569–91.
Becker, G.S. (1985) Human capital, effort, and the sexual division of labor, Journal of Labor
Economics, 3, S33–58.
Bittman, M. and Wajcman, J. (2000) The rush hour: the character of leisure time and genderequity, Social Forces, 79, 165–89.
Bonke, J., Datta-Gupta, N., and Smith, N. (2005) Timing and flexibility of housework andmen and women’s wages, in D.S. Hamermesh and G.A. Pfann (eds) Contributions to
Economic Analysis, vol. 271, Elsevier Press, Amsterdam.
Coverman, S. (1983) Gender, domestic labor time, and wage inequality, AmericanSociological Review, 48, 623–37.
Craig, L. and Bittman, M. (2008) The incremental time costs of children: an analysis of
children’s impact on adult time use in Australia, Feminist Economics, 14, 57–85.
Gariety, B.S. and Shaffer, S. (2001) Wage differentials associated with flextime, MonthlyLabor Review, 124, 68–75.
Gupta, S. (1999) The effects of transitions in marital status on men’s performance of house-work, Journal of Marriage and the Family, 61, 700–11.
Hersch, J. (1985) Effect of housework on earnings of husbands and wives: evidence from
full-time piece rate workers, Social Science Quarterly, 66, 201–17.
Hersch, J. (1991a) The impact of non-market work on market wages, The AmericanEconomic Review, Papers and Proceedings, 81, 157–60.
Hersch, J. (1991b) Male-female differences in hourly wages: the role of human capital,
working conditions, and housework, Industrial and Labor Relations Review, 44, 746–59.
Hersch, J. (2009) Home production and wages: evidence from the American Time Use
Survey, Review of Economics of the Household, 7, 159–78.
Hersch, J. and Stratton, L.S. (1994) Housework, wages, and the division of houseworktime for employed spouses, The American Economic Review, Papers and Proceedings, 84,
120–25.
m. bryan and a. sevilla-sanz 207
at Queen M
ary, University of L
ondon on February 12, 2014http://oep.oxfordjournals.org/
Dow
nloaded from
Hersch, J. and Stratton, L.S. (1997) Housework, fixed effects, and wages of married workers,
The Journal of Human Resources, 32, 285–307.
Hersch, J. and Stratton, L.S. (2000) Household specialization and the male marriage wage
premium, Industrial and Labor Relations Review, 54, 78–94.
Hersch, J. and Stratton, L.S. (2002) Housework and wages, The Journal of Human Resources,
37, 217–29.
Hundley, G. (2000) Male/female earnings differences in self-employment: the effects of
marriage, children, and the household division of labor, Industrial and Labor Relations
Review, 54, 95–114.
Hundley, G. (2001) Why women earn less than men in self-employment, Journal of Labour
Research, 22, 817–29.
Keith, K. and Malone, P. (2005) Housework and the wages of young, middle-aged, and older
workers, Contemporary Economic Policy, 23, 224–41.
Maani, S. and Cruickshank, A. (2009) What is the effect of housework on the market wage,
and can it explain the gender wage gap? Journal of Economic Surveys, published online. DOI:
10.1111/j.1467–6419.2009.00586.x.
Manning, A. and Petrongolo, B. (2005) The part-time pay penalty, Discussion Paper No.
679, CEP, London School of Economics, London, Available at http://cep.lse.ac.uk/pubs/-
download/dp0679.pdf.
Mare, D.C. (2006) Constructing consistent work-life histories: a guide for users of the
British Household Panel Survey, Working Paper No. 2006–39, ISER, University of Essex,
Colchester.
McAllister, I. (1990) Gender and the household division of labor: employment and earnings
variations in Australia, Work and Occupations, 17, 77–99.
Noonan, M.C. (2001) The impact of domestic work on men’s and women’s wages, Journal of
Marriage and Family, 63, 1134–45.
Phipps, S., Burton, P., and Lethbridge, L. (2001) In and out of the labour market: long term
income consequences of child-related interruptions to women’s paid work, Canadian Journal
of Economics, 34, 411–29.
Presser, H. (2005) Working in a 24/7 Economy: Challenges For American Families, Russell
Sage Foundation Publications, New York.
Ribar, D.C. (2004) What do social scientists know about the benefits of marriage? A review
of quantitative methodologies, Discussion Paper No. 998, IZA, Bonn.
Shelton, B.A. and Firestone, J. (1988) An examination of household labor time as a factor in
composition and treatment effects on the male-female wage gap, Sociological Focus, 21,
265–78.
Shirley, C. and Wallace, M. (2004) Domestic work, family characteristics,
and earnings: reexamining gender and class differences, The Sociological Quarterly, 45,
663–90.
Sigle-Rushton, W. and Waldfogel, J. (2007) Motherhood and women’s earnings in
Anglo-American, continental European, and Nordic countries, Feminist Economics, 13,
55–91.
Stratton, L.S. (2001) Why does more housework lower women’s wages?: Testing hypotheses
involving job effort and hours flexibility, Social Science Quarterly, 82, 67–76.
208 does housework lower wages?
at Queen M
ary, University of L
ondon on February 12, 2014http://oep.oxfordjournals.org/
Dow
nloaded from
Sullivan, O. (1997) Time waits for no (wo)man: an investigation of the gendered experienceof domestic time, Sociology, 31, 221–39.
Waldfogel, J. (1998) Understanding the ‘family gap’ in pay for women with children,Journal of Economic Perspectives, 12, 137–56.
Appendix
Table A1 Summary statistics
All Women Men Singlewomen
Singlemen
Marriedwomen
Marriedmen
(1) (2) (3) (4) (5) (6) (7)
Log wage 2.072 1.950 2.194 1.902 1.949 1.969 2.285Housework 8.907 13.079 4.746 8.178 4.442 14.945 4.860Married 0.726 0.724 0.729 0.000 0.000 1.000 1.000No. children in hh 0.614 0.598 0.631 0.263 0.019 0.725 0.859Part-time 0.195 0.356 0.033 0.212 0.051 0.411 0.026Age 37.420 37.344 37.496 32.930 30.130 39.025 40.239Experience 19.308 17.685 21.006 14.304 12.967 18.985 24.164Experience missing 0.271 0.253 0.288 0.248 0.259 0.256 0.299Degree 0.161 0.151 0.171 0.189 0.179 0.137 0.168Further education 0.293 0.276 0.309 0.255 0.258 0.284 0.329A levels 0.133 0.125 0.140 0.153 0.170 0.114 0.129O levels 0.212 0.241 0.184 0.235 0.211 0.243 0.174Other qualifications 0.083 0.087 0.079 0.085 0.088 0.088 0.076London 0.096 0.099 0.093 0.140 0.124 0.084 0.082South east 0.202 0.206 0.198 0.211 0.195 0.203 0.199South west 0.089 0.084 0.095 0.071 0.089 0.089 0.097East Anglia 0.040 0.039 0.041 0.032 0.032 0.042 0.045West Midlands 0.086 0.084 0.088 0.080 0.085 0.085 0.089North West 0.106 0.106 0.106 0.097 0.113 0.109 0.103Yorkshire 0.094 0.094 0.095 0.079 0.082 0.099 0.099North 0.064 0.062 0.066 0.062 0.070 0.062 0.064Wales 0.048 0.048 0.049 0.058 0.055 0.044 0.047Scotland 0.088 0.097 0.079 0.105 0.067 0.093 0.084Firm size 1–24 0.332 0.373 0.291 0.362 0.319 0.377 0.280Firm size 25–49 0.133 0.143 0.124 0.138 0.128 0.144 0.122Firm size 50–99 0.118 0.109 0.128 0.109 0.122 0.110 0.129Firm size 100–199 0.107 0.098 0.116 0.099 0.110 0.098 0.118Firm size 200–499 0.135 0.112 0.157 0.116 0.140 0.111 0.163Firm size 500–999 0.069 0.058 0.080 0.055 0.078 0.059 0.081Firm size >1000 0.106 0.106 0.105 0.121 0.103 0.101 0.106Manager 0.145 0.107 0.183 0.113 0.108 0.105 0.211Profesional 0.104 0.104 0.104 0.104 0.086 0.103 0.110Technician 0.115 0.125 0.106 0.124 0.112 0.125 0.103Clerical 0.196 0.293 0.099 0.290 0.144 0.295 0.082Craft 0.105 0.024 0.185 0.027 0.194 0.023 0.182Personal 0.104 0.144 0.065 0.150 0.073 0.141 0.062
(Continued)
m. bryan and a. sevilla-sanz 209
at Queen M
ary, University of L
ondon on February 12, 2014http://oep.oxfordjournals.org/
Dow
nloaded from
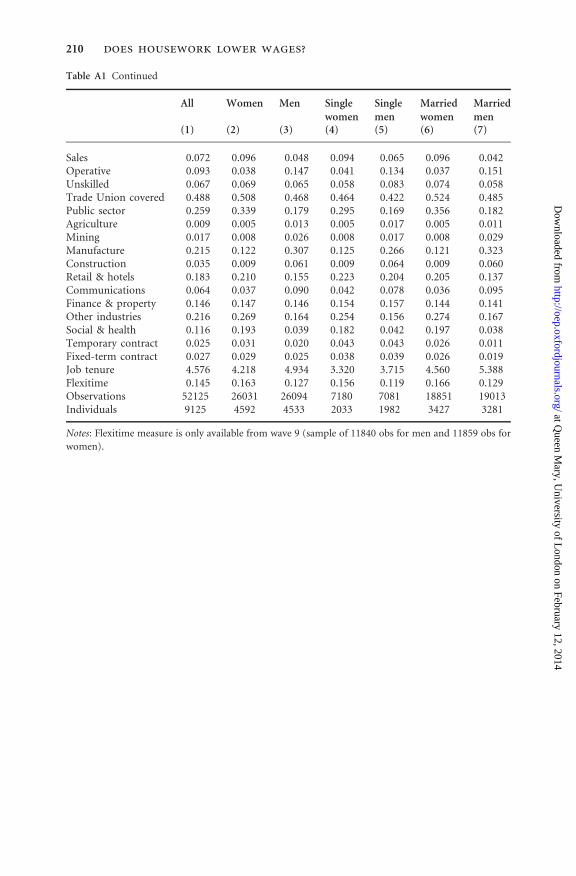
Table A1 Continued
All Women Men Singlewomen
Singlemen
Marriedwomen
Marriedmen
(1) (2) (3) (4) (5) (6) (7)
Sales 0.072 0.096 0.048 0.094 0.065 0.096 0.042Operative 0.093 0.038 0.147 0.041 0.134 0.037 0.151Unskilled 0.067 0.069 0.065 0.058 0.083 0.074 0.058Trade Union covered 0.488 0.508 0.468 0.464 0.422 0.524 0.485Public sector 0.259 0.339 0.179 0.295 0.169 0.356 0.182Agriculture 0.009 0.005 0.013 0.005 0.017 0.005 0.011Mining 0.017 0.008 0.026 0.008 0.017 0.008 0.029Manufacture 0.215 0.122 0.307 0.125 0.266 0.121 0.323Construction 0.035 0.009 0.061 0.009 0.064 0.009 0.060Retail & hotels 0.183 0.210 0.155 0.223 0.204 0.205 0.137Communications 0.064 0.037 0.090 0.042 0.078 0.036 0.095Finance & property 0.146 0.147 0.146 0.154 0.157 0.144 0.141Other industries 0.216 0.269 0.164 0.254 0.156 0.274 0.167Social & health 0.116 0.193 0.039 0.182 0.042 0.197 0.038Temporary contract 0.025 0.031 0.020 0.043 0.043 0.026 0.011Fixed-term contract 0.027 0.029 0.025 0.038 0.039 0.026 0.019Job tenure 4.576 4.218 4.934 3.320 3.715 4.560 5.388Flexitime 0.145 0.163 0.127 0.156 0.119 0.166 0.129Observations 52125 26031 26094 7180 7081 18851 19013Individuals 9125 4592 4533 2033 1982 3427 3281
Notes: Flexitime measure is only available from wave 9 (sample of 11840 obs for men and 11859 obs for
women).
210 does housework lower wages?
at Queen M
ary, University of L
ondon on February 12, 2014http://oep.oxfordjournals.org/
Dow
nloaded from