work distribution in global product ...web.mit.edu/eppinger/www/pdf/tripathy_dsm2008.pdfdistribution...
TRANSCRIPT

10TH INTERNATIONAL DESIGN STRUCTURE MATRIX CONFERENCE, DSM’08 11 – 12 NOVEMBER 2008, STOCKHOLM, SWEDEN
WORK DISTRIBUTION IN GLOBAL PRODUCT DEVELOPMENT ORGANIZATIONS Anshuman Tripathy and Steven D. Eppinger Massachusetts Institute of Technology – Sloan School of Management
Keywords: Organization Design, Numerical DSM, Distributed Work, Mathematical Programming
Note: The following represents a research project that we are currently involved in with the product development organization of Nokia. Nokia has been gracious is allowing us to share significant data, scaled values of which will be part of this abstract and the accompanying presentation. For confidentiality reasons (strategic and/or sensitive), certain data will not be shared.
1 SUMMARY Competitive pressures (aggressive cost targets), availability of exceptional and cheaper talent globally, availability of communication media for seamless information flow (aided by advances in collaborative engineering tools and internet technology), advances in IP protection, and several other factors are driving global product development. This has led many firms to replace their traditional, collocated product development processes and organizational structures with new global product development processes and organizations. In an earlier study [1], we identified the role of product architecture, process flow, and PD organization on the same. While literature abounds with prescriptions on modular and integral systems/processes [3, 4, 5], we observed that most components or processes can neither be termed completely modular or integral at the task level. In [1], we also identified the trade-off between lower cost rates and increased work and co-ordination time for globally distributed engineering activities. Here we describe an approach towards structuring work distribution for product development organizations that are distributed globally and are neither modular nor integral, but in-between or complex. We use DSM models to capture both the product development process and the organizational structure. We formulate an optimization model to determine the most effective way to assign the process activities to the distributed work locations.
2 DESIGNING A GLOBAL PRODUCT DEVELOPMENT ORGANIZATION
2.1 Introduction Nokia is involved in the design, development, manufacture and sale of mobile phones and related services. Their product has evolved from a device in the 1990s to include significant associated services. Nokia’s product design and development (PDD) activities are done by various departments distributed globally. In 2008, Nokia underwent an organizational change, moving from an organization comprising of mobile phones, multimedia, enterprise solutions, and other divisions to one comprising of devices, services and solutions, markets, and other divisions. Nokia was interested in identifying the optimized global distribution of work for each of its departments.
2.2 Problem Definition Identifying the optimized work distribution for lowering costs is a mathematical programming problem and hence the trade-off needed to be identified. As PDD work is distributed globally there are manpower rate differences and work time differences (output from every unit of work time differs globally (different efficiencies)). Thus the trade-off is between lower manpower rates and higher work time. This is moderated by constraints, e.g. those involving capacity, work balance, etc. Modelling and solving the above trade-off would require identification of both data requirements for the objective function and the constraints. PDD work comprises individual work and work done in collaboration. Each of these could have different efficiencies as work is re-distributed and hence it is important to differentiate and measure each of them [8].
115

2.3 Data Collection Having identified the trade-off, we proceeded to develop the model and identify each of the data requirements. 2.3.1 Organization Since the new Nokia organization would start to crystallize from 2008, we need to initiate work with an existing business group where data could be made available. Such a business group was identified by Nokia. This business group comprised of two main business units A and B. Each business unit comprised of multiple departments which we differentiated between those that were open to re-organization (j) and those that were not (d). It is important to note that departments d and many of departments j do need to collaborate extensively for successful PDD. We identified the various PDD locations and grouped them geographically by regions (k). Increasing or decreasing the total work content at any location would involve costs (similar to setup and setdown costs: SU and SD) and a similar cost would be incurred for increasing the work content for any department SUD (this can be also be viewed as a temporary loss of efficiency due to new employees in the department). We were able to obtain data corresponding to SUk, SDk, SUDk, and ℓk (manpower cost rate per man-month), though ideally we may have liked to have SUjk, SDjk, and SUDjk. Further, while Nokia had been present in most of the locations for many years, there was one location, the GPD location (k=6), where the organization had been established recently, and where learning effects rk were being observed in both, work and co-ordination, time [2]. Finally the work distribution of each department by region mjk was identified. 2.3.2 Work Content Nokia’s PDD activities occur over 3 phases (planning, definition and development). Planning is common across products and is a calendarized event. Each product goes through the definition and development phases. We developed a DSM (D1) comprising of approximately 200 activities representing the PDD process over the 3 phases. D1 identified the process flow through the activities. It was developed through a series of interviews (approx 30) over two weeks with personnel from different departments and locations. While the interviews during the first week were semi-structured, the second week interviews, held a month later, comprised of debates over a draft D1 DSM. D1 was enhanced to a numerical DSM (D2) by identifying the departments responsible for each activity. Each activity was done by one or two departments. For each activity, the `individual’ work by each department (unit used was man-month) involved was identified. This data (and subsequent ones) assumed that all work is done at the base location (k=1). If an activity involved two departments, we identified the individual work content of each department and the time spent in co-ordination or collaboration. Given the effort used in developing D1, D2 was developed with the help of a core group with experience and visibility of the complete PDD process. This was a multi-day workshop event and was cross-verified with personnel from the planning department. D2 was developed for two different complexities of PDD that the Nokia follows. D2 was then transformed to an organization DSM (D3) (using weighted average of the complexities) [6, 7] which showed the coordination time between any two departments cj(k=1)j’(k=1). It also calculated, for each department, the individual work time wj(k=1). Similarly we identified cj(k=1)d(k=1). 2.3.3 Efficiencies A key feature of distributing work globally is that there are differences in work efficiencies. These efficiencies were observed for both work and co-ordination. For work time, through discussions, we were able to establish the relative efficiencies between locations, φjk. Similarly it was established that there are differences in efficiencies as work is distributed, despite the availability of identical collaborative tools globally. Through successive interviews and discussions we were able to establish the relative co-ordination efficiencies as θkk’. Ideally we may have wanted to identify θjkj’k’ (j ≠ j’). However, it was agreed that the work efficiencies covered the cross-location efficiencies within a department and that there was no significant change between θjkj’k’ and θkk’. 2.3.4 Constraint Development The key constraint identified was that the total work content at any location could not be changed beyond certain limits over the time periods. The organization did not feel that they could either
116

increase/decrease manpower at any location beyond a certain level with respect to the earlier time period.
2.4 Model Development The key objective of the model here is to reduce cost over a given time period. Thus, the objective function was defined to reduce the sum of work and co-ordination time for departments j and co-ordination time for departments d over all locations k and corresponding setup and set down costs. Taking the available data as belonging to time period t=0, we needed to initialize the work and co-ordination content at each location. Thus, wjk for t=0 was developed using the data wj(k=1), mjk, and φjk. Similarly the co-ordination time between the departments and between locations (for t=0) cjkj’k’ and cjkdk’ (j≠j’, k=/≠k’) were developed using cj(k=1)j’(k=1), cj(k=1)d(k=1), θkk’, and mjk. For subsequent periods, it was necessary to capture the learning effects of the GPD location. We captured this in the efficiency factors. Thus we were able to develop φjkt and θkk’t for t=1,2,..., which is an input to the model. While one set of constraints was provided as input by Nokia, the optimization model required further constraints. These were defined as: a) Meet total work and co-ordination time requirements b) Ensure work balance between work and co-ordination time The setup/setdown costs in the objective function make the above optimization problem non-linear. Using a small modification we could transform the problem to a LP, thus ensuring convexity and existence of a solution. The final program code (for 3 time-periods) comprises of approximately 14,000 decision variables and more than 8,000 constraints (excluding non-negativity constraints). (the model is part of the slides)
2.5 Results We ran the model using various setups and assumptions. We observed potential cost reductions ranging upto 8% for various scenarios. Two interesting insights were that work transfer to the GPD region did not behave monotonically with respect to modularity and that there was significant work re-distribution amongst departments within a region.
REFERENCES [1] Tripathy, Anshuman and Eppinger, Steven D., A System Architecture Approach to Global
Product Development(March 2007). MIT Sloan Research Paper No. 4645-07. Available at SSRN: http://ssrn.com/abstract=981202
[2] Boone, Tonya and Ganeshan, Ram., The Effect of Information Technology on Learning in Professional Service Organizations. Journal of Operations Management, 2001, 19, 485-495.
[3] Baldwin, C.Y. and Clark, K.B., Design Rules Vol I: The Power of Modularity, The MIT Press, 2000.
[4] Ulrich, K., The Role of Product Architecture in the Manufacturing Firm. Research Policy, 1995, 24, 419-440.
[5] Sanchez, R. and Mahoney, J., Modularity, Flexibility, and Knowledge Management in Product and Organization Design. Strategic Management Journal, 1996, 17, 63-76.
[6] Gulati, R.K., and Eppinger, S.D., The Coupling of Product Architecture and Organizational Structure Decisions (May 1996). MIT Sloan Working Paper No. 3906.
[7] Eppinger, S.D., and Salminen, V., Patterns of Product Development Interactions, International Conference on Engineering Design, Glasgow, 2001, Aug 21-23
[8] Gomes,P.J. and Joglekar, N.R., The Costs of Coordinating Distributed Software Development Tasks, 2006. Boston University Working Paper.
Contact: A.Tripathy Massachusetts Institute of Technology- A.P.Sloan School of Management, Operations Management Group 60 Wadsworth Street, E53-388 Cambridge, MA 02142, USA Phone: 1-617-258-5586 Fax: 1-617-258-7579 [email protected]
117

MANAGE COMPLEX SYSTEMSFOLLOW THE FLOW OF INFORMATION!
Work Distribution in Global ProductWork Distribution in Global Product Development Organizations
Anshuman TripathySteven D. Eppinger
Massachusetts Institute of Technologyassac usetts st tute o ec o ogySloan School of Management
MANAGE COMPLEX SYSTEMSFOLLOW THE FLOW OF INFORMATION!
IndexIndex
• Motivation• Theory & Definitions• Theory & Definitions
– What is Global Product Development (GPD)– What impacts GPD?
• Single Decision– Problem setup and identification– Data identificationData identification– DSM setup and usage– Problem formulation
P bl l ti– Problem solution• Summary
10th International DSM Conference 2008- 2
118

MANAGE COMPLEX SYSTEMSFOLLOW THE FLOW OF INFORMATION!
Motivation: Why GPD?Motivation: Why GPD?
Ghemawat (2007): firms’ globalization is a mix of - adaptation (to market needs)- aggregation (of regional requirements)- arbitrage (to attain efficiencies)
GPD can also be thought of along the above for PD activitiesg g- need to meet market specific requirements- aggregate regional PD requirements- arbitrageg
Arbitrage:
Competence Seeking- PB sources printer from
Cost Savings-Danaher, Textron setup
Hedging- Danaher uses flexiblePB sources printer from
Canon- Intel sets up development centers in Israel, India
Danaher, Textron setup engg centers in India-Honeywell contemplates
low/medium cost regionf d t
Danaher uses flexible workforce
- Textron uses mix of own/ out-source
kf(Tripathy & Eppinger, 2007)
for new dept workforce
10th International DSM Conference 2008- 3
MANAGE COMPLEX SYSTEMSFOLLOW THE FLOW OF INFORMATION!
Ownership & Location are differentOwnership & Location are different
Systems Engg
Module / Task Module / TaskModule / Taskinhouse - onsite
Module / Tasksupplier - onsite
d l / k (Ulrich & Ellison (2005))Module / Task
supplier - offshore
Module / Taskinhouse - offshore
(Ulrich & Ellison (2005))
Distributed GlobalDev Product Dev
offsite offshore (Eppinger & Chitkara (2006))
10th International DSM Conference 2008- 4
119

MANAGE COMPLEX SYSTEMSFOLLOW THE FLOW OF INFORMATION!
GPD – System Architecture ApproachGPD System Architecture Approach
Conventional PD(home location)
Component Offshore(very hard, high co-ordination)(home location) (very hard, high co ordination)
Homelocation
System
Sub system
GPD location
Sub-system
Component
Sub-system Offshore(manageable co-ordination)
Homelocation
System
Sub-systemStrength of Interactions Determines GPD Success
Component
GPD location
10th International DSM Conference 2008- 5
MANAGE COMPLEX SYSTEMSFOLLOW THE FLOW OF INFORMATION!
Offshoring DecisionOffshoring Decision
i: componentj: processk: locationt: time
10th International DSM Conference 2008- 6
120

MANAGE COMPLEX SYSTEMSFOLLOW THE FLOW OF INFORMATION!
Single DecisionSingle Decision
Nokia Example
Nokia till 2007 mobile phones, multimedia, enterprise solutions, othersfrom 2008 devices, software and solutions, markets, others
Study One of the business groups in earlier structure, comprising of business units A & B
A: 11 departments (portfolio, architecture, mechanics, etc.)- 1 department has assigned distribution- other 10 departments can undergo re-distribution
B: departments have assigned distributionB: departments have assigned distributionmost future expansions through acquisitions/outsourcing
Is the PD work distribution amongst Nokia’s various PD sites (located s e o d s bu o a o gs o a s a ous s es ( oca edglobally) optimal?
Note: scaled data shown in this presentation
10th International DSM Conference 2008- 7
MANAGE COMPLEX SYSTEMSFOLLOW THE FLOW OF INFORMATION!
Single Decision: Nokia ExampleSingle Decision: Nokia Example
Problem Construct:Value proposition: total costValue proposition: total costTrade-off: lower manpower rates vs. higher task timeConstraints: task requirements, work balance
Data Needs:Cost factors: manpower rates, employee hire/fire costs, dept training costscostsTask time: tasks, time requirements, relative efficiencies
Need to separate task time between *Need to separate task time between - work time: time spent in doing work individually- co-ordination time: time required to be spent in obtaining/giving
information related to own work
* Tripathy & Eppinger (2007)
10th International DSM Conference 2008- 8
121
MANAGE COMPLEX SYSTEMSFOLLOW THE FLOW OF INFORMATION!
Single Decision: Nokia ExampleSingle Decision: Nokia Example
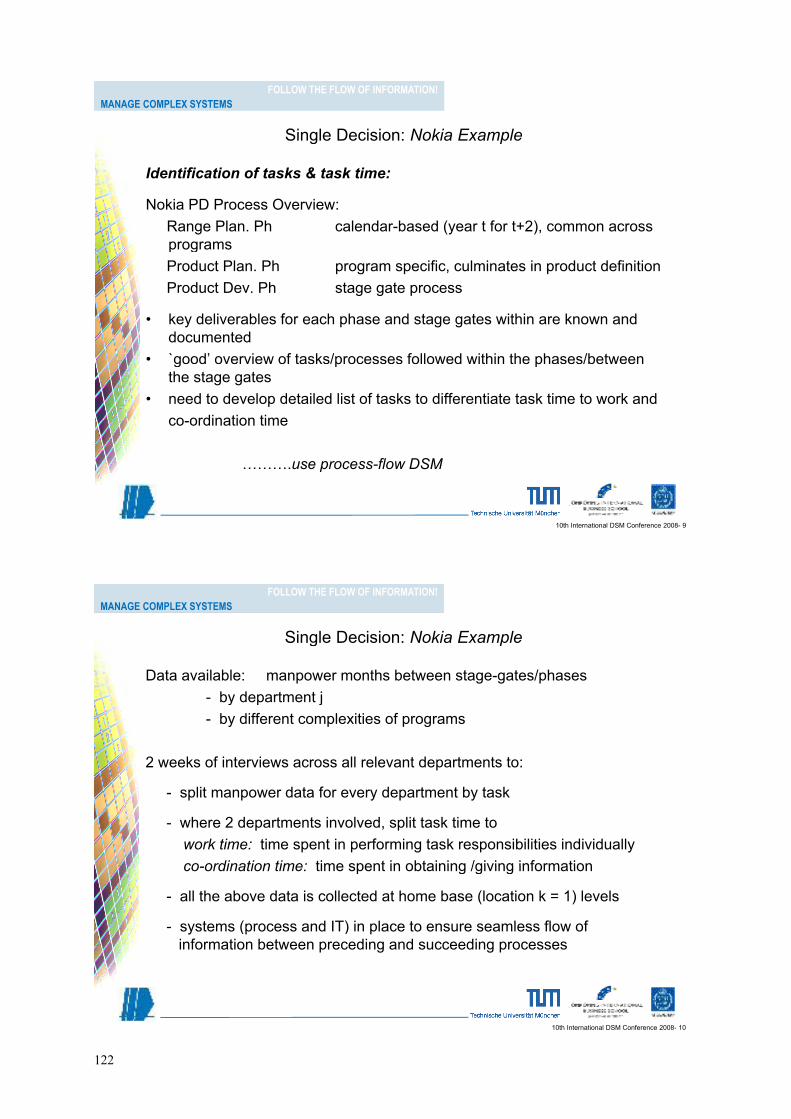
Identification of tasks & task time:
Nokia PD Process Overview:Range Plan. Ph calendar-based (year t for t+2), common across programsp gProduct Plan. Ph program specific, culminates in product definitionProduct Dev. Ph stage gate process
• key deliverables for each phase and stage gates within are known and documented
• `good’ overview of tasks/processes followed within the phases/between g p pthe stage gates
• need to develop detailed list of tasks to differentiate task time to work and co ordination timeco-ordination time
……….use process-flow DSM
10th International DSM Conference 2008- 9
MANAGE COMPLEX SYSTEMSFOLLOW THE FLOW OF INFORMATION!
Single Decision: Nokia ExampleSingle Decision: Nokia Example
Data available: manpower months between stage-gates/phasesby department j- by department j
- by different complexities of programs
2 weeks of interviews across all relevant departments to:
- split manpower data for every department by task
- where 2 departments involved, split task time towork time: time spent in performing task responsibilities individuallyco-ordination time: time spent in obtaining /giving informationco-ordination time: time spent in obtaining /giving information
- all the above data is collected at home base (location k = 1) levels
t ( d IT) i l t l fl f- systems (process and IT) in place to ensure seamless flow of information between preceding and succeeding processes
10th International DSM Conference 2008- 10
122

MANAGE COMPLEX SYSTEMSFOLLOW THE FLOW OF INFORMATION!
Single Decision: Nokia ExampleSingle Decision: Nokia Example
confidential
- Range plan. phase is common across programsP d t l d d t d h t k ti d d- Product plan. and product dev. phase task time depends on program complexity
wijk individual work time for dept j at location k (here =1) for task iwijk individual work time for dept j at location k (here 1) for task i ci(jk)(j’k’) co-ordination time between depts. j and j’ located at k and k’ (here
both 1) for task Ic = max(c c )
10th International DSM Conference 2008- 11
cij(k=1)j’(k=1) = max(cij(k=1), cij’(k=1))
MANAGE COMPLEX SYSTEMSFOLLOW THE FLOW OF INFORMATION!
Single Decision: Nokia ExampleSingle Decision: Nokia Example
confidential
Process DSM
Task Time Org. nDSMwj : work time for dept jcjj’: co-ordination time
between dept j and j’between dept j and j’confidential
10th International DSM Conference 2008- 12
123

MANAGE COMPLEX SYSTEMSFOLLOW THE FLOW OF INFORMATION!
Single Decision: Nokia ExampleSingle Decision: Nokia Example
Identification of Locations and Cost Data:
base location (home) defined as location k = 1base location (home) defined as location k = 1other locations identified geographically and PD centers combined within location (k = 2,3,4,5,6)
location k=6 is new GPD center with significant lower costscosts identified for each location k:
manpower cost rate ℓkmanpower cost rate ℓkmanpower hiring cost SUk
manpower let-off cost SDk
d t t t i i t SUDdepartment training cost SUDk
distribution of task content over all locations k for each department j, mjk
recognized the following:g gefficiencies for performing tasks are different across locations learning effects are present in GPD location k=6, other locations are
steady state
10th International DSM Conference 2008- 13
steady state
MANAGE COMPLEX SYSTEMSFOLLOW THE FLOW OF INFORMATION!
Single Decision: Nokia ExampleSingle Decision: Nokia ExampleEfficiency
task time = work time + co-ordination time
work time efficiency φjk identifiedco-ordination time efficiency θkk’ identified (ideally θjkj’k’ )
d bj ti (Lik t) l- used subjective (Likert) scale:excellent, no challenges 4 time taken = 1 hourgood or average coordination challenge 3/2
l f di i h ll 1 i k 2 hpoor, lot of coordination challenges 1 time taken = 2 hour- curve fitting (convex decreasing)
θkk'( 0) 1 2 3 4 5 6θkk'(t=0) 1 2 3 4 5 6
1 1.00 0.87 0.87 0.71 0.71 0.502 0.87 1.00 0.87 0.71 0.71 0.503 0 87 0 87 1 00 0 71 0 71 0 503 0.87 0.87 1.00 0.71 0.71 0.504 0.71 0.71 0.71 1.00 0.71 0.505 0.71 0.71 0.71 0.71 1.00 0.506 0.50 0.50 0.50 0.50 0.50 0.71
10th International DSM Conference 2008- 14
6 0.50 0.50 0.50 0.50 0.50 0.71
124

MANAGE COMPLEX SYSTEMSFOLLOW THE FLOW OF INFORMATION!
Single Decision: Nokia ExampleSingle Decision: Nokia ExampleLearning Effect
identified learning effect rk at loc k=6identified learning effect rk at loc k 6incorporate learning effect through efficiency factors φjkt and θkk’t
learning effect impact on work time
since Tk >> t for k=1..5, learning effects not observed
learning effect impact on co-ordination time
since Tk >> t for k=1……5, θkk’t = θkk’ when k,k’ ≠ 6
10th International DSM Conference 2008- 15
MANAGE COMPLEX SYSTEMSFOLLOW THE FLOW OF INFORMATION!
Single Decision: Nokia ExampleSingle Decision: Nokia ExampleData Development
work time co-ordination time
transformed 12x12 nDSM to 72x72 nDSMconsider a 5-time period model: t = 1,2,3,4,5thus we get wjkt & cjkj’k’t with wjk0 = wjk and cjkj’k’0 = cjkj’k’ (initialization)
Assumptions Usede-βt = 0.9(base model) capacity constraints
home location: capacity can (max) reduce 10% yoy and 15% over 3 yrslocations k=2,3,4,5: capacity can (max) reduce 10% yoyGPD location k=6: capacity can (max) increase 15% yoyp y ( ) y y
no budget constraints consideredcompetence preserving: no department (at any location) can reduce to less than 50%
original strength
10th International DSM Conference 2008- 16
125

MANAGE COMPLEX SYSTEMSFOLLOW THE FLOW OF INFORMATION!
Single Decision: Nokia ExampleSingle Decision: Nokia Example
10th International DSM Conference 2008- 17
MANAGE COMPLEX SYSTEMSFOLLOW THE FLOW OF INFORMATION!
Single Decision: Nokia ExampleSingle Decision: Nokia Example
• Non-linear objective function due to location setup/setdown costs, dept setupsetup
• Use transformations to linearize objective function• Constraint set is linear, and hence convex
W t LP t l ti i t• We get LP setup corner solution existsWe look at alternate scenarios:• Allow locations k=2,3,4,5 capacity to (max) reduce upto 25% yoy and p y ( ) p y y
GPD location k=6 capacity to (max) increase 25% yoy• Allow locations k=2,4 to be shut down• Allow dept 3 10 to be performed at locations k=2 4 5 6Allow dept 3,10 to be performed at locations k 2,4,5,6• Allow dept 2,6,7,8 to be performed at GPD location k=6• Introduce cost increase of 5% yoy at GPD location k=6
T l k f b i i %• Total work content of business group increases 5% yoy
10th International DSM Conference 2008- 18
126

MANAGE COMPLEX SYSTEMSFOLLOW THE FLOW OF INFORMATION!
Single Decision: Nokia ExampleSingle Decision: Nokia Example
10th International DSM Conference 2008- 19
the above is a reflection of potential results, not actual results
MANAGE COMPLEX SYSTEMSFOLLOW THE FLOW OF INFORMATION!
SummarySummary
• The practice of Global Product Development is becoming prevalant: accompanying it is the challenge of organizing itaccompanying it is the challenge of organizing it
• System architecture will play a very critical role in determing the organization of GPD
• DSM can help identify and quantify the interactions and interdependencies leading to designing of successful GPD organizations
• Developed an example to show how nDSM can help identify the work distribution in a GPD organization
10th International DSM Conference 2008- 20
127