three views of product development complexity prof. steven d. eppinger massachusetts institute of...
TRANSCRIPT

Three Views of Product Development Complexity
Prof. Steven D. Eppinger
Massachusetts Institute of Technology
Sloan School of Management
Engineering Systems Division
Center for Innovation in Product Development
©2000 Steven D. [email protected]
http://www.mit.edu/people/eppinger/http://web.mit.edu/dsm
MITESD
Lean Aerospace Initiative Plenary ConferenceApril 10, 2001

Information Density in Complex Product Development
• 400 people
• 5000 part numbers
• 2000 significant parts
• 125 subassemblies
• 2000 drawings
• 12,000 problems
• ~1,000,000 decisions
• ~1,000,000 info. flowsOffice copier by Xerox
complex product = system

Three Perspectives to Study Development of Complex Systems
• Product/System-level
• Process-level
• Organization-level
PlanningPlanning Concept
Development
ConceptDevelopment
System-LevelDesign
System-LevelDesign
DetailDesign
DetailDesign
Testing andRefinement
Testing andRefinement
ProductionRamp-Up
ProductionRamp-Up

System Decomposition
• Decompose a complex system into sub-systems and components
• Decompose a complex process into sub-processes and tasks
• Decompose a large organization into teams and individuals

Decompositions Exhibit Architectures
• The pattern of interactions between the decomposed elements define the architecture
– System architecture
– Process architecture
– Organization architecture

Decompositions Exhibit Architectures
• The pattern of interactions between the decomposed elements define the architecture
– System architecture
– Process architecture
– Organization architecture

Potential Complexity Metrics• The number of elements determines the
complexity of the decomposition
• The uncertainty of elements determines their difficulty in development and integration
• The pattern of interaction among the elements indicates the complexity of the architecture
• The alignment of the patterns determines the difficulty of developing the system in context
? ?
Number of Elements
Pattern of Interactions
Alignment of Patterns
Uncertainty of Elements

An Approach to Studying the Patterns
• We can study the patterns of interactions in three perspectives in order to better understand system complexity:– System example: Pratt & Whitney 4098 jet engine
– Process example: Intel semiconductor development
– Organization example: GM Powertrain organization
• We can also compare the patterns across the perspectives:– System vs. Organization example: Pratt & Whitney engine
– Process vs. Organization example: electrical connectors

System Architecture Example:P&W 4098 Jet Engine
•9 Systems•54 Components•569 Interfaces
FAN
LPCHPC
B/D
HPT
LPT
Mechanical ComponentsExternals and Controls (2)
Modular Systems
Distributed Systems
Design Interfaces:•Spatial, Structural•Energy, Materials•Data, Controls
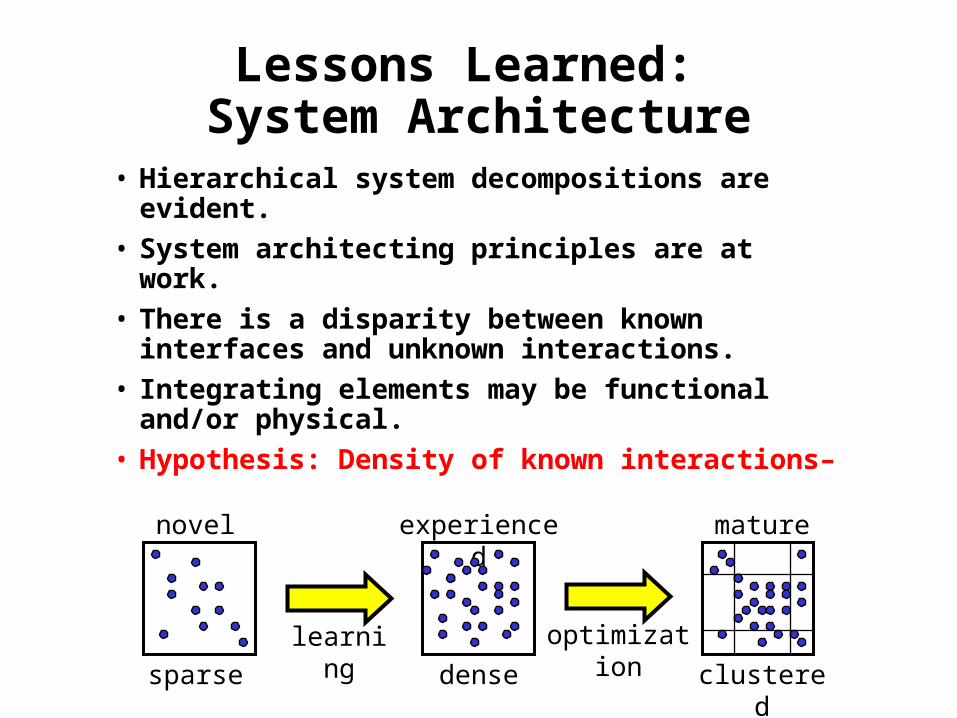
Lessons Learned: System Architecture
• Hierarchical system decompositions are evident.
• System architecting principles are at work.
• There is a disparity between known interfaces and unknown interactions.
• Integrating elements may be functional and/or physical.
• Hypothesis: Density of known interactions–
learning optimization
novel
sparse
experienced
dense
mature
clustered

Process Architecture Example:Intel Semiconductor Development Process
inside
1 2 3 4 5 6 7 8 9 10 11 12 13 14 15 16 17 18 19 20 21 22 23 24 25 26 27 28 29 30 31 32 33 34 35 36 37 38 39 40 41 42 43 44 45 46 47 48 49 50 51 52 53 54 55 56 57 58 59 60
1 Set customer target • x x •2 Estimate sales volumes x • x x •3 Establish pricing direction x • x •4 Schedule project timeline • x5 Development methods x • x x x x6 Macro targets/constraints x x • x x x x7 Financial analysis x x x x x •8 Develop program map x • x9 Create initial QFD matrix x x x x •
10 Set technical requirements x x x x • x11 Write customer specificationx x x x x • O O O O O O O O12 High-level modeling x x x x • x x x13 Write target specification x x x x x x x x x • x x14 Develop test plan x x x x x • x15 Develop validation plan x x x x • 16 Build base prototype x x x x x x •17 Functional modeling x x x x x • x x x x x x x x O O O O O O O O O O18 Develop product modules x x x x x x x x x • O19 Lay out integration x x x x x x x x x •20 Integration modeling x x x x x x x • x x x21 Random testing x x • x x x22 Develop test parameters x x x x x x x • x x x23 Finalize schematics x x x x x • x x O O O O O24 Validation simulation x x x x x x x • x x25 Reliability modeling x x x x x • x26 Complete product layout x x x x x • x x27 Continuity verification x x x x x x •28 Design rule check x x x •29 Design package x x x x x • O O O O O O O30 Generate masks x x x x • x O31 Verify masks in fab x x x •32 Run wafers x • x O33 Sort wafers x •34 Create test programs x •35 Debug products x x x x x • O O O O O O O36 Package products x x x •37 Functionality testing x x x •38 Send samples to customers x x x x •39 Feedback from customers x •40 Verify sample functionality x •41 Approve packaged products x x x x •42 Environmental validation x x x x •43 Complete product validation x x x x x •44 Develop tech. publications x x • x x45 Develop service courses x x • x46 Determine marketing name x x x x x • x47 Licensing strategy x x x •48 Create demonstration x x x x x x •49 Confirm quality goals x x x x x •50 Life testing x x x • x x51 Infant mortality testing x x x x • x52 Mfg. process stabilization x x x • O O53 Develop field support plan x x •54 Thermal testing x x x •55 Confirm process standards x • x x56 Confirm package standards x x x x x • x57 Final certification x x x x x x x x x x x •58 Volume production x x x • x59 Prepare distribution network x x x x x x x x •60 Deliver product to customers x x x x x x x x x •
x = Information Flows O = Unplanned Iterations = Planned Iterations • = Generational Learning

Lessons Learned: Process Architecture
• Information flows describe the PD process more completely than task networks.
• PDTs report their inputs more reliably than their output flows.
• We find parallel and sequential stages within the (CDIO) phases of the PD process.
• Planned iterations can be facilitated to accelerate the process.
• Unplanned iterations require special attention to make the process more robust.

Organization Architecture Example:Engine Development
• Organization: General Motors Powertrain Division• Product: “new-generation” engine (small-block V8)• Structure: 22 PDTs involved simultaneously

Decomposition of the Engine Development Project
DesignEngine
22 PDTsPDT compositionEngine Block
Cylinder Heads 1 product release engineerCamshaft/Valve Train 1 CAD designerPistons 3 manufacturing engineersConnecting Rods 2 purchasing representativesCrankshaft 2 casting engineersFlywheel machine tool supplierAccessory Drive 1 production control analystLubrication 1 financial plannerWater Pump/Cooling production personnelIntake ManifoldExhaustE.G.R.Air CleanerA.I.R.Fuel SystemThrottle BodyEVAPIgnition SystemElectronic Control ModuleElectrical SystemEngine Assembly

PDT InteractionsA B C D E F G H I J K L M N O P Q R S T U V
Engine Block A A l l l l l l l l l l l l l l l
Cylinder HeadsB l B l l l l l l l l l l l l l l lCamshaft/Valve TrainC l l C l l l l l l l l
Pistons D l l l D l l l l l l l l lConnecting RodsE l l l E l l l l
CrankshaftF l l l l l F l l l l l l l
FlywheelG l l G l l l
Accessory DriveH l l l l H l l l l l l l l l l l l l l
LubricationI l l l l l l l l I l l l l lWater Pump/CoolingJ l l l l l l J l l l l l l l
Intake ManifoldK l l l l l l K l l l l l l l l l lExhaustL l l l l l l L l l l l l l l l
E.G.R. M l l l l l l M l l l l l l l
Air CleanerN l l l l N l l lA.I.R.O l l l l l l l l O l l l l
Fuel SystemP l l l l l l l P l l l l
Throttle BodyQ l l l l l l l l Q l l l l
EVAP R l l l R l l
IgnitionS l l l l l l l l l l l l l l S l l lE.C.M. T l l l l l l l l l l l l l l l l T l l
Electrical SystemU l l l l l l l l l l l l l l l l l U lEngine AssemblyV l l l l l l l l l l l l l l l l l l l l V
Frequency of PDT Interactions
l Daily l Weekly l Monthly

System Team AssignmentsShort Block
Engine Block PistonsCrankshaft Connecting RodsFlywheel Lubrication
Valve Train
Cylinder HeadsCamshaft/Valve TrainWater Pump/Cooling
Induction
Intake Manifold Air CleanerAccessory Drive Throttle BodyFuel System A.I.R.
Emissions/Electrical
Exhaust Electrical SystemE.G.R. Electronic ControlE.V.A.P. Ignition
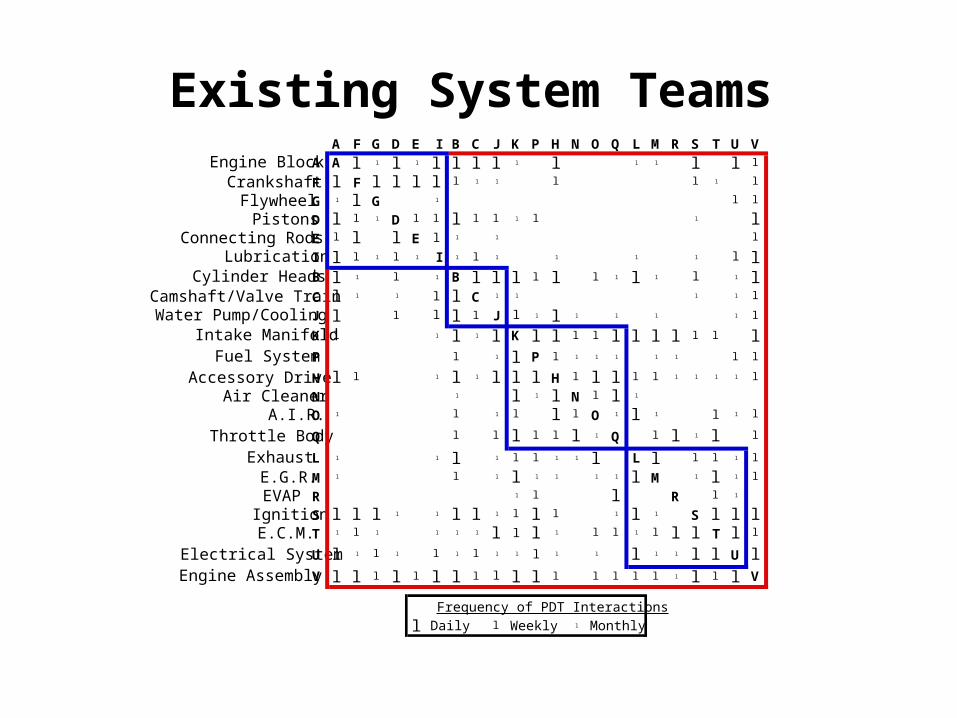
Existing System TeamsA F G D E I B C J K P H N O Q L M R S T U V
Engine Block A A l l l l l l l l l l l l l l l
CrankshaftF l F l l l l l l l l l l l
FlywheelG l l G l l l
Pistons D l l l D l l l l l l l l lConnecting RodsE l l l E l l l l
LubricationI l l l l l I l l l l l l l lCylinder HeadsB l l l l B l l l l l l l l l l l l
Camshaft/Valve TrainC l l l l l C l l l l l
Water Pump/CoolingJ l l l l l J l l l l l l l l
Intake ManifoldK l l l l l K l l l l l l l l l l lFuel SystemP l l l P l l l l l l l l
Accessory DriveH l l l l l l l l H l l l l l l l l l l
Air CleanerN l l l l N l l l
A.I.R.O l l l l l l O l l l l l l
Throttle BodyQ l l l l l l l Q l l l l l
ExhaustL l l l l l l l l l L l l l l l
E.G.R. M l l l l l l l l l M l l l l
EVAP R l l l R l l
IgnitionS l l l l l l l l l l l l l l S l l lE.C.M. T l l l l l l l l l l l l l l l l T l l
Electrical SystemU l l l l l l l l l l l l l l l l l U lEngine AssemblyV l l l l l l l l l l l l l l l l l l l l V
Frequency of PDT Interactions
l Daily l Weekly l Monthly

Proposed System TeamsF G E D I A C B1 K1 J P N Q R B2 K2 O L M H S T U V
Crankshaft F F l l l l l l l l l l l l
FlywheelG l G l l l l
Connecting RodsE l E l l l l l l
Pistons D l l l D l l l l l l l l lLubricationI l l l l I l l l l l l l l l
Engine BlockA l l l l l A l l l l l l l l l l
Camshaft/Valve TrainC l l l l C l l l l l l
Cylinder HeadsB1 l l l l l B1 l l l l l lIntake ManifoldK1 l l l l K1 l l l l l
Water Pump/CoolingJ l l l l l l J l l l l l l l l l
Fuel SystemP l P l l l l l l l l l l
Air CleanerN l N l l l l l lThrottle BodyQ l l l Q l l l l l l l l l
EVAP R l l R l l l
Cylinder HeadsB2 l l l B2 l l l l l l l lIntake ManifoldK2 l l l l l l K2 l l l l l l l
A.I.R.O l l l l l l O l l l l l l
ExhaustL l l l l l l l l L l l l l l l
E.G.R. M l l l l l l l l M l l l l l
Accessory DriveH l l l l l l l l l l l l l l l l H l l l l
IgnitionS l l l l l l l l l l l l l l l l S l l lE.C.M. T l l l l l l l l l l l l l l l l l l T l l
Electrical SystemU l l l l l l l l l l l l l l l l l l l U lEngine AssemblyV l l l l l l l l l l l l l l l l l l l l l l V
Frequency of PDT Interactions
l Daily l Weekly l Monthly
Team 1
Team 2
Team 3
Team 4
Integration Team

PDT-to-System-Team Assignments
Team 1
Integration Team
Team 2
Team 4
Team 3
Flywheel Connecting Rods
Crankshaft
Cylinder HeadsIntake Manifold
E.V.A.P. Fuel System Air Cleaner
Throttle Body
Electronic Control Module
PistonsEngine BlockLubrication
Water Pump/Cooling
Camshaft/Valve Train
ExhaustE.G.R.
A.I.R.
Electrical SystemIgnition Engine Assembly
Accessory Drive

Lessons Learned: Organization Architecture
• Organization architecture can also be mapped in terms of interactions – across individuals or PDTs.
• We usually find a (partial, at least) one-to-one mapping from system decomposition to organization structure.
• Organizations can be designed based on the underlying technical structure of the system being developed.
• Co-Evolution Hypotheses:– Organizations evolve to address deficiencies in their ability to
implement the system architecture.
– System architectures evolve to address deficiencies in the development organization.
Arch
Org

Comparing the System Architecture to the Organization Architecture
How does product architecture drive development team interaction?
Product Decomposition into Systems
Development Organization into Teams
Technical interactionsdefine the architecture
Team interactionsimplement the architecture

Design Interface Matrix
Team Interaction Matrix
Research Method: Mapping Design Interfaces to Team Interactions
Resultant Matrix
Task assignment assumption: Each team designs one component
Team Interaction
Design InterfaceYes
Yes
No
No

Design Interfaces:P&W 4098 Jet Engine
•9 Systems•54 Components•569 Interfaces
FAN
LPCHPC
B/D
HPT
LPT
Mechanical ComponentsExternals and Controls (2)
Modular Systems
Distributed Systems
Design Interfaces:•Spatial, Structural•Energy, Materials•Data, Controls

• 60 design teams clustered into 10 groups.
• Teams interaction intensity:– Capture frequency and importance of
coordination-type communications (scale from 0 to 5).
– Interactions that took place during the detailed design period of the product development process.
– Design executed concurrently.
Team Interactions
Low intensity interaction
High intensity interaction
Six system integration teams
Development Organization: P&W 4098 Jet Engine

Team Interactions
Design Interfaces
Yes(569)
Yes(409)
No(2293)
No(2453)
Overall Results
341(12%)
228(8%)
2225(78%)
68(2%)
We reject the null hypothesis that “team interactions are independent of design interfaces”. 2 = 1208 >> Critical 2
(0.99,1) = 6.635

Design Interfaces Not Matched by Team Interactions
Team Interactions
Design Interfaces
Yes(569)
Yes(409)
No(2293)
No(2453)
228 2225
341 68
(40.1%)
(59.9%)
HYPOTHESES:H1: Across boundaries, design interfaces are less likely to be
matched by team interactions.H2: Weak design interfaces are less likely to be matched by
team interactions.
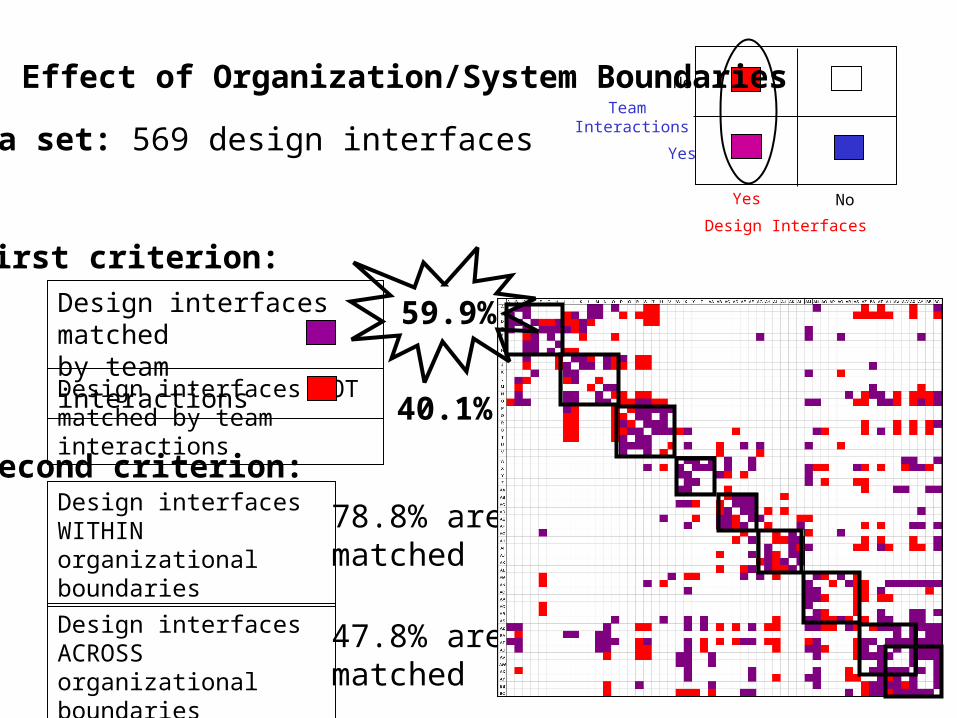
Data set: 569 design interfaces
78.8% arematched
47.8% arematched
Team Interactions
Design Interfaces
Yes
Yes
No
No
Design interfacesWITHIN organizational boundaries
Design interfacesACROSS organizational boundaries
Second criterion:
Design interfaces matchedby team interactions
Design interfaces NOT matched by team interactions
First criterion:
59.9%
40.1%
Effect of Organization/System Boundaries

Effects of Organizational/System Boundaries(modular vs. integrative systems)
Data set: 569 design interfaces
78.8% arematched
47.8% arematched
Design interfacesWITHIN organizational boundaries
Design interfacesACROSS organizational boundaries
36.4% of ACROSS design interfaces are matched
53.2% of ACROSSdesign interfacesare matched
Overall:
Team Interactions
Design Interfaces
Yes
Yes
No
No

Lessons Learned: Architecture and Organization
• We can predict coordination-type communications by studying the architecture of the product
– 83% of coordination-type communication were predicted
• Teams that share design interfaces may not communicate when
– Design interfaces cross organizational boundaries
– Design interfaces are weak (within organizational boundaries)
– Teams communicate indirectly through other design teams (across organizational boundaries)
• Teams that do not share design interfaces may still communicate when
– Unknown design interfaces are discovered
– Design interfaces are system-level dependencies
Team Interactions
Design Interfaces
Yes
Yes
No
No

Lessons Learned about Development of Complex Products
• Product (system) complexity must be considered in the context of the process and organization which are developing it.
• Processes and organizations can be designed to facilitate development of specific product architectures.
• System concepts such as modularity and architectural knowledge apply at the level of sub-system interactions.