with biofore - upmassets.upm.com/investors/2017/reports and presentations 2017/upm... · • upm...
TRANSCRIPT

INTERIM REPORT 1 JANUARY – 30 SEPTEMBER 2017
WITH BIOFORE
UPM Interim Report Q3 2017: Excellent quarter, further steps in transformation
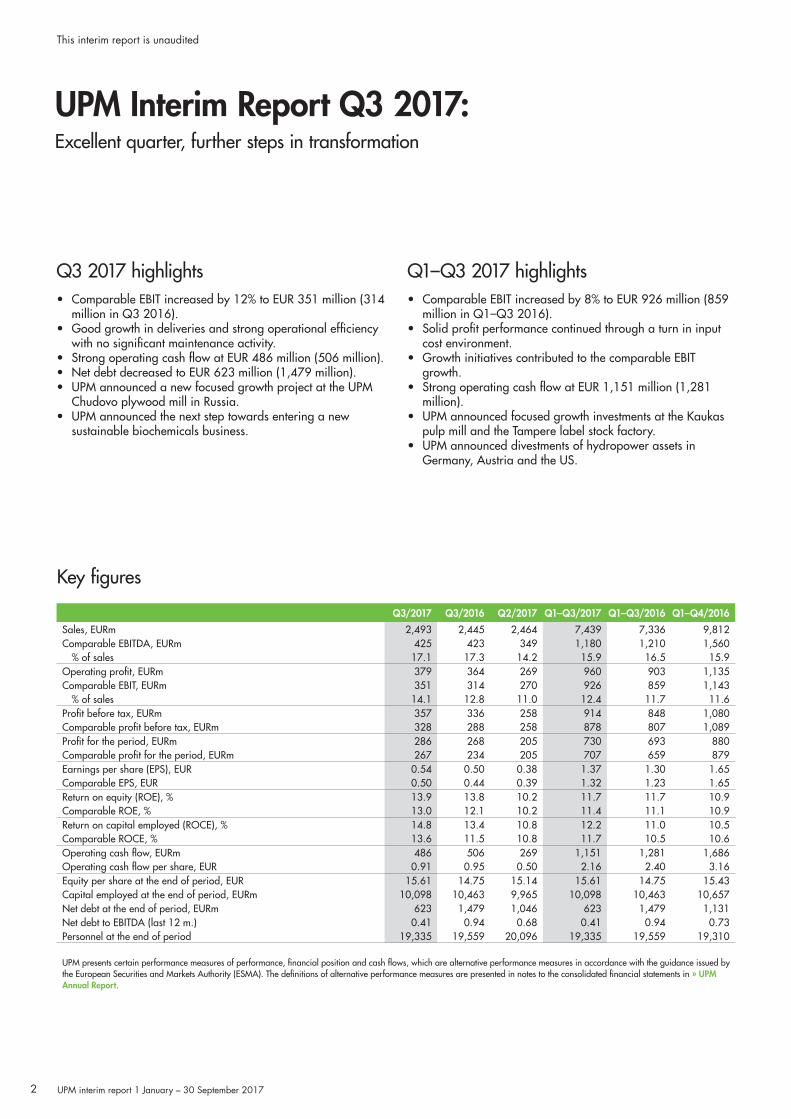
Q3 2017 highlights• Comparable EBIT increased by 12% to EUR 351 million (314
million in Q3 2016).• Good growth in deliveries and strong operational efficiency
with no significant maintenance activity.• Strong operating cash flow at EUR 486 million (506 million).• Net debt decreased to EUR 623 million (1,479 million).• UPM announced a new focused growth project at the UPM
Chudovo plywood mill in Russia.• UPM announced the next step towards entering a new
sustainable biochemicals business.
Q3/2017 Q3/2016 Q2/2017 Q1–Q3/2017 Q1–Q3/2016 Q1–Q4/2016
Sales, EURm 2,493 2,445 2,464 7,439 7,336 9,812Comparable EBITDA, EURm 425 423 349 1,180 1,210 1,560
% of sales 17.1 17.3 14.2 15.9 16.5 15.9Operating profit, EURm 379 364 269 960 903 1,135Comparable EBIT, EURm 351 314 270 926 859 1,143
% of sales 14.1 12.8 11.0 12.4 11.7 11.6Profit before tax, EURm 357 336 258 914 848 1,080Comparable profit before tax, EURm 328 288 258 878 807 1,089Profit for the period, EURm 286 268 205 730 693 880Comparable profit for the period, EURm 267 234 205 707 659 879Earnings per share (EPS), EUR 0.54 0.50 0.38 1.37 1.30 1.65Comparable EPS, EUR 0.50 0.44 0.39 1.32 1.23 1.65Return on equity (ROE), % 13.9 13.8 10.2 11.7 11.7 10.9Comparable ROE, % 13.0 12.1 10.2 11.4 11.1 10.9Return on capital employed (ROCE), % 14.8 13.4 10.8 12.2 11.0 10.5Comparable ROCE, % 13.6 11.5 10.8 11.7 10.5 10.6Operating cash flow, EURm 486 506 269 1,151 1,281 1,686Operating cash flow per share, EUR 0.91 0.95 0.50 2.16 2.40 3.16Equity per share at the end of period, EUR 15.61 14.75 15.14 15.61 14.75 15.43Capital employed at the end of period, EURm 10,098 10,463 9,965 10,098 10,463 10,657Net debt at the end of period, EURm 623 1,479 1,046 623 1,479 1,131Net debt to EBITDA (last 12 m.) 0.41 0.94 0.68 0.41 0.94 0.73Personnel at the end of period 19,335 19,559 20,096 19,335 19,559 19,310
UPM presents certain performance measures of performance, financial position and cash flows, which are alternative performance measures in accordance with the guidance issued by the European Securities and Markets Authority (ESMA). The definitions of alternative performance measures are presented in notes to the consolidated financial statements in » UPM Annual Report.
Key figures
Q1–Q3 2017 highlights• Comparable EBIT increased by 8% to EUR 926 million (859
million in Q1–Q3 2016).• Solid profit performance continued through a turn in input
cost environment.• Growth initiatives contributed to the comparable EBIT
growth.• Strong operating cash flow at EUR 1,151 million (1,281
million).• UPM announced focused growth investments at the Kaukas
pulp mill and the Tampere label stock factory.• UPM announced divestments of hydropower assets in
Germany, Austria and the US.
UPM interim report 1 January – 30 September 2017
This interim report is unaudited
2
“The third quarter was another excellent quarter for UPM. The markets were favourable and we achieved good growth in delivery volumes. We also succeeded in mitigating input cost inflation with sales price increases and cost efficiency measures. Our operational efficiency was strong in a quarter with no significant maintenance activity.
Our comparable EBIT increased by 12 per cent to EUR 351 million. Operating cash flow was strong at EUR 486 million and net debt decreased to EUR 623 million, representing 0.4 times EBITDA.
UPM Biorefining benefitted from higher pulp prices and good delivery growth. UPM Raflatac, UPM Specialty Papers and UPM Plywood were able to largely offset higher input costs by increasing deliveries and sales prices. In UPM Energy the hydropower generation recovered to normal level.
UPM Paper ENA was able to report the best quarter of this year, despite the significant increase in fibre costs. This is the outcome of consistent and continuous work for cost efficiency and competitiveness as well as the stringent execution of commercial strategies. In order to succeed also next year, we need to take timely measures in capacity management and cost savings.
In addition to our strong performance we are pleased to see good progress in our transformation, including our initiatives for future growth.
This morning we announced another growth project in our top-performing plywood business. The expansion of the UPM Chudovo
Outlook for 2017UPM’s profitability improved significantly in 2016 and is expected to continue on a good level in 2017. Comparable EBIT is expected to increase in 2017 compared with 2016.
Demand growth is expected to continue for most of UPM’s businesses, while demand decline is expected to continue for UPM Paper ENA. The focused growth projects continue to contribute to UPM’s performance.
Following a deflationary environment in recent years, 2017 is expected to show modest input cost inflation. UPM will continue measures to reduce fixed and variable costs to mitigate this.
Q4 2017 is expected to include more maintenance activity than Q3 2017 in UPM Biorefining and UPM Paper ENA.
plywood mill in Russia will enable us to grow in attractive plywood segments in a highly competitive way. Our ongoing growth projects in pulp and in self-adhesive labels are proceeding well and will strengthen our position in the growing markets in 2018. UPM Kymi pulp mill expansion is already starting production in the fourth quarter.
UPM aims to grow in new biomolecule businesses. I’m pleased to say that the Lappeenranta Biorefinery has now reached the designed capacity of renewable diesel and naphtha and generates a good financial return. The biorefinery was the first significant investment in new innovative wood-based products. Today we reported on our progress towards entering a new sustainable biochemicals business. After more than five years of research and piloting we have now entered the basic engineering phase, targeting industrial scale production of biochemicals in Germany.
When it comes to longer-term growth opportunities in pulp, the discussions continue with the Government of Uruguay concerning infrastructure development and other local prerequisites for a potential pulp mill investment.
Despite seasonal quarterly variations, we have consistently continued our improvement trend in profitability and our financial standing for several years. The third quarter marks the 18th consecutive quarter of improving profits. At the same time with the improving performance, we have proceeded step by step in our business transformation, and this work will continue.”
Jussi Pesonen, President and CEO, comments on the Q3 result:
This interim report is unaudited
3UPM interim report 1 January – 30 September 2017
Q116
Q117
Q416
Q316
Q216
Q217
Q317
400
320
240
160
80
0
15
12
9
6
3
0
% of salesEURm
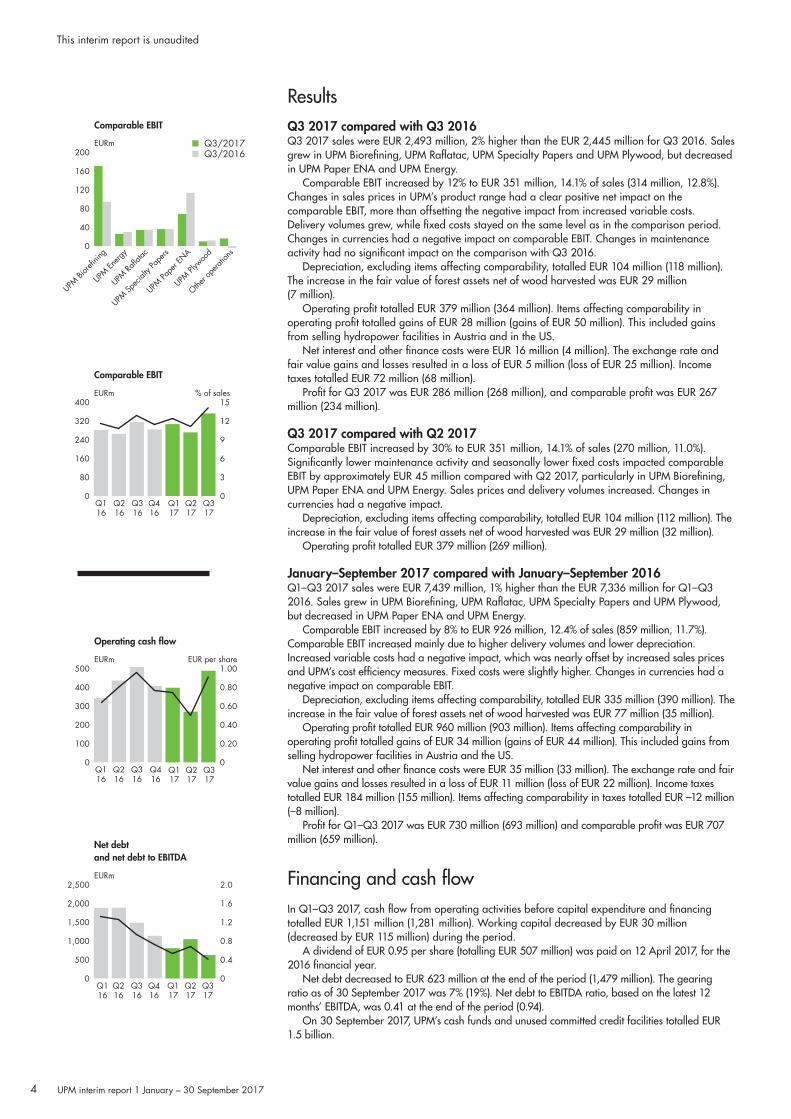
Comparable EBIT
Other o
perat
ions
UPM En
ergy
UPM Ra
flatac
UPM Sp
ecial
ty Pa
pers
UPM Pa
per E
NA
UPM Pl
ywoo
d
UPM Bi
orefin
ing
■ Q3/2017■ Q3/2016
EURm
Comparable EBIT
200
160
120
80
40
0
Q116
Q117
Q416
Q316
Q216
Q217
2,500
2,000
1,500
1,000
500
0
2.0
1.6
1.2
0.8
0.4
0
EURm
Net debtand net debt to EBITDA
Q317
Q116
Q117
Q416
Q316
Q216
Q217
Q317
500
400
300
200
100
0
1.00
0.80
0.60
0.40
0.20
0
EUR per shareEURm
Operating cash flow
ResultsQ3 2017 compared with Q3 2016Q3 2017 sales were EUR 2,493 million, 2% higher than the EUR 2,445 million for Q3 2016. Sales grew in UPM Biorefining, UPM Raflatac, UPM Specialty Papers and UPM Plywood, but decreased in UPM Paper ENA and UPM Energy.
Comparable EBIT increased by 12% to EUR 351 million, 14.1% of sales (314 million, 12.8%). Changes in sales prices in UPM’s product range had a clear positive net impact on the comparable EBIT, more than offsetting the negative impact from increased variable costs. Delivery volumes grew, while fixed costs stayed on the same level as in the comparison period. Changes in currencies had a negative impact on comparable EBIT. Changes in maintenance activity had no significant impact on the comparison with Q3 2016.
Depreciation, excluding items affecting comparability, totalled EUR 104 million (118 million). The increase in the fair value of forest assets net of wood harvested was EUR 29 million (7 million).
Operating profit totalled EUR 379 million (364 million). Items affecting comparability in operating profit totalled gains of EUR 28 million (gains of EUR 50 million). This included gains from selling hydropower facilities in Austria and in the US.
Net interest and other finance costs were EUR 16 million (4 million). The exchange rate and fair value gains and losses resulted in a loss of EUR 5 million (loss of EUR 25 million). Income taxes totalled EUR 72 million (68 million).
Profit for Q3 2017 was EUR 286 million (268 million), and comparable profit was EUR 267 million (234 million).
Q3 2017 compared with Q2 2017 Comparable EBIT increased by 30% to EUR 351 million, 14.1% of sales (270 million, 11.0%). Significantly lower maintenance activity and seasonally lower fixed costs impacted comparable EBIT by approximately EUR 45 million compared with Q2 2017, particularly in UPM Biorefining, UPM Paper ENA and UPM Energy. Sales prices and delivery volumes increased. Changes in currencies had a negative impact.
Depreciation, excluding items affecting comparability, totalled EUR 104 million (112 million). The increase in the fair value of forest assets net of wood harvested was EUR 29 million (32 million).
Operating profit totalled EUR 379 million (269 million).
January–September 2017 compared with January–September 2016 Q1–Q3 2017 sales were EUR 7,439 million, 1% higher than the EUR 7,336 million for Q1–Q3 2016. Sales grew in UPM Biorefining, UPM Raflatac, UPM Specialty Papers and UPM Plywood, but decreased in UPM Paper ENA and UPM Energy.
Comparable EBIT increased by 8% to EUR 926 million, 12.4% of sales (859 million, 11.7%). Comparable EBIT increased mainly due to higher delivery volumes and lower depreciation. Increased variable costs had a negative impact, which was nearly offset by increased sales prices and UPM’s cost efficiency measures. Fixed costs were slightly higher. Changes in currencies had a negative impact on comparable EBIT.
Depreciation, excluding items affecting comparability, totalled EUR 335 million (390 million). The increase in the fair value of forest assets net of wood harvested was EUR 77 million (35 million).
Operating profit totalled EUR 960 million (903 million). Items affecting comparability in operating profit totalled gains of EUR 34 million (gains of EUR 44 million). This included gains from selling hydropower facilities in Austria and the US.
Net interest and other finance costs were EUR 35 million (33 million). The exchange rate and fair value gains and losses resulted in a loss of EUR 11 million (loss of EUR 22 million). Income taxes totalled EUR 184 million (155 million). Items affecting comparability in taxes totalled EUR –12 million (–8 million).
Profit for Q1–Q3 2017 was EUR 730 million (693 million) and comparable profit was EUR 707 million (659 million).
Financing and cash flowIn Q1–Q3 2017, cash flow from operating activities before capital expenditure and financing totalled EUR 1,151 million (1,281 million). Working capital decreased by EUR 30 million (decreased by EUR 115 million) during the period.
A dividend of EUR 0.95 per share (totalling EUR 507 million) was paid on 12 April 2017, for the 2016 financial year.
Net debt decreased to EUR 623 million at the end of the period (1,479 million). The gearing ratio as of 30 September 2017 was 7% (19%). Net debt to EBITDA ratio, based on the latest 12 months’ EBITDA, was 0.41 at the end of the period (0.94).
On 30 September 2017, UPM’s cash funds and unused committed credit facilities totalled EUR 1.5 billion.
UPM interim report 1 January – 30 September 2017
This interim report is unaudited
4
Capital expenditureIn Q1–Q3 2017, capital expenditure totalled EUR 209 million, 2.8% of sales (231 million, 3.1% of sales). Total capital expenditure in 2017, excluding investments in shares, is estimated to be approximately EUR 300 million.
In July 2016, UPM announced it will invest EUR 98 million in UPM Kymi pulp mill in Finland to further strengthen its position as a supplier of bleached chemical pulp for growing consumer and industrial end-use segments like tissue and speciality paper as well as packaging papers and board. Kymi’s annual pulp production capacity is expected to increase to 870,000 tonnes of bleached northern softwood and birch pulp by the end of 2017. The investment will further improve UPM Kymi’s cost competitiveness and environmental performance.
In October 2016, UPM announced that it will build a new coating line at its label stock factory in Wroclaw, Poland. By introducing a new coating line together with related reel handling and slitting capacity additions, UPM Raflatac aims to meet the increasing demand for self-adhesive label stock in Europe. Production of the new line is scheduled to commence in the first half of 2018. The investment will total approximately EUR 35 million.
In April 2017, UPM announced that it will strengthen its position in the label market and invest approximately EUR 6 million in special label capacity in Tampere, Finland. A new special label product line will be built, focusing on small series of production runs. In addition, internal logistics will be strengthened. The new product line is expected to be completed by the end of the first quarter of 2018.
In June 2017, UPM announced it will further improve the efficiency and competitiveness of the UPM Kaukas pulp mill, by upgrading the mill’s fibre lines, recovery boiler, evaporation, bailing and wood handling with a EUR 30 million investment. Erection of the main equipment and start-up are scheduled for the spring of 2018. After this new project, annual production capacity of the UPM Kaukas pulp mill will increase by 30,000 tonnes to 770,000 tonnes of softwood and birch pulp in 2019.
In June 2013, UPM announced that it was participating in the share issue from Pohjolan Voima Oy to finance the Olkiluoto 3 nuclear power plant project. UPM’s share of the issue is EUR 119 million, of which EUR 26 million was paid in Q3 2017 and EUR 93 million has been paid over previous years.
PersonnelIn Q1–Q3 2017, UPM had an average of 19,594 employees (20,024). At the beginning of the year, the number of employees was 19,310 and at the end of Q3 2017 it was 19,335.
Uruguay platform developmentIn July 2016, UPM commenced discussions with the Government of Uruguay on the prerequisites for long-term industrial development in Uruguay, including infrastructure development.
The aim of these discussions during the first preparation phase is to find a mutual understanding on an investment agreement, which defines the local investment prerequisites and infrastructure development initiatives.
After the first phase, the second preparation phase would consist of a pre-engineering study and the permitting process. During this phase, significant progress would be expected in the implementation of the state-led infrastructure initiatives agreed upon in the first preparation phase. This phase is expected to take 1.5 to 2 years.
If these two preparation phases were successfully concluded, UPM would initiate the company’s regular process of analysing and preparing an investment decision about a potential pulp mill.
Biochemicals business development UPM formed UPM Biochemicals in 2013, by combining its biochemical-related business initiatives. UPM Biochemicals offers and develops innovative, sustainable and competitive wood-based biochemicals. The product segments are biochemicals, lignin products and biomedical products. Development is at the pre-commercial phase, with UPM actively developing and testing industrial applications to create mill-scale industrial concepts.
On 24 October UPM announced it evaluates potential of building a biorefinery in Frankfurt-Höchst in Germany. UPM now proceeds with detailed commercial and basic engineering study to confirm the attractiveness of the business case. The estimated duration of this phase is about 12 months. If all preparation phases are concluded successfully, UPM would initiate the company’s regular process of analysing and preparing an investment decision.
Events during January–September 2017On 31 January, UPM announced its renewed long-term financial targets. In the new targets, the business area return targets and the comparable ROE target were increased. Comparable EBIT growth was introduced as a new group-level target. A new financial policy on leverage based on net debt/EBITDA was introduced. The dividend policy based on cash flow remains unchanged. The long-term financial targets are presented in the UPM Annual Report 2016, page 17.
On 2 February, UPM announced that it was permanently closing down 305,000 tonnes of graphic paper capacity in Europe by the end of Q3 2017, consisting of paper machine 2 at UPM Augsburg, Germany and paper machine 3 at UPM Steyrermühl, Austria. The plan was originally announced in November 2016. The number of persons affected was 143 for UPM Augsburg and 125 for UPM Steyrermühl. The closure of both machines is expected to result in annual cost savings of approximately EUR 30 million.
On 22 March, UPM announced it had signed an agreement on the sale of its hydropower facilities in Schongau and Ettringen, Germany to erdgas schwaben GmbH.
On 30 March, UPM announced it had signed an agreement on the sale of its hydropower facilities in Steyrermühl, Austria to Energie AG. The transaction was completed in Q3 2017.
On 30 March, UPM announced that it had signed a letter of intent on forestry land sales and long-term wood supply with Tornator PLC. Tornator will sell a significant volume of wood to UPM mills in Eastern Finland each year, and UPM will sell 23,000 hectares of forestry land gradually during 2017 to Tornator in North Karelia, Finland.
On 18 April, UPM announced that Madison Paper Industries, a partnership of UPM and Northern SC Paper Corp., a subsidiary of The New York Times Company, has signed an agreement on the sale of its hydropower facilities to Eagle Creek Renewable Energy, LLC. The transaction was completed in Q3 2017.
Events after the balance sheet dateOn October 24, UPM announced plans to expand its Chudovo plywood mill in Russia. The project will raise the mill’s production capacity to 155,000 m3. The total investment will be about EUR 50 million.
On October 24, UPM announced it evaluates potential of building a biorefinery in Frankfurt-Höchst in Germany. UPM proceeds with detailed commercial and basic engineering study to confirm the attractiveness of the business case.
UPM interim report 1 January – 30 September 2017
This interim report is unaudited
5
Q116
Q117
Q416
Q316
Q216
Q217
Q317
200
160
120
80
40
0
30
24
16
8
4
0
% of salesEURm
Comparable EBITUPM Biorefining
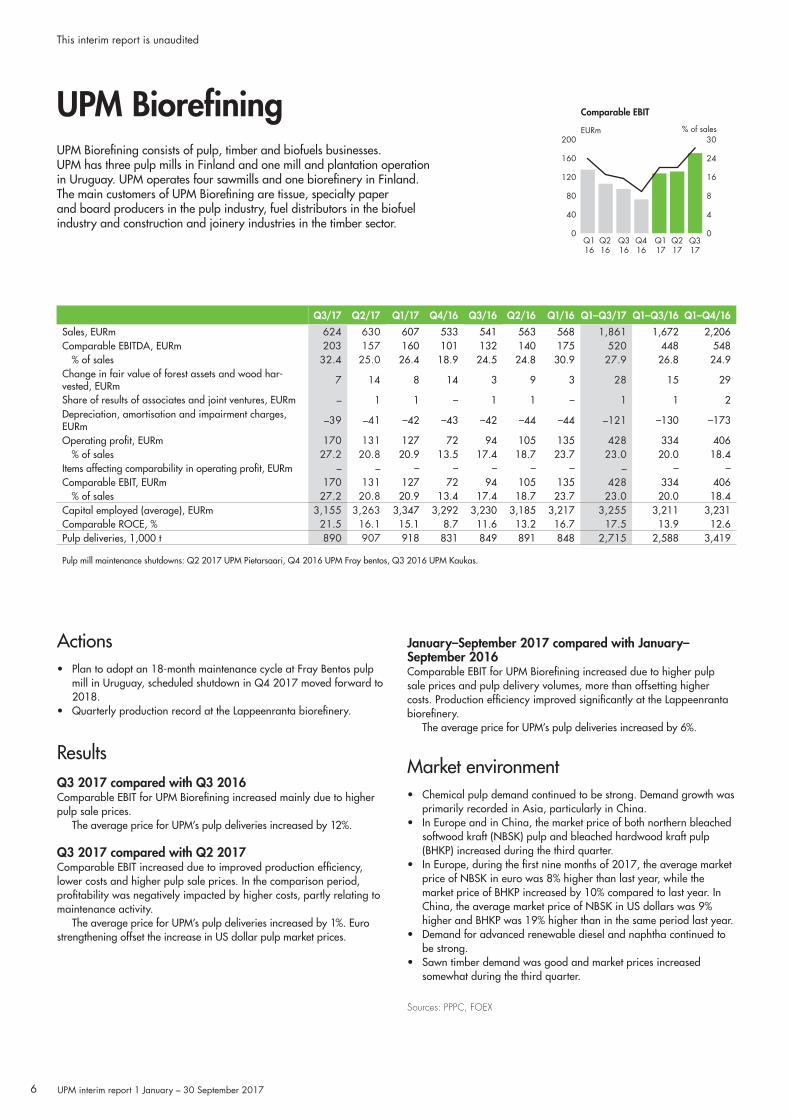
Q3/17 Q2/17 Q1/17 Q4/16 Q3/16 Q2/16 Q1/16 Q1–Q3/17 Q1–Q3/16 Q1–Q4/16
Sales, EURm 624 630 607 533 541 563 568 1,861 1,672 2,206Comparable EBITDA, EURm 203 157 160 101 132 140 175 520 448 548
% of sales 32.4 25.0 26.4 18.9 24.5 24.8 30.9 27.9 26.8 24.9Change in fair value of forest assets and wood har-vested, EURm 7 14 8 14 3 9 3 28 15 29
Share of results of associates and joint ventures, EURm – 1 1 – 1 1 – 1 1 2Depreciation, amortisation and impairment charges, EURm –39 –41 –42 –43 –42 –44 –44 –121 –130 –173
Operating profit, EURm 170 131 127 72 94 105 135 428 334 406% of sales 27.2 20.8 20.9 13.5 17.4 18.7 23.7 23.0 20.0 18.4
Items affecting comparability in operating profit, EURm – – – – – – – – – –Comparable EBIT, EURm 170 131 127 72 94 105 135 428 334 406
% of sales 27.2 20.8 20.9 13.4 17.4 18.7 23.7 23.0 20.0 18.4Capital employed (average), EURm 3,155 3,263 3,347 3,292 3,230 3,185 3,217 3,255 3,211 3,231Comparable ROCE, % 21.5 16.1 15.1 8.7 11.6 13.2 16.7 17.5 13.9 12.6Pulp deliveries, 1,000 t 890 907 918 831 849 891 848 2,715 2,588 3,419
Pulp mill maintenance shutdowns: Q2 2017 UPM Pietarsaari, Q4 2016 UPM Fray bentos, Q3 2016 UPM Kaukas.
Actions• Plan to adopt an 18-month maintenance cycle at Fray Bentos pulp
mill in Uruguay, scheduled shutdown in Q4 2017 moved forward to 2018.
• Quarterly production record at the Lappeenranta biorefinery.
ResultsQ3 2017 compared with Q3 2016 Comparable EBIT for UPM Biorefining increased mainly due to higher pulp sale prices.
The average price for UPM’s pulp deliveries increased by 12%.
Q3 2017 compared with Q2 2017Comparable EBIT increased due to improved production efficiency, lower costs and higher pulp sale prices. In the comparison period, profitability was negatively impacted by higher costs, partly relating to maintenance activity.
The average price for UPM’s pulp deliveries increased by 1%. Euro strengthening offset the increase in US dollar pulp market prices.
UPM Biorefining consists of pulp, timber and biofuels businesses. UPM has three pulp mills in Finland and one mill and plantation operation in Uruguay. UPM operates four sawmills and one biorefinery in Finland. The main customers of UPM Biorefining are tissue, specialty paper and board producers in the pulp industry, fuel distributors in the biofuel industry and construction and joinery industries in the timber sector.
January–September 2017 compared with January–September 2016 Comparable EBIT for UPM Biorefining increased due to higher pulp sale prices and pulp delivery volumes, more than offsetting higher costs. Production efficiency improved significantly at the Lappeenranta biorefinery.
The average price for UPM’s pulp deliveries increased by 6%.
Market environment• Chemical pulp demand continued to be strong. Demand growth was
primarily recorded in Asia, particularly in China.• In Europe and in China, the market price of both northern bleached
softwood kraft (NBSK) pulp and bleached hardwood kraft pulp (BHKP) increased during the third quarter.
• In Europe, during the first nine months of 2017, the average market price of NBSK in euro was 8% higher than last year, while the market price of BHKP increased by 10% compared to last year. In China, the average market price of NBSK in US dollars was 9% higher and BHKP was 19% higher than in the same period last year.
• Demand for advanced renewable diesel and naphtha continued to be strong.
• Sawn timber demand was good and market prices increased somewhat during the third quarter.
Sources: PPPC, FOEX
UPM interim report 1 January – 30 September 2017
This interim report is unaudited
6
Q116
Q117
Q416
Q316
Q216
Q217
50
40
30
20
10
0
50
40
30
20
10
0
% of salesEURm
Comparable EBIT
Q317
UPM Energy
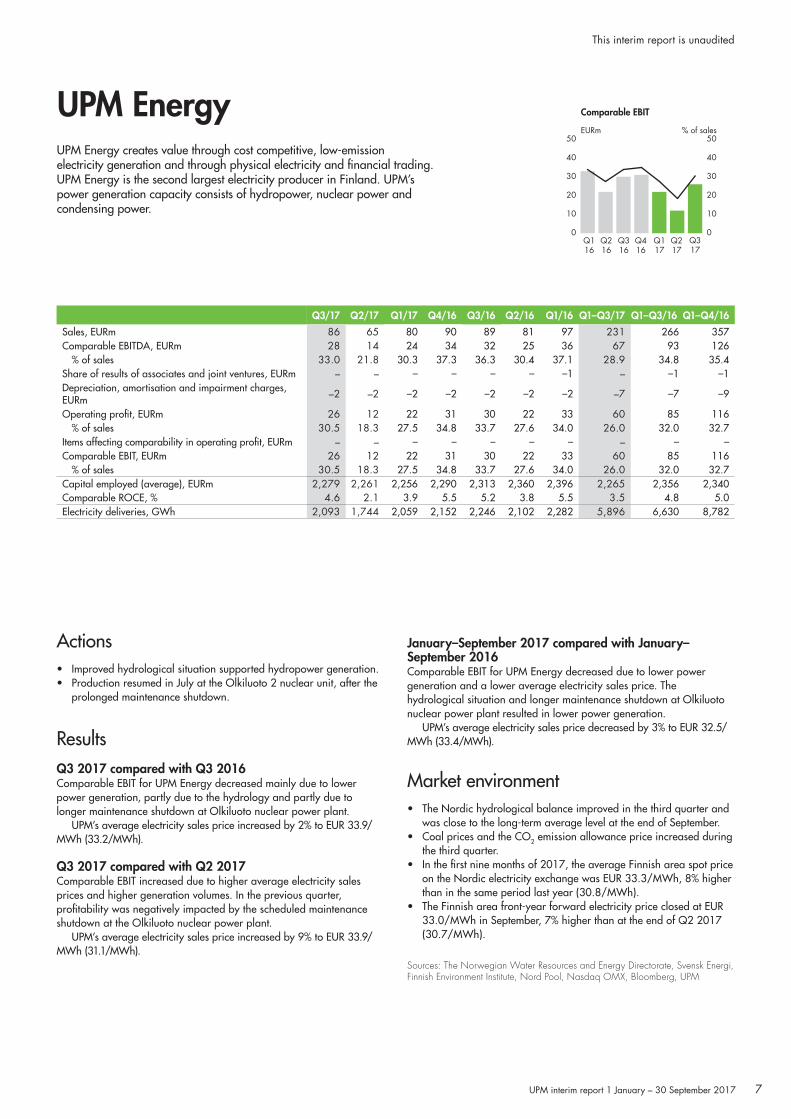
Q3/17 Q2/17 Q1/17 Q4/16 Q3/16 Q2/16 Q1/16 Q1–Q3/17 Q1–Q3/16 Q1–Q4/16
Sales, EURm 86 65 80 90 89 81 97 231 266 357Comparable EBITDA, EURm 28 14 24 34 32 25 36 67 93 126
% of sales 33.0 21.8 30.3 37.3 36.3 30.4 37.1 28.9 34.8 35.4Share of results of associates and joint ventures, EURm – – – – – – –1 – –1 –1Depreciation, amortisation and impairment charges, EURm –2 –2 –2 –2 –2 –2 –2 –7 –7 –9
Operating profit, EURm 26 12 22 31 30 22 33 60 85 116% of sales 30.5 18.3 27.5 34.8 33.7 27.6 34.0 26.0 32.0 32.7
Items affecting comparability in operating profit, EURm – – – – – – – – – –Comparable EBIT, EURm 26 12 22 31 30 22 33 60 85 116
% of sales 30.5 18.3 27.5 34.8 33.7 27.6 34.0 26.0 32.0 32.7Capital employed (average), EURm 2,279 2,261 2,256 2,290 2,313 2,360 2,396 2,265 2,356 2,340Comparable ROCE, % 4.6 2.1 3.9 5.5 5.2 3.8 5.5 3.5 4.8 5.0Electricity deliveries, GWh 2,093 1,744 2,059 2,152 2,246 2,102 2,282 5,896 6,630 8,782
Actions• Improved hydrological situation supported hydropower generation.• Production resumed in July at the Olkiluoto 2 nuclear unit, after the
prolonged maintenance shutdown.
ResultsQ3 2017 compared with Q3 2016 Comparable EBIT for UPM Energy decreased mainly due to lower power generation, partly due to the hydrology and partly due to longer maintenance shutdown at Olkiluoto nuclear power plant.
UPM’s average electricity sales price increased by 2% to EUR 33.9/MWh (33.2/MWh).
Q3 2017 compared with Q2 2017Comparable EBIT increased due to higher average electricity sales prices and higher generation volumes. In the previous quarter, profitability was negatively impacted by the scheduled maintenance shutdown at the Olkiluoto nuclear power plant.
UPM’s average electricity sales price increased by 9% to EUR 33.9/MWh (31.1/MWh).
UPM Energy creates value through cost competitive, low-emission electricity generation and through physical electricity and financial trading. UPM Energy is the second largest electricity producer in Finland. UPM’s power generation capacity consists of hydropower, nuclear power and condensing power.
January–September 2017 compared with January–September 2016 Comparable EBIT for UPM Energy decreased due to lower power generation and a lower average electricity sales price. The hydrological situation and longer maintenance shutdown at Olkiluoto nuclear power plant resulted in lower power generation.
UPM’s average electricity sales price decreased by 3% to EUR 32.5/MWh (33.4/MWh).
Market environment• The Nordic hydrological balance improved in the third quarter and
was close to the long-term average level at the end of September. • Coal prices and the CO2 emission allowance price increased during
the third quarter. • In the first nine months of 2017, the average Finnish area spot price
on the Nordic electricity exchange was EUR 33.3/MWh, 8% higher than in the same period last year (30.8/MWh).
• The Finnish area front-year forward electricity price closed at EUR 33.0/MWh in September, 7% higher than at the end of Q2 2017 (30.7/MWh).
Sources: The Norwegian Water Resources and Energy Directorate, Svensk Energi, Finnish Environment Institute, Nord Pool, Nasdaq OMX, Bloomberg, UPM
UPM interim report 1 January – 30 September 2017
This interim report is unaudited
7
Q116
Q216
Q316
Q416
Q117
Q217
Q317
40
32
24
16
8
0
Comparable EBIT
15
12
9
6
3
0
% of salesEURm
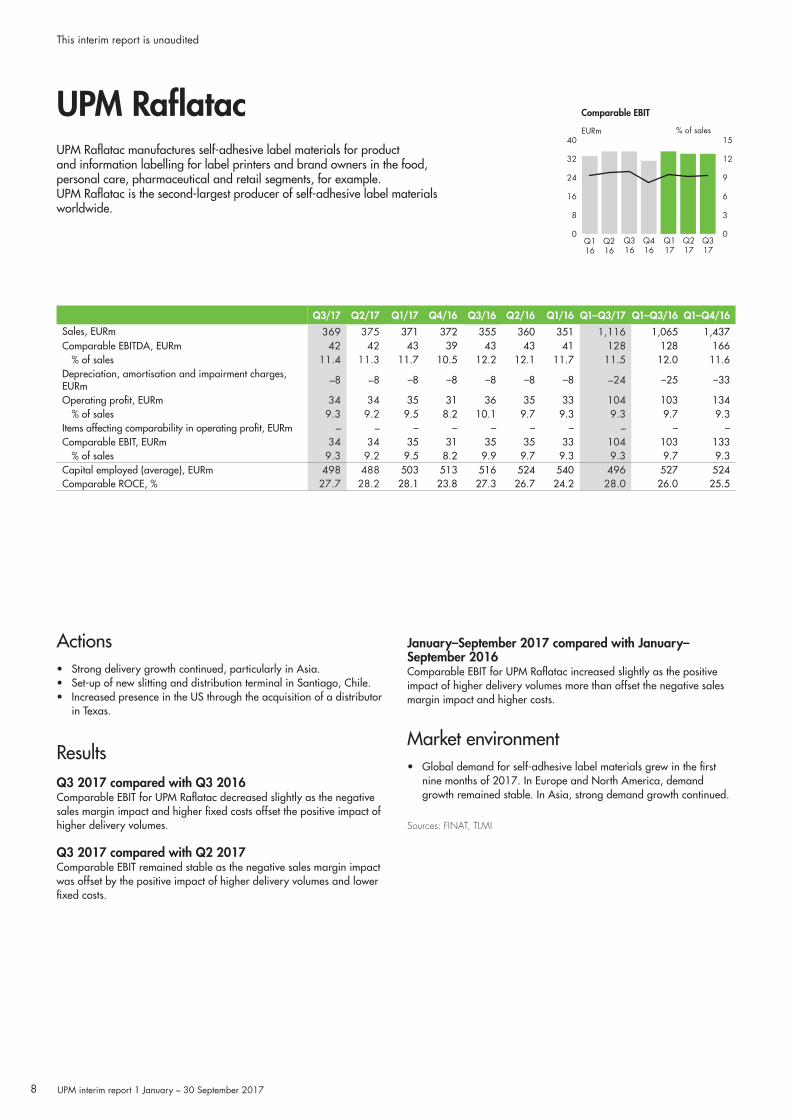
Q3/17 Q2/17 Q1/17 Q4/16 Q3/16 Q2/16 Q1/16 Q1–Q3/17 Q1–Q3/16 Q1–Q4/16
Sales, EURm 369 375 371 372 355 360 351 1,116 1,065 1,437Comparable EBITDA, EURm 42 42 43 39 43 43 41 128 128 166
% of sales 11.4 11.3 11.7 10.5 12.2 12.1 11.7 11.5 12.0 11.6Depreciation, amortisation and impairment charges, EURm –8 –8 –8 –8 –8 –8 –8 –24 –25 –33
Operating profit, EURm 34 34 35 31 36 35 33 104 103 134% of sales 9.3 9.2 9.5 8.2 10.1 9.7 9.3 9.3 9.7 9.3
Items affecting comparability in operating profit, EURm – – – – – – – – – –Comparable EBIT, EURm 34 34 35 31 35 35 33 104 103 133
% of sales 9.3 9.2 9.5 8.2 9.9 9.7 9.3 9.3 9.7 9.3Capital employed (average), EURm 498 488 503 513 516 524 540 496 527 524Comparable ROCE, % 27.7 28.2 28.1 23.8 27.3 26.7 24.2 28.0 26.0 25.5
UPM RaflatacUPM Raflatac manufactures self-adhesive label materials for product and information labelling for label printers and brand owners in the food, personal care, pharmaceutical and retail segments, for example. UPM Raflatac is the second-largest producer of self-adhesive label materials worldwide.
Actions• Strong delivery growth continued, particularly in Asia.• Set-up of new slitting and distribution terminal in Santiago, Chile.• Increased presence in the US through the acquisition of a distributor
in Texas.
ResultsQ3 2017 compared with Q3 2016 Comparable EBIT for UPM Raflatac decreased slightly as the negative sales margin impact and higher fixed costs offset the positive impact of higher delivery volumes.
Q3 2017 compared with Q2 2017Comparable EBIT remained stable as the negative sales margin impact was offset by the positive impact of higher delivery volumes and lower fixed costs.
January–September 2017 compared with January–September 2016 Comparable EBIT for UPM Raflatac increased slightly as the positive impact of higher delivery volumes more than offset the negative sales margin impact and higher costs.
Market environment• Global demand for self-adhesive label materials grew in the first
nine months of 2017. In Europe and North America, demand growth remained stable. In Asia, strong demand growth continued.
Sources: FINAT, TLMI
UPM interim report 1 January – 30 September 2017
This interim report is unaudited
8
Q116
Q216
Q316
Q416
Q117
Q217
Q317
40
32
24
16
8
0
Comparable EBIT
15
12
9
6
3
0
% of salesEURm
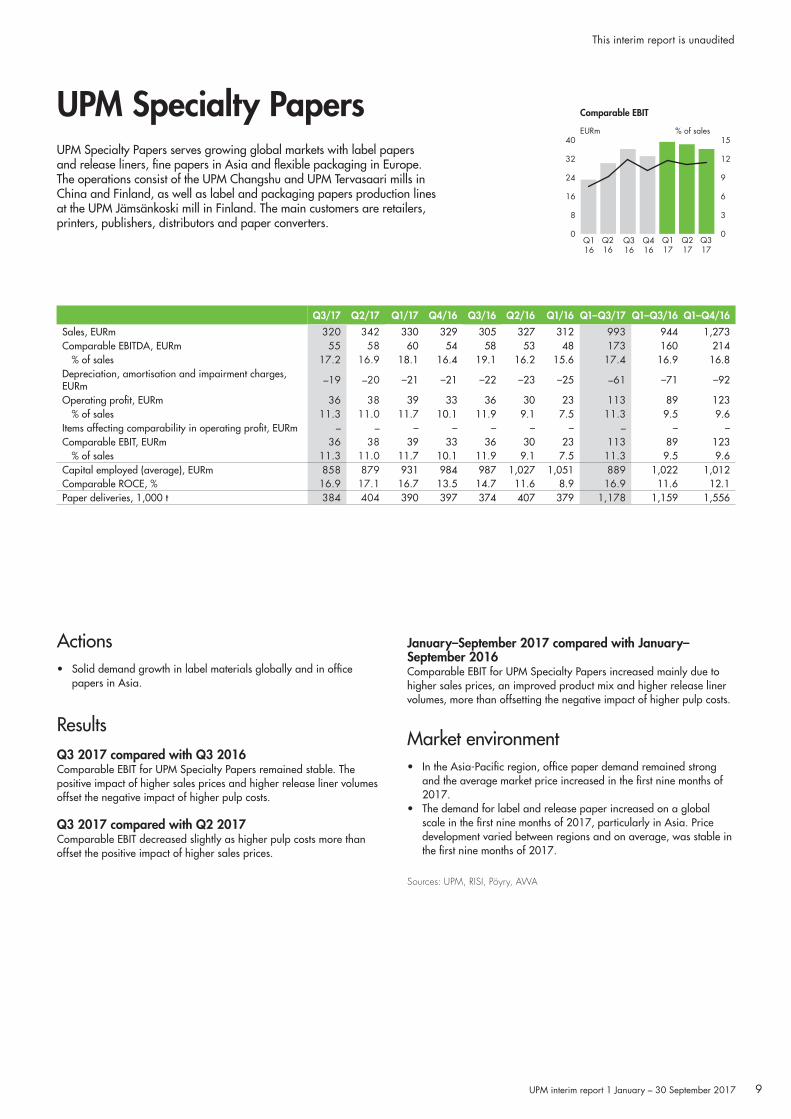
Q3/17 Q2/17 Q1/17 Q4/16 Q3/16 Q2/16 Q1/16 Q1–Q3/17 Q1–Q3/16 Q1–Q4/16
Sales, EURm 320 342 330 329 305 327 312 993 944 1,273Comparable EBITDA, EURm 55 58 60 54 58 53 48 173 160 214
% of sales 17.2 16.9 18.1 16.4 19.1 16.2 15.6 17.4 16.9 16.8Depreciation, amortisation and impairment charges, EURm –19 –20 –21 –21 –22 –23 –25 –61 –71 –92
Operating profit, EURm 36 38 39 33 36 30 23 113 89 123% of sales 11.3 11.0 11.7 10.1 11.9 9.1 7.5 11.3 9.5 9.6
Items affecting comparability in operating profit, EURm – – – – – – – – – –Comparable EBIT, EURm 36 38 39 33 36 30 23 113 89 123
% of sales 11.3 11.0 11.7 10.1 11.9 9.1 7.5 11.3 9.5 9.6Capital employed (average), EURm 858 879 931 984 987 1,027 1,051 889 1,022 1,012Comparable ROCE, % 16.9 17.1 16.7 13.5 14.7 11.6 8.9 16.9 11.6 12.1Paper deliveries, 1,000 t 384 404 390 397 374 407 379 1,178 1,159 1,556
UPM Specialty PapersUPM Specialty Papers serves growing global markets with label papers and release liners, fine papers in Asia and flexible packaging in Europe. The operations consist of the UPM Changshu and UPM Tervasaari mills in China and Finland, as well as label and packaging papers production lines at the UPM Jämsänkoski mill in Finland. The main customers are retailers, printers, publishers, distributors and paper converters.
Actions• Solid demand growth in label materials globally and in office
papers in Asia.
ResultsQ3 2017 compared with Q3 2016 Comparable EBIT for UPM Specialty Papers remained stable. The positive impact of higher sales prices and higher release liner volumes offset the negative impact of higher pulp costs.
Q3 2017 compared with Q2 2017Comparable EBIT decreased slightly as higher pulp costs more than offset the positive impact of higher sales prices.
January–September 2017 compared with January–September 2016 Comparable EBIT for UPM Specialty Papers increased mainly due to higher sales prices, an improved product mix and higher release liner volumes, more than offsetting the negative impact of higher pulp costs.
Market environment• In the Asia-Pacific region, office paper demand remained strong
and the average market price increased in the first nine months of 2017.
• The demand for label and release paper increased on a global scale in the first nine months of 2017, particularly in Asia. Price development varied between regions and on average, was stable in the first nine months of 2017.
Sources: UPM, RISI, Pöyry, AWA
UPM interim report 1 January – 30 September 2017
This interim report is unaudited
9
Q116
Q216
Q316
Q416
Q117
Q217
Q317
125
100
75
50
25
0
Comparable EBIT
% of salesEURm15
12
9
6
3
0
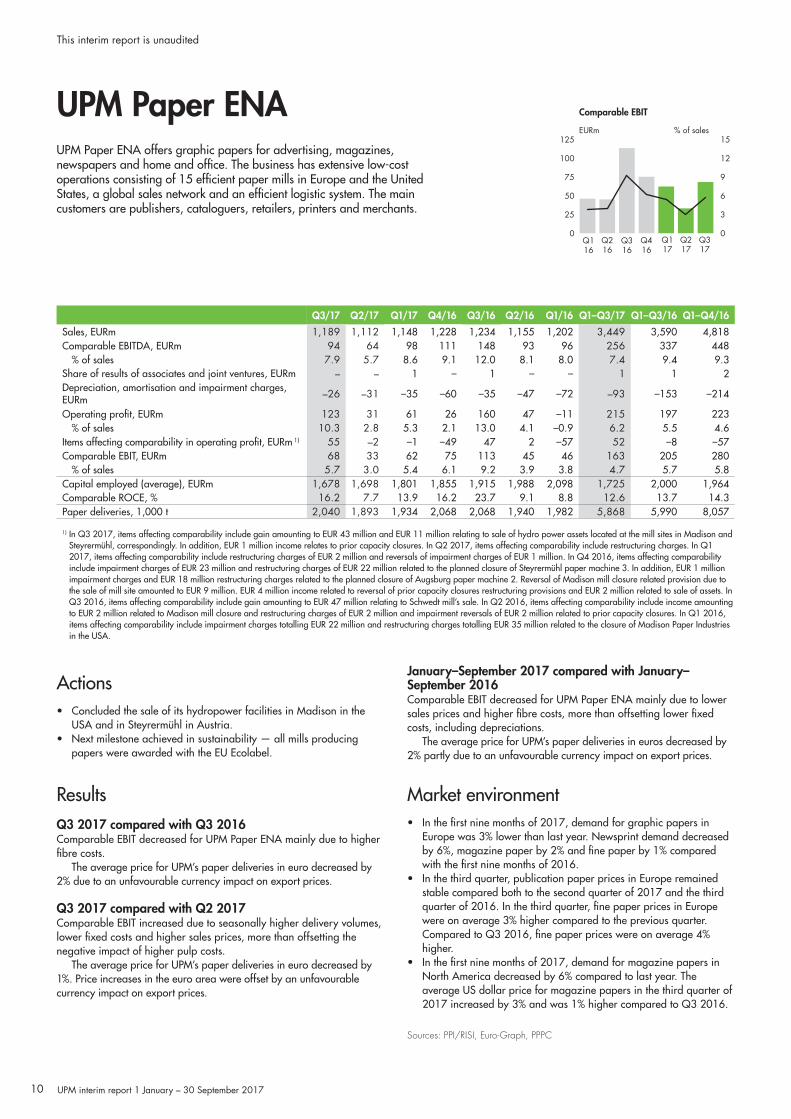
UPM Paper ENAUPM Paper ENA offers graphic papers for advertising, magazines, newspapers and home and office. The business has extensive low-cost operations consisting of 15 efficient paper mills in Europe and the United States, a global sales network and an efficient logistic system. The main customers are publishers, cataloguers, retailers, printers and merchants.
Q3/17 Q2/17 Q1/17 Q4/16 Q3/16 Q2/16 Q1/16 Q1–Q3/17 Q1–Q3/16 Q1–Q4/16
Sales, EURm 1,189 1,112 1,148 1,228 1,234 1,155 1,202 3,449 3,590 4,818Comparable EBITDA, EURm 94 64 98 111 148 93 96 256 337 448
% of sales 7.9 5.7 8.6 9.1 12.0 8.1 8.0 7.4 9.4 9.3Share of results of associates and joint ventures, EURm – – 1 – 1 – – 1 1 2Depreciation, amortisation and impairment charges, EURm –26 –31 –35 –60 –35 –47 –72 –93 –153 –214
Operating profit, EURm 123 31 61 26 160 47 –11 215 197 223% of sales 10.3 2.8 5.3 2.1 13.0 4.1 –0.9 6.2 5.5 4.6
Items affecting comparability in operating profit, EURm 1) 55 –2 –1 –49 47 2 –57 52 –8 –57Comparable EBIT, EURm 68 33 62 75 113 45 46 163 205 280
% of sales 5.7 3.0 5.4 6.1 9.2 3.9 3.8 4.7 5.7 5.8Capital employed (average), EURm 1,678 1,698 1,801 1,855 1,915 1,988 2,098 1,725 2,000 1,964Comparable ROCE, % 16.2 7.7 13.9 16.2 23.7 9.1 8.8 12.6 13.7 14.3Paper deliveries, 1,000 t 2,040 1,893 1,934 2,068 2,068 1,940 1,982 5,868 5,990 8,057
1) In Q3 2017, items affecting comparability include gain amounting to EUR 43 million and EUR 11 million relating to sale of hydro power assets located at the mill sites in Madison and Steyrermühl, correspondingly. In addition, EUR 1 million income relates to prior capacity closures. In Q2 2017, items affecting comparability include restructuring charges. In Q1 2017, items affecting comparability include restructuring charges of EUR 2 million and reversals of impairment charges of EUR 1 million. In Q4 2016, items affecting comparability include impairment charges of EUR 23 million and restructuring charges of EUR 22 million related to the planned closure of Steyrermühl paper machine 3. In addition, EUR 1 million impairment charges and EUR 18 million restructuring charges related to the planned closure of Augsburg paper machine 2. Reversal of Madison mill closure related provision due to the sale of mill site amounted to EUR 9 million. EUR 4 million income related to reversal of prior capacity closures restructuring provisions and EUR 2 million related to sale of assets. In Q3 2016, items affecting comparability include gain amounting to EUR 47 million relating to Schwedt mill’s sale. In Q2 2016, items affecting comparability include income amounting to EUR 2 million related to Madison mill closure and restructuring charges of EUR 2 million and impairment reversals of EUR 2 million related to prior capacity closures. In Q1 2016, items affecting comparability include impairment charges totalling EUR 22 million and restructuring charges totalling EUR 35 million related to the closure of Madison Paper Industries in the USA.
Actions• Concluded the sale of its hydropower facilities in Madison in the
USA and in Steyrermühl in Austria. • Next milestone achieved in sustainability — all mills producing
papers were awarded with the EU Ecolabel.
ResultsQ3 2017 compared with Q3 2016 Comparable EBIT decreased for UPM Paper ENA mainly due to higher fibre costs.
The average price for UPM’s paper deliveries in euro decreased by 2% due to an unfavourable currency impact on export prices.
Q3 2017 compared with Q2 2017Comparable EBIT increased due to seasonally higher delivery volumes, lower fixed costs and higher sales prices, more than offsetting the negative impact of higher pulp costs.
The average price for UPM’s paper deliveries in euro decreased by 1%. Price increases in the euro area were offset by an unfavourable currency impact on export prices.
January–September 2017 compared with January–September 2016 Comparable EBIT decreased for UPM Paper ENA mainly due to lower sales prices and higher fibre costs, more than offsetting lower fixed costs, including depreciations.
The average price for UPM’s paper deliveries in euros decreased by 2% partly due to an unfavourable currency impact on export prices.
Market environment• In the first nine months of 2017, demand for graphic papers in
Europe was 3% lower than last year. Newsprint demand decreased by 6%, magazine paper by 2% and fine paper by 1% compared with the first nine months of 2016.
• In the third quarter, publication paper prices in Europe remained stable compared both to the second quarter of 2017 and the third quarter of 2016. In the third quarter, fine paper prices in Europe were on average 3% higher compared to the previous quarter. Compared to Q3 2016, fine paper prices were on average 4% higher.
• In the first nine months of 2017, demand for magazine papers in North America decreased by 6% compared to last year. The average US dollar price for magazine papers in the third quarter of 2017 increased by 3% and was 1% higher compared to Q3 2016.
Sources: PPI/RISI, Euro-Graph, PPPC
UPM interim report 1 January – 30 September 2017
This interim report is unaudited
10
Q116
Q216
Q316
Q416
Q117
Q217
Q317
25
20
15
10
5
0
Comparable EBIT
25
20
15
10
5
0
% of salesEURm
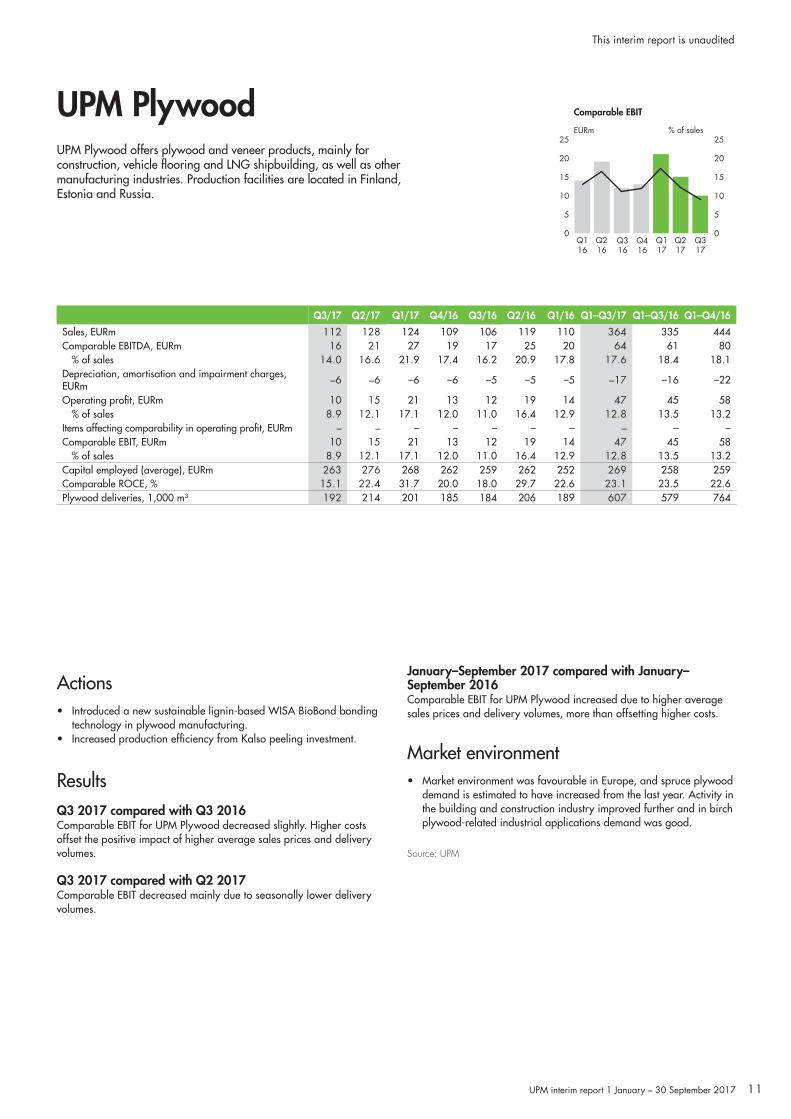
UPM Plywood
Q3/17 Q2/17 Q1/17 Q4/16 Q3/16 Q2/16 Q1/16 Q1–Q3/17 Q1–Q3/16 Q1–Q4/16
Sales, EURm 112 128 124 109 106 119 110 364 335 444Comparable EBITDA, EURm 16 21 27 19 17 25 20 64 61 80
% of sales 14.0 16.6 21.9 17.4 16.2 20.9 17.8 17.6 18.4 18.1Depreciation, amortisation and impairment charges, EURm –6 –6 –6 –6 –5 –5 –5 –17 –16 –22
Operating profit, EURm 10 15 21 13 12 19 14 47 45 58% of sales 8.9 12.1 17.1 12.0 11.0 16.4 12.9 12.8 13.5 13.2
Items affecting comparability in operating profit, EURm – – – – – – – – – –Comparable EBIT, EURm 10 15 21 13 12 19 14 47 45 58
% of sales 8.9 12.1 17.1 12.0 11.0 16.4 12.9 12.8 13.5 13.2Capital employed (average), EURm 263 276 268 262 259 262 252 269 258 259Comparable ROCE, % 15.1 22.4 31.7 20.0 18.0 29.7 22.6 23.1 23.5 22.6Plywood deliveries, 1,000 m3 192 214 201 185 184 206 189 607 579 764
UPM Plywood offers plywood and veneer products, mainly for construction, vehicle flooring and LNG shipbuilding, as well as other manufacturing industries. Production facilities are located in Finland, Estonia and Russia.
Actions• Introduced a new sustainable lignin-based WISA BioBond bonding
technology in plywood manufacturing.• Increased production efficiency from Kalso peeling investment.
ResultsQ3 2017 compared with Q3 2016Comparable EBIT for UPM Plywood decreased slightly. Higher costs offset the positive impact of higher average sales prices and delivery volumes.
Q3 2017 compared with Q2 2017Comparable EBIT decreased mainly due to seasonally lower delivery volumes.
January–September 2017 compared with January–September 2016 Comparable EBIT for UPM Plywood increased due to higher average sales prices and delivery volumes, more than offsetting higher costs.
Market environment• Market environment was favourable in Europe, and spruce plywood
demand is estimated to have increased from the last year. Activity in the building and construction industry improved further and in birch plywood-related industrial applications demand was good.
Source: UPM
UPM interim report 1 January – 30 September 2017
This interim report is unaudited
11
Q116
Q216
Q316
Q416
Q117
Q217
Q317
30
24
18
12
6
0
Comparable EBIT
EURm
Other operations
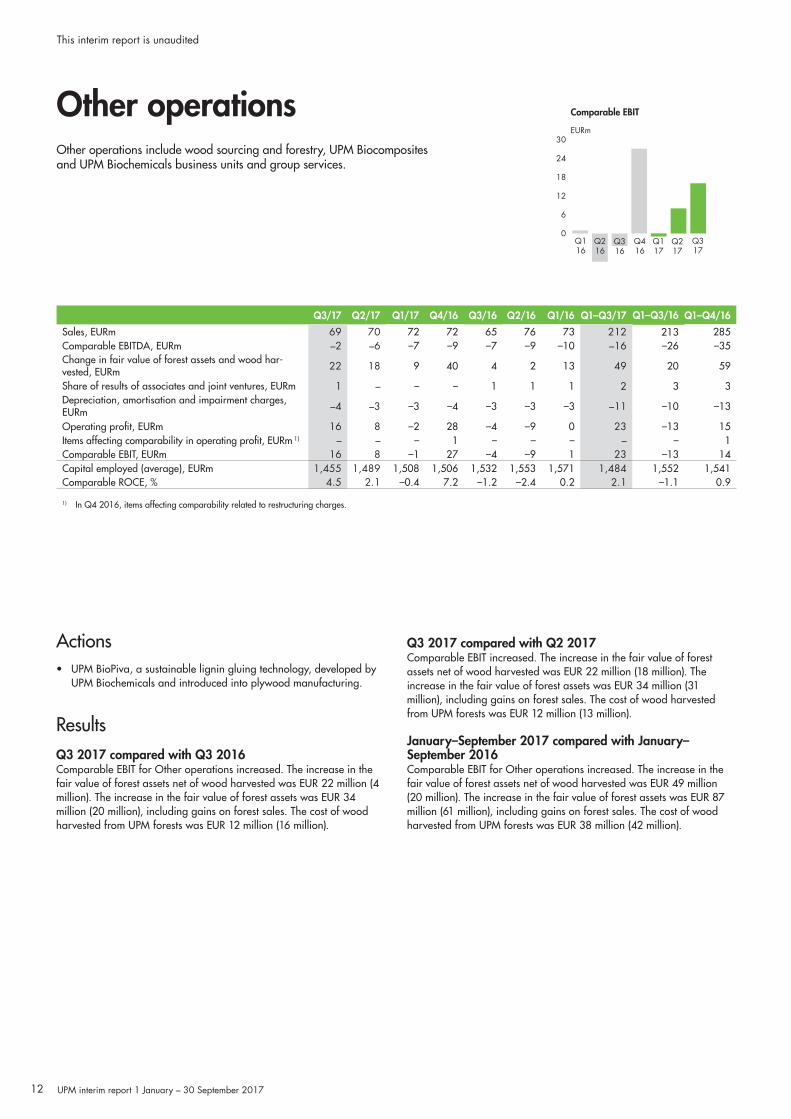
Q3/17 Q2/17 Q1/17 Q4/16 Q3/16 Q2/16 Q1/16 Q1–Q3/17 Q1–Q3/16 Q1–Q4/16
Sales, EURm 69 70 72 72 65 76 73 212 213 285Comparable EBITDA, EURm –2 –6 –7 –9 –7 –9 –10 –16 –26 –35Change in fair value of forest assets and wood har-vested, EURm 22 18 9 40 4 2 13 49 20 59
Share of results of associates and joint ventures, EURm 1 – – – 1 1 1 2 3 3Depreciation, amortisation and impairment charges, EURm –4 –3 –3 –4 –3 –3 –3 –11 –10 –13
Operating profit, EURm 16 8 –2 28 –4 –9 0 23 –13 15Items affecting comparability in operating profit, EURm 1) – – – 1 – – – – – 1Comparable EBIT, EURm 16 8 –1 27 –4 –9 1 23 –13 14Capital employed (average), EURm 1,455 1,489 1,508 1,506 1,532 1,553 1,571 1,484 1,552 1,541Comparable ROCE, % 4.5 2.1 –0.4 7.2 –1.2 –2.4 0.2 2.1 –1.1 0.9
1) In Q4 2016, items affecting comparability related to restructuring charges.
Other operations include wood sourcing and forestry, UPM Biocomposites and UPM Biochemicals business units and group services.
Actions• UPM BioPiva, a sustainable lignin gluing technology, developed by
UPM Biochemicals and introduced into plywood manufacturing.
ResultsQ3 2017 compared with Q3 2016 Comparable EBIT for Other operations increased. The increase in the fair value of forest assets net of wood harvested was EUR 22 million (4 million). The increase in the fair value of forest assets was EUR 34 million (20 million), including gains on forest sales. The cost of wood harvested from UPM forests was EUR 12 million (16 million).
Q3 2017 compared with Q2 2017Comparable EBIT increased. The increase in the fair value of forest assets net of wood harvested was EUR 22 million (18 million). The increase in the fair value of forest assets was EUR 34 million (31 million), including gains on forest sales. The cost of wood harvested from UPM forests was EUR 12 million (13 million).
January–September 2017 compared with January–September 2016 Comparable EBIT for Other operations increased. The increase in the fair value of forest assets net of wood harvested was EUR 49 million (20 million). The increase in the fair value of forest assets was EUR 87 million (61 million), including gains on forest sales. The cost of wood harvested from UPM forests was EUR 38 million (42 million).
UPM interim report 1 January – 30 September 2017
This interim report is unaudited
12
Risks and near-term uncertaintiesThe main uncertainties in UPM’s earnings relate to sales prices and delivery volumes of the group’s products, as well as to changes to the main input cost items and currency exchange rates. Most of these items depend on general economic developments.
The UK’s EU referendum to decide whether the UK should leave or remain in the EU was held on 23 June 2016. The Leave side won the referendum. This has increased uncertainty and risks related to economic growth, especially in the UK and the EU. The EU is the most significant market for UPM, representing 59% of the company’s sales in 2016. The UK represented 7% of UPM’s sales.
Changes to the monetary policies of major central banks may significantly impact various currencies that directly or indirectly affect UPM. The UK’s intention to leave the EU has also increased uncertainty related to currencies.
There are uncertainties regarding developing economies, including China, which may significantly influence the overall global economy and many of UPM’s product markets in particular.
In the global chemical pulp market, new production lines entering the market may have a clear negative impact on pulp prices.
The input cost environment has been benign for UPM in the past couple of years. Recent changes in many commodities indicate that there is a risk of cost inflation in the operating environment.
Teollisuuden Voima Oyj (TVO) is in the process of constructing a third nuclear power plant unit, OL3 EPR, at the Olkiluoto site (OL3). UPM participates in OL3 through its shareholding in Pohjolan Voima Oyj (PVO), which is the majority shareholder in TVO. UPM’s indirect share of OL3 is approximately 31%. The OL3 plant supplier, a consortium consisting of AREVA GmbH, AREVA NP SAS and Siemens AG (the Supplier), is constructing OL3 as a turnkey project.
The start of regular electricity production, originally scheduled for April 2009, has been revised several times by the Supplier. According to a public statement by TVO in October 2017, TVO received information on the Supplier’s schedule rebaseline review for OL3 project completion, according to which the start of regular electricity production at OL3 will take place in May 2019. Furthermore, TVO has expressed concerns regarding the pending restructuring of AREVA Group, involving a transfer of the operations of AREVA NP to a new company, the majority owner of which is going to be EDF, and the potential consequences for the performance of the OL3 contract.
According to public statements by TVO, no assurance can be given that further delays, which could have a material adverse effect on TVO’s business and financial position, will not occur prior to completion of the OL3 project. As a consequence, further delays could have an adverse impact on PVO’s business and financial position, the fair value of UPM’s energy shareholdings in PVO and/or the cost of energy sourced from OL3 when completed.
The main earnings sensitivities and the group’s cost structure are presented on page 115 of the Annual Report 2016. Risks and opportunities are discussed on pages 22–23 and risks and risk management are presented on pages 98–99.
SharesIn Q1–Q3 2017, UPM shares worth EUR 6,204 million (4,932 million) in total were traded on the NASDAQ Helsinki stock exchange. This is estimated to represent approximately two thirds of all trading volumes in UPM shares. The highest listing was EUR 26.53 in July and the lowest was EUR 20.82 in January.
The company’s ADSs are traded on the US over-the-counter (OTC) market under a Level 1-sponsored American Depositary Receipt programme.
The Annual General Meeting held on 29 March 2017 authorised the Board of Directors to decide on the repurchase of a maximum of 50,000,000 of the company’s own shares. The authorisation will be valid for 18 months from the date of the AGM resolution.
The Annual General Meeting held on 7 April 2016 authorised the Board of Directors to decide on the issuance of new shares, the transfer of treasury shares and the issuance of special rights entitling to shares in proportion to the shareholders’ existing holdings in the company, or in a directed share issue, deviating from the shareholders’ pre-emptive subscription rights. The Board of Directors may also decide on a share issue without payment to the company itself. The aggregate maximum number of new shares that may be issued and treasury shares that may be transferred is 25,000,000, which also includes the number of shares that can be received on the basis of the special rights. The authorisation will be valid for three years from the date of the AGM resolution.
Aside from the above, the Board of Directors has no current authorisation to issue shares, convertible bonds or share options.
The number of shares entered in the Trade Register on 30 September 2017 was 533,735,699. Through the issuance authorisation, the number of shares may increase to a maximum of 558,735,699.
On 30 September 2017, the company held 411,653 of its own shares, representing approximately 0.08% of the total number of company shares and voting rights. The Board of Directors may decide to retain, transfer or cancel the treasury shares.
LitigationGroup companiesIn 2011, Metsähallitus (a Finnish state enterprise, which administers state-owned land) filed a claim for damages against UPM and two other Finnish forest companies. The claim relates to the decision of December 2009 in which the Finnish Market Court held that the defendants had breached competition rules in the Finnish roundwood market. In addition to Metsähallitus, private forest owners, and companies, as well as municipalities and parishes, have filed claims relating to the Market Court decision. The capital amount of all of the claims totals currently EUR 150.4 million in the aggregate jointly and severally against UPM and two other companies; alternatively and individually against UPM, this represents EUR 26.7 million in the aggregate. In addition to the claims on capital amounts, the claimants are also requesting compensation relating to value added tax and interests. In June 2016, the District Court passed a judgment rejecting the damages claim of Metsähallitus against UPM, and the other two Finnish forest companies. The District Court ordered Metsähallitus to pay UPM compensation for legal expenses. Metsähallitus has appealed the District Court judgment to the Court of Appeal. The capital amount of Metsähallitus’ claim is currently in total EUR 124.9 million, of which EUR 17.6 million is based on agreements between Metsähallitus and UPM. In August and September 2017, the District Court passed first 69 judgements in the private forest owners’ claims rejecting all the claims and ordering the claimants to compensate legal expenses of the defendants. UPM considers all the claims unfounded in their entirety. No provision has been made in UPM’s accounts for any of these claims.
In 2012, UPM commenced arbitration proceedings against Metsäliitto Cooperative and Metsä Board Corporation due to their breaches of UPM’s tag-along right under the shareholders’ agreement concerning Metsä Fibre Oy in connection with the sale of shares in Metsä Fibre to Itochu Corporation. UPM claimed jointly from Metsäliitto and Metsä Board a capital amount of EUR 58.5 million. Metsäliitto and Metsä Board had sold a 24.9% holding in Metsä Fibre to Itochu Corporation for EUR 472 million. In connection with the transaction with Itochu, Metsäliitto had exercised a call option to purchase UPM’s remaining 11% shareholding in Metsä Fibre for EUR 150 million. The arbitral tribunal rendered its final decision (arbitral award) in February 2014 and ordered Metsäliitto and Metsä Board to pay UPM the capital amount of EUR 58.5 million and penalty interest and compensate UPM for its legal fees. As a result, UPM recorded an income of EUR 67 million as item affecting comparability in Q1 2014. In May 2014 Metsäliitto and Metsä Board commenced litigation proceedings in the Helsinki District Court challenging the arbitral award and requesting the District Court to set aside the arbitral award or to declare it null and void. In June 2015 the District Court rejected the actions by Metsäliitto and Metsä Board and
UPM interim report 1 January – 30 September 2017
This interim report is unaudited
13
following an appeal the Helsinki Court of Appeal rejected the actions by Metsäliitto and Metsä Board in October 2016. Metsäliitto and Metsä Board have filed a request for leave of appeal with the Supreme Court.
Other shareholdingsIn Finland, UPM is participating in a project to construct a new nuclear power plant unit Olkiluoto 3 EPR (OL3) through its shareholdings in Pohjolan Voima Oy. Pohjolan Voima Oy is a majority shareholder of Teollisuuden Voima Oyj (TVO), holding 58.5% of its shares. UPM’s indirect share of OL3 is approximately 31%. Originally the commercial electricity production of the OL3 plant unit was scheduled to start in April 2009. The completion of the project, however, has been delayed. In September 2014 TVO announced that it had received additional information about the schedule for the OL3 EPR project from the supplier, a consortium formed by AREVA GmbH, AREVA NP SAS and Siemens AG (Supplier), which is constructing OL3 as a fixed-price turnkey project. According to this information, the start of regular electricity production of the plant unit was to take place in late 2018. According to TVO, in October 2017 TVO received information on the Supplier’s schedule re-baseline review for OL3 EPR project completion. According to the information the start of regular electricity production at OL3 EPR will take place in May 2019.
In December 2008 the Supplier initiated the International Chamber of Commerce (ICC) arbitration proceedings (ICC Arbitration) and submitted a claim concerning the delay and ensuing costs incurred at the OL3 project. According to TVO, the Supplier’s monetary claim, as updated in April 2017 is in total approximately EUR 3.59 billion. The sum is based on the Supplier’s updated analysis of events occurred through September 2014, with certain claims quantified to December 31, 2014. The sum includes penalty interest (calculated to June 30, 2017) and payments allegedly delayed by TVO under the plant contract amounting to a combined total of approximately EUR 1.58 billion, as well as approximately EUR 132 million in alleged loss of profit.
According to TVO, the quantification estimate of its costs and losses related to its claim against the Supplier in the ICC Arbitration is approximately EUR 2.6 billion until the end of 2018, which was the estimated start of regular electricity production of OL3 EPR according to the schedule submitted by the Supplier in 2014. TVO s current estimate was submitted to the ICC Tribunal in July 2015.
TVO announced in July 2017 that it had received a final and binding partial award in the ongoing ICC Arbitration. In this partial award the ICC Tribunal has addressed the preparation, review, submittal, and approval of design and licensing documents on the OL3 EPR project. This comprises the key facts and matters that the Supplier relies upon in its main claim against TVO, as well as certain matters that TVO relies upon in its claims against the Supplier. In doing so, the partial award has
finally resolved the great majority of these facts and matters in favor of TVO. Conversely, it has also rejected the great majority of the Supplier’s contentions in this regard. Although the partial award does not take a position on the claimed monetary amounts, it has conclusively rejected the analytical method used by the Supplier to support its principal monetary claims against TVO. A previous partial award, which addressed the early period of the project in relation to the time schedule, licensing and licensability, and system design, likewise favorable to TVO, was granted in November 2016. The arbitration proceeding is still going on with at least one further partial award to come, before the final award where the Tribunal will declare the liabilities of the parties to pay compensation.
TVO considers its claims to be well-founded and has considered and found the claims of the Supplier to be without merit. According to TVO the November 2016 partial award and the July 2017 partial award provide further material confirmation of this position, and reinforces TVO’s view that the balance of the claims is in TVO’s favor.
According to TVO, Areva Group announced in 2016 a restructuring of its business. The restructuring involves a transfer of the operations of Areva NP to a new company (Merger), called New NP, the majority owner of which is going to be EDF. The transaction is aimed to be completed by the end of the second half of 2017, and thereafter more than half of the shares of New NP would be transferred to EDF. According to TVO, the OL3 EPR project and the means required to complete it, as well as certain other liabilities will remain within Areva NP, within the scope of Areva SA. In January 2017, the EU Commission made a decision on the state aid, and in May, 2017, the EU Commission accepted the Merger. According to TVO, in September 2017 TVO filed an appeal to the General Court of the EU against the EU Commission decision on the French state aid to Areva Group. TVO requires that the restructuring of the French nuclear industry will not compromise the completion of the OL3 EPR project within the Supplier’s current schedule and that all liabilities of the plant contract are honored.
According to TVO, TVO summoned Areva in an urgent interim proceeding before a French court in order to obtain information about the restructuring of French nuclear industry and the potential consequences on the performance of the OL3 EPR contract. According to TVO, the discussions between the parties enabled TVO to withdraw from this action in May 2017 and that the continuation of discussions is expected to favor completion of the OL3 EPR project and the start-up of the plant.
The Supplier consortium companies are jointly and severally liable for the plant contract obligations. No receivables or provisions have been recorded by TVO on the basis of claims presented in the arbitration proceedings.
Helsinki, 24 October 2017
UPM-Kymmene CorporationBoard of Directors
UPM interim report 1 January – 30 September 2017
This interim report is unaudited
14
Financial information
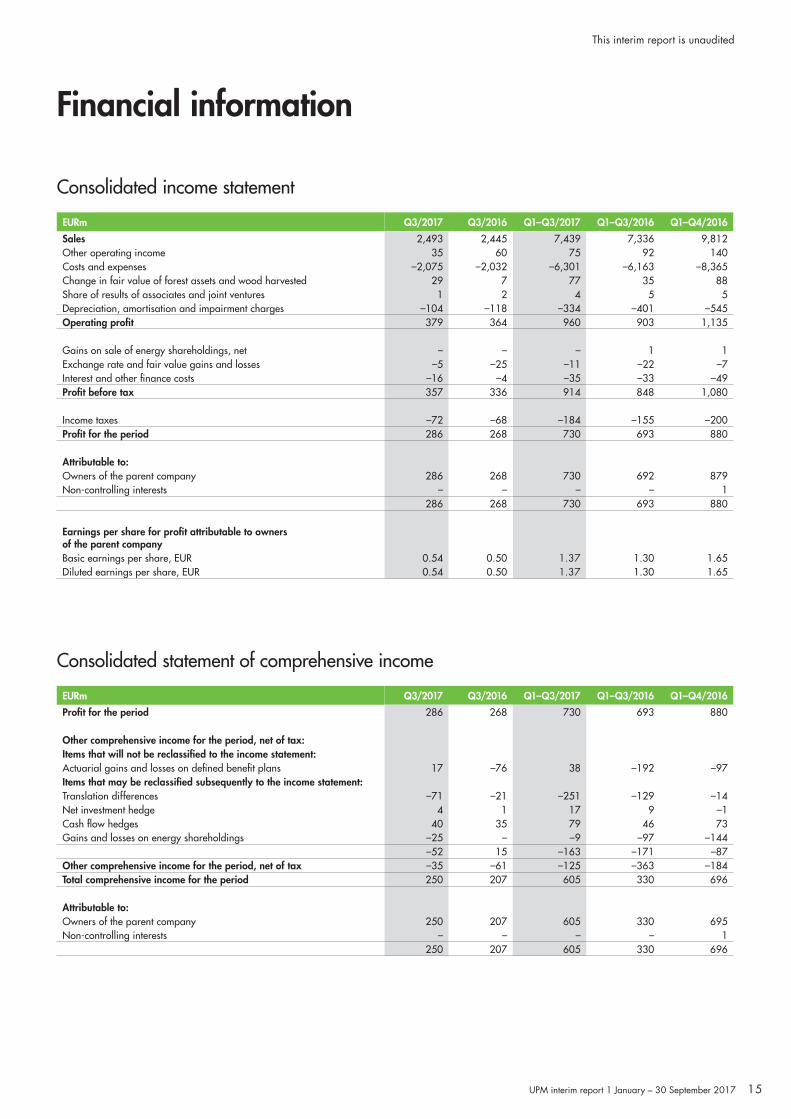
EURm Q3/2017 Q3/2016 Q1–Q3/2017 Q1–Q3/2016 Q1–Q4/2016
Sales 2,493 2,445 7,439 7,336 9,812Other operating income 35 60 75 92 140Costs and expenses –2,075 –2,032 –6,301 –6,163 –8,365Change in fair value of forest assets and wood harvested 29 7 77 35 88Share of results of associates and joint ventures 1 2 4 5 5Depreciation, amortisation and impairment charges –104 –118 –334 –401 –545Operating profit 379 364 960 903 1,135
Gains on sale of energy shareholdings, net – – – 1 1Exchange rate and fair value gains and losses –5 –25 –11 –22 –7Interest and other finance costs –16 –4 –35 –33 –49Profit before tax 357 336 914 848 1,080
Income taxes –72 –68 –184 –155 –200Profit for the period 286 268 730 693 880
Attributable to:Owners of the parent company 286 268 730 692 879Non-controlling interests – – – – 1
286 268 730 693 880
Earnings per share for profit attributable to owners of the parent companyBasic earnings per share, EUR 0.54 0.50 1.37 1.30 1.65Diluted earnings per share, EUR 0.54 0.50 1.37 1.30 1.65
EURm Q3/2017 Q3/2016 Q1–Q3/2017 Q1–Q3/2016 Q1–Q4/2016
Profit for the period 286 268 730 693 880
Other comprehensive income for the period, net of tax:Items that will not be reclassified to the income statement:Actuarial gains and losses on defined benefit plans 17 –76 38 –192 –97Items that may be reclassified subsequently to the income statement:Translation differences –71 –21 –251 –129 –14Net investment hedge 4 1 17 9 –1Cash flow hedges 40 35 79 46 73Gains and losses on energy shareholdings –25 – –9 –97 –144
–52 15 –163 –171 –87Other comprehensive income for the period, net of tax –35 –61 –125 –363 –184Total comprehensive income for the period 250 207 605 330 696
Attributable to:Owners of the parent company 250 207 605 330 695Non-controlling interests – – – – 1
250 207 605 330 696
Consolidated statement of comprehensive income
Consolidated income statement
UPM interim report 1 January – 30 September 2017
This interim report is unaudited
15
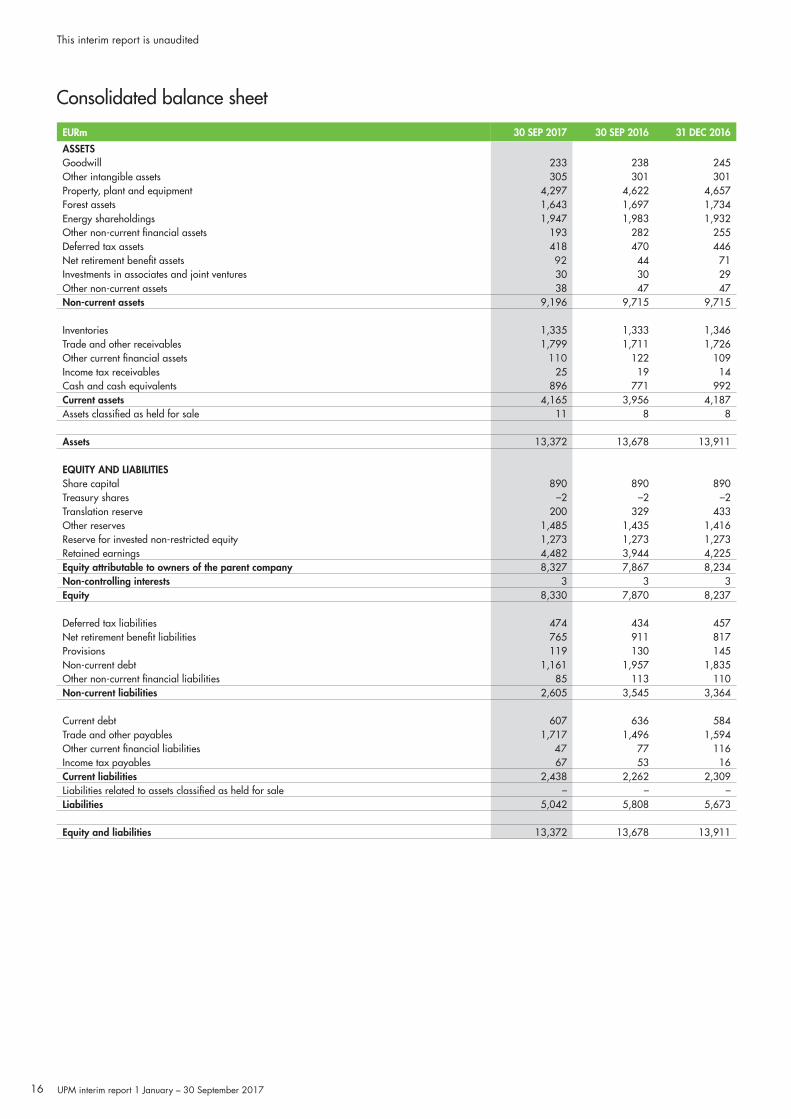
EURm 30 SEP 2017 30 SEP 2016 31 DEC 2016
ASSETSGoodwill 233 238 245Other intangible assets 305 301 301Property, plant and equipment 4,297 4,622 4,657Forest assets 1,643 1,697 1,734Energy shareholdings 1,947 1,983 1,932Other non-current financial assets 193 282 255Deferred tax assets 418 470 446Net retirement benefit assets 92 44 71Investments in associates and joint ventures 30 30 29Other non-current assets 38 47 47Non-current assets 9,196 9,715 9,715
Inventories 1,335 1,333 1,346Trade and other receivables 1,799 1,711 1,726Other current financial assets 110 122 109Income tax receivables 25 19 14Cash and cash equivalents 896 771 992Current assets 4,165 3,956 4,187Assets classified as held for sale 11 8 8
Assets 13,372 13,678 13,911
EQUITY AND LIABILITIESShare capital 890 890 890Treasury shares –2 –2 –2Translation reserve 200 329 433Other reserves 1,485 1,435 1,416Reserve for invested non-restricted equity 1,273 1,273 1,273Retained earnings 4,482 3,944 4,225Equity attributable to owners of the parent company 8,327 7,867 8,234Non-controlling interests 3 3 3Equity 8,330 7,870 8,237
Deferred tax liabilities 474 434 457Net retirement benefit liabilities 765 911 817Provisions 119 130 145Non-current debt 1,161 1,957 1,835Other non-current financial liabilities 85 113 110Non-current liabilities 2,605 3,545 3,364
Current debt 607 636 584Trade and other payables 1,717 1,496 1,594Other current financial liabilities 47 77 116Income tax payables 67 53 16Current liabilities 2,438 2,262 2,309Liabilities related to assets classified as held for sale – – –Liabilities 5,042 5,808 5,673
Equity and liabilities 13,372 13,678 13,911
Consolidated balance sheet
UPM interim report 1 January – 30 September 2017
This interim report is unaudited
16
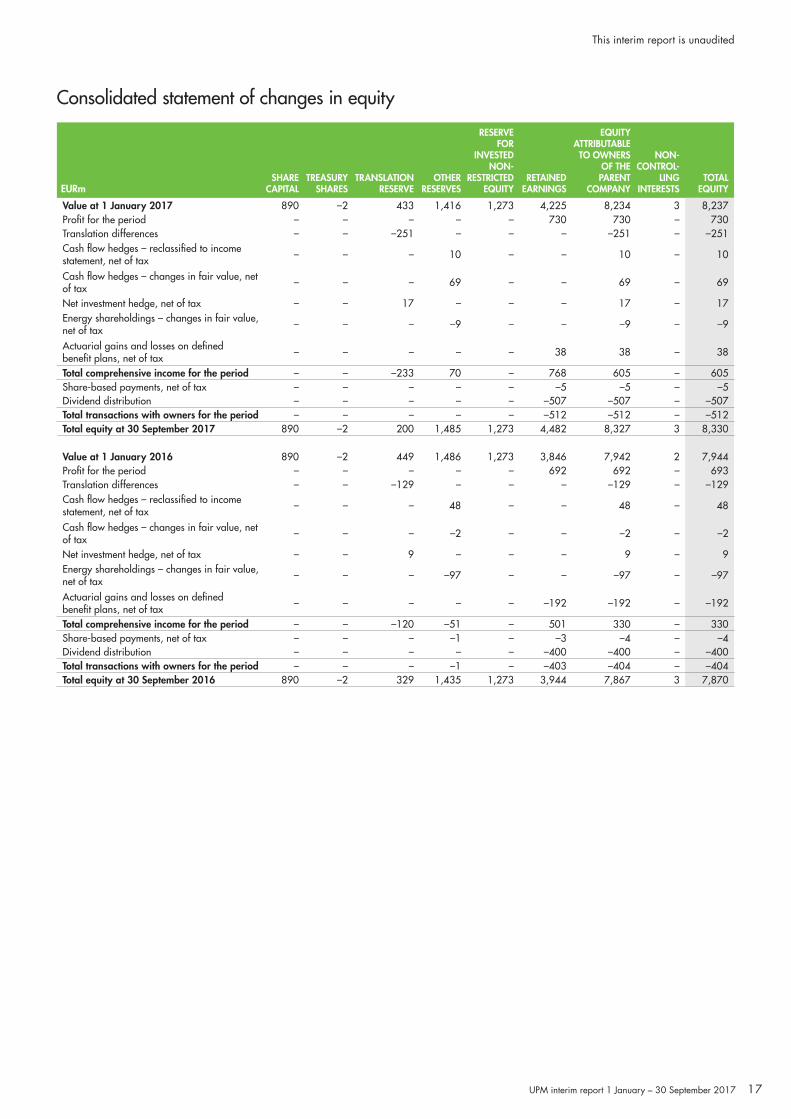
Consolidated statement of changes in equity
EURmSHARE
CAPITALTREASURY
SHARESTRANSLATION
RESERVEOTHER
RESERVES
RESERVE FOR
INVESTED NON-
RESTRICTED EQUITY
RETAINEDEARNINGS
EQUITY ATTRIBUTABLE TO OWNERS
OF THE PARENT
COMPANY
NON-CONTROL-
LINGINTERESTS
TOTALEQUITY
Value at 1 January 2017 890 –2 433 1,416 1,273 4,225 8,234 3 8,237Profit for the period – – – – – 730 730 – 730Translation differences – – –251 – – – –251 – –251Cash flow hedges – reclassified to income statement, net of tax – – – 10 – – 10 – 10
Cash flow hedges – changes in fair value, net of tax – – – 69 – – 69 – 69
Net investment hedge, net of tax – – 17 – – – 17 – 17Energy shareholdings – changes in fair value, net of tax – – – –9 – – –9 – –9
Actuarial gains and losses on defined benefit plans, net of tax – – – – – 38 38 – 38
Total comprehensive income for the period – – –233 70 – 768 605 – 605Share-based payments, net of tax – – – – – –5 –5 – –5Dividend distribution – – – – – –507 –507 – –507Total transactions with owners for the period – – – – – –512 –512 – –512Total equity at 30 September 2017 890 –2 200 1,485 1,273 4,482 8,327 3 8,330
Value at 1 January 2016 890 –2 449 1,486 1,273 3,846 7,942 2 7,944Profit for the period – – – – – 692 692 – 693Translation differences – – –129 – – – –129 – –129Cash flow hedges – reclassified to income statement, net of tax – – – 48 – – 48 – 48
Cash flow hedges – changes in fair value, net of tax – – – –2 – – –2 – –2
Net investment hedge, net of tax – – 9 – – – 9 – 9Energy shareholdings – changes in fair value, net of tax – – – –97 – – –97 – –97
Actuarial gains and losses on defined benefit plans, net of tax – – – – – –192 –192 – –192
Total comprehensive income for the period – – –120 –51 – 501 330 – 330Share-based payments, net of tax – – – –1 – –3 –4 – –4Dividend distribution – – – – – –400 –400 – –400Total transactions with owners for the period – – – –1 – –403 –404 – –404Total equity at 30 September 2016 890 –2 329 1,435 1,273 3,944 7,867 3 7,870
UPM interim report 1 January – 30 September 2017
This interim report is unaudited
17
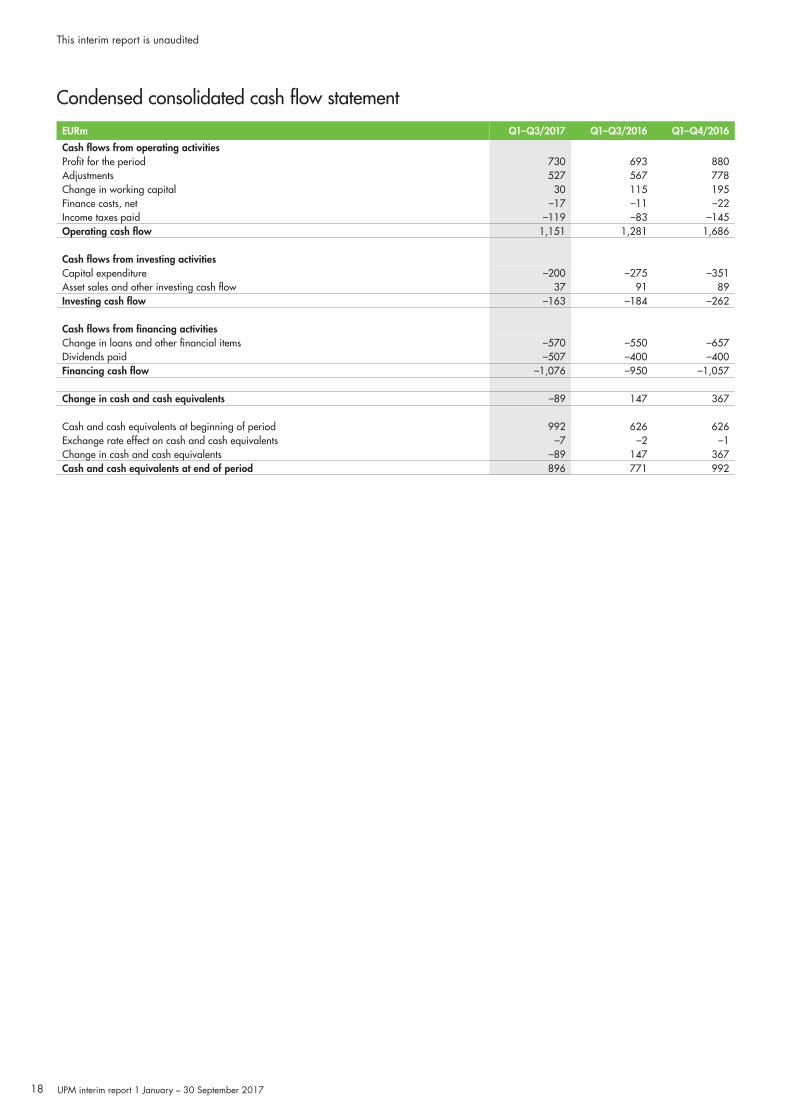
Condensed consolidated cash flow statement
EURm Q1–Q3/2017 Q1–Q3/2016 Q1–Q4/2016
Cash flows from operating activitiesProfit for the period 730 693 880Adjustments 527 567 778Change in working capital 30 115 195Finance costs, net –17 –11 –22Income taxes paid –119 –83 –145Operating cash flow 1,151 1,281 1,686
Cash flows from investing activitiesCapital expenditure –200 –275 –351Asset sales and other investing cash flow 37 91 89Investing cash flow –163 –184 –262
Cash flows from financing activitiesChange in loans and other financial items –570 –550 –657Dividends paid –507 –400 –400Financing cash flow –1,076 –950 –1,057
Change in cash and cash equivalents –89 147 367
Cash and cash equivalents at beginning of period 992 626 626Exchange rate effect on cash and cash equivalents –7 –2 –1Change in cash and cash equivalents –89 147 367Cash and cash equivalents at end of period 896 771 992
UPM interim report 1 January – 30 September 2017
This interim report is unaudited
18
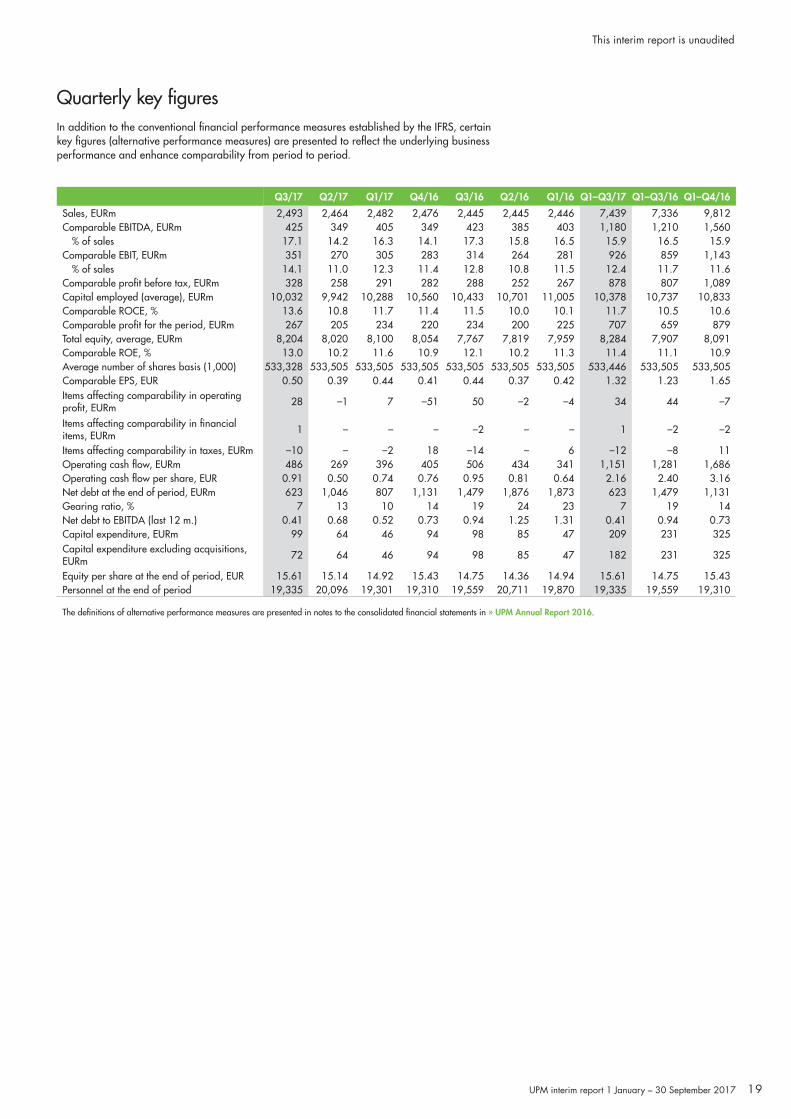
Q3/17 Q2/17 Q1/17 Q4/16 Q3/16 Q2/16 Q1/16 Q1–Q3/17 Q1–Q3/16 Q1–Q4/16
Sales, EURm 2,493 2,464 2,482 2,476 2,445 2,445 2,446 7,439 7,336 9,812Comparable EBITDA, EURm 425 349 405 349 423 385 403 1,180 1,210 1,560
% of sales 17.1 14.2 16.3 14.1 17.3 15.8 16.5 15.9 16.5 15.9Comparable EBIT, EURm 351 270 305 283 314 264 281 926 859 1,143
% of sales 14.1 11.0 12.3 11.4 12.8 10.8 11.5 12.4 11.7 11.6Comparable profit before tax, EURm 328 258 291 282 288 252 267 878 807 1,089Capital employed (average), EURm 10,032 9,942 10,288 10,560 10,433 10,701 11,005 10,378 10,737 10,833Comparable ROCE, % 13.6 10.8 11.7 11.4 11.5 10.0 10.1 11.7 10.5 10.6Comparable profit for the period, EURm 267 205 234 220 234 200 225 707 659 879Total equity, average, EURm 8,204 8,020 8,100 8,054 7,767 7,819 7,959 8,284 7,907 8,091Comparable ROE, % 13.0 10.2 11.6 10.9 12.1 10.2 11.3 11.4 11.1 10.9Average number of shares basis (1,000) 533,328 533,505 533,505 533,505 533,505 533,505 533,505 533,446 533,505 533,505Comparable EPS, EUR 0.50 0.39 0.44 0.41 0.44 0.37 0.42 1.32 1.23 1.65Items affecting comparability in operating profit, EURm 28 –1 7 –51 50 –2 –4 34 44 –7
Items affecting comparability in financial items, EURm 1 – – – –2 – – 1 –2 –2
Items affecting comparability in taxes, EURm –10 – –2 18 –14 – 6 –12 –8 11Operating cash flow, EURm 486 269 396 405 506 434 341 1,151 1,281 1,686Operating cash flow per share, EUR 0.91 0.50 0.74 0.76 0.95 0.81 0.64 2.16 2.40 3.16Net debt at the end of period, EURm 623 1,046 807 1,131 1,479 1,876 1,873 623 1,479 1,131Gearing ratio, % 7 13 10 14 19 24 23 7 19 14Net debt to EBITDA (last 12 m.) 0.41 0.68 0.52 0.73 0.94 1.25 1.31 0.41 0.94 0.73Capital expenditure, EURm 99 64 46 94 98 85 47 209 231 325Capital expenditure excluding acquisitions, EURm 72 64 46 94 98 85 47 182 231 325
Equity per share at the end of period, EUR 15.61 15.14 14.92 15.43 14.75 14.36 14.94 15.61 14.75 15.43Personnel at the end of period 19,335 20,096 19,301 19,310 19,559 20,711 19,870 19,335 19,559 19,310
The definitions of alternative performance measures are presented in notes to the consolidated financial statements in » UPM Annual Report 2016.
In addition to the conventional financial performance measures established by the IFRS, certain key figures (alternative performance measures) are presented to reflect the underlying business performance and enhance comparability from period to period.
Quarterly key figures
UPM interim report 1 January – 30 September 2017
This interim report is unaudited
19
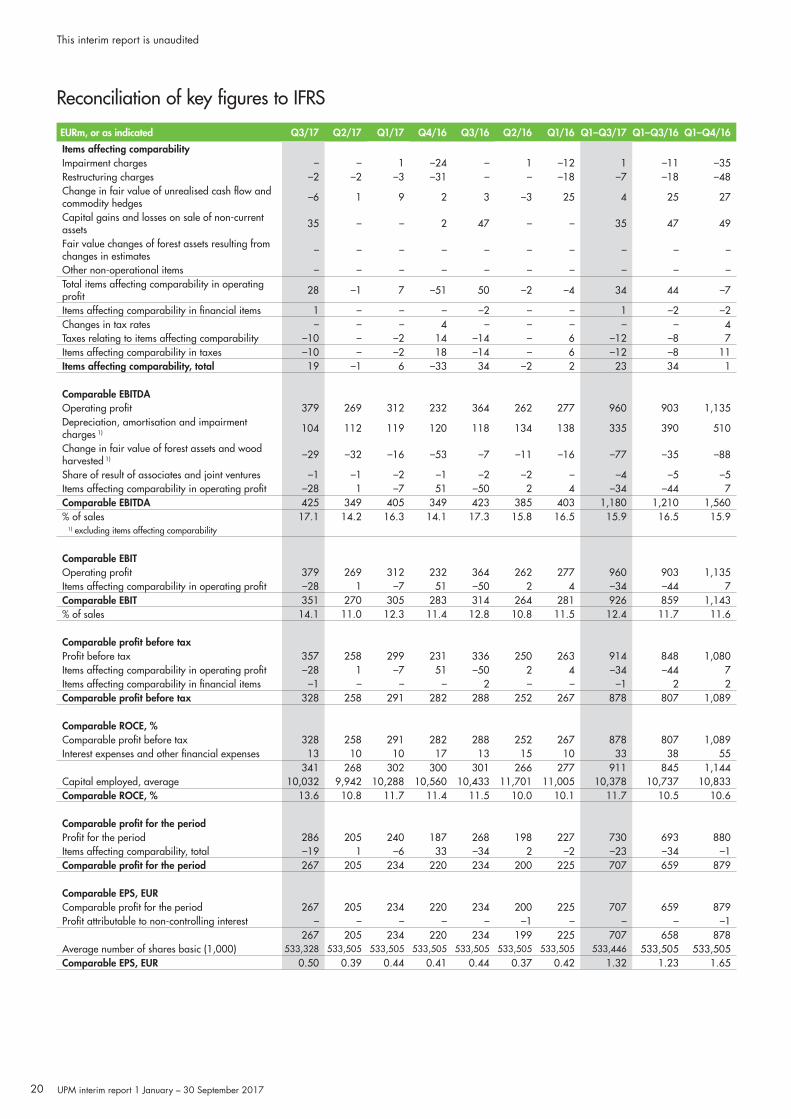
Reconciliation of key figures to IFRS
EURm, or as indicated Q3/17 Q2/17 Q1/17 Q4/16 Q3/16 Q2/16 Q1/16 Q1–Q3/17 Q1–Q3/16 Q1–Q4/16
Items affecting comparabilityImpairment charges – – 1 –24 – 1 –12 1 –11 –35Restructuring charges –2 –2 –3 –31 – – –18 –7 –18 –48Change in fair value of unrealised cash flow and commodity hedges –6 1 9 2 3 –3 25 4 25 27
Capital gains and losses on sale of non-current assets 35 – – 2 47 – – 35 47 49
Fair value changes of forest assets resulting from changes in estimates – – – – – – – – – –
Other non-operational items – – – – – – – – – –Total items affecting comparability in operating profit 28 –1 7 –51 50 –2 –4 34 44 –7
Items affecting comparability in financial items 1 – – – –2 – – 1 –2 –2Changes in tax rates – – – 4 – – – – – 4Taxes relating to items affecting comparability –10 – –2 14 –14 – 6 –12 –8 7Items affecting comparability in taxes –10 – –2 18 –14 – 6 –12 –8 11Items affecting comparability, total 19 –1 6 –33 34 –2 2 23 34 1
Comparable EBITDAOperating profit 379 269 312 232 364 262 277 960 903 1,135Depreciation, amortisation and impairment charges 1) 104 112 119 120 118 134 138 335 390 510
Change in fair value of forest assets and wood harvested 1) –29 –32 –16 –53 –7 –11 –16 –77 –35 –88
Share of result of associates and joint ventures –1 –1 –2 –1 –2 –2 – –4 –5 –5Items affecting comparability in operating profit –28 1 –7 51 –50 2 4 –34 –44 7Comparable EBITDA 425 349 405 349 423 385 403 1,180 1,210 1,560% of sales 17.1 14.2 16.3 14.1 17.3 15.8 16.5 15.9 16.5 15.9
1) excluding items affecting comparability
Comparable EBITOperating profit 379 269 312 232 364 262 277 960 903 1,135Items affecting comparability in operating profit –28 1 –7 51 –50 2 4 –34 –44 7Comparable EBIT 351 270 305 283 314 264 281 926 859 1,143% of sales 14.1 11.0 12.3 11.4 12.8 10.8 11.5 12.4 11.7 11.6
Comparable profit before taxProfit before tax 357 258 299 231 336 250 263 914 848 1,080Items affecting comparability in operating profit –28 1 –7 51 –50 2 4 –34 –44 7Items affecting comparability in financial items –1 – – – 2 – – –1 2 2Comparable profit before tax 328 258 291 282 288 252 267 878 807 1,089
Comparable ROCE, % Comparable profit before tax 328 258 291 282 288 252 267 878 807 1,089Interest expenses and other financial expenses 13 10 10 17 13 15 10 33 38 55
341 268 302 300 301 266 277 911 845 1,144Capital employed, average 10,032 9,942 10,288 10,560 10,433 11,701 11,005 10,378 10,737 10,833Comparable ROCE, % 13.6 10.8 11.7 11.4 11.5 10.0 10.1 11.7 10.5 10.6
Comparable profit for the periodProfit for the period 286 205 240 187 268 198 227 730 693 880Items affecting comparability, total –19 1 –6 33 –34 2 –2 –23 –34 –1Comparable profit for the period 267 205 234 220 234 200 225 707 659 879
Comparable EPS, EURComparable profit for the period 267 205 234 220 234 200 225 707 659 879Profit attributable to non-controlling interest – – – – – –1 – – – –1
267 205 234 220 234 199 225 707 658 878Average number of shares basic (1,000) 533,328 533,505 533,505 533,505 533,505 533,505 533,505 533,446 533,505 533,505Comparable EPS, EUR 0.50 0.39 0.44 0.41 0.44 0.37 0.42 1.32 1.23 1.65
UPM interim report 1 January – 30 September 2017
This interim report is unaudited
20
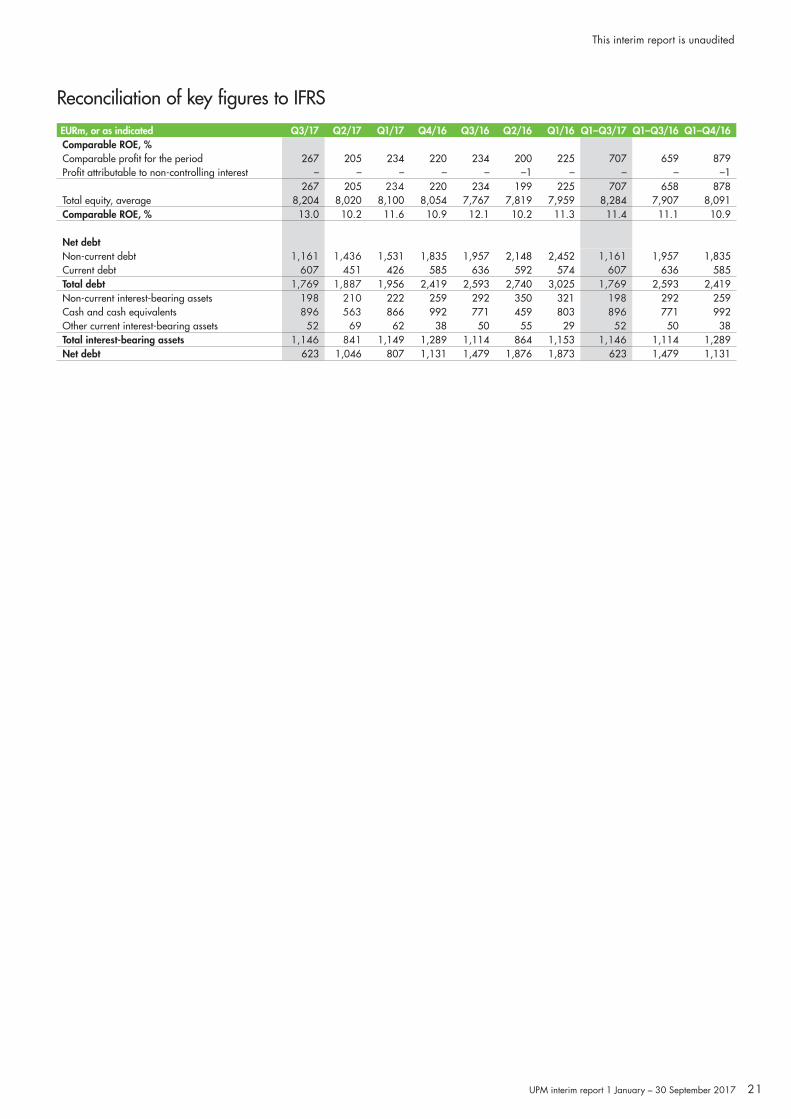
Reconciliation of key figures to IFRS
EURm, or as indicated Q3/17 Q2/17 Q1/17 Q4/16 Q3/16 Q2/16 Q1/16 Q1–Q3/17 Q1–Q3/16 Q1–Q4/16Comparable ROE, %Comparable profit for the period 267 205 234 220 234 200 225 707 659 879Profit attributable to non-controlling interest – – – – – –1 – – – –1
267 205 234 220 234 199 225 707 658 878Total equity, average 8,204 8,020 8,100 8,054 7,767 7,819 7,959 8,284 7,907 8,091Comparable ROE, % 13.0 10.2 11.6 10.9 12.1 10.2 11.3 11.4 11.1 10.9
Net debtNon-current debt 1,161 1,436 1,531 1,835 1,957 2,148 2,452 1,161 1,957 1,835Current debt 607 451 426 585 636 592 574 607 636 585Total debt 1,769 1,887 1,956 2,419 2,593 2,740 3,025 1,769 2,593 2,419Non-current interest-bearing assets 198 210 222 259 292 350 321 198 292 259Cash and cash equivalents 896 563 866 992 771 459 803 896 771 992Other current interest-bearing assets 52 69 62 38 50 55 29 52 50 38Total interest-bearing assets 1,146 841 1,149 1,289 1,114 864 1,153 1,146 1,114 1,289Net debt 623 1,046 807 1,131 1,479 1,876 1,873 623 1,479 1,131
UPM interim report 1 January – 30 September 2017
This interim report is unaudited
21
EURm Q3/17 Q2/17 Q1/17 Q4/16 Q3/16 Q2/16 Q1/16 Q1–Q3/17 Q1–Q3/16 Q1–Q4/16
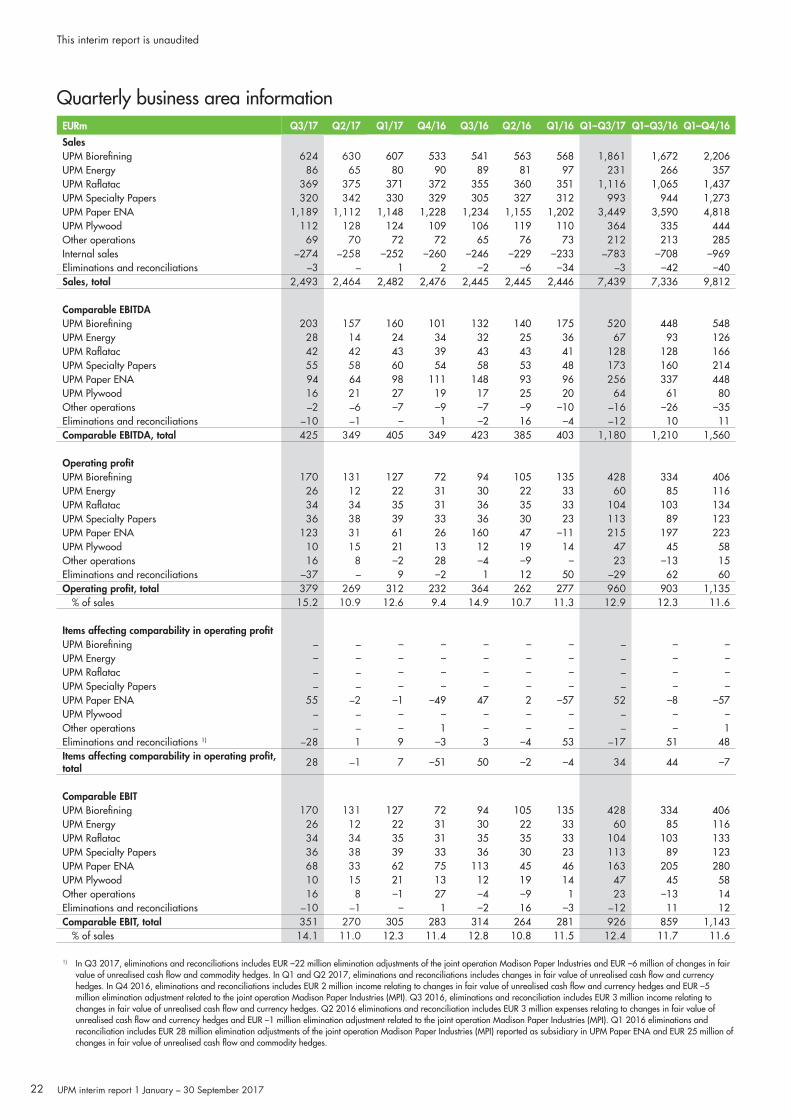
SalesUPM Biorefining 624 630 607 533 541 563 568 1,861 1,672 2,206UPM Energy 86 65 80 90 89 81 97 231 266 357UPM Raflatac 369 375 371 372 355 360 351 1,116 1,065 1,437UPM Specialty Papers 320 342 330 329 305 327 312 993 944 1,273UPM Paper ENA 1,189 1,112 1,148 1,228 1,234 1,155 1,202 3,449 3,590 4,818UPM Plywood 112 128 124 109 106 119 110 364 335 444Other operations 69 70 72 72 65 76 73 212 213 285Internal sales –274 –258 –252 –260 –246 –229 –233 –783 –708 –969Eliminations and reconciliations –3 – 1 2 –2 –6 –34 –3 –42 –40Sales, total 2,493 2,464 2,482 2,476 2,445 2,445 2,446 7,439 7,336 9,812
Comparable EBITDAUPM Biorefining 203 157 160 101 132 140 175 520 448 548UPM Energy 28 14 24 34 32 25 36 67 93 126UPM Raflatac 42 42 43 39 43 43 41 128 128 166UPM Specialty Papers 55 58 60 54 58 53 48 173 160 214UPM Paper ENA 94 64 98 111 148 93 96 256 337 448UPM Plywood 16 21 27 19 17 25 20 64 61 80Other operations –2 –6 –7 –9 –7 –9 –10 –16 –26 –35Eliminations and reconciliations –10 –1 – 1 –2 16 –4 –12 10 11Comparable EBITDA, total 425 349 405 349 423 385 403 1,180 1,210 1,560
Operating profit UPM Biorefining 170 131 127 72 94 105 135 428 334 406UPM Energy 26 12 22 31 30 22 33 60 85 116UPM Raflatac 34 34 35 31 36 35 33 104 103 134UPM Specialty Papers 36 38 39 33 36 30 23 113 89 123UPM Paper ENA 123 31 61 26 160 47 –11 215 197 223UPM Plywood 10 15 21 13 12 19 14 47 45 58Other operations 16 8 –2 28 –4 –9 – 23 –13 15Eliminations and reconciliations –37 – 9 –2 1 12 50 –29 62 60Operating profit, total 379 269 312 232 364 262 277 960 903 1,135
% of sales 15.2 10.9 12.6 9.4 14.9 10.7 11.3 12.9 12.3 11.6
Items affecting comparability in operating profitUPM Biorefining – – – – – – – – – –UPM Energy – – – – – – – – – –UPM Raflatac – – – – – – – – – –UPM Specialty Papers – – – – – – – – – –UPM Paper ENA 55 –2 –1 –49 47 2 –57 52 –8 –57UPM Plywood – – – – – – – – – –Other operations – – – 1 – – – – – 1Eliminations and reconciliations 1) –28 1 9 –3 3 –4 53 –17 51 48Items affecting comparability in operating profit, total 28 –1 7 –51 50 –2 –4 34 44 –7
Comparable EBITUPM Biorefining 170 131 127 72 94 105 135 428 334 406UPM Energy 26 12 22 31 30 22 33 60 85 116UPM Raflatac 34 34 35 31 35 35 33 104 103 133UPM Specialty Papers 36 38 39 33 36 30 23 113 89 123UPM Paper ENA 68 33 62 75 113 45 46 163 205 280UPM Plywood 10 15 21 13 12 19 14 47 45 58Other operations 16 8 –1 27 –4 –9 1 23 –13 14Eliminations and reconciliations –10 –1 – 1 –2 16 –3 –12 11 12Comparable EBIT, total 351 270 305 283 314 264 281 926 859 1,143
% of sales 14.1 11.0 12.3 11.4 12.8 10.8 11.5 12.4 11.7 11.6
1) In Q3 2017, eliminations and reconciliations includes EUR –22 million elimination adjustments of the joint operation Madison Paper Industries and EUR –6 million of changes in fair value of unrealised cash flow and commodity hedges. In Q1 and Q2 2017, eliminations and reconciliations includes changes in fair value of unrealised cash flow and currency hedges. In Q4 2016, eliminations and reconciliations includes EUR 2 million income relating to changes in fair value of unrealised cash flow and currency hedges and EUR –5 million elimination adjustment related to the joint operation Madison Paper Industries (MPI). Q3 2016, eliminations and reconciliation includes EUR 3 million income relating to changes in fair value of unrealised cash flow and currency hedges. Q2 2016 eliminations and reconciliation includes EUR 3 million expenses relating to changes in fair value of unrealised cash flow and currency hedges and EUR –1 million elimination adjustment related to the joint operation Madison Paper Industries (MPI). Q1 2016 eliminations and reconciliation includes EUR 28 million elimination adjustments of the joint operation Madison Paper Industries (MPI) reported as subsidiary in UPM Paper ENA and EUR 25 million of changes in fair value of unrealised cash flow and commodity hedges.
Quarterly business area information
UPM interim report 1 January – 30 September 2017
This interim report is unaudited
22
EURm Q1–Q3/2017 Q1–Q3/2016 Q1–Q4/2016
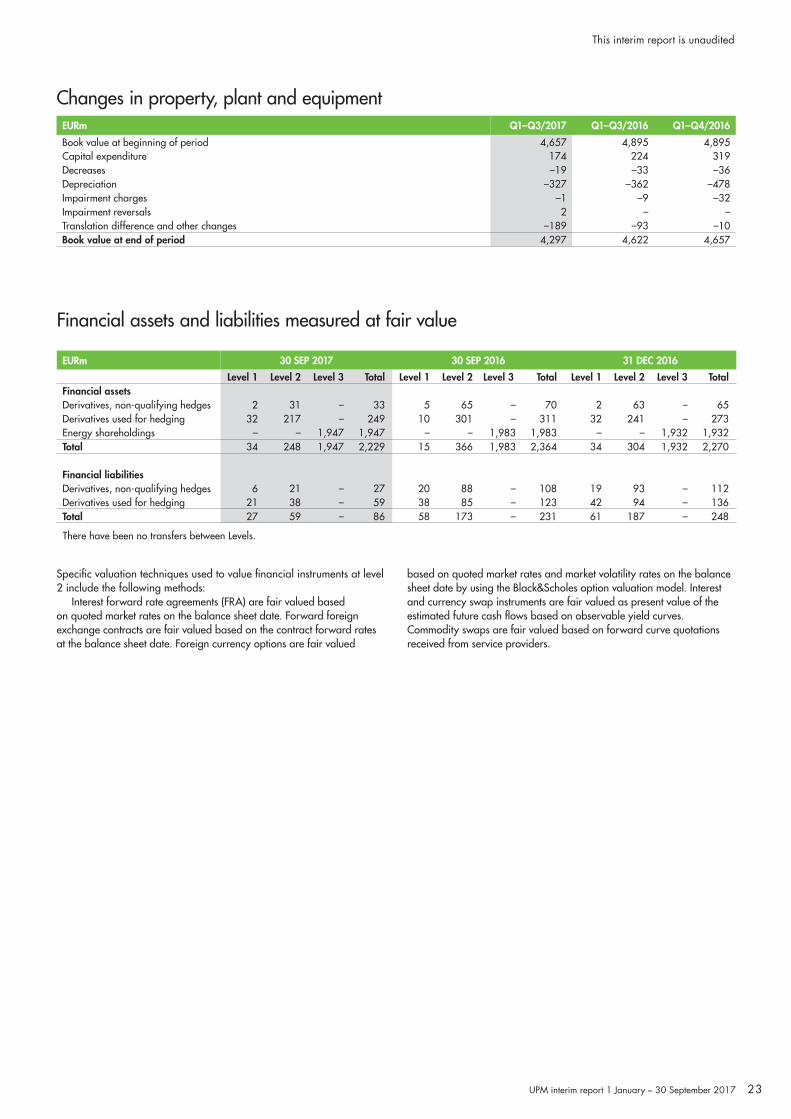
Book value at beginning of period 4,657 4,895 4,895Capital expenditure 174 224 319Decreases –19 –33 –36Depreciation –327 –362 –478Impairment charges –1 –9 –32Impairment reversals 2 – –Translation difference and other changes –189 –93 –10Book value at end of period 4,297 4,622 4,657
Financial assets and liabilities measured at fair value
EURm 30 SEP 2017 30 SEP 2016 31 DEC 2016
Level 1 Level 2 Level 3 Total Level 1 Level 2 Level 3 Total Level 1 Level 2 Level 3 TotalFinancial assetsDerivatives, non-qualifying hedges 2 31 – 33 5 65 – 70 2 63 – 65Derivatives used for hedging 32 217 – 249 10 301 – 311 32 241 – 273Energy shareholdings – – 1,947 1,947 – – 1,983 1,983 – – 1,932 1,932Total 34 248 1,947 2,229 15 366 1,983 2,364 34 304 1,932 2,270
Financial liabilitiesDerivatives, non-qualifying hedges 6 21 – 27 20 88 – 108 19 93 – 112Derivatives used for hedging 21 38 – 59 38 85 – 123 42 94 – 136Total 27 59 – 86 58 173 – 231 61 187 – 248
There have been no transfers between Levels.
Specific valuation techniques used to value financial instruments at level 2 include the following methods:
Interest forward rate agreements (FRA) are fair valued based on quoted market rates on the balance sheet date. Forward foreign exchange contracts are fair valued based on the contract forward rates at the balance sheet date. Foreign currency options are fair valued
Changes in property, plant and equipment
based on quoted market rates and market volatility rates on the balance sheet date by using the Black&Scholes option valuation model. Interest and currency swap instruments are fair valued as present value of the estimated future cash flows based on observable yield curves. Commodity swaps are fair valued based on forward curve quotations received from service providers.
UPM interim report 1 January – 30 September 2017
This interim report is unaudited
23
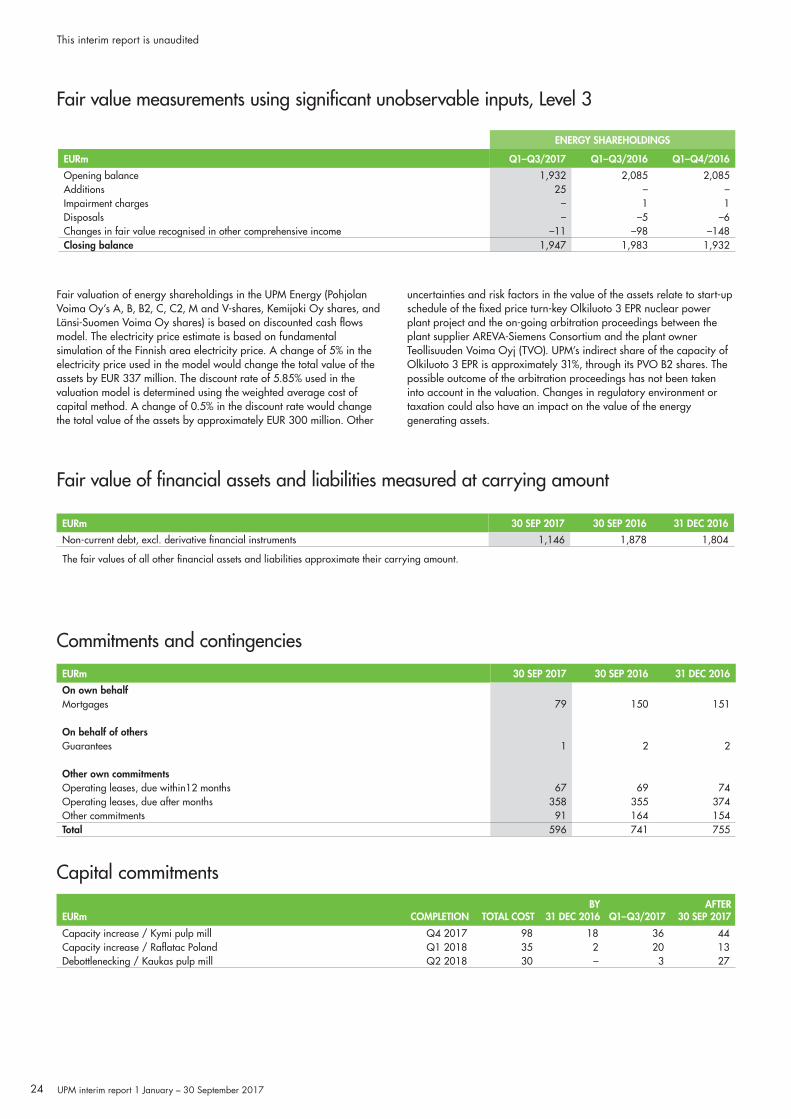
Commitments and contingencies
EURm 30 SEP 2017 30 SEP 2016 31 DEC 2016
On own behalfMortgages 79 150 151
On behalf of othersGuarantees 1 2 2
Other own commitmentsOperating leases, due within12 months 67 69 74Operating leases, due after months 358 355 374Other commitments 91 164 154Total 596 741 755
Capital commitments
EURm COMPLETION TOTAL COSTBY
31 DEC 2016 Q1–Q3/2017AFTER
30 SEP 2017
Capacity increase / Kymi pulp mill Q4 2017 98 18 36 44Capacity increase / Raflatac Poland Q1 2018 35 2 20 13Debottlenecking / Kaukas pulp mill Q2 2018 30 – 3 27
EURm 30 SEP 2017 30 SEP 2016 31 DEC 2016
Non-current debt, excl. derivative financial instruments 1,146 1,878 1,804
The fair values of all other financial assets and liabilities approximate their carrying amount.
Fair value of financial assets and liabilities measured at carrying amount
Fair valuation of energy shareholdings in the UPM Energy (Pohjolan Voima Oy’s A, B, B2, C, C2, M and V-shares, Kemijoki Oy shares, and Länsi-Suomen Voima Oy shares) is based on discounted cash flows model. The electricity price estimate is based on fundamental simulation of the Finnish area electricity price. A change of 5% in the electricity price used in the model would change the total value of the assets by EUR 337 million. The discount rate of 5.85% used in the valuation model is determined using the weighted average cost of capital method. A change of 0.5% in the discount rate would change the total value of the assets by approximately EUR 300 million. Other
uncertainties and risk factors in the value of the assets relate to start-up schedule of the fixed price turn-key Olkiluoto 3 EPR nuclear power plant project and the on-going arbitration proceedings between the plant supplier AREVA-Siemens Consortium and the plant owner Teollisuuden Voima Oyj (TVO). UPM’s indirect share of the capacity of Olkiluoto 3 EPR is approximately 31%, through its PVO B2 shares. The possible outcome of the arbitration proceedings has not been taken into account in the valuation. Changes in regulatory environment or taxation could also have an impact on the value of the energy generating assets.
ENERGY SHAREHOLDINGS
EURm Q1–Q3/2017 Q1–Q3/2016 Q1–Q4/2016
Opening balance 1,932 2,085 2,085Additions 25 – –Impairment charges – 1 1Disposals – –5 –6Changes in fair value recognised in other comprehensive income –11 –98 –148Closing balance 1,947 1,983 1,932
Fair value measurements using significant unobservable inputs, Level 3
UPM interim report 1 January – 30 September 2017
This interim report is unaudited
24
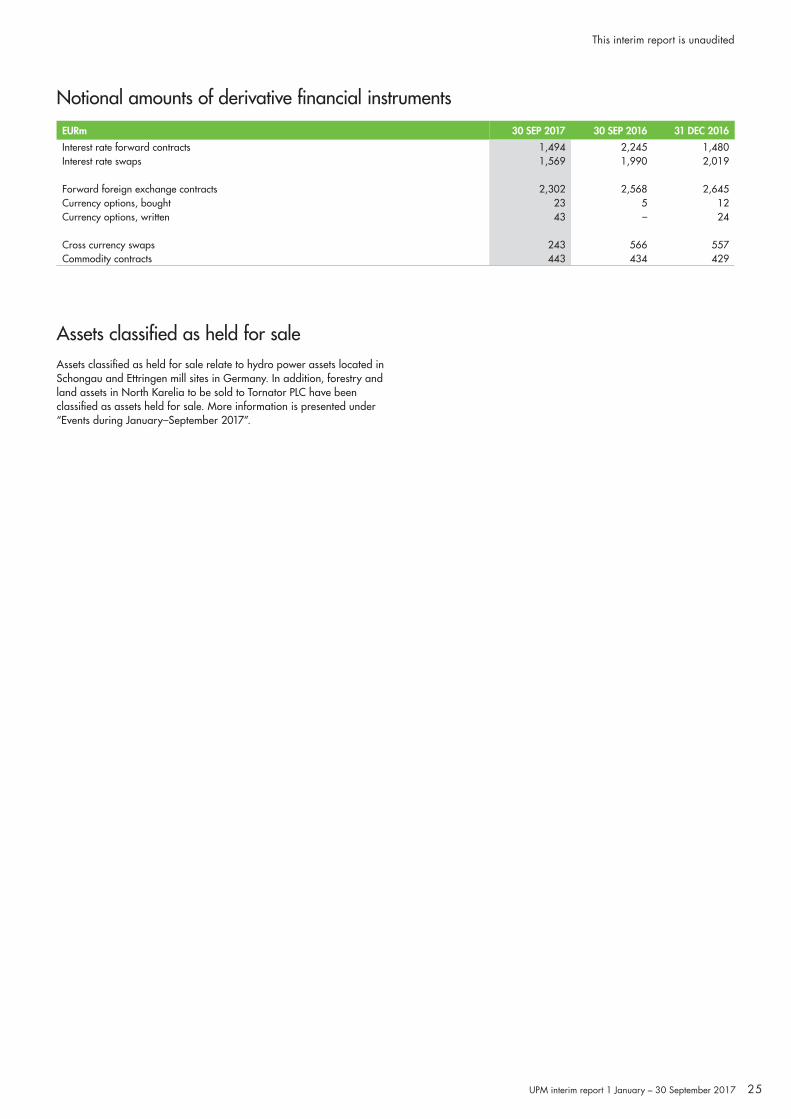
Notional amounts of derivative financial instruments
EURm 30 SEP 2017 30 SEP 2016 31 DEC 2016
Interest rate forward contracts 1,494 2,245 1,480Interest rate swaps 1,569 1,990 2,019
Forward foreign exchange contracts 2,302 2,568 2,645Currency options, bought 23 5 12Currency options, written 43 – 24
Cross currency swaps 243 566 557Commodity contracts 443 434 429
Assets classified as held for saleAssets classified as held for sale relate to hydro power assets located in Schongau and Ettringen mill sites in Germany. In addition, forestry and land assets in North Karelia to be sold to Tornator PLC have been classified as assets held for sale. More information is presented under “Events during January–September 2017”.
UPM interim report 1 January – 30 September 2017
This interim report is unaudited
25
Basis of preparation and accounting policiesThis unaudited financial statements has been prepared in accordance with the accounting policies set out in International Accounting Standard 34 on Interim Financial Reporting and group’s consolidated statements for 2016. Income tax expense is recognised based on the best estimate of the weighted average annual income tax rate expected for the full year.
Alternative performance measures presented in this report should not be considered as a substitute for measures of performance in accordance with the IFRS and may not be comparable to similarly titled amounts used by other companies.
Figures presented in this report have been rounded and therefore the sum of individual figures might deviate from the presented total figure. Key figures have been calculated using exact figures.
UPM will adopt two new IFRS standards in 2018, IFRS 15 Revenue from contracts with customers and IFRS 9 Financial instruments. Description of expected effects of future implementation is presented below.
IFRS 15 Revenue from contracts with customers
IFRS 15 Revenue from contracts with customers specifies how and when revenue is recognised as well as requires more informative and relevant disclosures. The standard supersedes IAS 18 Revenue, IAS 11 Construction contracts and a number of revenue related interpretations. Implementation processThe group has made an assessment on how the new standard will affect the amount and timing of sales revenue by using the five-step model introduced in the standard. Specific surveys have been developed and customer contracts reviewed in order to identify and gather information on separate performance obligations within the contracts, services provided to the customers, discounts and rebates affecting variable consideration, contract modifications, satisfaction of performance obligation by assessing when customer obtains control of the goods or services that is defining revenue recognition over time or at a point in time.
The assessment has included in-depth review of disaggregated data of the UPM revenue streams, including analyses of revenues broken down by product and service by Business Area.
UPM generates revenue mainly from the sale of goods i.e. several types of products. Performance obligations are clearly identified in the customer contracts and orders. Approximately 59% of UPM revenue comes from sales of graphic and specialty papers to publishers, retailers, printing houses, merchants and distributors, converters and label stock manufacturers. Approximately 15% of revenue comes from sales of self-adhesive label materials to label printers and brand owners and approximately 12% comes from sales of pulp products to tissue, board, speciality and graphic paper producers. The rest of revenue comprises mainly of sales of energy, biofuels, sawn timber and plywood products. Sales of energy to NordPool electricity market continues to be recognised upon delivery and there are no changes identified compared to the current recognition principles.
The results of surveys and contract reviews indicated that the contractual terms and conditions with customers are largely standardised and revenue streams are relatively straightforward. The changes that will have an impact on UPM’s financial statements are described below.
Delivery termsAccording to the new requirements, revenue is recognised when the customer obtains control of the good or service. In UPM’s customer contracts the change of control is often defined in terms that are based on Incoterms 2010 so the timing of revenue recognition is largely dependent on delivering the goods at a point in time. According to
assessment the new guidance is generally not expected to change the point at which UPM’s revenue is recognised for the performance obligation to provide goods. Delivery costs related to paper and pulp products sales comprise approximately 79% of the groups’ total delivery costs. Major part of the sales contracts are on D delivery terms basis, whereby delivery is not a promised service to the customer, as the control of a good does not transfer to the customer before shipment. However, the group has some pulp and paper products sale over long distances using CIP and CPT delivery terms whereby UPM is responsible for organising the delivery. Approximately 9% of paper products and 24% of pulp products are sold over long distances using CIP and CPT delivery terms and in these cases, there are separate performance obligations for goods and delivery services. Consequently, the portion of revenue relating to goods has to be recognised when the goods pass the ship’s rail and the part of delivery services over time when the service has been performed. Currently full revenue is recognised when the goods pass the ship’s rail. According to analyses, the impact of accounting policy change is minor to UPM operating profit because under current practice the group recognises delivery costs at the same time with revenue. The change affects sales and delivery costs line items in income statement. However, the part of sales price allocated to the delivery services is a minor component of the total revenue and the delivery volumes over long distances are stable throughout the year. Analyses have also indicated that a performance obligation for delivery services does not involve an agency relationship. The group will complete delivery terms’ analyses for the rest of its sales in the last quarter 2017.
Variable considerationThe group has determined the components of transaction price that are contingent on the outcome of future events and need to be estimated when recognising revenue.
UPM provides to its customers volume rebates that encourage the customer to take specific volumes in a given timescale. The amount of the rebates is a significant component of sales price in regard of sales of paper products and self-adhesive label materials. The group has reviewed the current principles of estimating and recognising rebates and concluded that the current accounting policy is in line with new guidance.
The group gives the customers the right for purchase price refund in case the products do not meet the quality as specified in the agreement. However, the customers have to raise the claim in a certain timeframe. According to the new guidance, the amount expected to be returned to the customer must be estimated and taken into account in the amount of sales revenue. In regard of sales of paper products, the group has not previously made an estimate of expected claims. Instead, the revenue has been adjusted when the group has processed and accepted the claims. The group will change the accounting policy and estimate and update the amount of claims at each reporting date. The impact to financial statements is insignificant as the amount of claims in paper sales is stable amounting approximately EUR 1 million per month.
Consignment stock agreementsAccording to new requirements, revenue is recognised when the customer obtains control of the good or service. Sales agreement assessment indicated that the group has some of pulp products sales agreements labelled as consignment stock agreements, that under new more specific requirements do not qualify as consignment stock agreements. Consequently, the revenue has to be recognised earlier than under current practice. The estimated effect to the UPM s financial statements is not material.
Sales of servicesRevenue from services not related to sale of goods comprises only 0.4% of UPM total sales, and consists of freight services (free space on group’s vessels sold as freight services), forest expertise and contracting services to woodland and forestry owners. The revenue of freight services is currently recognised when the vessel leaves. The group will
UPM interim report 1 January – 30 September 2017
This interim report is unaudited
26
Impairment of financial assetsThe group is currently developing a simplified expected credit loss model for trade receivables, whereby expected credit losses are recognised based on ageing categories of trade receivables. UPM has historically low levels of realised bad debts in trade receivables due to strict policies and use of trade credit insurance. Expected loss model is not expected to increase amounts of bad debt provisions. Cumulative effect of adoption will be shown as an adjustment to opening retained earnings without restating comparative information.
Cost of hedgingIn cash flow hedge accounting, the group designates only the spot element in the foreign exchange forward contract to offset the changes in the spot foreign exchange prices. Under current IAS 39, the changes in the fair value of the forward points are recognised directly in profit or loss. Under IFRS 9, when only designating the spot element in a cash flow hedge, the change in the fair value of the forward element may be recognised in OCI and accumulated in a separate component of equity. Group applies this in transaction related cash flow hedges. Forward element that will be accumulated in OCI is recognised in profit or loss when the hedged transaction affects profit or loss. This change in accounting policy will reduce the group’s profit and loss volatility, but the anticipated effect is relatively small. The change will be implemented prospectively without restatement of comparatives.
Commodity hedgesIFRS 9 focuses on reflecting the company’s risk management strategies in hedge accounting and allowing more hedging strategies to qualify for hedge accounting. Commodity derivative hedging will benefit from the possibility to apply hedge accounting for one or several risk components separately or in aggregation. The group is considering the ability to hedge separately electricity price risk components (i.e. SYS and EPAD). This change would reduce the group’s profit and loss volatility as the fair value changes of unrealised SYS and EPAD derivatives would be recognised in OCI hedging reserve instead of income statement and ineffectiveness may arise in rare cases only. Currently unrealised fair value changes of non-qualified cash flow hedges as well as ineffectiveness are recognised in income statement. UPM will apply the hedge accounting of IFRS 9 on a prospective basis for all hedging relationships and there will be no restatement of comparatives.
UPM continues to assess the new disclosure requirements.
change the accounting policy to recognise revenue for freight services over time when the performance obligation is satisfied.
Presentation and disclosureIFRS 15 will significantly increase the volume of the revenue related disclosures. The group continues to assess the new disclosure requirements, the standard’s objective of presenting only useful information by aggregating or disaggregating disclosures and any necessary policy and process changes in preparation for adoption.
TransitionThe group will adopt IFRS 15 using modified retrospective transition approach upon initial application 1 January 2018, applying the standard only to contracts that are not completed as of the date of initial application. Cumulative effect will be shown as an adjustment to opening retained earnings without restating comparative information.
During the last quarter of 2017, the group will finalise the implementation project and related documentation and communicate new accounting policies and procedures to sales and finance organisations as part of extensive training plan. As the results of surveys and contract reviews indicate that the adoption of the standard will only have a minor impact on revenue recognition, the group is able to utilise existing processes with small changes. The group will present more information on impact of the new standard and estimated cumulative effect on transition in financial statements release 2017.
IFRS 9 Financial instruments
IFRS 9 replaces IAS 39 and addresses the classification, measurement and recognition of financial assets and financial liabilities, introduces new rules for hedge accounting and a new impairment model for financial assets. The changes that will have an impact on group’s financial statements are described below.
Classification of financial assetsEnergy shareholdings categorised as available-for-sale under current IAS 39 represent investments that group intends to hold for the long term. The group plans to classify these investments at the date of initial application 1 January 2018 as measured at fair value through other comprehensive income (FVOCI). Under this new FVOCI category, fair value changes are recognised in fair value reserve in OCI while dividends are recognised in profit or loss. Gains or losses, including any gains or losses on sale, are never reclassified from equity to the income statement. Despite the fact that the election is to be adopted retrospectively, comparatives are not restated on initial application.
27UPM interim report 1 January – 30 September 2017
This interim report is unaudited
UPM-Kymmene CorporationAlvar Aallon katu 1 PO Box 380 FI-00101 Helsinki, Finland tel. +358 2041 5111 fax +358 2041 [email protected] [email protected]
It should be noted that certain statements herein, which are not historical facts, including, without limitation, those regarding expectations for market growth and developments; expectations for growth and profitability; and statements preceded by “believes”, “expects”, “anticipates”, “foresees”, or similar expressions, are forward-looking statements. Since these statements are based on current plans, estimates and projections, they involve risks and uncertainties which may cause actual results to materially differ from those expressed in such forward-looking statements. Such factors include, but are not limited to: (1) operating factors such as continued success of manufacturing activities and the achievement of efficiencies therein including the availability and cost of production inputs, continued success of product development, acceptance of new products or services by the group’s targeted customers, success of the existing and future collaboration arrangements, changes in business strategy or development plans or targets, changes in the degree of protection created by the group’s patents and other intellectual property rights, the availability of capital on acceptable terms; (2) industry conditions, such as strength of product demand, intensity of competition, prevailing and future global market prices for the group’s products and the pricing pressures thereto, financial condition of the customers and the competitors of the group, the potential introduction of competing products and technologies by competitors; and (3) general economic con ditions, such as rates of economic growth in the group’s principal geographic markets or fluctuations in exchange and interest rates. The main earnings sensitivities and the group’s cost structure are presented on page 115 of the 2016 Annual Report. Risks and opportunities are discussed on pages 22–23 and risks and risk management are presented on pages 98–99 of the report.
www.upm.com