upm the biofore companyassets.upm.com/investors/documents/2014/nordea forest products a… · upm...
TRANSCRIPT

President and CEO
Jussi Pesonen
UPM – THE BIOFORE COMPANYNordea Forest Products & Paper Seminar 2014

| © UPM
Contents
• UPM in transformation
• UPM strategy
• Performance
• Summary
2
| © UPM3 | © UPM
UPM IN TRANSFORMATION

| © UPM
UPM in transformation – revenues
4
0 %
20 %
40 %
60 %
80 %
100 %
2013
Paper ENA
Plywood
Energy
Paper Asia
Raflatac
Biorefining
0 %
20 %
40 %
60 %
80 %
100 %
2003
Sold units
Paper
Plywood
Raflatac
Sawmilling
2003:
integrated
paper company
2008:
towards market-
driven businesses
2013:
six separate
businesses
Sales
EBIT(*
EBIT margin(*
Personnel
EUR 9.9bn
EUR 429m
4.4%
34,500
EUR 9.5bn
EUR 513m
5.4%
25,000
EUR 10.1bn
EUR 683m
6.8%
21,000
Business
portfolio,
Sales
*) excluding special items
0 %
20 %
40 %
60 %
80 %
100 %
2008
Sold units
Paper
Plywood
Raflatac
Sawmilling

| © UPM
UPM in transformation – capital
5
0 %
20 %
40 %
60 %
80 %
100 %
2013
Paper ENA
Plywood
Energy
Paper Asia
Raflatac
Biorefining
Other
0 %
20 %
40 %
60 %
80 %
100 %
2003
Sold units
Paper
Plywood
Raflatac
Sawmilling
Other
2003:
integrated
paper company
2008:
towards market-
driven businesses
2013:
six separate
businesses
Capital empl.
ROCE (*
Net debt
Market cap
EUR 12.8bn
4.7%
EUR 4.9bn
EUR 7.9bn
EUR 11.2bn
4.6%
EUR 4.3bn
EUR 4.7bn
EUR 11.6bn
6.0%
EUR 3.0bn
EUR 6.5bn
Business
portfolio,
Capital
employed
0 %
20 %
40 %
60 %
80 %
100 %
2008
Sold units
Paper
Plywood
Raflatac
Sawmilling
Other
*) excluding special items
| © UPM
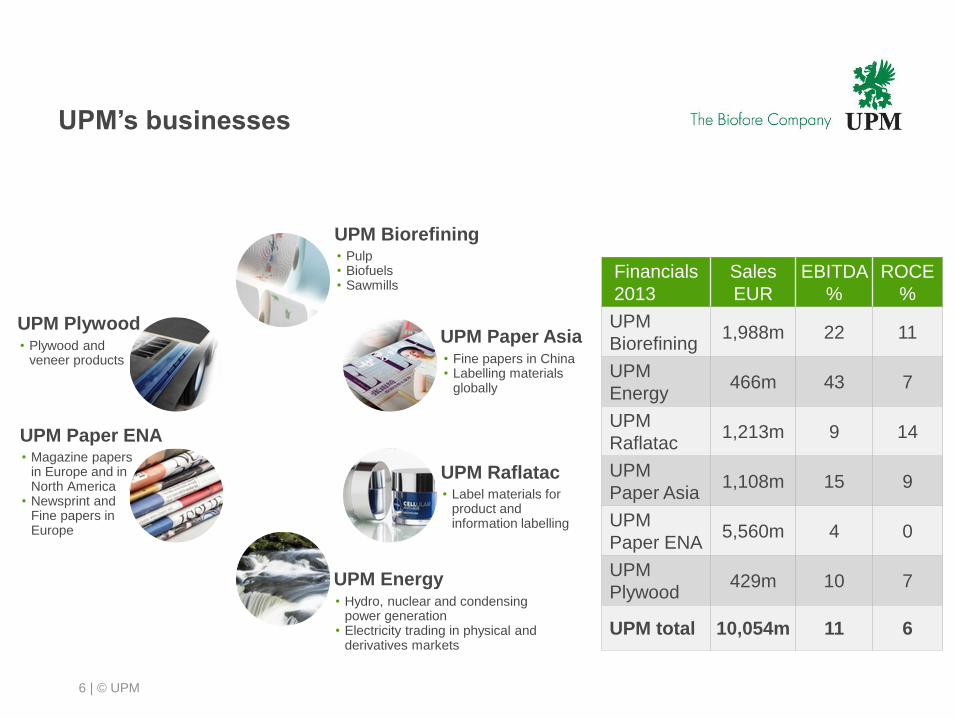
UPM’s businesses
6
• Pulp• Biofuels• Sawmills
• Fine papers in China• Labelling materials
globally
• Label materials for product and information labelling
• Hydro, nuclear and condensing power generation
• Electricity trading in physical and derivatives markets
• Plywood and veneer products
• Magazine papers in Europe and in North America
• Newsprint and Fine papers in Europe
Financials
2013
Sales
EUR
EBITDA
%
ROCE
%
UPM
Biorefining1,988m 22 11
UPM
Energy466m 43 7
UPM
Raflatac1,213m 9 14
UPM
Paper Asia1,108m 15 9
UPM
Paper ENA5,560m 4 0
UPM
Plywood429m 10 7
UPM total 10,054m 11 6
UPM Biorefining
UPM Paper Asia
UPM Raflatac
UPM Energy
UPM Paper ENA
UPM Plywood
| © UPM
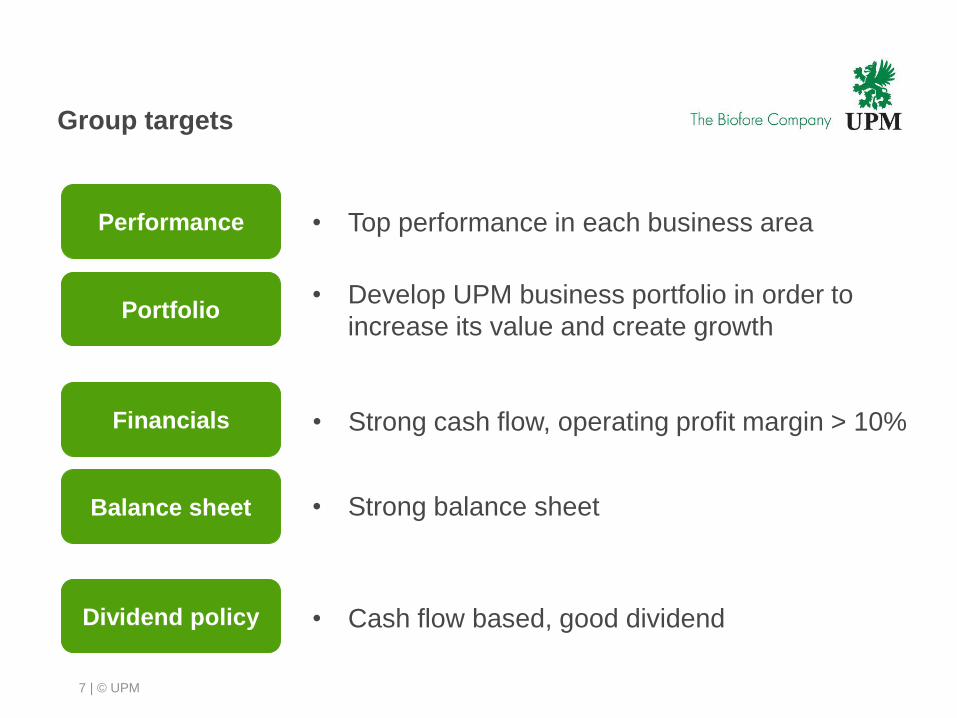
Performance • Top performance in each business area
Portfolio• Develop UPM business portfolio in order to
increase its value and create growth
Financials • Strong cash flow, operating profit margin > 10%
Balance sheet • Strong balance sheet
Dividend policy • Cash flow based, good dividend
7
Group targets
| © UPM8 | © UPM
UPM STRATEGY

| © UPM
Profit
improvement
programme
EUR 200m
Shifting gear in UPM transformation
9
UPM
Biorefining
UPM
Paper
Asia
UPM
Raflatac
UPM
Energy
UPM
Paper
ENA
UPM
Plywood
EBITDA target for
growth initiatives
EUR 200m
Biofuels:
Lappeenranta
biorefinery
Pulp: 10%
capacity increase
Labelling materials
Changshu expansion
Self-adhesive labels:
advancing in growth
markets and in higher
value added products
Business portfolio
development and
value creation
BIOCHEMICALS
BIOCOMPOSITES
BIOFUELS
New businesses

| © UPM
Profit
improvement
programme
EUR 200m
Shifting gear in UPM transformation
10
UPM
Biorefining
UPM
Paper
Asia
UPM
Raflatac
UPM
Energy
UPM
Paper
ENA
UPM
Plywood
EBITDA target for
growth initiatives
EUR 200m
Biofuels:
Lappeenranta
biorefinery
Pulp: 10%
capacity increase
Labelling materials
Changshu expansion
Self-adhesive labels:
advancing in growth
markets and in higher
value added products
Business portfolio
development and
value creation
BIOCHEMICALS
BIOCOMPOSITES
BIOFUELS
New businesses1.

| © UPM
Profit improvement programme
progressing fast
0
50
100
150
200
250
Q213 Q313 Q413 Q114 Q214 Q314 Q414 Q115
11
EURm
Full impact of the programme is expected by the end
of 2014 as compared with the Q2/13 results
78%
achieved
in Q1/14
EUR 200m
annualised
fixed and
variable
cost
savings

| © UPM
Profit
improvement
programme
EUR 200m
Shifting gear in UPM transformation
12
UPM
Biorefining
UPM
Paper
Asia
UPM
Raflatac
UPM
Energy
UPM
Paper
ENA
UPM
Plywood
EBITDA target for
growth initiatives
EUR 200m
Biofuels:
Lappeenranta
biorefinery
Pulp: 10%
capacity increase
Labelling materials
Changshu expansion
Self-adhesive labels:
advancing in growth
markets and in higher
value added products
Business portfolio
development and
value creation
BIOCHEMICALS
BIOCOMPOSITES
BIOFUELS
New businesses
2.

| © UPM
Progress in the growth projects targeting
EUR 200m of additional EBITDA
Decisions in 2014
• Changshu labelling materials, 360,000t, start-up by the end of 2015
• Kymi pulp mill expansion, 170,000t, start-up by the end of 2015
• 50% increase in self-adhesive labelstock coating capacity in APAC,
increase filmic labelstock capacity in Europe, start-ups by early 2015
Continued implementation
• Lappeenranta renewable diesel, 100,000t start-up summer 2014
• Pietarsaari pulp mill expansion, 70,000t, start-up summer 2014
Further debottlenecking potential at Fray Bentos and Kaukas pulp mills
Targeted additional EBITDA EUR 200m when all projects in full
operation, total capex estimate EUR 680m over three years
13

| © UPM
Profit
improvement
programme
EUR 200m
Shifting gear in UPM transformation
14
UPM
Biorefining
UPM
Paper
Asia
UPM
Raflatac
UPM
Energy
UPM
Paper
ENA
UPM
Plywood
EBITDA target for
growth initiatives
EUR 200m
Biofuels:
Lappeenranta
biorefinery
Pulp: 10%
capacity increase
Labelling materials
Changshu expansion
Self-adhesive labels:
advancing in growth
markets and in higher
value added products
Business portfolio
development and
value creation
BIOCHEMICALS
BIOCOMPOSITES
BIOFUELS
New businesses
3.

| © UPM
Portfolio development and value creation
• Performance: targeting top performance
in each business
• Grow: focused high-return growth
investments and synergistic M&A
• Simplify: best value realisation for UPM
• Consolidation in European paper
market, without increasing capital
15 | © UPM

| © UPM
Profit
improvement
programme
EUR 200m
Shifting gear in UPM transformation
16
UPM
Biorefining
UPM
Paper
Asia
UPM
Raflatac
UPM
Energy
UPM
Paper
ENA
UPM
Plywood
EBITDA target for
growth initiatives
EUR 200m
Biofuels:
Lappeenranta
biorefinery
Pulp: 10%
capacity increase
Labelling materials
Changshu expansion
Self-adhesive labels:
advancing in growth
markets and in higher
value added products
Business portfolio
development and
value creation
BIOCHEMICALS
BIOCOMPOSITES
BIOFUELS
New businesses
4.

| © UPM| © UPM
• Biofuels renewable drop-in
diesel suitable for all diesel
engines
• Biochemicals renewable
drop-in alternatives for oil-
based chemicals
• Biocomposites for injection
moulding to replace oil-based
raw materials
0
50
100
150
200
250
300
350
2009 2010 2011 2012 2013
Annual patent filings 2009–2013
17
New businesses based on UPM’s
development work
PERFORMANCE
18 | © UPM

| © UPM
0
2
4
6
8
10
12
2008 2009 2010 2011 2012 2013 Q1/14
-6,0
-4,0
-2,0
0,0
2,0
4,0
6,0
8,0
10,0
2008 2009 2010 2011 2012 2013 2014E
Operating profit excl. special items
Profitability over two economic slowdowns
Europe has underperformed
the other major economic zones
Real GDP y-o-y growth % % of sales
EU
US
Emerging markets
19
Real GDP y-o-y growth %
5.4
3.5
8.2
6.8
5.3
6.8
Source: IHS Global Insight
7.3
LTM

| © UPM
Strong Q1 2014 results show momentum in
the profit improvement programme
Profit improvement programme progressed fast, with 78% of the
targeted annualised EUR 200m cost savings achieved in Q1/14
Q1/14 EBITDA was EUR 313m (284m in Q1/13), 12.6% of sales
Operating profit excl. special items was EUR 196m (144m in Q1/13),
7.9% of sales
Strong operating cash flow of EUR 264m (103m in Q1/13)
Net debt decreased to EUR 2,777m (3,199m in Q1/13) and net debt
to EBITDA to 2.4x (2.6x in Q1/13)
| © UPM20

| © UPM
Operating profit *) by business area
21
0
2
4
6
8
10
0
10
20
30
40
50
Q312
Q412
Q113
Q213
Q313
Q413
Q114
0
4
8
12
16
20
0
20
40
60
80
100
Q312
Q412
Q113
Q213
Q313
Q413
Q114
0
10
20
30
40
50
0
20
40
60
80
100
Q312
Q412
Q113
Q213
Q313
Q413
Q114
0
2
4
6
8
10
0
10
20
30
40
50
Q312
Q412
Q113
Q213
Q313
Q413
Q114
-4
-2
0
2
4
6
-40
-20
0
20
40
60
Q312
Q412
Q113
Q213
Q313
Q413
Q114
-3
0
3
6
9
12
-5
0
5
10
15
20
Q312
Q412
Q113
Q213
Q313
Q413
Q114
EURm % of salesUPM Paper Asia EURm % of salesUPM Paper ENA EURm % of salesUPM Plywood
EURm % of salesUPM RaflatacEURm % of salesUPM EnergyEURm % of salesUPM Biorefining
*) excluding special items

| © UPM
0
200
400
600
800
1 000
1 200
1 400
2008 2009 2010 2011 2012 2013 Q1/14
Strong cash flow
22
Operating cash flow
Cash flow
after investing
activities
Cash flowEUR million
LTM

| © UPM
0,00
0,10
0,20
0,30
0,40
0,50
0,60
0,70
0,80
2008 2009 2010 2011 2012 2013
Cash flow based dividend
EUR per
share
0.40
0.45
0.55
23
Dividend policy
• at least 1/3 of net cash flow from
operating activities less
operational capital expenditure
• net cash flow calculated as an
average over three years
Minimum dividend by the
policy
• EUR 0.45 per share
Dividend for 2013
• EUR 0.60 (0.60) per share
0.60 0.60 0.60
Dividend

| © UPM
Low investment needs in existing assets allow
growth projects with modest total capex
24
0
200
400
600
800
1 000
1 200
2008 2009 2010 2011 2012 2013 2014e
EUR million
Operational investments
329
Capital expenditure
Strategic investments
Depreciation
Uruguay
acquisition
Myllykoski
acquisition
450
Estimate

| © UPM
Strengthening balance sheet
25
2 000
2 500
3 000
3 500
4 000
4 500
5 000
5 500
2008
2009
2010
2011
2012
2013
2014
1,0
1,5
2,0
2,5
3,0
3,5
4,0
4,5
Net debt, EUR millionNet debt / EBITDA(trailing 12 months)
Net debt
Net debt / EBITDA
2.4
2 000
2 500
3 000
3 500
4 000
4 500
5 000
5 500
2008
2009
2010
2011
2012
2013
2014
20
30
40
50
60
70
80
90
Net debt, EUR million Gearing %
Net debt
Gearing
37
Liquidity was EUR 2.0bn at the end of Q1 2014
Repayments total EUR 0.5bn in 2014
SUMMARY
26 | © UPM

| © UPM
Profit
improvement
programme
EUR 200m
Shifting gear in UPM transformation
27
UPM
Biorefining
UPM
Paper
Asia
UPM
Raflatac
UPM
Energy
UPM
Paper
ENA
UPM
Plywood
EBITDA target for
growth initiatives
EUR 200m
Biofuels:
Lappeenranta
biorefinery
Pulp: 10%
capacity increase
Labelling materials
Changshu expansion
Self-adhesive labels:
advancing in growth
markets and in higher
value added products
Business portfolio
development and
value creation
BIOCHEMICALS
BIOCOMPOSITES
BIOFUELS
New businesses
