wilson elementary school school accountability report card
TRANSCRIPT
2015-16 School Accountability Report Card for Wilson Elementary School Page 1 of 12
Wilson Elementary School
School Accountability Report Card
Reported Using Data from the 2015-16 School Year
Published During 2016-17
By February 1 of each year, every school in California is required by state law to publish a School Accountability Report Card (SARC). The SARC contains information about the condition and performance of each California public school. Under the Local Control Funding Formula (LCFF) all local educational agencies (LEAs) are required to prepare a Local Control and Accountability Plan (LCAP), which describes how they intend to meet annual school-specific goals for all pupils, with specific activities to address state and local priorities. Additionally, data reported in an LCAP is to be consistent with data reported in the SARC. • For more information about SARC requirements, see the California Department of Education (CDE) SARC Web page at
http://www.cde.ca.gov/ta/ac/sa/. • For more information about the LCFF or LCAP, see the CDE LCFF Web page at http://www.cde.ca.gov/fg/aa/lc/. • For additional information about the school, parents/guardians and community members should contact the school principal or
the district office. DataQuest DataQuest is an online data tool located on the CDE DataQuest Web page at http://dq.cde.ca.gov/dataquest/ that contains additional information about this school and comparisons of the school to the district and the county. Specifically, DataQuest is a dynamic system that provides reports for accountability (e.g., test data, enrollment, high school graduates, dropouts, course enrollments, staffing, and data regarding English learners). Internet Access Internet access is available at public libraries and other locations that are publicly accessible (e.g., the California State Library). Access to the Internet at libraries and public locations is generally provided on a first-come, first-served basis. Other use restrictions may include the hours of operation, the length of time that a workstation may be used (depending on availability), the types of software programs available on a workstation, and the ability to print documents.
About This School Contact Information (School Year 2016-17)
School Contact Information
School Name------- Wilson Elementary School
Street------- 3775 Bodega Ave.
City, State, Zip------- Petaluma, CA 94952
Phone Number------- (707) 765-4340
Principal------- Eric Hoppes
E-mail Address------- [email protected]
Web Site------- www.wilsonschoolpetaluma.org
CDS Code 49 71019 6052344

2015-16 School Accountability Report Card for Wilson Elementary School Page 2 of 12
District Contact Information
District Name------- Wilmar Union Elementary School District
Phone Number------- (707) 765-4340
Superintendent------- Eric Hoppes
E-mail Address------- [email protected]
Web Site------- www.wilsonschoolpetaluma.org
School Description and Mission Statement (School Year 2016-17)
Wilson Elementary School has an excellent reputation as an engaging environment in which children develop academically as well as socially, and emotionally. The staff, students, and parents are committed to a high standard of academics and character education. Our Academic Performance Index (API) score of 875 on the spring 2013 California Standards Tests continues to validate this commitment and work. Our commitment to the State Common Core Standards helped Wilson do well on the first year of the new computerized State tests. We are very proud of this academic success, but are equally proud of how our students continue to succeed after leaving Wilson School. To encourage high academic learning and positive social behavior, our Students of the Month program is based equally on academic subjects and character traits. Students chosen for this honor are recognized at our monthly Board of Education meetings. Students are also recognized by teachers at our weekly assembly for displaying good character traits through our “WOW” program (Wilson’s Outstanding Wildcats). The statistics you will see on the following pages tell only part of the story. We invite you to visit Wilson School and see how our small learning community is a wonderful place for children to grow into responsible, thoughtful, educated confident, healthy and happy community members. When you visit, you will see how a small, rural school is preparing its students to become intelligent, hardworking, emotionally and mentally strong, compassionate and responsible citizens. School Mission Statement We, the Wilmar Union Elementary School District, in partnership with our parents and our community lay the foundation of our children’s education. We hold our students, and ourselves, to high standards by providing high quality instruction and materials. We assess our students’ abilities, and then teach them so that they may reach their highest academic potential. We create a safe, caring environment in which children can develop well-rounded interests and where they learn to respect and value others as contributing members of a community that supports a life-long love of learning. Student Enrollment by Grade Level (School Year 2015-16)
Grade Number of
Level Students
Kindergarten 65
Grade 1 30
Grade 2 26
Grade 3 25
Grade 4 34
Grade 5 30
Grade 6 25
Total Enrollment 235
2015-16 School Accountability Report Card for Wilson Elementary School Page 3 of 12
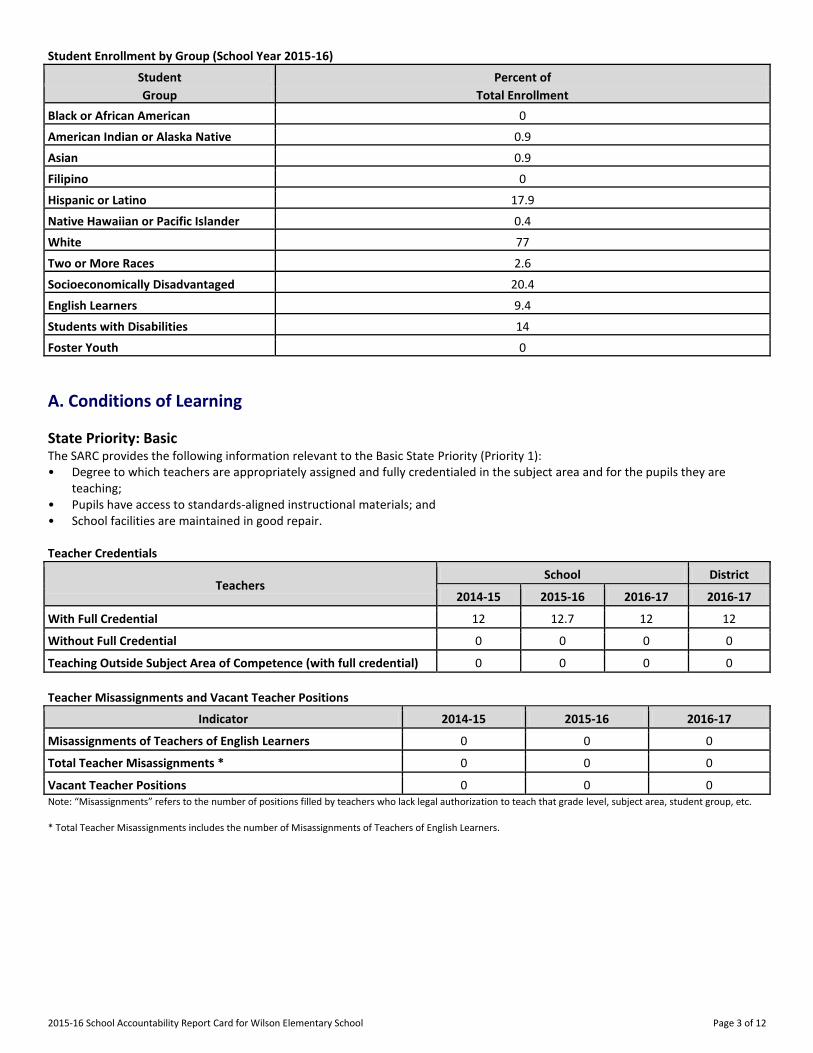
Student Enrollment by Group (School Year 2015-16)
Student Percent of
Group Total Enrollment
Black or African American 0
American Indian or Alaska Native 0.9
Asian 0.9
Filipino 0
Hispanic or Latino 17.9
Native Hawaiian or Pacific Islander 0.4
White 77
Two or More Races 2.6
Socioeconomically Disadvantaged 20.4
English Learners 9.4
Students with Disabilities 14
Foster Youth 0
A. Conditions of Learning
State Priority: Basic The SARC provides the following information relevant to the Basic State Priority (Priority 1): • Degree to which teachers are appropriately assigned and fully credentialed in the subject area and for the pupils they are
teaching; • Pupils have access to standards-aligned instructional materials; and • School facilities are maintained in good repair. Teacher Credentials
Teachers School District
2014-15 2015-16 2016-17 2016-17
With Full Credential 12 12.7 12 12
Without Full Credential 0 0 0 0
Teaching Outside Subject Area of Competence (with full credential) 0 0 0 0
Teacher Misassignments and Vacant Teacher Positions
Indicator 2014-15 2015-16 2016-17
Misassignments of Teachers of English Learners 0 0 0
Total Teacher Misassignments * 0 0 0
Vacant Teacher Positions 0 0 0 Note: “Misassignments” refers to the number of positions filled by teachers who lack legal authorization to teach that grade level, subject area, student group, etc. * Total Teacher Misassignments includes the number of Misassignments of Teachers of English Learners.

2015-16 School Accountability Report Card for Wilson Elementary School Page 4 of 12
Core Academic Classes Taught by Highly Qualified Teachers (School Year 2015-16)
Location of Classes Percent of Classes In Core Academic Subjects
Taught by Highly Qualified Teachers Not Taught by Highly Qualified Teachers
This School 100.0 0.0
All Schools in District 100.0 0.0
High-Poverty Schools in District 0.0 0.0
Low-Poverty Schools in District 100.0 0.0 Note: High-poverty schools are defined as those schools with student eligibility of approximately 40 percent or more in the free and reduced price meals program. Low-poverty schools are those with student eligibility of approximately 39 percent or less in the free and reduced price meals program. Quality, Currency, Availability of Textbooks and Instructional Materials (School Year 2016-17) Year and month in which data were collected: January 2017
Subject Textbooks and Instructional Materials/
Year of Adoption
From Most Recent
Adoption?
Percent of Students Lacking Own
Assigned Copy
Reading/Language Arts Pearson Education: Reading Street K-6 c. 2013 Yes 0
Mathematics Engage New York, 2013 Yes 0
Science Macmillan/McGraw-Hill, (K-5, c. 2008)
Pearson/Prentice-Hall, (6 grade, c. 2008)
Yes 0
History-Social Science Houghton Mifflin, (K-6, c. 2007)
Yes 0
School Facility Conditions and Planned Improvements (Most Recent Year)
Wilson Elementary School was established in 1863. Our current buildings were erected in 1957, modernized in 2003 and remodeled in 2015. The school has 11 regular classrooms, a library, computer lab, multipurpose room, and three portable classrooms used for instruction. In November 2012, our community voted to pass Measure P to bring needed funds to our school to upgrade/remodel our facilities and to improve our technology infrastructure. In the summer of 2014 Bond work was completed to replace a major portion of our sewer system, to expand and remodel our main office and to replace the louvered windows in all classrooms. During the summer of 2015 every regular classroom was remodeled with new flooring, new wall coverings and new ceiling tiles. Insulation was added to the ceiling to make the school more energy efficient. In the Summer of 2016 we plan to add Solar Power to our campus to virtually eliminate our electrical power use from the grid. Physical Education/play facilities include three updated playgrounds (Kindergarten, 1st -3rd grades and 4th-6th grades), a soccer/football field, and a newly developed baseball field with a track around it. Wilson Elementary School recently completed a mile-long water pipeline project to bring Petaluma City drinking water to the school. In March of 2010 our eleven-year pursuit to bring water from the City of Petaluma to Wilson School was finally complete. We now have a reliable source of drinking water and only use our well for irrigation. The Wilson School Water Project was paid for by Federal and State funds through the American Recovery and Reinvestment Act of 2009. All facilities are kept in safe and clean condition. Buildings and grounds are clean and routinely inspected, maintained, repaired or upgraded as needed. Landscaping is cared for weekly and there have been modernization projects that included a new roof for our school.

2015-16 School Accountability Report Card for Wilson Elementary School Page 5 of 12
School Facility Good Repair Status (Most Recent Year)
School Facility Good Repair Status (Most Recent Year) Year and month of the most recent FIT report: January 16, 2017
System Inspected Repair Status Repair Needed and
Action Taken or Planned Good Fair Poor
Systems: Gas Leaks, Mechanical/HVAC, Sewer
X
Interior: Interior Surfaces X
Cleanliness: Overall Cleanliness, Pest/ Vermin Infestation
X
Electrical: Electrical X
Restrooms/Fountains: Restrooms, Sinks/ Fountains
X
Safety: Fire Safety, Hazardous Materials X
Structural: Structural Damage, Roofs X
External: Playground/School Grounds, Windows/ Doors/Gates/Fences
X
Overall Facility Rating (Most Recent Year)
Year and month of the most recent FIT report: January 16, 2017
Overall Rating Exemplary Good Fair Poor
X
B. Pupil Outcomes
State Priority: Pupil Achievement The SARC provides the following information relevant to the State priority: Pupil Achievement (Priority 4): • Statewide assessments (i.e., California Assessment of Student Performance and Progress [CAASPP] System, which includes the
Smarter Balanced Summative Assessments for students in the general education population and the California Alternate Assessments [CAAs] for English language arts/literacy [ELA] and mathematics given in grades three through eight and grade eleven. The CAAs have replaced the California Alternate Performance Assessment [CAPA] for ELA and mathematics, which were eliminated in 2015. Only eligible students may participate in the administration of the CAAs. CAA items are aligned with alternate achievement standards, which are linked with the Common Core State Standards [CCSS] for students with significant cognitive disabilities); and
• The percentage of students who have successfully completed courses that satisfy the requirements for entrance to the University of California and the California State University, or career technical education sequences or programs of study
CAASPP Test Results in English Language Arts/Literacy (ELA) and Mathematics for All Students
Subject
Percent of Students Meeting or Exceeding the State Standards (grades 3-8 and 11)
School District State
2014-15 2015-16 2014-15 2015-16 2014-15 2015-16
English Language Arts/Literacy 59 67 59 67 44 48
Mathematics 64 56 64 56 34 36 Note: Percentages are not calculated when the number of students tested is ten or less, either because the number of students in this category is too small for statistical accuracy or to protect student privacy.
2015-16 School Accountability Report Card for Wilson Elementary School Page 6 of 12
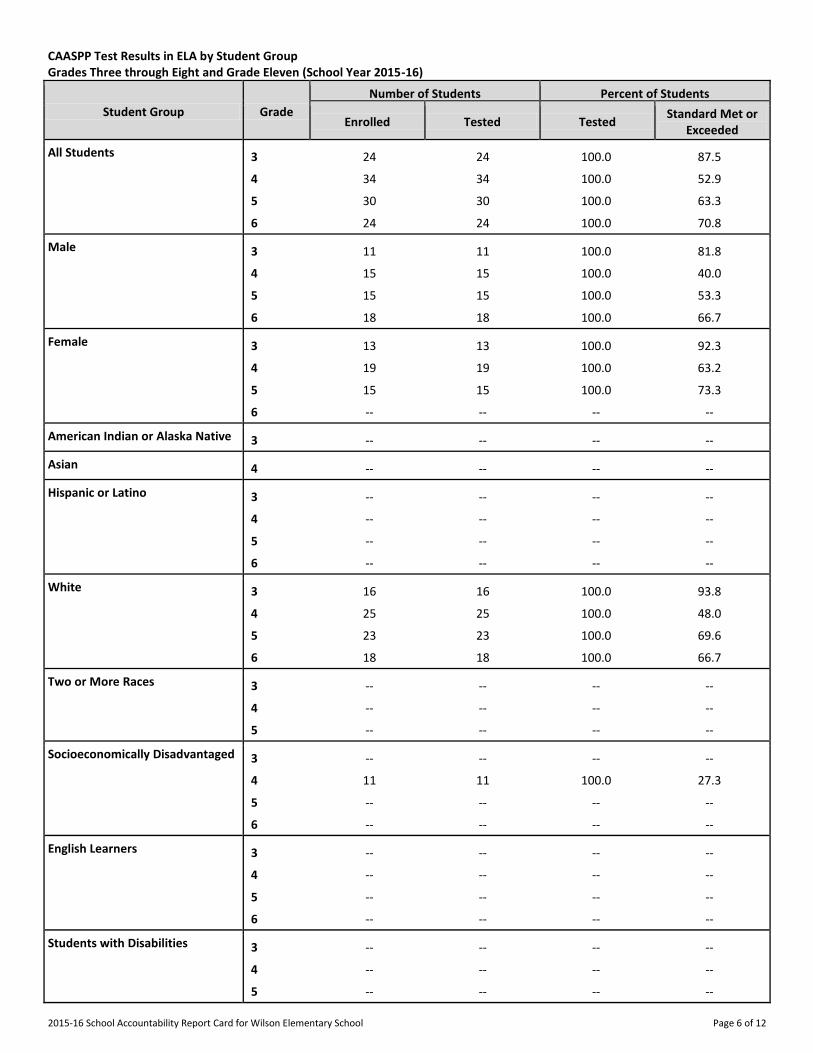
CAASPP Test Results in ELA by Student Group Grades Three through Eight and Grade Eleven (School Year 2015-16)
Student Group Grade
Number of Students Percent of Students
Enrolled Tested Tested Standard Met or
Exceeded
All Students 3 24 24 100.0 87.5
4 34 34 100.0 52.9
5 30 30 100.0 63.3
6 24 24 100.0 70.8
Male 3 11 11 100.0 81.8
4 15 15 100.0 40.0
5 15 15 100.0 53.3
6 18 18 100.0 66.7
Female 3 13 13 100.0 92.3
4 19 19 100.0 63.2
5 15 15 100.0 73.3
6 -- -- -- --
American Indian or Alaska Native 3 -- -- -- --
Asian 4 -- -- -- --
Hispanic or Latino 3 -- -- -- --
4 -- -- -- --
5 -- -- -- --
6 -- -- -- --
White 3 16 16 100.0 93.8
4 25 25 100.0 48.0
5 23 23 100.0 69.6
6 18 18 100.0 66.7
Two or More Races 3 -- -- -- --
4 -- -- -- --
5 -- -- -- --
Socioeconomically Disadvantaged 3 -- -- -- --
4 11 11 100.0 27.3
5 -- -- -- --
6 -- -- -- --
English Learners 3 -- -- -- --
4 -- -- -- --
5 -- -- -- --
6 -- -- -- --
Students with Disabilities 3 -- -- -- --
4 -- -- -- --
5 -- -- -- --

2015-16 School Accountability Report Card for Wilson Elementary School Page 7 of 12
Student Group Grade
Number of Students Percent of Students
Enrolled Tested Tested Standard Met or
Exceeded
6 -- -- -- --
Foster Youth 3 -- -- -- --
4 -- -- -- --
5 -- -- -- --
6 -- -- -- --
Note: ELA test results include the Smarter Balanced Summative Assessment and the CAA. The “Percent Met or Exceeded” is calculated by taking the total number of students who met or exceeded the standard on the Smarter Balanced Summative Assessment plus the total number of students who met the standard on the CAAs divided by the total number of students who participated in both assessments. Double dashes (--) appear in the table when the number of students is ten or less, either because the number of students in this category is too small for statistical accuracy or to protect student privacy. Note: The number of students tested includes all students who participated in the test whether they received a score or not; however, the number of students tested is not the number that was used to calculate the achievement level percentages. The achievement level percentages are calculated using only students who received scores.
CAASPP Test Results in Mathematics by Student Group Grades Three through Eight and Grade Eleven (School Year 2015-16)
Student Group Grade
Number of Students Percent of Students
Enrolled Tested Tested Standard Met or
Exceeded
All Students 3 24 24 100.0 79.2
4 34 34 100.0 52.9
5 30 30 100.0 43.3
6 24 24 100.0 54.2
Male 3 11 11 100.0 81.8
4 15 15 100.0 40.0
5 15 15 100.0 46.7
6 18 18 100.0 50.0
Female 3 13 13 100.0 76.9
4 19 19 100.0 63.2
5 15 15 100.0 40.0
6 -- -- -- --
American Indian or Alaska Native 3 -- -- -- --
Asian 4 -- -- -- --
Hispanic or Latino 3 -- -- -- --
4 -- -- -- --
5 -- -- -- --
6 -- -- -- --
White 3 16 16 100.0 81.3
4 25 25 100.0 56.0
5 23 23 100.0 43.5
6 18 18 100.0 50.0

2015-16 School Accountability Report Card for Wilson Elementary School Page 8 of 12
Student Group Grade
Number of Students Percent of Students
Enrolled Tested Tested Standard Met or
Exceeded
Two or More Races 3 -- -- -- --
4 -- -- -- --
5 -- -- -- --
Socioeconomically Disadvantaged 3 -- -- -- --
4 11 11 100.0 18.2
5 -- -- -- --
6 -- -- -- --
English Learners 3 -- -- -- --
4 -- -- -- --
5 -- -- -- --
6 -- -- -- --
Students with Disabilities 3 -- -- -- --
4 -- -- -- --
5 -- -- -- --
6 -- -- -- --
Foster Youth 3 -- -- -- --
4 -- -- -- --
5 -- -- -- --
6 -- -- -- --
Note: Mathematics test results include the Smarter Balanced Summative Assessment and the CAA. The “Percent Met or Exceeded” is calculated by taking the total number of students who met or exceeded the standard on the Smarter Balanced Summative Assessment plus the total number of students who met the standard on the CAAs divided by the total number of students who participated in both assessments. Double dashes (--) appear in the table when the number of students is ten or less, either because the number of students in this category is too small for statistical accuracy or to protect student privacy. Note: The number of students tested includes all students who participated in the test whether they received a score or not; however, the number of students tested is not the number that was used to calculate the achievement level percentages. The achievement level percentages are calculated using only students who received scores.
CAASPP Test Results in Science for All Students
Subject
Percent of Students Scoring at Proficient or Advanced (meeting or exceeding the state standards)
School District State
2013-14 2014-15 2015-16 2013-14 2014-15 2015-16 2013-14 2014-15 2015-16
Science (grades 5, 8, and 10) 100 84 69 100 84 69 60 56 54 Note: Science test results include California Standards Tests (CSTs), California Modified Assessment (CMA), and California Alternate Performance Assessment (CAPA) in grades five, eight, and ten. Note: Scores are not shown when the number of students tested is ten or less, either because the number of students in this category is too small for statistical accuracy or to protect student privacy.

2015-16 School Accountability Report Card for Wilson Elementary School Page 9 of 12
CAASPP Test Results in Science by Student Group Grades Five, Eight, and Ten (School Year 2015-16)
Student Group
Total Enrollment
# of Students with Valid Scores
% of Students with Valid Scores
% of Students Proficient or
Advanced
All Students 30 29 96.7 69.0
Male 15 14 93.3 71.4
Female 15 15 100.0 66.7
White 23 23 100.0 73.9 Note: Science test results include CSTs, CMA, and CAPA in grades five, eight, and ten. The “Proficient or Advanced” is calculated by taking the total number of students who scored at Proficient or Advanced on the science assessment divided by the total number of students with valid scores. Note: Scores are not shown when the number of students tested is ten or less, either because the number of students in this category is too small for statistical accuracy or to protect student privacy.
State Priority: Other Pupil Outcomes The SARC provides the following information relevant to the Other Pupil Outcomes State Priority (Priority 8): • Pupil outcomes in the subject areas of physical education. California Physical Fitness Test Results (School Year 2015-16)
Grade Level
Percent of Students Meeting Fitness Standards
Four of Six Standards Five of Six Standards Six of Six Standards
---5--- 3.3 13.3 80 Note: Percentages are not calculated when the number of students tested is ten or less, either because the number of students in this category is too small for statistical accuracy or to protect student privacy.
C. Engagement
State Priority: Parental Involvement The SARC provides the following information relevant to the Parental Involvement State Priority (Priority 3): • Efforts the school district makes to seek parent input in making decisions for the school district and each schoolsite. Opportunities for Parental Involvement (School Year 2016-17)
Contact Person: Michelle Machado Contact Phone No.: (707) 765-4340 Parents are encouraged to take an active role at Wilson School and we are pleased to have many parent volunteers. Some parents volunteer in our classrooms while others find alternative ways to support their children at Wilson School. They support our learning environment by assisting with field trips, extracurricular activities, fund raising, and campus beautification. Each year PTA raises funds to help pay for field trips, assemblies, parties and our end of year Fun Day. Parents are an integral part of making Wilson School a special place for kids to learn and grow.

2015-16 School Accountability Report Card for Wilson Elementary School Page 10 of 12
State Priority: School Climate The SARC provides the following information relevant to the School Climate State Priority (Priority 6): • Pupil suspension rates; • Pupil expulsion rates; and • Other local measures on the sense of safety. Suspensions and Expulsions
Rate School District State
2013-14 2014-15 2015-16 2013-14 2014-15 2015-16 2013-14 2014-15 2015-16
Suspensions------- 0.0 0.0 0.0 0.0 0.0 0.0 4.4 3.8 3.7
Expulsions------- 0.0 0.0 0.0 0.0 0.0 0.0 0.1 0.1 0.1
School Safety Plan (School Year 2016-17)
Safety of students and staff is a primary concern of Wilson Elementary School. We have a safety committee that meets quarterly. The job of this committee is to update the safety plan, to inform staff of their duties and to do campus safety inspections. The School Safety Plan was last reviewed by the committee on January 21, 2016. Key elements of the plan include drills for earthquakes, fires, and general safety as well as crisis intervention plans. Parents can access the Safety Plan in the school office. The plan is now updated each year in September so new staff are familiar with their roles.
D. Other SARC Information
The information in this section is required to be in the SARC but is not included in the state priorities for LCFF. Federal Intervention Program (School Year 2016-17)
Indicator School District
Program Improvement Status Not in PI Not In PI
First Year of Program Improvement
Year in Program Improvement*
Number of Schools Currently in Program Improvement N/A 0
Percent of Schools Currently in Program Improvement N/A .0 Note: Cells with N/A values do not require data.
Average Class Size and Class Size Distribution (Elementary)
Grade Level
2013-14 2014-15 2015-16
Avg. Class Size
Number of Classes Avg. Class Size
Number of Classes Avg. Class Size
Number of Classes
1-20 21-32 33+ 1-20 21-32 33+ 1-20 21-32 33+
K
15 3 18 4 18 4
1
13 2 23 1 17 2
2
18 1 1 13 1 1 23 1
3
15 1 1 18 2 24 1
4
25 1 15 1 1 33 1
5
20 1 16 1 1 28 1
6
31 1 10 2 22 1
Other
7 1 6 1 Number of classes indicates how many classes fall into each size category (a range of total students per class).

2015-16 School Accountability Report Card for Wilson Elementary School Page 11 of 12
Academic Counselors and Other Support Staff (School Year 2015-16)
Title Number of FTE
Assigned to School Average Number of Students per
Academic Counselor
Academic Counselor------- 0 0
Counselor (Social/Behavioral or Career Development) .4 N/A
Library Media Teacher (Librarian) N/A
Library Media Services Staff (Paraprofessional) 1.2 N/A
Psychologist------- .1 N/A
Social Worker------- 0 N/A
Nurse------- .05 N/A
Speech/Language/Hearing Specialist .6 N/A
Resource Specialist------- 0 N/A
Other------- 0 N/A Note: Cells with N/A values do not require data. *One Full Time Equivalent (FTE) equals one staff member working full time; one FTE could also represent two staff members who each work 50 percent of full time.
Expenditures per Pupil and School Site Teacher Salaries (Fiscal Year 2014-15)
Level
Expenditures Per Pupil Average Teacher Salary Total
Supplemental/ Restricted
Basic/ Unrestricted
School Site------- $7,345 $2,011 $5,334 $60,748
District------- N/A N/A $5,334 $60,748
Percent Difference: School Site and District N/A N/A 0.0 0.0
State------- N/A N/A $5,677 $60,556
Percent Difference: School Site and State N/A N/A -6.0 0.3 Note: Cells with N/A values do not require data.
Types of Services Funded (Fiscal Year 2015-16)
The following is a list of Federal and State funded programs that are provided to students: Title I (Basic Grant) Title III (for Limited English Proficient Students) Special Education National School Lunch Program Grade Span Adjustment (GSA)

2015-16 School Accountability Report Card for Wilson Elementary School Page 12 of 12
Teacher and Administrative Salaries (Fiscal Year 2014-15)
Category District Amount State Average for Districts In Same Category
Beginning Teacher Salary $46,644 $41,085
Mid-Range Teacher Salary $60,799 $59,415
Highest Teacher Salary $76,385 $75,998
Average Principal Salary (Elementary) $100,438
Average Principal Salary (Middle) $101,868
Average Principal Salary (High)
Superintendent Salary $126,879 $116,069
Percent of Budget for Teacher Salaries 39% 33%
Percent of Budget for Administrative Salaries 6% 7% For detailed information on salaries, see the CDE Certificated Salaries & Benefits Web page at http://www.cde.ca.gov/ds/fd/cs/. Professional Development (Most Recent Three Years)
Wilmar Union Elementary School District devotes three days each school year to teachers’ professional development. The school uses the Professional Learning Community (PLC) approach where teachers and administration work collaboratively to choose the focus for staff development. We continue to focus on teaching strategies that support 21st Century Skills of: Critical Thinking, Communication, Collaboration, and Creativity. During the 2016-17 school year two teachers are attending f training on the Next Generation Science Standards to assist the overall staff in moving to full implementation. One of those teachers is a .2 FTE special assignment to lead the school in conversion to NGSS. All teachers are also encouraged to participate in workshops, conferences, and other training that will enhance instructional practices. Teachers give reports to the whole faculty from the training they attend. Teachers new to the profession participate in the North Coast Teacher Induction Program (NCTIP), designed to support new teachers through training and individual coaching.