anderson elementary school school accountability report
TRANSCRIPT

2019-20 School Accountability Report Card for Anderson Elementary School Page 1 of 11
Anderson Elementary School
School Accountability Report Card
Reported Using Data from the 2019-2020 School Year
Published During 2020-2021
By February 1 of each year, every school in California is required by state law to publish a School Accountability Report Card (SARC). The SARC contains information about the condition and performance of each California public school. Under the Local Control Funding Formula (LCFF) all local educational agencies (LEAs) are required to prepare a Local Control and Accountability Plan (LCAP), which describes how they intend to meet annual school-specific goals for all pupils, with specific activities to address state and local priorities. Additionally, data reported in an LCAP is to be consistent with data reported in the SARC.
• For more information about SARC requirements and access to prior year reports, see the California Department of Education (CDE) SARC web page at https://www.cde.ca.gov/ta/ac/sa/.
• For more information about the LCFF or the LCAP, see the CDE LCFF webpage at https://www.cde.ca.gov/fg/aa/lc/.
• For additional information about the school, parents/guardians and community members should contact the school principal or the district office.
DataQuest DataQuest is an online data tool located on the CDE DataQuest web page at https://dq.cde.ca.gov/dataquest/ that contains additional information about this school and comparisons of the school to the district and the county. Specifically, DataQuest is a dynamic system that provides reports for accountability (e.g., test data, enrollment, high school graduates, dropouts, course enrollments, staffing, and data regarding English learners). California School Dashboard The California School Dashboard (Dashboard) https://www.caschooldashboard.org/ reflects California’s new accountability and continuous improvement system and provides information about how LEAs and schools are meeting the needs of California’s diverse student population. The Dashboard contains reports that display the performance of LEAs, schools, and student groups on a set of state and local measures to assist in identifying strengths, challenges, and areas in need of improvement.
About This School
School Contact Information (School Year 2020-2021)
Entity Contact Information
School Name Anderson Elementary School
Street 415 East C St.
City, State, Zip Dixon, CA 95620
Phone Number (707) 693-6360
Principal Rayito Farris
Email Address [email protected]
Website http://anderson.dixonusd.org/
County-District-School (CDS) Code 48 70532 6051049

2019-20 School Accountability Report Card for Anderson Elementary School Page 2 of 11
District Contact Information (School Year 2020-2021)
Entity Contact Information
District Name Dixon Unified School District
Phone Number (707) 693-6300
Superintendent Brian Dolan
Email Address [email protected]
Website www.dixonusd.org
School Description and Mission Statement (School Year 2020-2021)
Anderson Elementary is located in Dixon, California, a small town of 18,000 in northern Solano County. The school serves approximately 500 children and transitional kindergarten through sixth grade. Anderson's goal is to provide a nurturing and academically rigorous community where students reach individual learning success and take pride in their education. The school and broader community defined the school's mission as The Anderson community will develop leaders one child at a time by closing the achievement gap and preparing all students for college and career readiness for success in a global society. Approximately 50% of our students are English Learners, with Spanish being their primary language of all but a few families. Students are educated in English only but supported through English Language Development (ELD). The school provides ELD for forty-five minutes, four times a week. School goals are supported by the Local Control Accountability Plan (LCAP) with the help of the School Site Council (SSC), English Learner Advisory Committee (ELAC), and staff. The staff receives ongoing professional development in academic areas, in addition to school climate and safety. About Our School Anderson Elementary is the first elementary school established in the Dixon Unified School District and has served many generations in the community. Staff, students, and parents take pride in their school and are eager to share their own personal experiences from attending Anderson. The community is an integral part of the school and proud supporters of staff and students. Students at Anderson receive rigorous academic instruction from highly qualified teachers with high expectations. Students are introduced to technology and taught 21st-century skills that will carry them into the future. In grades Kindergarten and first-grade students utilize iPads to enhance their learning, in grade second through fifth; each student has access to their own netbook. This year staff and students have implemented The Leader In Me and AVID to additionally support students’ academic and social-emotional growth.
Student Enrollment by Grade Level (School Year 2019-2020)
Grade Level Number of Students
Kindergarten 108
Grade 1 65
Grade 2 87
Grade 3 69
Grade 4 72
Grade 5 65
Total Enrollment 466

2019-20 School Accountability Report Card for Anderson Elementary School Page 3 of 11
Student Enrollment by Student Group (School Year 2019-2020)
Student Group Percent of Total Enrollment
Black or African American 2.1
Filipino 0.4
Hispanic or Latino 74.7
White 15.9
Two or More Races 4.9
Socioeconomically Disadvantaged 75.1
English Learners 37.8
Students with Disabilities 13.9
Homeless 7.3
A. Conditions of Learning
State Priority: Basic The SARC provides the following information relevant to the State priority: Basic (Priority 1):
• Degree to which teachers are appropriately assigned and fully credentialed in the subject area and for the pupils they are teaching;
• Pupils have access to standards-aligned instructional materials; and • School facilities are maintained in good repair
Teacher Credentials
Teachers School
2018-19 School
2019-20 School
2020-21 District 2020-21
With Full Credential 24 26 25 144
Without Full Credential 1 1 1 7
Teaching Outside Subject Area of Competence (with full credential) 1 0 0 3
Teacher Misassignments and Vacant Teacher Positions
Indicator 2018-19 2019-20 2020-21
Misassignments of Teachers of English Learners 0 0 0
Total Teacher Misassignments* 0 0 0
Vacant Teacher Positions 0 0 0 Note: “Misassignments” refers to the number of positions filled by teachers who lack legal authorization to teach that grade level, subject area, student group, etc. *Total Teacher Misassignments includes the number of Misassignments of Teachers of English Learners.

2019-20 School Accountability Report Card for Anderson Elementary School Page 4 of 11
Quality, Currency, Availability of Textbooks and Other Instructional Materials (School Year 2020-2021) Year and month in which data were collected: August 2019
Subject Textbooks and Other Instructional
Materials/year of Adoption
From Most Recent
Adoption?
Percent Students Lacking Own
Assigned Copy
Reading/Language Arts California National Geographic Reach for Reading (Kindergarten - 1st grade) (Adopted 2017) Benchmark Advance (2nd - 5th grade) (Adopted 2017)
Yes 0.00 %
Mathematics Houghton Mifflin Harcourt - California Go Math (Adopted 2015)
Yes 0.00 %
Science Harcourt - California Science Yes 0.00 %
History-Social Science Pearson Scott Foresman - History-Social Science For California
Yes 0.00 %
Note: Cells with N/A values do not require data.
School Facility Conditions and Planned Improvements
School Facility Good Repair Status Using the most recently collected FIT data (or equivalent), provide the following:
• Determination of repair status for systems listed • Description of any needed maintenance to ensure good repair • The year and month in which the data were collected • The rate for each system inspected • The overall rating
Year and month of the most recent FIT report: August 2020
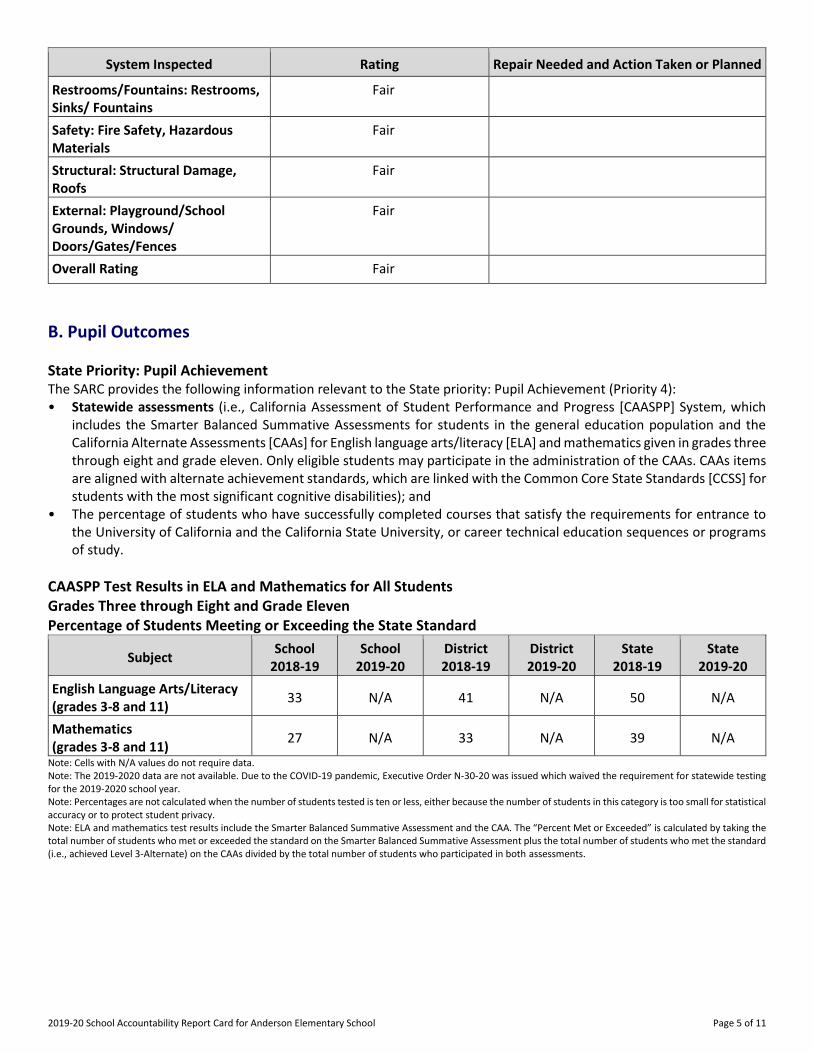
System Inspected Rating Repair Needed and Action Taken or Planned
Systems: Gas Leaks, Mechanical/HVAC, Sewer
XGood
Interior: Interior Surfaces XPoor
The District has completed a Facilities Needs Assessment and has passed A General Obligation Facility Improvement Bond. Over the next few years, the District will be engaged in several modernization projects.
Cleanliness: Overall Cleanliness, Pest/ Vermin Infestation
XGood
Electrical: Electrical XFair
2019-20 School Accountability Report Card for Anderson Elementary School Page 5 of 11
System Inspected Rating Repair Needed and Action Taken or Planned
Restrooms/Fountains: Restrooms, Sinks/ Fountains
XFair
Safety: Fire Safety, Hazardous Materials
XFair
Structural: Structural Damage, Roofs
XFair
External: Playground/School Grounds, Windows/ Doors/Gates/Fences
XFair
Overall Rating XFair
B. Pupil Outcomes
State Priority: Pupil Achievement The SARC provides the following information relevant to the State priority: Pupil Achievement (Priority 4): • Statewide assessments (i.e., California Assessment of Student Performance and Progress [CAASPP] System, which
includes the Smarter Balanced Summative Assessments for students in the general education population and the California Alternate Assessments [CAAs] for English language arts/literacy [ELA] and mathematics given in grades three through eight and grade eleven. Only eligible students may participate in the administration of the CAAs. CAAs items are aligned with alternate achievement standards, which are linked with the Common Core State Standards [CCSS] for students with the most significant cognitive disabilities); and
• The percentage of students who have successfully completed courses that satisfy the requirements for entrance to the University of California and the California State University, or career technical education sequences or programs of study.
CAASPP Test Results in ELA and Mathematics for All Students Grades Three through Eight and Grade Eleven Percentage of Students Meeting or Exceeding the State Standard
Subject School
2018-19 School
2019-20 District 2018-19
District 2019-20
State 2018-19
State 2019-20
English Language Arts/Literacy (grades 3-8 and 11)
33 N/A 41 N/A 50 N/A
Mathematics (grades 3-8 and 11)
27 N/A 33 N/A 39 N/A
Note: Cells with N/A values do not require data. Note: The 2019-2020 data are not available. Due to the COVID-19 pandemic, Executive Order N-30-20 was issued which waived the requirement for statewide testing for the 2019-2020 school year. Note: Percentages are not calculated when the number of students tested is ten or less, either because the number of students in this category is too small for statistical accuracy or to protect student privacy. Note: ELA and mathematics test results include the Smarter Balanced Summative Assessment and the CAA. The “Percent Met or Exceeded” is calculated by taking the total number of students who met or exceeded the standard on the Smarter Balanced Summative Assessment plus the total number of students who met the standard (i.e., achieved Level 3-Alternate) on the CAAs divided by the total number of students who participated in both assessments.

2019-20 School Accountability Report Card for Anderson Elementary School Page 6 of 11
CAASPP Test Results in ELA by Student Group Grades Three through Eight and Grade Eleven (School Year 2019-2020)
Student Group Total
Enrollment Number Tested
Percent Tested
Percent Not
Tested
Percent Met or
Exceeded
All Students N/A N/A N/A N/A N/A
Male N/A N/A N/A N/A N/A
Female N/A N/A N/A N/A N/A
Black or African American N/A N/A N/A N/A N/A
American Indian or Alaska Native N/A N/A N/A N/A N/A
Asian N/A N/A N/A N/A N/A
Filipino N/A N/A N/A N/A N/A
Hispanic or Latino N/A N/A N/A N/A N/A
Native Hawaiian or Pacific Islander N/A N/A N/A N/A N/A
White N/A N/A N/A N/A N/A
Two or More Races N/A N/A N/A N/A N/A
Socioeconomically Disadvantaged N/A N/A N/A N/A N/A
English Learners N/A N/A N/A N/A N/A
Students with Disabilities N/A N/A N/A N/A N/A
Students Receiving Migrant Education Services N/A N/A N/A N/A N/A
Foster Youth N/A N/A N/A N/A N/A
Homeless N/A N/A N/A N/A N/A
Note: Cells with N/A values do not require data. Note: The 2019-2020 data are not available. Due to the COVID-19 pandemic, Executive Order N-30-20 was issued which waived the requirement for statewide testing for the 2019-2020 school year.
CAASPP Test Results in Mathematics by Student Group Grades Three through Eight and Grade Eleven (School Year 2019-2020)
Student Group Total
Enrollment Number Tested
Percent Tested
Percent Not
Tested
Percent Met or
Exceeded
All Students N/A N/A N/A N/A N/A
Male N/A N/A N/A N/A N/A
Female N/A N/A N/A N/A N/A
Black or African American N/A N/A N/A N/A N/A
American Indian or Alaska Native N/A N/A N/A N/A N/A
Asian N/A N/A N/A N/A N/A
Filipino N/A N/A N/A N/A N/A

2019-20 School Accountability Report Card for Anderson Elementary School Page 7 of 11
Student Group Total
Enrollment Number Tested
Percent Tested
Percent Not
Tested
Percent Met or
Exceeded
Hispanic or Latino N/A N/A N/A N/A N/A
Native Hawaiian or Pacific Islander N/A N/A N/A N/A N/A
White N/A N/A N/A N/A N/A
Two or More Races N/A N/A N/A N/A N/A
Socioeconomically Disadvantaged N/A N/A N/A N/A N/A
English Learners N/A N/A N/A N/A N/A
Students with Disabilities N/A N/A N/A N/A N/A
Students Receiving Migrant Education Services N/A N/A N/A N/A N/A
Foster Youth N/A N/A N/A N/A N/A
Homeless N/A N/A N/A N/A N/A
Note: Cells with N/A values do not require data. Note: The 2019-2020 data are not available. Due to the COVID-19 pandemic, Executive Order N-30-20 was issued which waived the requirement for statewide testing for the 2019-2020 school year.
CAASPP Test Results in Science for All Students Grades Five, Eight, and High School Percentage of Students Meeting or Exceeding the State Standard
Subject School
2018-19 School
2019-20 District 2018-19
District 2019-20
State 2018-19
State 2019-20
Science (grades 5, 8 and high school) 9 N/A 23 N/A 30 N/A Note: Cells with N/A values do not require data. Note: The 2019-2020 data are not available. Due to the COVID-19 pandemic, Executive Order N-30-20 was issued which waived the requirement for statewide testing for the 2019-2020 school year. Note: The new California Science Test (CAST) was first administered operationally in the 2018-2019 school year.
State Priority: Other Pupil Outcomes The SARC provides the following information relevant to the State priority: Other Pupil Outcomes (Priority 8): • Pupil outcomes in the subject areas of physical education.
California Physical Fitness Test Results (School Year 2019-2020)
Grade Level Percentage of Students
Meeting Four of Six Fitness Standards
Percentage of Students Meeting Five of Six Fitness Standards
Percentage of Students Meeting Six of Six Fitness Standards
5 N/A N/A N/A
7 N/A N/A N/A
9 N/A N/A N/A Note: Cells with N/A values do not require data. Note: The 2019–2020 data are not available. Due to the COVID-19 pandemic, Executive Order N-56-20 was issued which waived the requirement to administer the physical fitness performance test for the 2019–2020 school year.

2019-20 School Accountability Report Card for Anderson Elementary School Page 8 of 11
C. Engagement
State Priority: Parental Involvement The SARC provides the following information relevant to the State priority: Parental Involvement (Priority 3): • Efforts the school district makes to seek parent input in making decisions for the school district and each school site
Opportunities for Parental Involvement (School Year 2020-2021)
Anderson Elementary parents have multiple opportunities to participate in their child's education. Parents are encouraged to have a voice through participation in the Parent- Teacher Organization (PTO), English Learner Advisory Committee (ELAC), School Site Council (SSC) and Local Control Accountability Plan (LCAP). Parents can also volunteer in their child's classrooms, as well as, volunteer for school activities. Parents are also provided opportunities to participate in workshops with their children to further engage and develop their child’s academic and social-emotional growth.
State Priority: School Climate The SARC provides the following information relevant to the State priority: School Climate (Priority 6): • Pupil suspension rates; • Pupil expulsion rates; and • Other local measures on the sense of safety.
Suspensions and Expulsions (data collected between July through June, each full school year respectively)
Rate School
2017-18 School
2018-19 District 2017-18
District 2018-19
State 2017-18
State 2018-19
Suspensions 2.2 1.8 6.9 6.7 3.5 3.5
Expulsions 0.0 0.0 0.1 0.1 0.1 0.1
Suspensions and Expulsions for School Year 2019-2020 Only (data collected between July through February, partial school year due to the COVID-19 pandemic)
Rate School
2019-20 District 2019-20
State 2019-20
Suspensions 0.0 0.0 2.5
Expulsions 0.0 0.0 0.1 Note: The 2019-2020 suspensions and expulsions rate data are not comparable to prior year data because the 2019-2020 school year is a partial school year due to the COVID-19 crisis. As such, it would be inappropriate to make any comparisons in rates of suspensions and expulsions in the 2019-2020 school year compared to prior years.

2019-20 School Accountability Report Card for Anderson Elementary School Page 9 of 11
School Safety Plan (School Year 2020-2021)
Maintaining the safety and security of students and staff at Anderson Elementary School is a priority in our daily operations and long term planning period. W hen family members, volunteers, or representatives from outside agencies visit the campus, they first report to the office where they sign in and acquire a visitor badge. This protocol is communicated with signage and reinforced by staff members. Students are supervised during all parts of their day. Certificated staff provides instruction and supports oversight during class time and recess while the classified staff supervises students during recess and lunch periods. the comprehensive School Safety Plan (CSSP) is in compliance with SB187. Yearly, the committee meets to review the materials. In addition, to an Incident Command Structure, this document outlines responses to fires, floods, earthquakes, toxic spills, and campus intrusions. Specific instructions for staff and student responses are outlined in the plan. Staff and students practice drills periodically throughout the year to reinforce the procedures outlined in our safety plan. Should such a situation arise, staff will remain on duty to ensure the welfare of all Anderson students until it is feasible and appropriate for parents and guardians to pick them up. The School maintains necessary first-aid supplies in designated locations and these are inventoried and replaced each year.
D. Other SARC Information
The information in this section is required to be in the SARC but is not included in the state priorities for LCFF.
Average Class Size and Class Size Distribution (Elementary)
Grade Level
2017-18 Average
Class Size
2017-18 # of
Classes* Size 1-20
2017-18 # of
Classes* Size
21-32
2017-18 # of
Classes* Size 33+
2018-19 Average
Class Size
2018-19 # of
Classes* Size 1-20
2018-19 # of
Classes* Size
21-32
2018-19 # of
Classes* Size 33+
2019-20 Average
Class Size
2019-20 # of
Classes* Size 1-20
2019-20 # of
Classes* Size
21-32
2019-20 # of
Classes* Size 33+
K
24 5 24 4 22 1 4
1
24 3 23 4 22 3
2
25 3 25 3 22 1 3
3
22 3 26 3 23 3
4
34 2 31 2 29 2
5
25 2 28 3 27 2
6
28 3
Other**
26 1 *Number of classes indicates how many classes fall into each size category (a range of total students per class). ** “Other” category is for multi-grade level classes.
Ratio of Pupils to Academic Counselor (School Year 2019-2020)
Title Ratio
Academic Counselors* 0 *One full time equivalent (FTE) equals one staff member working full time; one FTE could also represent two staff members who each work 50 percent of full time.
Student Support Services Staff (School Year 2019-2020)
Title Number of FTE*
Assigned to School
Counselor (Academic, Social/Behavioral or Career Development)
Library Media Teacher (Librarian)
Library Media Services Staff (Paraprofessional)
Psychologist

2019-20 School Accountability Report Card for Anderson Elementary School Page 10 of 11
Title Number of FTE*
Assigned to School
Social Worker
Nurse
Speech/Language/Hearing Specialist 1
Resource Specialist (non-teaching)
Other *One Full Time Equivalent (FTE) equals one staff member working full time; one FTE could also represent two staff members who each work 50 percent of full time.
Expenditures Per Pupil and School Site Teacher Salaries (Fiscal Year 2018-2019)
Level Total
Expenditures Per Pupil
Expenditures Per Pupil
(Restricted)
Expenditures Per Pupil
(Unrestricted)
Average Teacher Salary
School Site $6,843.00 1,214.00 $5,630.00 $62,568.00
District N/A N/A $8,559.00 $62,062.00
Percent Difference - School Site and District N/A N/A
State N/A N/A $7,750.00 $75,706.00
Percent Difference - School Site and State N/A N/A Note: Cells with N/A values do not require data.
Types of Services Funded (Fiscal Year 2019-2020)
Anderson Elementary School Site Council approved expenditures on the following services:
• Response to Intervention Teacher for English Language Arts and Math • The Leader In Me Professional Development and Program • Family Cultural Events • Positive Behavior Intervention Strategies Professional Development, Incentives and materials. • Technology
Teacher and Administrative Salaries (Fiscal Year 2018-2019)
Category District Amount
State Average For Districts
In Same Category
Beginning Teacher Salary $42,974 $47,145
Mid-Range Teacher Salary $64,867 $74,952
Highest Teacher Salary $86,402 $96,092
Average Principal Salary (Elementary) $102,491 $116,716
Average Principal Salary (Middle) $110,987 $120,813
Average Principal Salary (High) $114,458 $131,905
Superintendent Salary $187,101 $192,565
Percent of Budget for Teacher Salaries 32.0 31.0
Percent of Budget for Administrative Salaries 6.0 6.0 For detailed information on salaries, see the CDE Certificated Salaries & Benefits web page at https://www.cde.ca.gov/ds/fd/cs/.

2019-20 School Accountability Report Card for Anderson Elementary School Page 11 of 11
Professional Development (Most Recent Three Years)
Measure 2018-19 2019-20 2020-21
Number of school days dedicated to Staff Development and Continuous Improvement 73 38 42

2019-20 School Accountability Report Card for C. A. Jacobs Intermediate School Page 1 of 11
C. A. Jacobs Intermediate School
School Accountability Report Card
Reported Using Data from the 2019-2020 School Year
Published During 2020-2021
By February 1 of each year, every school in California is required by state law to publish a School Accountability Report Card (SARC). The SARC contains information about the condition and performance of each California public school. Under the Local Control Funding Formula (LCFF) all local educational agencies (LEAs) are required to prepare a Local Control and Accountability Plan (LCAP), which describes how they intend to meet annual school-specific goals for all pupils, with specific activities to address state and local priorities. Additionally, data reported in an LCAP is to be consistent with data reported in the SARC.
• For more information about SARC requirements and access to prior year reports, see the California Department of Education (CDE) SARC web page at https://www.cde.ca.gov/ta/ac/sa/.
• For more information about the LCFF or the LCAP, see the CDE LCFF webpage at https://www.cde.ca.gov/fg/aa/lc/.
• For additional information about the school, parents/guardians and community members should contact the school principal or the district office.
DataQuest DataQuest is an online data tool located on the CDE DataQuest web page at https://dq.cde.ca.gov/dataquest/ that contains additional information about this school and comparisons of the school to the district and the county. Specifically, DataQuest is a dynamic system that provides reports for accountability (e.g., test data, enrollment, high school graduates, dropouts, course enrollments, staffing, and data regarding English learners). California School Dashboard The California School Dashboard (Dashboard) https://www.caschooldashboard.org/ reflects California’s new accountability and continuous improvement system and provides information about how LEAs and schools are meeting the needs of California’s diverse student population. The Dashboard contains reports that display the performance of LEAs, schools, and student groups on a set of state and local measures to assist in identifying strengths, challenges, and areas in need of improvement.
About This School
School Contact Information (School Year 2020-2021)
Entity Contact Information
School Name C. A. Jacobs Intermediate School
Street 200 North Lincoln St.
City, State, Zip Dixon, Ca, 95620-3209
Phone Number 707-693-6350
Principal Kamilah O'Connor
Email Address [email protected]
Website http://caj.dixonusd.org/
County-District-School (CDS) Code 48705326051023

2019-20 School Accountability Report Card for C. A. Jacobs Intermediate School Page 2 of 11
District Contact Information (School Year 2020-2021)
Entity Contact Information
District Name Dixon Unified
Phone Number (707) 693-6300
Superintendent Brian Dolan
Email Address [email protected]
Website www .dixonusd.org
School Description and Mission Statement (School Year 2020-2021)
C.A. Jacobs Intermediate School is located in the city of Dixon which was founded in 1868 upon the rich farmlands of Solano County. Linked with the rest of California in 1874 by the Southern Pacific Railroad, Dixon merged with nearby Silveyville residents to form what is today one of the most productive agricultural communities in Northern California. While historically an agricultural town, Dixon, California is now primarily a residential community of 18,000 for people who work in Sacramento, Davis, and the San Francisco Bay Area. While the city has experienced growth it remains a "small town at heart," whose residents pride themselves on the high level of community involvement. C.A. Jacobs is the only middle school in the Dixon Unified School District that serves approximately 3,200 students K-12 in three elementary schools, one middle school, one comprehensive high school 9-12, and several alternatives programs such as Maine Prairie Continuation High School, the options center, Dixon Community Day School, and Independent Study programs. During the 2017-18 school year, C.A. Jacobs served 7th and 8th-grade students, and in the 2018-19 school year, C.A. Jacobs served 6th, 7th, and 8th. Enrollment in 2015-16 was 534 students, 2016-17 523 students, 2017-18 531students, 2018-19 740 students, and 2019-20 is 731 students, and 2020-21 is 577. C.A. Jacobs prides itself on being a culture that focuses on relationships and providing excellent first instruction through the Professional Learning Community model. The faculty, administration, and support staff provide an exemplary learning environment where students have access to programs targeted at their needs where a data-rich environment is used to provide instruction where student's greatest needs are. Academic learning is the primary focus of the school. C.A, Jacobs Vision and Mission Statements C.A. Jacobs's vision is to close the achievement gap by preparing all students for college and career readiness and success in a global society. C.A. Jacobs Mission is that Cougars are Safe, Respectful, and Productive About Our School Welcome to C.A. Jacobs Intermediate School, home of the Cougars! As you walk through the doors of C.A. Jacobs, you will feel the warmth and welcome of the school that supports all students. Each year is dedicated to furthering and supporting the ongoing academic, personal, and social growth of our students. We work together to build upon our successes as well as in adapting to the changing needs of our students and school community. A key idea in our approach to student achievement is to carefully consider and address individual student needs. We believe all students can learn, and that it is our collective responsibility to ensure that they all learn at high levels. We accomplished this by providing a challenging curriculum that is delivered in a safe environment by a dedicated, nurturing staff.
2019-20 School Accountability Report Card for C. A. Jacobs Intermediate School Page 3 of 11
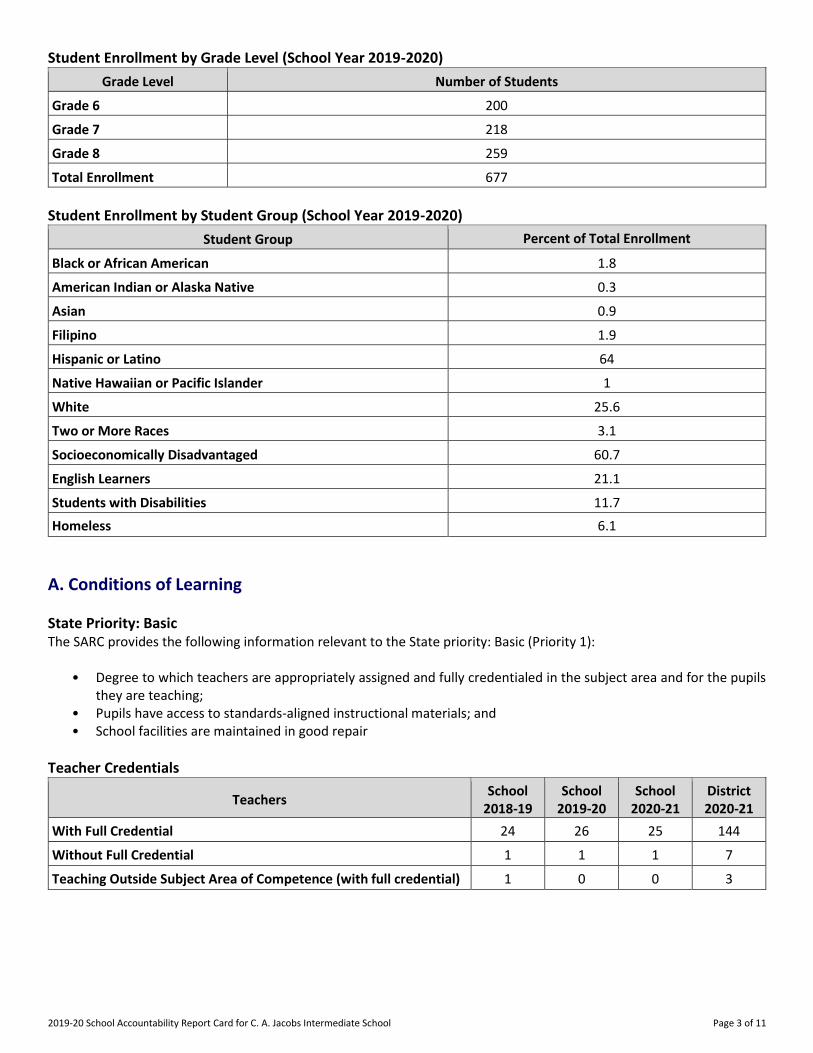
Student Enrollment by Grade Level (School Year 2019-2020)
Grade Level Number of Students
Grade 6 200
Grade 7 218
Grade 8 259
Total Enrollment 677
Student Enrollment by Student Group (School Year 2019-2020)
Student Group Percent of Total Enrollment
Black or African American 1.8
American Indian or Alaska Native 0.3
Asian 0.9
Filipino 1.9
Hispanic or Latino 64
Native Hawaiian or Pacific Islander 1
White 25.6
Two or More Races 3.1
Socioeconomically Disadvantaged 60.7
English Learners 21.1
Students with Disabilities 11.7
Homeless 6.1
A. Conditions of Learning
State Priority: Basic The SARC provides the following information relevant to the State priority: Basic (Priority 1):
• Degree to which teachers are appropriately assigned and fully credentialed in the subject area and for the pupils they are teaching;
• Pupils have access to standards-aligned instructional materials; and • School facilities are maintained in good repair
Teacher Credentials
Teachers School
2018-19 School
2019-20 School
2020-21 District 2020-21
With Full Credential 24 26 25 144
Without Full Credential 1 1 1 7
Teaching Outside Subject Area of Competence (with full credential) 1 0 0 3

2019-20 School Accountability Report Card for C. A. Jacobs Intermediate School Page 4 of 11
Teacher Misassignments and Vacant Teacher Positions
Indicator 2018-19 2019-20 2020-21
Misassignments of Teachers of English Learners 0 0 0
Total Teacher Misassignments* 0 0 0
Vacant Teacher Positions 0 0 0 Note: “Misassignments” refers to the number of positions filled by teachers who lack legal authorization to teach that grade level, subject area, student group, etc. *Total Teacher Misassignments includes the number of Misassignments of Teachers of English Learners.
Quality, Currency, Availability of Textbooks and Other Instructional Materials (School Year 2020-2021) Year and month in which data were collected: January 2019
Subject Textbooks and Other Instructional
Materials/year of Adoption
From Most Recent
Adoption?
Percent Students Lacking Own
Assigned Copy
Reading/Language Arts McGraw -Hill Glencoe Literature California Treasures (Adopted 2012) Novels The Book Thief The Outsiders The Hunger Games Esperanza Rising The Giver Wonder The Only Road
Yes 0.00 %
Mathematics Houghton Mifflin Harcourt - Big Ideas Math Houghton Mifflin Harcourt - Big Ideas Math Accelerated CPM - Core Connections, Integrated I
Yes 0.00 %
Science StemScopes (Adopted 2020)
Yes 0.00 %
History-Social Science Holt - W orld History Ancient Civilizations Holt – California Social Studies: United States History Independence to 1914 Holt – California Social Studies: W orld History Medieval to Early Modern Times
Yes 0.00 %
Note: Cells with N/A values do not require data.

2019-20 School Accountability Report Card for C. A. Jacobs Intermediate School Page 5 of 11
School Facility Conditions and Planned Improvements
C.A. Jacobs Intermediate Schools’ campus was originally built in 1964. Modernization was completed in 2004 using State School Facilities Program and local Measure V general obligation funding in 2002/03. The school currently contains 16 permanent, and 9 portable classrooms, a band room, a gym, a computer lab, a multipurpose room, a library, and an administration building, blacktop area for basketball courts, soccer field, and a softball field. 100% of our bathrooms are in working order. The Dixon Unified School District along with North Bay Schools Insurance performs yearly safety inspections with the purpose of identifying and correcting any and all safety issues and concerns. A work order process is used to ensure efficient service and that emergency repairs are given the highest priority. All HVAC units undergo regular maintenance and cleaning. All classrooms currently have W IFI capabilities. Above and beyond the daily cleaning maintenance performed by custodial staff, the district schedules thorough cleaning of classrooms on a regular basis. There are no scheduled facility improvements.
School Facility Good Repair Status Using the most recently collected FIT data (or equivalent), provide the following:
• Determination of repair status for systems listed • Description of any needed maintenance to ensure good repair • The year and month in which the data were collected • The rate for each system inspected • The overall rating
Year and month of the most recent FIT report: August 2020
System Inspected Rating Repair Needed and Action Taken or Planned
Systems: Gas Leaks, Mechanical/HVAC, Sewer
XGood
Interior: Interior Surfaces XPoor
The District has completed a Facilities Needs Assessment and has passed A General Obligation Facility Improvement Bond. Over the next few years, the District will be engaged in several modernization projects.
Cleanliness: Overall Cleanliness, Pest/ Vermin Infestation
XGood
Electrical: Electrical XPoor
The District has completed a Facilities Needs Assessment and has passed A General Obligation Facility Improvement Bond. Over the next few years, the District will be engaged in several modernization projects.
Restrooms/Fountains: Restrooms, Sinks/ Fountains
XFair
Safety: Fire Safety, Hazardous Materials
XGood
Structural: Structural Damage, Roofs
XGood
External: Playground/School Grounds, Windows/ Doors/Gates/Fences
XFair
Overall Rating XFair
2019-20 School Accountability Report Card for C. A. Jacobs Intermediate School Page 6 of 11
B. Pupil Outcomes
State Priority: Pupil Achievement The SARC provides the following information relevant to the State priority: Pupil Achievement (Priority 4): • Statewide assessments (i.e., California Assessment of Student Performance and Progress [CAASPP] System, which
includes the Smarter Balanced Summative Assessments for students in the general education population and the California Alternate Assessments [CAAs] for English language arts/literacy [ELA] and mathematics given in grades three through eight and grade eleven. Only eligible students may participate in the administration of the CAAs. CAAs items are aligned with alternate achievement standards, which are linked with the Common Core State Standards [CCSS] for students with the most significant cognitive disabilities); and
• The percentage of students who have successfully completed courses that satisfy the requirements for entrance to the University of California and the California State University, or career technical education sequences or programs of study.
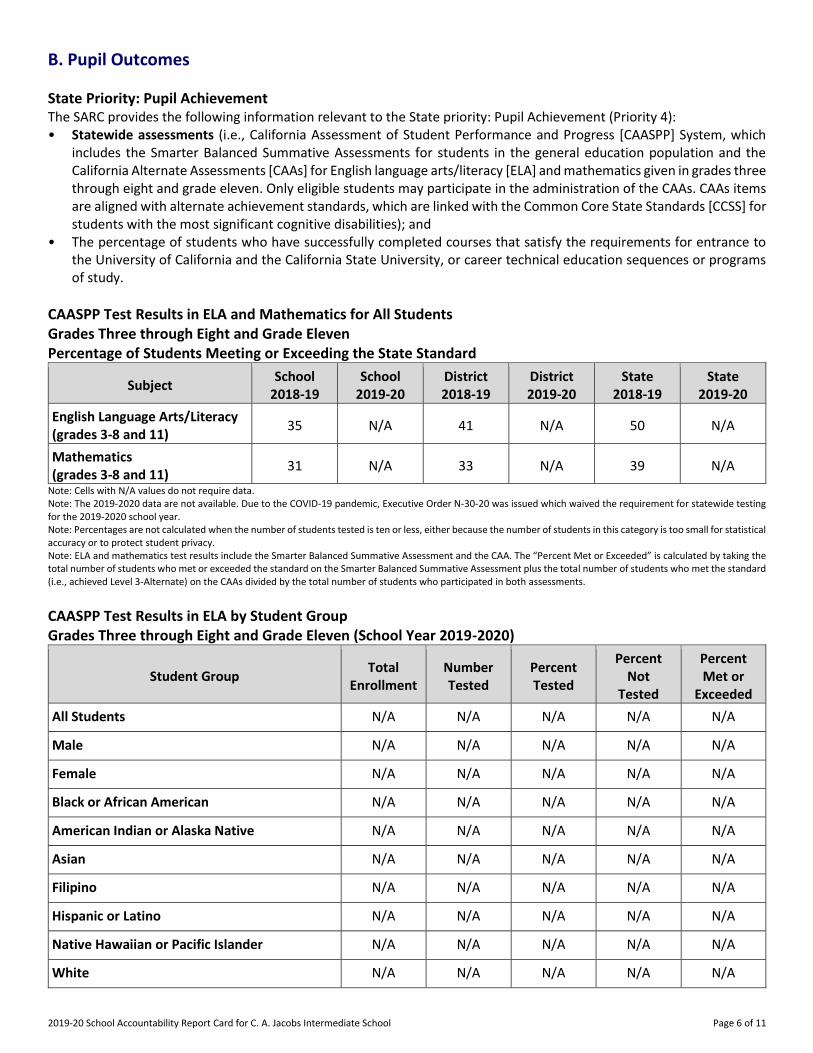
CAASPP Test Results in ELA and Mathematics for All Students Grades Three through Eight and Grade Eleven Percentage of Students Meeting or Exceeding the State Standard
Subject School
2018-19 School
2019-20 District 2018-19
District 2019-20
State 2018-19
State 2019-20
English Language Arts/Literacy (grades 3-8 and 11)
35 N/A 41 N/A 50 N/A
Mathematics (grades 3-8 and 11)
31 N/A 33 N/A 39 N/A
Note: Cells with N/A values do not require data. Note: The 2019-2020 data are not available. Due to the COVID-19 pandemic, Executive Order N-30-20 was issued which waived the requirement for statewide testing for the 2019-2020 school year. Note: Percentages are not calculated when the number of students tested is ten or less, either because the number of students in this category is too small for statistical accuracy or to protect student privacy. Note: ELA and mathematics test results include the Smarter Balanced Summative Assessment and the CAA. The “Percent Met or Exceeded” is calculated by taking the total number of students who met or exceeded the standard on the Smarter Balanced Summative Assessment plus the total number of students who met the standard (i.e., achieved Level 3-Alternate) on the CAAs divided by the total number of students who participated in both assessments.
CAASPP Test Results in ELA by Student Group Grades Three through Eight and Grade Eleven (School Year 2019-2020)
Student Group Total
Enrollment Number Tested
Percent Tested
Percent Not
Tested
Percent Met or
Exceeded
All Students N/A N/A N/A N/A N/A
Male N/A N/A N/A N/A N/A
Female N/A N/A N/A N/A N/A
Black or African American N/A N/A N/A N/A N/A
American Indian or Alaska Native N/A N/A N/A N/A N/A
Asian N/A N/A N/A N/A N/A
Filipino N/A N/A N/A N/A N/A
Hispanic or Latino N/A N/A N/A N/A N/A
Native Hawaiian or Pacific Islander N/A N/A N/A N/A N/A
White N/A N/A N/A N/A N/A

2019-20 School Accountability Report Card for C. A. Jacobs Intermediate School Page 7 of 11
Student Group Total
Enrollment Number Tested
Percent Tested
Percent Not
Tested
Percent Met or
Exceeded
Two or More Races N/A N/A N/A N/A N/A
Socioeconomically Disadvantaged N/A N/A N/A N/A N/A
English Learners N/A N/A N/A N/A N/A
Students with Disabilities N/A N/A N/A N/A N/A
Students Receiving Migrant Education Services N/A N/A N/A N/A N/A
Foster Youth N/A N/A N/A N/A N/A
Homeless N/A N/A N/A N/A N/A
Note: Cells with N/A values do not require data. Note: The 2019-2020 data are not available. Due to the COVID-19 pandemic, Executive Order N-30-20 was issued which waived the requirement for statewide testing for the 2019-2020 school year.
CAASPP Test Results in Mathematics by Student Group Grades Three through Eight and Grade Eleven (School Year 2019-2020)
Student Group Total
Enrollment Number Tested
Percent Tested
Percent Not
Tested
Percent Met or
Exceeded
All Students N/A N/A N/A N/A N/A
Male N/A N/A N/A N/A N/A
Female N/A N/A N/A N/A N/A
Black or African American N/A N/A N/A N/A N/A
American Indian or Alaska Native N/A N/A N/A N/A N/A
Asian N/A N/A N/A N/A N/A
Filipino N/A N/A N/A N/A N/A
Hispanic or Latino N/A N/A N/A N/A N/A
Native Hawaiian or Pacific Islander N/A N/A N/A N/A N/A
White N/A N/A N/A N/A N/A
Two or More Races N/A N/A N/A N/A N/A
Socioeconomically Disadvantaged N/A N/A N/A N/A N/A
English Learners N/A N/A N/A N/A N/A
Students with Disabilities N/A N/A N/A N/A N/A
Students Receiving Migrant Education Services N/A N/A N/A N/A N/A
Foster Youth N/A N/A N/A N/A N/A
Homeless N/A N/A N/A N/A N/A
Note: Cells with N/A values do not require data. Note: The 2019-2020 data are not available. Due to the COVID-19 pandemic, Executive Order N-30-20 was issued which waived the requirement for statewide testing for the 2019-2020 school year.

2019-20 School Accountability Report Card for C. A. Jacobs Intermediate School Page 8 of 11
CAASPP Test Results in Science for All Students Grades Five, Eight, and High School Percentage of Students Meeting or Exceeding the State Standard
Subject School
2018-19 School
2019-20 District 2018-19
District 2019-20
State 2018-19
State 2019-20
Science (grades 5, 8 and high school) 25 N/A 23 N/A 30 N/A Note: Cells with N/A values do not require data. Note: The 2019-2020 data are not available. Due to the COVID-19 pandemic, Executive Order N-30-20 was issued which waived the requirement for statewide testing for the 2019-2020 school year. Note: The new California Science Test (CAST) was first administered operationally in the 2018-2019 school year.
State Priority: Other Pupil Outcomes The SARC provides the following information relevant to the State priority: Other Pupil Outcomes (Priority 8): • Pupil outcomes in the subject areas of physical education.
California Physical Fitness Test Results (School Year 2019-2020)
Grade Level Percentage of Students
Meeting Four of Six Fitness Standards
Percentage of Students Meeting Five of Six Fitness Standards
Percentage of Students Meeting Six of Six Fitness Standards
5 N/A N/A N/A
7 N/A N/A N/A
9 N/A N/A N/A Note: Cells with N/A values do not require data. Note: The 2019–2020 data are not available. Due to the COVID-19 pandemic, Executive Order N-56-20 was issued which waived the requirement to administer the physical fitness performance test for the 2019–2020 school year.
C. Engagement
State Priority: Parental Involvement The SARC provides the following information relevant to the State priority: Parental Involvement (Priority 3): • Efforts the school district makes to seek parent input in making decisions for the school district and each school site
Opportunities for Parental Involvement (School Year 2020-2021)
Parents play an important role at C.A. Jacobs Middle School through active participation and involvement in the school Site Council, English Learners Advisory Committee, Parent/Teacher Organization, Back to School Night, Open House, and Parent/Teacher conferences. Parents are welcome to volunteer in classrooms and at school activities. C.A. Jacobs Middle School also benefits from donations and partnerships with local businesses and services. C.A. Jacobs Parent/Teacher Organization helps to fundraise for events, volunteer at the school, and supports our staff and students throughout the year.
2019-20 School Accountability Report Card for C. A. Jacobs Intermediate School Page 9 of 11
State Priority: School Climate The SARC provides the following information relevant to the State priority: School Climate (Priority 6): • Pupil suspension rates; • Pupil expulsion rates; and • Other local measures on the sense of safety.
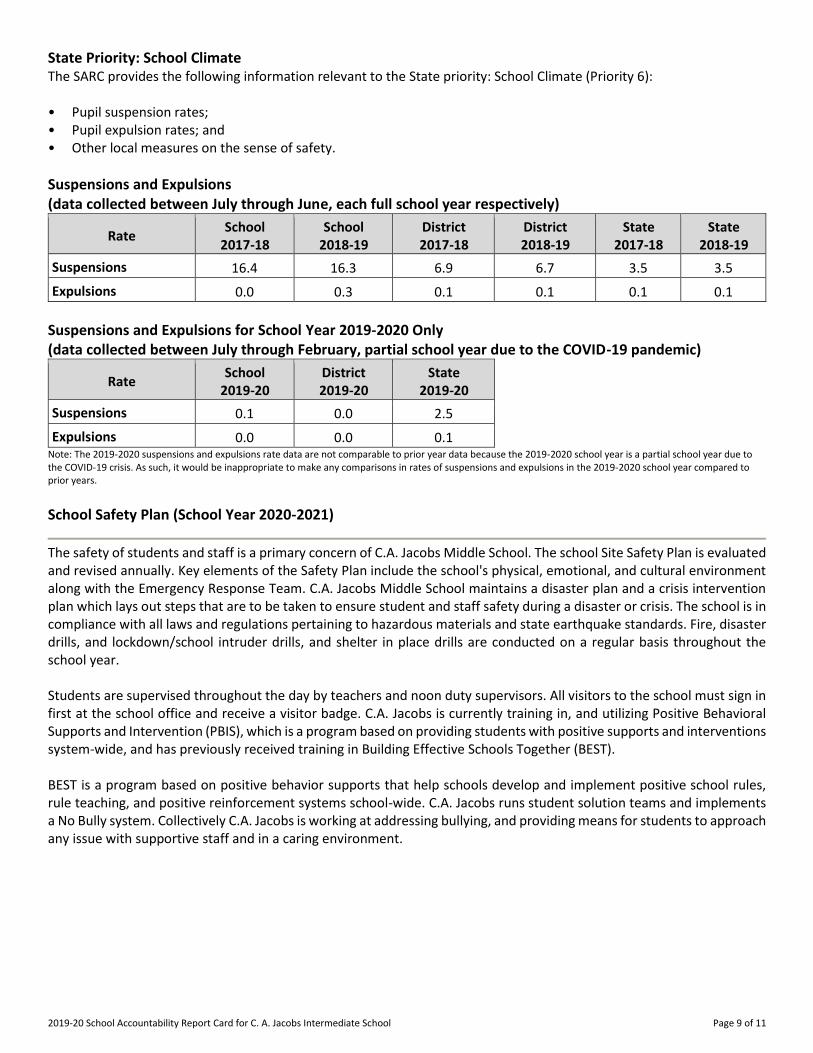
Suspensions and Expulsions (data collected between July through June, each full school year respectively)
Rate School
2017-18 School
2018-19 District 2017-18
District 2018-19
State 2017-18
State 2018-19
Suspensions 16.4 16.3 6.9 6.7 3.5 3.5
Expulsions 0.0 0.3 0.1 0.1 0.1 0.1
Suspensions and Expulsions for School Year 2019-2020 Only (data collected between July through February, partial school year due to the COVID-19 pandemic)
Rate School
2019-20 District 2019-20
State 2019-20
Suspensions 0.1 0.0 2.5
Expulsions 0.0 0.0 0.1 Note: The 2019-2020 suspensions and expulsions rate data are not comparable to prior year data because the 2019-2020 school year is a partial school year due to the COVID-19 crisis. As such, it would be inappropriate to make any comparisons in rates of suspensions and expulsions in the 2019-2020 school year compared to prior years.
School Safety Plan (School Year 2020-2021)
The safety of students and staff is a primary concern of C.A. Jacobs Middle School. The school Site Safety Plan is evaluated and revised annually. Key elements of the Safety Plan include the school's physical, emotional, and cultural environment along with the Emergency Response Team. C.A. Jacobs Middle School maintains a disaster plan and a crisis intervention plan which lays out steps that are to be taken to ensure student and staff safety during a disaster or crisis. The school is in compliance with all laws and regulations pertaining to hazardous materials and state earthquake standards. Fire, disaster drills, and lockdown/school intruder drills, and shelter in place drills are conducted on a regular basis throughout the school year. Students are supervised throughout the day by teachers and noon duty supervisors. All visitors to the school must sign in first at the school office and receive a visitor badge. C.A. Jacobs is currently training in, and utilizing Positive Behavioral Supports and Intervention (PBIS), which is a program based on providing students with positive supports and interventions system-wide, and has previously received training in Building Effective Schools Together (BEST). BEST is a program based on positive behavior supports that help schools develop and implement positive school rules, rule teaching, and positive reinforcement systems school-wide. C.A. Jacobs runs student solution teams and implements a No Bully system. Collectively C.A. Jacobs is working at addressing bullying, and providing means for students to approach any issue with supportive staff and in a caring environment.

2019-20 School Accountability Report Card for C. A. Jacobs Intermediate School Page 10 of 11
Average Class Size and Class Size Distribution (Secondary)
Subject
2017-18 Average
Class Size
2017-18 # of
Classes* Size 1-20
2017-18 # of
Classes* Size
21-32
2017-18 # of
Classes* Size 33+
2018-19 Average
Class Size
2018-19 # of
Classes* Size 1-20
2018-19 # of
Classes* Size
21-32
2018-19 # of
Classes* Size 33+
2019-20 Average
Class Size
2019-20 # of
Classes* Size 1-20
2019-20 # of
Classes* Size
21-32
2019-20 # of
Classes* Size 33+
English Language Arts
23 11 15 3 21 12 19 22 9 15 3
Mathematics 29 16 2 26 2 17 1 26 4 11 5
Science 29 17 1 27 3 16 30 16
Social Science 29 19 1 27 4 14 2 28 1 13 4
*Number of classes indicates how many classrooms fall into each size category (a range of total students per classroom). At the secondary school level, this information is reported by subject area rather than grade level.
Ratio of Pupils to Academic Counselor (School Year 2019-2020)
Title Ratio
Academic Counselors* 677 *One full time equivalent (FTE) equals one staff member working full time; one FTE could also represent two staff members who each work 50 percent of full time.
Student Support Services Staff (School Year 2019-2020)
Title Number of FTE*
Assigned to School
Counselor (Academic, Social/Behavioral or Career Development) 1
Library Media Teacher (Librarian)
Library Media Services Staff (Paraprofessional)
Psychologist
Social Worker
Nurse
Speech/Language/Hearing Specialist
Resource Specialist (non-teaching)
Other 1 *One Full Time Equivalent (FTE) equals one staff member working full time; one FTE could also represent two staff members who each work 50 percent of full time.
Expenditures Per Pupil and School Site Teacher Salaries (Fiscal Year 2018-2019)
Level Total
Expenditures Per Pupil
Expenditures Per Pupil
(Restricted)
Expenditures Per Pupil
(Unrestricted)
Average Teacher Salary
School Site $6,238.00 $1,286.00 $4952.00 $67,755.00
District N/A N/A $8,559.00 $62,062.00
Percent Difference - School Site and District N/A N/A
State N/A N/A $7,750.00 $75,706.00
Percent Difference - School Site and State N/A N/A Note: Cells with N/A values do not require data.

2019-20 School Accountability Report Card for C. A. Jacobs Intermediate School Page 11 of 11
Types of Services Funded (Fiscal Year 2019-2020)
C.A. Jacobs Middle School has Individual Education Plans through the Special Education Department for qualifying students, and a 504 program to support students as well. C.A. Jacobs also has an English Language Development program, and Mental Health support available. C.A. Jacobs also has courses for students struggling in Math, and English. C.A. Jacobs also has an AVID program, positive behavioral interventions and supports and additional classes designed to help students be successful in their academic day, and routines associated with it.
Teacher and Administrative Salaries (Fiscal Year 2018-2019)
Category District Amount
State Average For Districts
In Same Category
Beginning Teacher Salary $42,974 $47,145
Mid-Range Teacher Salary $64,867 $74,952
Highest Teacher Salary $86,402 $96,092
Average Principal Salary (Elementary) $102,491 $116,716
Average Principal Salary (Middle) $110,987 $120,813
Average Principal Salary (High) $114,458 $131,905
Superintendent Salary $187,101 $192,565
Percent of Budget for Teacher Salaries 32.0 31.0
Percent of Budget for Administrative Salaries 6.0 6.0 For detailed information on salaries, see the CDE Certificated Salaries & Benefits web page at https://www.cde.ca.gov/ds/fd/cs/.
Professional Development (Most Recent Three Years)
Measure 2018-19 2019-20 2020-21
Number of school days dedicated to Staff Development and Continuous Improvement 31 30 30

2019-20 School Accountability Report Card for Dixon High Page 1 of 15
Dixon High
School Accountability Report Card
Reported Using Data from the 2019-2020 School Year
Published During 2020-2021
By February 1 of each year, every school in California is required by state law to publish a School Accountability Report Card (SARC). The SARC contains information about the condition and performance of each California public school. Under the Local Control Funding Formula (LCFF) all local educational agencies (LEAs) are required to prepare a Local Control and Accountability Plan (LCAP), which describes how they intend to meet annual school-specific goals for all pupils, with specific activities to address state and local priorities. Additionally, data reported in an LCAP is to be consistent with data reported in the SARC.
• For more information about SARC requirements and access to prior year reports, see the California Department of Education (CDE) SARC web page at https://www.cde.ca.gov/ta/ac/sa/.
• For more information about the LCFF or the LCAP, see the CDE LCFF webpage at https://www.cde.ca.gov/fg/aa/lc/.
• For additional information about the school, parents/guardians and community members should contact the school principal or the district office.
DataQuest DataQuest is an online data tool located on the CDE DataQuest web page at https://dq.cde.ca.gov/dataquest/ that contains additional information about this school and comparisons of the school to the district and the county. Specifically, DataQuest is a dynamic system that provides reports for accountability (e.g., test data, enrollment, high school graduates, dropouts, course enrollments, staffing, and data regarding English learners). California School Dashboard The California School Dashboard (Dashboard) https://www.caschooldashboard.org/ reflects California’s new accountability and continuous improvement system and provides information about how LEAs and schools are meeting the needs of California’s diverse student population. The Dashboard contains reports that display the performance of LEAs, schools, and student groups on a set of state and local measures to assist in identifying strengths, challenges, and areas in need of improvement.
About This School
School Contact Information (School Year 2020-2021)
Entity Contact Information
School Name Dixon High
Street 555 College Way
City, State, Zip Dixon, Ca, 95620-9301
Phone Number 707-693-6330
Principal Stephanie Marquez, Principal
Email Address [email protected]
Website http://dhs.dixonusd.org/
County-District-School (CDS) Code 48705324832259

2019-20 School Accountability Report Card for Dixon High Page 2 of 15
District Contact Information (School Year 2020-2021)
Entity Contact Information
District Name Dixon Unified School District
Phone Number (707) 693-6300
Superintendent Brian Dolan
Email Address [email protected]
Website www .dixonusd.org
School Description and Mission Statement (School Year 2020-2021)
Dixon High School is a four-year comprehensive high school in Solano County. Our mission states: “Dixon High School will develop and integrate the structures and practices necessary to ensure all students learn at high levels. Students will graduate from Dixon High School, college and career ready, prepared for the global demands of the 21st century.” W e believe that all students will succeed at high levels if provided the proper supports and structures to do so. At DHS, it is our vision that students are empowered to reach their personal and academic potential by staff who support and build meaningful relationships with the, that students are engaged in learning by staff who embrace and utilize proven instructional strategies, and that students learn and grow from mistakes in a safe classroom and campus environment fostered by encouraging staff. Students at Dixon High School have many avenues to demonstrate excellence. In addition to robust AP/Honors offerings available to all students, students participate in CTE courses and extra- and co-curricular programs such as athletics, band, FFA, student government, clubs, and drama. W e believe that students perform best when given multiple ways to do so, especially in well-run programs that have high expectations of students. About Our School Welcome to Dixon High School! W e are a single comprehensive high school in our community of approximately 20,000. Our beautiful campus opened in 2007 and is a hub of our community. Our campus hosts site and community events and backs up to our city facilities with which we share a multi-use agreement. W e have very active athletic programs, a beautiful theater, quality classrooms and a vibrant Agricultural program with a new barn. We are surrounded by new homes and look forward to meeting our new neighbors. We are committed to ensuring all students learn at high levels every day and our staff continues to learn and work together to make this happen for our kids. Our PBIS team leads us in holding to three common expectations: Engage fully, Seek Support, and Be Present in everything we do. We are an AVID Schoolwide school and we are learning together to make sure all students experience equitable opportunities for engaging, rigorous learning and are supported so they can be ready for college and career when they leave us. W e are focused on building relationships so all students and staff can engage fully, seek support when needed, and be present at school. It is important to us that all of our stakeholders, including our community, feel welcome at our school. We encourage people to take the time to visit our school to experience a play, watch a game, listen to a band concert, or participate in any of the myriad events we host every year. If you have any questions about who we are or how and why we do what we do, please don’t hesitate to contact our staff as we are happy to answer. We have a saying at Dixon High School, “You can’t hide that Ram Pride!” W e want our students, parents, staff, and community to be proud of our school, and we will continue to work diligently to ensure this happens.

2019-20 School Accountability Report Card for Dixon High Page 3 of 15
Student Enrollment by Grade Level (School Year 2019-2020)
Grade Level Number of Students
Grade 9 277
Grade 10 296
Grade 11 240
Grade 12 249
Total Enrollment 1,062
Student Enrollment by Student Group (School Year 2019-2020)
Student Group Percent of Total Enrollment
Black or African American 2.4
American Indian or Alaska Native 0.5
Asian 1.2
Filipino 1.7
Hispanic or Latino 54
Native Hawaiian or Pacific Islander 0.4
White 33.7
Two or More Races 4.3
Socioeconomically Disadvantaged 49.2
English Learners 9.9
Students with Disabilities 9.6
Foster Youth 0.1
Homeless 5
A. Conditions of Learning
State Priority: Basic The SARC provides the following information relevant to the State priority: Basic (Priority 1):
• Degree to which teachers are appropriately assigned and fully credentialed in the subject area and for the pupils they are teaching;
• Pupils have access to standards-aligned instructional materials; and • School facilities are maintained in good repair
Teacher Credentials
Teachers School
2018-19 School
2019-20 School
2020-21 District 2020-21
With Full Credential 54 48 45 144
Without Full Credential 2 1 0 7
Teaching Outside Subject Area of Competence (with full credential) 0 0 3 3

2019-20 School Accountability Report Card for Dixon High Page 4 of 15
Teacher Misassignments and Vacant Teacher Positions
Indicator 2018-19 2019-20 2020-21
Misassignments of Teachers of English Learners 0 0 1
Total Teacher Misassignments* 0 0 3
Vacant Teacher Positions 0 0 0 Note: “Misassignments” refers to the number of positions filled by teachers who lack legal authorization to teach that grade level, subject area, student group, etc. *Total Teacher Misassignments includes the number of Misassignments of Teachers of English Learners.
Quality, Currency, Availability of Textbooks and Other Instructional Materials (School Year 2020-2021) Year and month in which data were collected: August 2019
Subject Textbooks and Other Instructional
Materials/year of Adoption
From Most Recent
Adoption?
Percent Students Lacking Own
Assigned Copy
Reading/Language Arts Prentice-Hall Literature – Timeless Voices, Timeless Themes: Gold Level Prentice-Hall Literature – Timeless Voices, Timeless Themes: Platinum Level Prentice-Hall Literature – Timeless Voices, Timeless Themes: The American Experience California Edition Hampton Brown – Edge Fundamentals Novels – (Adopted 2017): The Absolutely True Diary of a Part-Time Indian by Sherman Alexie Of Mice and Men by John Steinbeck Animal Farm by George Orwell David and Goliath by Malcolm Gladwell Romeo and Juliet by William Shakespeare 1984 by George Orwell Lord of the Flies by William Golding All Quiet on the Western Front by Erich Maria Remarque Just Mercy by Bryan Stevenson To Kill A Mockingbird by Harper Lee
Yes 0.00 %
Mathematics CPM – Core Connections, Integrated I CPM – Core Connections, Integrated II CPM – Core Connections, Integrated III CPM – Calculus Third Edition
Yes 0.00 %
Science Campbell – Biology in Focus McDougal Little – California Biology Houghton Mifflin Company – Chemistry: A Foundation (adopted 2008)
Yes 0.00 %

2019-20 School Accountability Report Card for Dixon High Page 5 of 15
Subject Textbooks and Other Instructional
Materials/year of Adoption
From Most Recent
Adoption?
Percent Students Lacking Own
Assigned Copy
Seeley Stephens Tate – Essentials of Anatomy and Physiology, 6th Edition Glencoe – Physics: Principles and Problems Prentice-Hall – Physics: Principles with Applications, 5th Edition W .H. Freeman and Company / BFW – Environmental Science for AP Wiley – Environment, 8th Edition Addison-Wesley – Chemistry CORD Communications Inc. – Applications in Biology/Chemistry: Synthetic Materials, 2nd Edition
History-Social Science Prentice-Hall – United States History America Prentice-Hall – Magruder’s American Government Prentice-Hall – World History Era Prentice-Hall – Economics: Principles in Action Lanahan Publishing – The American Polity for AP Government Pearson – World Civilizations: The Global Experience AP
Yes 0.00 %
Foreign Language EMC PUB – Aventuras, Level 1 EMC PUB – Aventuras, Level 2 EMC PUB – Aventuras, Level 3 Vista Higher Learning – Aventuras Vista Higher Learning – Descubre, Level 1 Vista Higher Learning – Descubre, Level 2 Vista Higher Learning – Descubre, Level 3 Vista Higher Learning – T’es branché Series 1 Vista Higher Learning – T’es branché Series 2 Vista Higher Learning – T’es branché Series 3
Yes 0.00 %
Visual and Performing Arts Glencoe/McGraw - Culinary Essentials Yes 0.00 %
Note: Cells with N/A values do not require data.

2019-20 School Accountability Report Card for Dixon High Page 6 of 15
School Facility Conditions and Planned Improvements
Dixon High School was built in 2007. Dixon High School meets or exceeds all state requirements in a school facility. The campus currently contains 67 classrooms, 3 Art rooms, Agriculture/W elding shop, Floral shop, Band room, indoor theater, multipurpose room, 2 gymnasiums, weight/wresting rooms, football/track/soccer stadium, 2 baseball fields, and 2 softball fields. 100% of our bathrooms are in working order. The Dixon Unified School District along with North Bay Schools Insurance performs yearly safety inspections with the purpose of identifying and correcting any and all safety issues and concerns. A work order process is used to ensure efficient service and that emergency repairs are given the highest priority. All HVAC units undergo regular maintenance and cleaning. All classrooms currently have W IFI capabilities. Above and beyond the daily cleaning maintenance performed by custodial staff, the district schedules thorough cleaning of classrooms on a regular basis. There are no scheduled facility improvements.
School Facility Good Repair Status Using the most recently collected FIT data (or equivalent), provide the following:
• Determination of repair status for systems listed • Description of any needed maintenance to ensure good repair • The year and month in which the data were collected • The rate for each system inspected • The overall rating
Year and month of the most recent FIT report: August 2020
System Inspected Rating Repair Needed and Action Taken or Planned
Systems: Gas Leaks, Mechanical/HVAC, Sewer
XGood
Interior: Interior Surfaces XPoor
The District has completed a Facilities Needs Assessment and has passed A General Obligation Facility Improvement Bond. Over the next few years, the District will be engaged in several modernization projects.
Cleanliness: Overall Cleanliness, Pest/ Vermin Infestation
XGood
Electrical: Electrical XFair
Restrooms/Fountains: Restrooms, Sinks/ Fountains
XGood
Safety: Fire Safety, Hazardous Materials
XGood
Structural: Structural Damage, Roofs
XGood
External: Playground/School Grounds, Windows/ Doors/Gates/Fences
XGood
Overall Rating XGood

2019-20 School Accountability Report Card for Dixon High Page 7 of 15
B. Pupil Outcomes
State Priority: Pupil Achievement The SARC provides the following information relevant to the State priority: Pupil Achievement (Priority 4): • Statewide assessments (i.e., California Assessment of Student Performance and Progress [CAASPP] System, which
includes the Smarter Balanced Summative Assessments for students in the general education population and the California Alternate Assessments [CAAs] for English language arts/literacy [ELA] and mathematics given in grades three through eight and grade eleven. Only eligible students may participate in the administration of the CAAs. CAAs items are aligned with alternate achievement standards, which are linked with the Common Core State Standards [CCSS] for students with the most significant cognitive disabilities); and
• The percentage of students who have successfully completed courses that satisfy the requirements for entrance to the University of California and the California State University, or career technical education sequences or programs of study.
CAASPP Test Results in ELA and Mathematics for All Students Grades Three through Eight and Grade Eleven Percentage of Students Meeting or Exceeding the State Standard
Subject School
2018-19 School
2019-20 District 2018-19
District 2019-20
State 2018-19
State 2019-20
English Language Arts/Literacy (grades 3-8 and 11)
58 N/A 41 N/A 50 N/A
Mathematics (grades 3-8 and 11)
35 N/A 33 N/A 39 N/A
Note: Cells with N/A values do not require data. Note: The 2019-2020 data are not available. Due to the COVID-19 pandemic, Executive Order N-30-20 was issued which waived the requirement for statewide testing for the 2019-2020 school year. Note: Percentages are not calculated when the number of students tested is ten or less, either because the number of students in this category is too small for statistical accuracy or to protect student privacy. Note: ELA and mathematics test results include the Smarter Balanced Summative Assessment and the CAA. The “Percent Met or Exceeded” is calculated by taking the total number of students who met or exceeded the standard on the Smarter Balanced Summative Assessment plus the total number of students who met the standard (i.e., achieved Level 3-Alternate) on the CAAs divided by the total number of students who participated in both assessments.
CAASPP Test Results in ELA by Student Group Grades Three through Eight and Grade Eleven (School Year 2019-2020)
Student Group Total
Enrollment Number Tested
Percent Tested
Percent Not
Tested
Percent Met or
Exceeded
All Students N/A N/A N/A N/A N/A
Male N/A N/A N/A N/A N/A
Female N/A N/A N/A N/A N/A
Black or African American N/A N/A N/A N/A N/A
American Indian or Alaska Native N/A N/A N/A N/A N/A
Asian N/A N/A N/A N/A N/A
Filipino N/A N/A N/A N/A N/A
Hispanic or Latino N/A N/A N/A N/A N/A
Native Hawaiian or Pacific Islander N/A N/A N/A N/A N/A
White N/A N/A N/A N/A N/A

2019-20 School Accountability Report Card for Dixon High Page 8 of 15
Student Group Total
Enrollment Number Tested
Percent Tested
Percent Not
Tested
Percent Met or
Exceeded
Two or More Races N/A N/A N/A N/A N/A
Socioeconomically Disadvantaged N/A N/A N/A N/A N/A
English Learners N/A N/A N/A N/A N/A
Students with Disabilities N/A N/A N/A N/A N/A
Students Receiving Migrant Education Services N/A N/A N/A N/A N/A
Foster Youth N/A N/A N/A N/A N/A
Homeless N/A N/A N/A N/A N/A
Note: Cells with N/A values do not require data. Note: The 2019-2020 data are not available. Due to the COVID-19 pandemic, Executive Order N-30-20 was issued which waived the requirement for statewide testing for the 2019-2020 school year.
CAASPP Test Results in Mathematics by Student Group Grades Three through Eight and Grade Eleven (School Year 2019-2020)
Student Group Total
Enrollment Number Tested
Percent Tested
Percent Not
Tested
Percent Met or
Exceeded
All Students N/A N/A N/A N/A N/A
Male N/A N/A N/A N/A N/A
Female N/A N/A N/A N/A N/A
Black or African American N/A N/A N/A N/A N/A
American Indian or Alaska Native N/A N/A N/A N/A N/A
Asian N/A N/A N/A N/A N/A
Filipino N/A N/A N/A N/A N/A
Hispanic or Latino N/A N/A N/A N/A N/A
Native Hawaiian or Pacific Islander N/A N/A N/A N/A N/A
White N/A N/A N/A N/A N/A
Two or More Races N/A N/A N/A N/A N/A
Socioeconomically Disadvantaged N/A N/A N/A N/A N/A
English Learners N/A N/A N/A N/A N/A
Students with Disabilities N/A N/A N/A N/A N/A
Students Receiving Migrant Education Services N/A N/A N/A N/A N/A
Foster Youth N/A N/A N/A N/A N/A
Homeless N/A N/A N/A N/A N/A
Note: Cells with N/A values do not require data. Note: The 2019-2020 data are not available. Due to the COVID-19 pandemic, Executive Order N-30-20 was issued which waived the requirement for statewide testing for the 2019-2020 school year.

2019-20 School Accountability Report Card for Dixon High Page 9 of 15
CAASPP Test Results in Science for All Students Grades Five, Eight, and High School Percentage of Students Meeting or Exceeding the State Standard
Subject School
2018-19 School
2019-20 District 2018-19
District 2019-20
State 2018-19
State 2019-20
Science (grades 5, 8 and high school) 32 N/A 23 N/A 30 N/A Note: Cells with N/A values do not require data. Note: The 2019-2020 data are not available. Due to the COVID-19 pandemic, Executive Order N-30-20 was issued which waived the requirement for statewide testing for the 2019-2020 school year. Note: The new California Science Test (CAST) was first administered operationally in the 2018-2019 school year.
CAASPP Test Results in Science by Student Group Grades Three through Eight and Grade Eleven (School Year 2019-2020)
Student Group Total
Enrollment Number Tested
Percent Tested
Percent Not
Tested
Percent Met or
Exceeded
All Students N/A N/A N/A N/A N/A
Male N/A N/A N/A N/A N/A
Female N/A N/A N/A N/A N/A
Black or African American N/A N/A N/A N/A N/A
American Indian or Alaska Native N/A N/A N/A N/A N/A
Asian N/A N/A N/A N/A N/A
Filipino N/A N/A N/A N/A N/A
Hispanic or Latino N/A N/A N/A N/A N/A
Native Hawaiian or Pacific Islander N/A N/A N/A N/A N/A
White N/A N/A N/A N/A N/A
Two or More Races N/A N/A N/A N/A N/A
Socioeconomically Disadvantaged N/A N/A N/A N/A N/A
English Learners N/A N/A N/A N/A N/A
Students with Disabilities N/A N/A N/A N/A N/A
Students Receiving Migrant Education Services N/A N/A N/A N/A N/A
Foster Youth N/A N/A N/A N/A N/A
Homeless N/A N/A N/A N/A N/A
Note: Cells with N/A values do not require data. Note: The 2019-2020 data are not available. Due to the COVID-19 pandemic, Executive Order N-30-20 was issued which waived the requirement for statewide testing for the 2019-2020 school year.

2019-20 School Accountability Report Card for Dixon High Page 10 of 15
Career Technical Education Programs (School Year 2019-2020)
Dixon High School offers several Career Technical Education (CT E) programs, including: Ag Science, Mechanics, Floral Design, Supervised Agricultural Education Projects, Culinary Arts/Foods, Computer Science and Multimedia Arts. The Dixon High School Agricultural Department is known state-wide as a model program. W e currently have three teachers working in the program and we offer a wide range of classes including both Agricultural Science and electives. Students in our Agricultural programs get both hands-on and academic experiences to prepare them for college and career. Our Agricultural students have many opportunities to compete, lead, and learn at many levels. The Dixon High School culinary program focuses on the safe and healthy preparation of food and entrepreneurial skills. Students in this program have many opportunities to prepare for careers and further study in the food sciences and business. Students in our Culinary Arts program can earn a California Food Handlers Certification. Dixon High School has two curricular paths with regard to Technology; Computer Science and Multimedia Arts. In Computer Science, students learn the basics of coding, web site design, and robotics. In Multimedia, students work with industry-standard equipment and software so students leave the program with the skills necessary to continue their education or pursue work in the field. Furthermore, Dixon High School students can earn Adobe Certification through the Multimedia program. Dixon High School has added a CTE Coordinator, beginning in the 2020-2021 school year.
Career Technical Education (CTE) Participation (School Year 2019-2020)
Measure CTE Program Participation
Number of Pupils Participating in CTE 410
Percent of Pupils that Complete a CTE Program and Earn a High School Diploma 57.1
Percent of CTE Courses that are Sequenced or Articulated Between the School and Institutions of Postsecondary Education
Courses for University of California (UC) and/or California State University (CSU) Admission
UC/CSU Course Measure Percent
2019-20 Pupils Enrolled in Courses Required for UC/CSU Admission 100
2018-19 Graduates Who Completed All Courses Required for UC/CSU Admission 38.78
State Priority: Other Pupil Outcomes The SARC provides the following information relevant to the State priority: Other Pupil Outcomes (Priority 8): • Pupil outcomes in the subject areas of physical education.
California Physical Fitness Test Results (School Year 2019-2020)
Grade Level Percentage of Students
Meeting Four of Six Fitness Standards
Percentage of Students Meeting Five of Six Fitness Standards
Percentage of Students Meeting Six of Six Fitness Standards
5 N/A N/A N/A

2019-20 School Accountability Report Card for Dixon High Page 11 of 15
Grade Level Percentage of Students
Meeting Four of Six Fitness Standards
Percentage of Students Meeting Five of Six Fitness Standards
Percentage of Students Meeting Six of Six Fitness Standards
7 N/A N/A N/A
9 N/A N/A N/A Note: Cells with N/A values do not require data. Note: The 2019–2020 data are not available. Due to the COVID-19 pandemic, Executive Order N-56-20 was issued which waived the requirement to administer the physical fitness performance test for the 2019–2020 school year.
C. Engagement
State Priority: Parental Involvement The SARC provides the following information relevant to the State priority: Parental Involvement (Priority 3): • Efforts the school district makes to seek parent input in making decisions for the school district and each school site
Opportunities for Parental Involvement (School Year 2020-2021)
We are very excited about our endeavors to engage parents and the community at Dixon High School. W e actively reach out to parent groups and welcome their input. Parent organizations include the PTO, Dixon Schools Athletic Boosters, Band Boosters, numerous sport-specific boosters, Dixon Sober Grad Night, and ELAC. DHS also hosts several information nights to help parents be more involved in their children’s education. In addition to Back to School Night and Open House, we host a Course Expo every year so parents, students, and community members can preview our programs. Parents can join us in Cash for College, College Admissions sessions, AVID Parent Nights, events, band concerts, and plays and musicals. We host several evenings of “Coffee with the Principal” or "Tuesday Talks" where parents can get together in a friendly, casual environment to get information and ask any questions. Dixon High School parents also serve as representatives on district facilities teams, the district’s DELA organization, and LCAP Advisory groups. Dixon High School is proud of our proactive, friendly office staff and employs a bilingual parent liaison to assist with parent outreach and communication. A parent or community member who would like to be more involved with our school is urged to contact us!
State Priority: Pupil Engagement The SARC provides the following information relevant to the State priority: Pupil Engagement (Priority 5): • High school dropout rates; and • High school graduation rates.
Dropout Rate and Graduation Rate (Four-Year Cohort Rate)
Indicator School
2016-17 School
2017-18 School
2018-19 District 2016-17
District 2017-18
District 2018-19
State 2016-17
State 2017-18
State 2018-19
Dropout Rate 6.2 6.7 4.3 12.3 13 13.1 9.1 9.6 9
Graduation Rate 93.5 92.1 95.3 83.3 80.5 82.5 82.7 83 84.5

2019-20 School Accountability Report Card for Dixon High Page 12 of 15
State Priority: School Climate The SARC provides the following information relevant to the State priority: School Climate (Priority 6): • Pupil suspension rates; • Pupil expulsion rates; and • Other local measures on the sense of safety.
Suspensions and Expulsions (data collected between July through June, each full school year respectively)
Rate School
2017-18 School
2018-19 District 2017-18
District 2018-19
State 2017-18
State 2018-19
Suspensions 7.4 6.5 6.9 6.7 3.5 3.5
Expulsions 0.3 0.2 0.1 0.1 0.1 0.1
Suspensions and Expulsions for School Year 2019-2020 Only (data collected between July through February, partial school year due to the COVID-19 pandemic)
Rate School
2019-20 District 2019-20
State 2019-20
Suspensions 0.0 0.0 2.5
Expulsions 0.0 0.0 0.1 Note: The 2019-2020 suspensions and expulsions rate data are not comparable to prior year data because the 2019-2020 school year is a partial school year due to the COVID-19 crisis. As such, it would be inappropriate to make any comparisons in rates of suspensions and expulsions in the 2019-2020 school year compared to prior years.
School Safety Plan (School Year 2020-2021)
Student safety at Dixon High School is our top priority. W e pride ourselves on our safe campus, as evidenced by our low percentage of violent acts, bullying, and other negative behaviors. Site staff and administration take a proactive approach to student behavior management and the school is transitioning to a PBIS model for behavioral management and student support. Dixon High School staff reviews and updates procedures for evacuations, fire emergencies, and intruders in collaboration with a comprehensive district safety plan and with Dixon Police Department, every year. Staff and students are trained on what to do in these incidents, and we have drills to practice for the. Dixon High School employs two part-time campus supervisors to assist the administration with student supervision to ensure students are safe and to develop positive relationships on campus. We also have a district School Resource Officer who engages with students and staff and also advises on safety matters. Additionally, all teachers have supervisory duties as well, throughout the day. Visitors to campus must come through the front office where they check-in and are given a sticker to indicate they are allowed on campus. Dixon High School has a nurse available, first aid kits throughout campus, and we have two AED machines should students, staff, or visitors have a cardiac emergency. All athletic coaches are CPR certified and current with the most recent research and protocols for injury prevention and treatment, including concussions.

2019-20 School Accountability Report Card for Dixon High Page 13 of 15
Average Class Size and Class Size Distribution (Secondary)
Subject
2017-18 Average
Class Size
2017-18 # of
Classes* Size 1-20
2017-18 # of
Classes* Size
21-32
2017-18 # of
Classes* Size 33+
2018-19 Average
Class Size
2018-19 # of
Classes* Size 1-20
2018-19 # of
Classes* Size
21-32
2018-19 # of
Classes* Size 33+
2019-20 Average
Class Size
2019-20 # of
Classes* Size 1-20
2019-20 # of
Classes* Size
21-32
2019-20 # of
Classes* Size 33+
English Language Arts
29 5 19 15 25 14 24 8 29 8 16 14
Mathematics 26 14 21 8 27 6 32 4 27 13 19 9
Science 29 5 17 8 25 8 20 2 30 5 9 11
Social Science 27 8 11 14 25 11 17 8 29 3 18 7
*Number of classes indicates how many classrooms fall into each size category (a range of total students per classroom). At the secondary school level, this information is reported by subject area rather than grade level.
Ratio of Pupils to Academic Counselor (School Year 2019-2020)
Title Ratio
Academic Counselors* 531 *One full time equivalent (FTE) equals one staff member working full time; one FTE could also represent two staff members who each work 50 percent of full time.
Student Support Services Staff (School Year 2019-2020)
Title Number of FTE*
Assigned to School
Counselor (Academic, Social/Behavioral or Career Development) 2
Library Media Teacher (Librarian)
Library Media Services Staff (Paraprofessional)
Psychologist
Social Worker
Nurse
Speech/Language/Hearing Specialist
Resource Specialist (non-teaching)
Other *One Full Time Equivalent (FTE) equals one staff member working full time; one FTE could also represent two staff members who each work 50 percent of full time.
Expenditures Per Pupil and School Site Teacher Salaries (Fiscal Year 2018-2019)
Level Total
Expenditures Per Pupil
Expenditures Per Pupil
(Restricted)
Expenditures Per Pupil
(Unrestricted)
Average Teacher Salary
School Site $7,013.00 $777.00 $6,236.00 $70,479.00
District N/A N/A $8,559.00 $62,062.00
Percent Difference - School Site and District N/A N/A
State N/A N/A $7,750.00 $75,706.00
Percent Difference - School Site and State N/A N/A Note: Cells with N/A values do not require data.

2019-20 School Accountability Report Card for Dixon High Page 14 of 15
Types of Services Funded (Fiscal Year 2019-2020)
Dixon High School is committed to supporting students so they can access a rigorous curriculum and leave our school college and career ready. As detailed in our LCAP and funded by SCG, general fund, and grants, the following services and supports are provided for our students and families: After School Learning Center, staffed with tutors. STEM, CTE, and VAPA support Intervention classes in mathematics English Learner Development instruction Intensive Intervention class for high-risk freshmen AVID Elective classes AVID Schoolwide support College readiness program through contracts with Destination College Advisory Corp Advanced Placement Course offerings with financial assistance for exam fees Credit Recovery Common Core Literacy Coach CCSS aligned instructional materials Library Services Bilingual Parent Liaison EL clerk Positive Behavior Intervention and Supports (PBIS) EL Training for Staff through EL Achieve
Teacher and Administrative Salaries (Fiscal Year 2018-2019)
Category District Amount
State Average For Districts
In Same Category
Beginning Teacher Salary $42,974 $47,145
Mid-Range Teacher Salary $64,867 $74,952
Highest Teacher Salary $86,402 $96,092
Average Principal Salary (Elementary) $102,491 $116,716
Average Principal Salary (Middle) $110,987 $120,813
Average Principal Salary (High) $114,458 $131,905
Superintendent Salary $187,101 $192,565
Percent of Budget for Teacher Salaries 32.0 31.0
Percent of Budget for Administrative Salaries 6.0 6.0 For detailed information on salaries, see the CDE Certificated Salaries & Benefits web page at https://www.cde.ca.gov/ds/fd/cs/.
Advanced Placement (AP) Courses (School Year 2019-2020)
Subject Number of
AP Courses Offered* Percent of Students
In AP Courses
Computer Science N/A
English------- 4 N/A
Fine and Performing Arts 2 N/A
Foreign Language 1 N/A

2019-20 School Accountability Report Card for Dixon High Page 15 of 15
Subject Number of
AP Courses Offered* Percent of Students
In AP Courses
Mathematics 3 N/A
Science------- 3 N/A
Social Science 8 N/A
All courses 21 29.3 *Where there are student course enrollments of at least one student.
Professional Development (Most Recent Three Years)
Measure 2018-19 2019-20 2020-21
Number of school days dedicated to Staff Development and Continuous Improvement 34 34 34
Dixon High School staff development focuses on further developing practices to ensure sound, rigorous, equitable academic and socio-emotional experiences for all students. With this in mind, we continue with site and district based AVID, PBIS, and English Learner professional development. In addition to outside professional development resources such as AVID Summer Institute and EL Achieve, we also have district and county professional development in these areas, as well as equity taskforce, brief intervention training, and addition English Learner trainings. Some of our most powerful professional development is done on site, in collaborative groups, especially with regard to instructional practices as an AVID Schoolwide school.

2019-20 School Accountability Report Card for Gretchen Higgins Elementary School Page 1 of 11
Gretchen Higgins Elementary School
School Accountability Report Card
Reported Using Data from the 2019-2020 School Year
Published During 2020-2021
By February 1 of each year, every school in California is required by state law to publish a School Accountability Report Card (SARC). The SARC contains information about the condition and performance of each California public school. Under the Local Control Funding Formula (LCFF) all local educational agencies (LEAs) are required to prepare a Local Control and Accountability Plan (LCAP), which describes how they intend to meet annual school-specific goals for all pupils, with specific activities to address state and local priorities. Additionally, data reported in an LCAP is to be consistent with data reported in the SARC.
• For more information about SARC requirements and access to prior year reports, see the California Department of Education (CDE) SARC web page at https://www.cde.ca.gov/ta/ac/sa/.
• For more information about the LCFF or the LCAP, see the CDE LCFF webpage at https://www.cde.ca.gov/fg/aa/lc/.
• For additional information about the school, parents/guardians and community members should contact the school principal or the district office.
DataQuest DataQuest is an online data tool located on the CDE DataQuest web page at https://dq.cde.ca.gov/dataquest/ that contains additional information about this school and comparisons of the school to the district and the county. Specifically, DataQuest is a dynamic system that provides reports for accountability (e.g., test data, enrollment, high school graduates, dropouts, course enrollments, staffing, and data regarding English learners). California School Dashboard The California School Dashboard (Dashboard) https://www.caschooldashboard.org/ reflects California’s new accountability and continuous improvement system and provides information about how LEAs and schools are meeting the needs of California’s diverse student population. The Dashboard contains reports that display the performance of LEAs, schools, and student groups on a set of state and local measures to assist in identifying strengths, challenges, and areas in need of improvement.
About This School
School Contact Information (School Year 2020-2021)
Entity Contact Information
School Name Gretchen Higgins Elementary School
Street 1525 Pembroke Way
City, State, Zip Dixon, Ca, 95620-4115
Phone Number 707-693-6380
Principal Shawntel McCammon, Principal
Email Address [email protected]
Website http://gh.dixonusd.org/
County-District-School (CDS) Code 48705326120240

2019-20 School Accountability Report Card for Gretchen Higgins Elementary School Page 2 of 11
District Contact Information (School Year 2020-2021)
Entity Contact Information
District Name Dixon Unified School District
Phone Number (707) 693-6300
Superintendent Brian Dolan
Email Address [email protected]
Website www.dixonusd.org
School Description and Mission Statement (School Year 2020-2021)
Gretchen Higgins opened its doors in July of 2002. Our school is located in Dixon, a small town of about 19,300 in northern California. Our school is primarily a neighborhood school that also includes many outlying rural areas and the migrant center. The school is located on the north side of Dixon surrounded by many housing options including single-family homes, apartments, and townhouses. W e are a Kindergarten through 5th-grade site with a great staff that has high expectations for all students! At Gretchen Higgins, we promote high academic success through high expectations and rigorous academic instruction. We encourage active student engagement by providing each student a diverse education in a safe, supportive and nurturing environment that promotes self-discipline, motivation, and excellence in learning. The Gretchen Higgins team joins the parents and community to assist the students in developing 21st-century skills to become independent and self-sufficient life long learners who will succeed and contribute responsibly to the global market. Staff members and parents participate on various committees that make decisions regarding the priorities and direction of the educational plan to ensure instructional programs are consistent with students’ needs and comply with district goals. Leadership teams include the School Site Council (SSC), English Learner Advisory Council (ELAC) and Local Control Accountability Plan (LCAP). Our site's mission: In order for our students to be college and career ready, Gretchen Higgins, in collaboration with home and community, will provide a nurturing and rigorous academic environment. About Our School Gretchen Higgins Elementary School promotes high academic success through high expectations and high-quality instruction. Gretchen Higgins encourages active student engagement by providing each student with a diverse education in a safe, supportive, nurturing environment that promotes self-discipline, motivation, and excellence in learning. The Gretchen Higgins team joins the parents and community to assist the students in developing 21st-century skills to become independent and self-sufficient life-long learners who will succeed and contribute responsibly to the global market. W e strive to meet the needs of each of our students by adhering to the District's core beliefs and vision, which serve as guiding principles for site-level planning. The guiding core vision is: Plan and acts to meet our students’ needs first, engage students in learning through innovative and effective instruction, invest in the growth and development of our staff, support learning through modern technology and safe facilities, and ensure on-going, measurable improvement through collaborations. All of these are the foundation of the district vision to close the achievement gap by preparing all students for college and career readiness and success in a global society. We are Huskies and pride ourselves on following our school-wide expectations of being Respectful, Responsible and Safe.
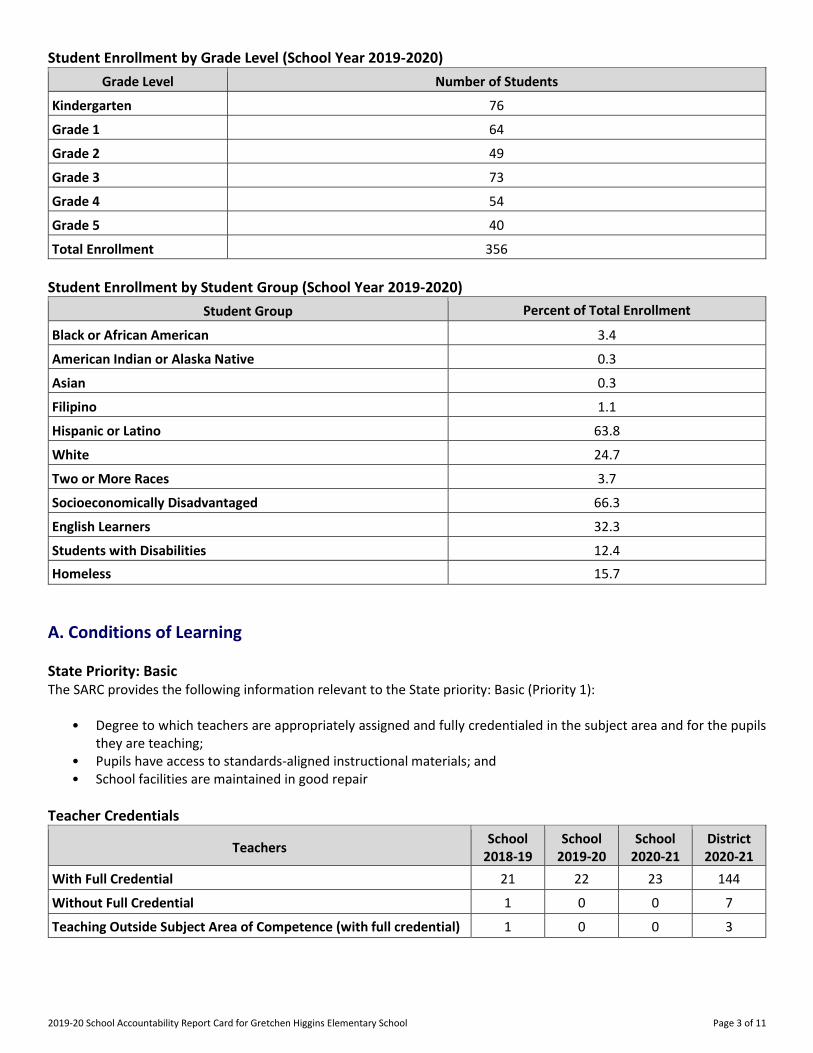
2019-20 School Accountability Report Card for Gretchen Higgins Elementary School Page 3 of 11
Student Enrollment by Grade Level (School Year 2019-2020)
Grade Level Number of Students
Kindergarten 76
Grade 1 64
Grade 2 49
Grade 3 73
Grade 4 54
Grade 5 40
Total Enrollment 356
Student Enrollment by Student Group (School Year 2019-2020)
Student Group Percent of Total Enrollment
Black or African American 3.4
American Indian or Alaska Native 0.3
Asian 0.3
Filipino 1.1
Hispanic or Latino 63.8
White 24.7
Two or More Races 3.7
Socioeconomically Disadvantaged 66.3
English Learners 32.3
Students with Disabilities 12.4
Homeless 15.7
A. Conditions of Learning
State Priority: Basic The SARC provides the following information relevant to the State priority: Basic (Priority 1):
• Degree to which teachers are appropriately assigned and fully credentialed in the subject area and for the pupils they are teaching;
• Pupils have access to standards-aligned instructional materials; and • School facilities are maintained in good repair
Teacher Credentials
Teachers School
2018-19 School
2019-20 School
2020-21 District 2020-21
With Full Credential 21 22 23 144
Without Full Credential 1 0 0 7
Teaching Outside Subject Area of Competence (with full credential) 1 0 0 3

2019-20 School Accountability Report Card for Gretchen Higgins Elementary School Page 4 of 11
Teacher Misassignments and Vacant Teacher Positions
Indicator 2018-19 2019-20 2020-21
Misassignments of Teachers of English Learners 0 0 0
Total Teacher Misassignments* 0 0 0
Vacant Teacher Positions 0 0 0 Note: “Misassignments” refers to the number of positions filled by teachers who lack legal authorization to teach that grade level, subject area, student group, etc. *Total Teacher Misassignments includes the number of Misassignments of Teachers of English Learners.
Quality, Currency, Availability of Textbooks and Other Instructional Materials (School Year 2020-2021) Year and month in which data were collected: August 2019
Subject Textbooks and Other Instructional
Materials/year of Adoption
From Most Recent
Adoption?
Percent Students Lacking Own
Assigned Copy
Reading/Language Arts California National Geographic Reach for Reading (Kindergarten-1st grade) (Adopted 2017) Benchmark Advance (2nd - 5th grade) (Adopted 2017)
Yes 0.00 %
Mathematics Houghton Mifflin Harcourt - California Go Math (Adopted 2015)
Yes 0.00 %
Science Harcourt - California Science Yes 0.00 %
History-Social Science Pearson Scott Foresman - History-Social Science For California
Yes 0.00 %
Note: Cells with N/A values do not require data.
School Facility Conditions and Planned Improvements
Gretchen Higgins is an eighteen-year-old school that meets or exceeds all state requirements on a school facility. The campus currently contains 26 permanent classrooms and 3 portable classrooms, a multipurpose room, library, computer lab, blacktop area and grass field for activities, two play structures, and an administration office. 100% of our bathrooms are in working order. The Dixon Unified School District along with North Bay Schools Insurance performs yearly safety inspections with the purpose of identifying and correcting any and all safety issues and concerns. A work order process is used to ensure efficient service and that emergency repairs are given the highest priority. All HVAC units undergo regular maintenance and cleaning. All classrooms currently have W IFI capabilities. Above and beyond the daily cleaning standards done by the custodial staff, the district schedules a thorough deep cleaning of classrooms on a regular basis. New security fencing allows the campus to be locked up during school hours and forces all visitor traffic to check in with the front office. There are no scheduled facility improvements.

2019-20 School Accountability Report Card for Gretchen Higgins Elementary School Page 5 of 11
School Facility Good Repair Status Using the most recently collected FIT data (or equivalent), provide the following:
• Determination of repair status for systems listed • Description of any needed maintenance to ensure good repair • The year and month in which the data were collected • The rate for each system inspected • The overall rating
Year and month of the most recent FIT report: August 2020
System Inspected Rating Repair Needed and Action Taken or Planned
Systems: Gas Leaks, Mechanical/HVAC, Sewer
XGood
Interior: Interior Surfaces XFair
Cleanliness: Overall Cleanliness, Pest/ Vermin Infestation
XGood
Electrical: Electrical XFair
Restrooms/Fountains: Restrooms, Sinks/ Fountains
XGood
Safety: Fire Safety, Hazardous Materials
XGood
Structural: Structural Damage, Roofs
XGood
External: Playground/School Grounds, Windows/ Doors/Gates/Fences
XGood
Overall Rating XGood

2019-20 School Accountability Report Card for Gretchen Higgins Elementary School Page 6 of 11
B. Pupil Outcomes
State Priority: Pupil Achievement The SARC provides the following information relevant to the State priority: Pupil Achievement (Priority 4): • Statewide assessments (i.e., California Assessment of Student Performance and Progress [CAASPP] System, which
includes the Smarter Balanced Summative Assessments for students in the general education population and the California Alternate Assessments [CAAs] for English language arts/literacy [ELA] and mathematics given in grades three through eight and grade eleven. Only eligible students may participate in the administration of the CAAs. CAAs items are aligned with alternate achievement standards, which are linked with the Common Core State Standards [CCSS] for students with the most significant cognitive disabilities); and
• The percentage of students who have successfully completed courses that satisfy the requirements for entrance to the University of California and the California State University, or career technical education sequences or programs of study.
CAASPP Test Results in ELA and Mathematics for All Students Grades Three through Eight and Grade Eleven Percentage of Students Meeting or Exceeding the State Standard
Subject School
2018-19 School
2019-20 District 2018-19
District 2019-20
State 2018-19
State 2019-20
English Language Arts/Literacy (grades 3-8 and 11)
36 N/A 41 N/A 50 N/A
Mathematics (grades 3-8 and 11)
37 N/A 33 N/A 39 N/A
Note: Cells with N/A values do not require data. Note: The 2019-2020 data are not available. Due to the COVID-19 pandemic, Executive Order N-30-20 was issued which waived the requirement for statewide testing for the 2019-2020 school year. Note: Percentages are not calculated when the number of students tested is ten or less, either because the number of students in this category is too small for statistical accuracy or to protect student privacy. Note: ELA and mathematics test results include the Smarter Balanced Summative Assessment and the CAA. The “Percent Met or Exceeded” is calculated by taking the total number of students who met or exceeded the standard on the Smarter Balanced Summative Assessment plus the total number of students who met the standard (i.e., achieved Level 3-Alternate) on the CAAs divided by the total number of students who participated in both assessments.
CAASPP Test Results in ELA by Student Group Grades Three through Eight and Grade Eleven (School Year 2019-2020)
Student Group Total
Enrollment Number Tested
Percent Tested
Percent Not
Tested
Percent Met or
Exceeded
All Students N/A N/A N/A N/A N/A
Male N/A N/A N/A N/A N/A
Female N/A N/A N/A N/A N/A
Black or African American N/A N/A N/A N/A N/A
American Indian or Alaska Native N/A N/A N/A N/A N/A
Asian N/A N/A N/A N/A N/A
Filipino N/A N/A N/A N/A N/A
Hispanic or Latino N/A N/A N/A N/A N/A
Native Hawaiian or Pacific Islander N/A N/A N/A N/A N/A
White N/A N/A N/A N/A N/A
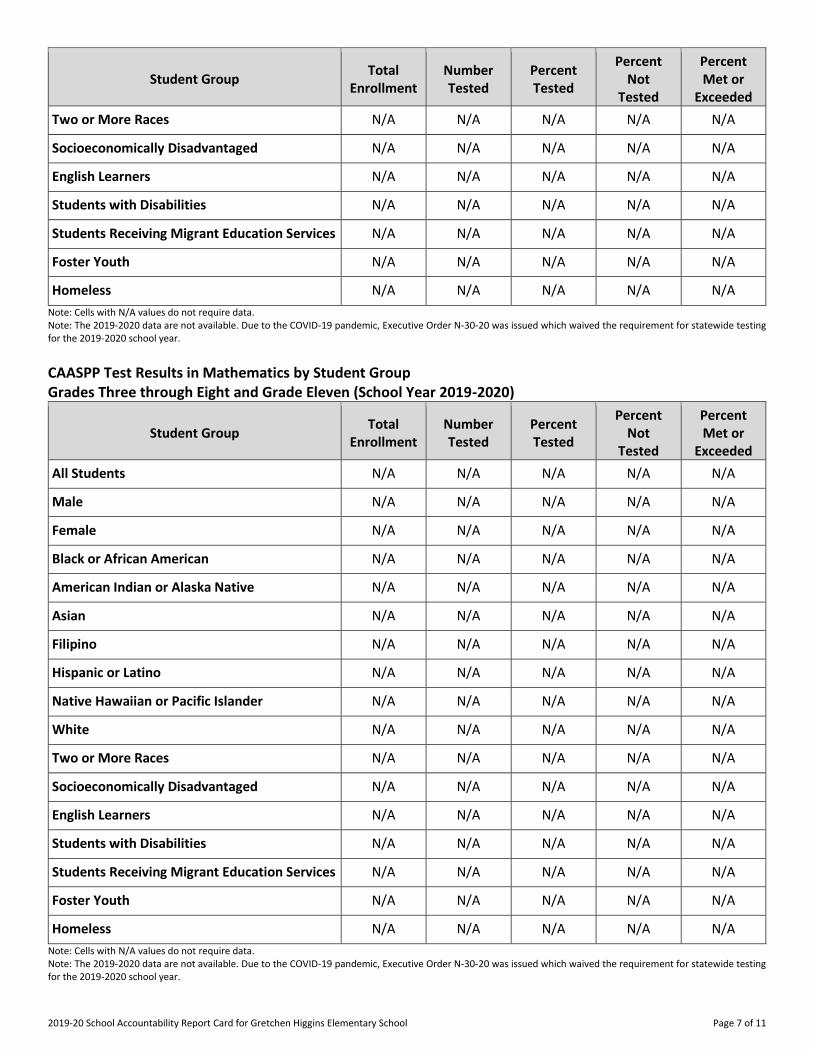
2019-20 School Accountability Report Card for Gretchen Higgins Elementary School Page 7 of 11
Student Group Total
Enrollment Number Tested
Percent Tested
Percent Not
Tested
Percent Met or
Exceeded
Two or More Races N/A N/A N/A N/A N/A
Socioeconomically Disadvantaged N/A N/A N/A N/A N/A
English Learners N/A N/A N/A N/A N/A
Students with Disabilities N/A N/A N/A N/A N/A
Students Receiving Migrant Education Services N/A N/A N/A N/A N/A
Foster Youth N/A N/A N/A N/A N/A
Homeless N/A N/A N/A N/A N/A
Note: Cells with N/A values do not require data. Note: The 2019-2020 data are not available. Due to the COVID-19 pandemic, Executive Order N-30-20 was issued which waived the requirement for statewide testing for the 2019-2020 school year.
CAASPP Test Results in Mathematics by Student Group Grades Three through Eight and Grade Eleven (School Year 2019-2020)
Student Group Total
Enrollment Number Tested
Percent Tested
Percent Not
Tested
Percent Met or
Exceeded
All Students N/A N/A N/A N/A N/A
Male N/A N/A N/A N/A N/A
Female N/A N/A N/A N/A N/A
Black or African American N/A N/A N/A N/A N/A
American Indian or Alaska Native N/A N/A N/A N/A N/A
Asian N/A N/A N/A N/A N/A
Filipino N/A N/A N/A N/A N/A
Hispanic or Latino N/A N/A N/A N/A N/A
Native Hawaiian or Pacific Islander N/A N/A N/A N/A N/A
White N/A N/A N/A N/A N/A
Two or More Races N/A N/A N/A N/A N/A
Socioeconomically Disadvantaged N/A N/A N/A N/A N/A
English Learners N/A N/A N/A N/A N/A
Students with Disabilities N/A N/A N/A N/A N/A
Students Receiving Migrant Education Services N/A N/A N/A N/A N/A
Foster Youth N/A N/A N/A N/A N/A
Homeless N/A N/A N/A N/A N/A
Note: Cells with N/A values do not require data. Note: The 2019-2020 data are not available. Due to the COVID-19 pandemic, Executive Order N-30-20 was issued which waived the requirement for statewide testing for the 2019-2020 school year.

2019-20 School Accountability Report Card for Gretchen Higgins Elementary School Page 8 of 11
CAASPP Test Results in Science for All Students Grades Five, Eight, and High School Percentage of Students Meeting or Exceeding the State Standard
Subject School
2018-19 School
2019-20 District 2018-19
District 2019-20
State 2018-19
State 2019-20
Science (grades 5, 8 and high school) 17 N/A 23 N/A 30 N/A Note: Cells with N/A values do not require data. Note: The 2019-2020 data are not available. Due to the COVID-19 pandemic, Executive Order N-30-20 was issued which waived the requirement for statewide testing for the 2019-2020 school year. Note: The new California Science Test (CAST) was first administered operationally in the 2018-2019 school year.
State Priority: Other Pupil Outcomes The SARC provides the following information relevant to the State priority: Other Pupil Outcomes (Priority 8): • Pupil outcomes in the subject areas of physical education.
California Physical Fitness Test Results (School Year 2019-2020)
Grade Level Percentage of Students
Meeting Four of Six Fitness Standards
Percentage of Students Meeting Five of Six Fitness Standards
Percentage of Students Meeting Six of Six Fitness Standards
5 N/A N/A N/A
7 N/A N/A N/A
9 N/A N/A N/A Note: Cells with N/A values do not require data. Note: The 2019–2020 data are not available. Due to the COVID-19 pandemic, Executive Order N-56-20 was issued which waived the requirement to administer the physical fitness performance test for the 2019–2020 school year.
C. Engagement
State Priority: Parental Involvement The SARC provides the following information relevant to the State priority: Parental Involvement (Priority 3): • Efforts the school district makes to seek parent input in making decisions for the school district and each school site
Opportunities for Parental Involvement (School Year 2020-2021)
At Gretchen Higgins Elementary School, parents are encouraged to be involved in our school. The staff at Gretchen Higgins values and includes all stakeholders in the educational process. At school, parent participation is an active and key component of our culture. Family members contribute to the GH community in many ways, including volunteering in the classroom attending parent education classes, organizing and assisting in daily school activities, and participating in committees. The GH School Site Council and Parent-Teacher organization encourage parent/guardian involvement in school planning and activities. The School Site Council (SSC) helps to plan and evaluate overall school programming and approves yearly budget expenditures. Our English Language Advisory Committee (ELAC) assists in assessing the needs of, programming and supports to English Learners. The Parent Teacher Organization (PTO) raises thousands of dollars for school use each year. Volunteers, community members, and staff assist with school-wide events such as book fairs, Family Fun Nights, movie nights, holiday events, and school beautification efforts. Weekly newsletters ensure that parents/guardians are informed about curriculum, activities, and functions at Gretchen Higgins.
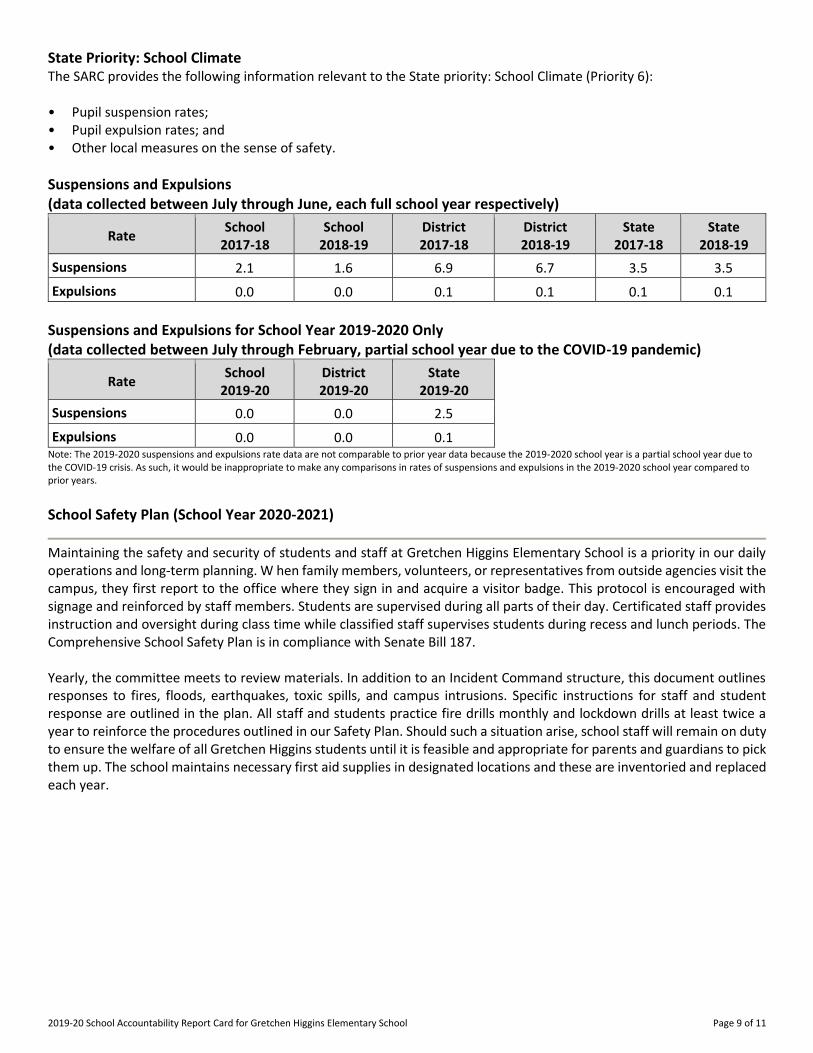
2019-20 School Accountability Report Card for Gretchen Higgins Elementary School Page 9 of 11
State Priority: School Climate The SARC provides the following information relevant to the State priority: School Climate (Priority 6): • Pupil suspension rates; • Pupil expulsion rates; and • Other local measures on the sense of safety.
Suspensions and Expulsions (data collected between July through June, each full school year respectively)
Rate School
2017-18 School
2018-19 District 2017-18
District 2018-19
State 2017-18
State 2018-19
Suspensions 2.1 1.6 6.9 6.7 3.5 3.5
Expulsions 0.0 0.0 0.1 0.1 0.1 0.1
Suspensions and Expulsions for School Year 2019-2020 Only (data collected between July through February, partial school year due to the COVID-19 pandemic)
Rate School
2019-20 District 2019-20
State 2019-20
Suspensions 0.0 0.0 2.5
Expulsions 0.0 0.0 0.1 Note: The 2019-2020 suspensions and expulsions rate data are not comparable to prior year data because the 2019-2020 school year is a partial school year due to the COVID-19 crisis. As such, it would be inappropriate to make any comparisons in rates of suspensions and expulsions in the 2019-2020 school year compared to prior years.
School Safety Plan (School Year 2020-2021)
Maintaining the safety and security of students and staff at Gretchen Higgins Elementary School is a priority in our daily operations and long-term planning. W hen family members, volunteers, or representatives from outside agencies visit the campus, they first report to the office where they sign in and acquire a visitor badge. This protocol is encouraged with signage and reinforced by staff members. Students are supervised during all parts of their day. Certificated staff provides instruction and oversight during class time while classified staff supervises students during recess and lunch periods. The Comprehensive School Safety Plan is in compliance with Senate Bill 187. Yearly, the committee meets to review materials. In addition to an Incident Command structure, this document outlines responses to fires, floods, earthquakes, toxic spills, and campus intrusions. Specific instructions for staff and student response are outlined in the plan. All staff and students practice fire drills monthly and lockdown drills at least twice a year to reinforce the procedures outlined in our Safety Plan. Should such a situation arise, school staff will remain on duty to ensure the welfare of all Gretchen Higgins students until it is feasible and appropriate for parents and guardians to pick them up. The school maintains necessary first aid supplies in designated locations and these are inventoried and replaced each year.

2019-20 School Accountability Report Card for Gretchen Higgins Elementary School Page 10 of 11
D. Other SARC Information
The information in this section is required to be in the SARC but is not included in the state priorities for LCFF.
Average Class Size and Class Size Distribution (Elementary)
Grade Level
2017-18 Average
Class Size
2017-18 # of
Classes* Size 1-20
2017-18 # of
Classes* Size
21-32
2017-18 # of
Classes* Size 33+
2018-19 Average
Class Size
2018-19 # of
Classes* Size 1-20
2018-19 # of
Classes* Size
21-32
2018-19 # of
Classes* Size 33+
2019-20 Average
Class Size
2019-20 # of
Classes* Size 1-20
2019-20 # of
Classes* Size
21-32
2019-20 # of
Classes* Size 33+
K
25 2 23 3 25 3
1
23 3 26 2 21 3
2
28 2 24 3 25 2
3
23 2 26 2 24 3
4
29 2 21 2 32 1
5
27 2 31 2 31 1
6
29 3
Other**
31 1 *Number of classes indicates how many classes fall into each size category (a range of total students per class). ** “Other” category is for multi-grade level classes.
Ratio of Pupils to Academic Counselor (School Year 2019-2020)
Title Ratio
Academic Counselors* 0 *One full time equivalent (FTE) equals one staff member working full time; one FTE could also represent two staff members who each work 50 percent of full time.
Expenditures Per Pupil and School Site Teacher Salaries (Fiscal Year 2018-2019)
Level Total
Expenditures Per Pupil
Expenditures Per Pupil
(Restricted)
Expenditures Per Pupil
(Unrestricted)
Average Teacher Salary
School Site $8,529.00 $1,340.00 $7,189.00 $69,821.00
District N/A N/A $8,559.00 $62,062.00
Percent Difference - School Site and District N/A N/A
State N/A N/A $7,750.00 $75,706.00
Percent Difference - School Site and State N/A N/A Note: Cells with N/A values do not require data.
Types of Services Funded (Fiscal Year 2019-2020)
Gretchen Higgins receives Title I Funding and the School Site Council approved the School Plan for Student Achievement (SPSA) in August 2020. The SPSA included the following: funds to provide support through additional staff for Intervention and English Language Development instruction, Professional Development opportunities for staff, afterschool intervention tutoring, improvement of school climate and student behavior through Soul Shoppe and Positive Behavior Intervention and Supports (PBIS), Social-Emotional Learning (SEL) groups through Solano County Office of Education and supplementary materials and technology to provide additional support to the Common Core State Standards (CCSS). Our programs are adaptable to meet the needs of each child and student enrollment shifts as students achieve learning goals and others are identified to receive assistance.

2019-20 School Accountability Report Card for Gretchen Higgins Elementary School Page 11 of 11
Teacher and Administrative Salaries (Fiscal Year 2018-2019)
Category District Amount
State Average For Districts
In Same Category
Beginning Teacher Salary $42,974 $47,145
Mid-Range Teacher Salary $64,867 $74,952
Highest Teacher Salary $86,402 $96,092
Average Principal Salary (Elementary) $102,491 $116,716
Average Principal Salary (Middle) $110,987 $120,813
Average Principal Salary (High) $114,458 $131,905
Superintendent Salary $187,101 $192,565
Percent of Budget for Teacher Salaries 32.0 31.0
Percent of Budget for Administrative Salaries 6.0 6.0 For detailed information on salaries, see the CDE Certificated Salaries & Benefits web page at https://www.cde.ca.gov/ds/fd/cs/.
Professional Development (Most Recent Three Years)
Measure 2018-19 2019-20 2020-21
Number of school days dedicated to Staff Development and Continuous Improvement 46 21 42
Ongoing professional development of staff is an important part of improving our school programs and student achievement. Teachers have weekly collaboration time and at least three paid non-pupil professional development days throughout the school year and are encouraged to attend workshops and conferences both during the school year and during the summer months, paid for by the district. Professional Development at Gretchen Higgins Elementary School is currently focused on: math instructional practices, supporting English Language Learners, AVID implementation of practices, Next Generation Science Standards (NGSS), classroom management strategies to increase student engagement, technology integration, and administering and using online Benchmark/ Math data to inform instruction using IO. These focus areas were selected in conjunction with the District's LCAP goals. All certificated and classified staff participate in trainings to support Social-Emotional Learning and Positive Behavior Intervention and Supports. For certificated and classified staff, we emphasize instructional strategies for diverse learners with a wide range of abilities. DUSD is also involved in the Teacher Induction Program which assigns new teachers with a mentor teacher. This program is a two-year mandatory program for all new beginning teachers. We understand the critical role that staff development plays in improving student achievement and we, as a community of learners, value learning at all levels.

2019-20 School Accountability Report Card for Maine Prairie High (Continuation) Page 1 of 12
Maine Prairie High (Continuation)
School Accountability Report Card
Reported Using Data from the 2019-2020 School Year
Published During 2020-2021
By February 1 of each year, every school in California is required by state law to publish a School Accountability Report Card (SARC). The SARC contains information about the condition and performance of each California public school. Under the Local Control Funding Formula (LCFF) all local educational agencies (LEAs) are required to prepare a Local Control and Accountability Plan (LCAP), which describes how they intend to meet annual school-specific goals for all pupils, with specific activities to address state and local priorities. Additionally, data reported in an LCAP is to be consistent with data reported in the SARC.
• For more information about SARC requirements and access to prior year reports, see the California Department of Education (CDE) SARC web page at https://www.cde.ca.gov/ta/ac/sa/.
• For more information about the LCFF or the LCAP, see the CDE LCFF webpage at https://www.cde.ca.gov/fg/aa/lc/.
• For additional information about the school, parents/guardians and community members should contact the school principal or the district office.
DataQuest DataQuest is an online data tool located on the CDE DataQuest web page at https://dq.cde.ca.gov/dataquest/ that contains additional information about this school and comparisons of the school to the district and the county. Specifically, DataQuest is a dynamic system that provides reports for accountability (e.g., test data, enrollment, high school graduates, dropouts, course enrollments, staffing, and data regarding English learners). California School Dashboard The California School Dashboard (Dashboard) https://www.caschooldashboard.org/ reflects California’s new accountability and continuous improvement system and provides information about how LEAs and schools are meeting the needs of California’s diverse student population. The Dashboard contains reports that display the performance of LEAs, schools, and student groups on a set of state and local measures to assist in identifying strengths, challenges, and areas in need of improvement.
About This School
School Contact Information (School Year 2020-2021)
Entity Contact Information
School Name Maine Prairie High (Continuation)
Street 305 East C St.
City, State, Zip Dixon, Ca, 95620-3019
Phone Number 707-693-6340
Principal Yvette Ramos, Principal
Email Address [email protected]
Website http://mphs.dixonusd.org/
County-District-School (CDS) Code 48705324830055

2019-20 School Accountability Report Card for Maine Prairie High (Continuation) Page 2 of 12
District Contact Information (School Year 2020-2021)
Entity Contact Information
District Name Dixon Unified
Phone Number (707) 693-6300
Superintendent Brian Dolan
Email Address [email protected]
Website www .dixonusd.org
School Description and Mission Statement (School Year 2020-2021)
MPHS serves up to 100 student scholars in an alternative setting for the Dixon Unified School District. Founded in 1977, MPHS was originally located on the grounds of the Dixon May Fair. MPHS moved to its current all portable location in 1992. The majority of MPHS scholars enroll in the program to remediate credit deficiency that restricts timely graduation from the district's comprehensive high school. Depending on academic status, students may return to the traditional high school, graduate from MPHS (either early or on time), and if making appropriate progress, continue as a fifth-year senior. Although many scholars enroll intending to return to the comprehensive high school program, most who earn that option make MPHS their school of choice. The school's instructional programs are directly aligned to common core standards. Student learner outcomes are intended to challenge students to develop and demonstrate their ability to think and act independently. MPHS is a school where our scholars become contributing members of society who are effective communicators, exhibiting both academic preparedness and civic responsibility. The mission of MPHS is to create an environment where students are engaged in robust and relevant content, connected with positive and meaningful relationships and supported with services needed to become self-aware and achieve their college career and life goals. About Our School Welcome to Maine Prairie High School (MPHS). Our school community is a warm, inviting environment for all of our scholars. I am proud to serve these student scholars and proud of the hard work our scholars and staff put forth each and every day. MPHS, founded in 1977, is the only alternative high school in the Dixon Unified School District. MPHS is staffed to serve 100 scholars in grades 10-12 and class size is 20:1. The majority of our scholars enroll due to credit deficiency which restricts timely graduation from the comprehensive high school. Depending on academic status scholars may return to the traditional high school, graduate from MPHS or continue a ninth semester through a contractual placement. Although many scholars enroll intending to return to the traditional program, many choose to make MPHS their school of choice. Maine Prairie High School is accredited by the W estern Association of Schools and Colleges (WASC)
Student Enrollment by Grade Level (School Year 2019-2020)
Grade Level Number of Students
Grade 10 2
Grade 11 38
Grade 12 50
Total Enrollment 90

2019-20 School Accountability Report Card for Maine Prairie High (Continuation) Page 3 of 12
Student Enrollment by Student Group (School Year 2019-2020)
Student Group Percent of Total Enrollment
Black or African American 1.1
Filipino 1.1
Hispanic or Latino 64.4
Native Hawaiian or Pacific Islander 1.1
White 25.6
Two or More Races 2.2
Socioeconomically Disadvantaged 62.2
English Learners 22.2
Students with Disabilities 8.9
Foster Youth 2.2
Homeless 5.6
A. Conditions of Learning
State Priority: Basic The SARC provides the following information relevant to the State priority: Basic (Priority 1):
• Degree to which teachers are appropriately assigned and fully credentialed in the subject area and for the pupils they are teaching;
• Pupils have access to standards-aligned instructional materials; and • School facilities are maintained in good repair
Teacher Credentials
Teachers School
2018-19 School
2019-20 School
2020-21 District 2020-21
With Full Credential 5 3 4 144
Without Full Credential 2 3 1 7
Teaching Outside Subject Area of Competence (with full credential) 0 0 0 3
Teacher Misassignments and Vacant Teacher Positions
Indicator 2018-19 2019-20 2020-21
Misassignments of Teachers of English Learners 0 0 0
Total Teacher Misassignments* 0 0 0
Vacant Teacher Positions 0 0 0 Note: “Misassignments” refers to the number of positions filled by teachers who lack legal authorization to teach that grade level, subject area, student group, etc. *Total Teacher Misassignments includes the number of Misassignments of Teachers of English Learners.

2019-20 School Accountability Report Card for Maine Prairie High (Continuation) Page 4 of 12
Quality, Currency, Availability of Textbooks and Other Instructional Materials (School Year 2020-2021) Year and month in which data were collected: August 2018
Subject Textbooks and Other Instructional
Materials/year of Adoption
From Most Recent
Adoption?
Percent Students Lacking Own
Assigned Copy
Reading/Language Arts Prentice-Hall Literature - Timeless Voices, Timeless Themes: Gold Level (9th grade & 10th grade) Prentice-Hall - Writing and Grammar (11th grade and 10thgrade) Prentice-Hall Literature - Timeless Voices, Timeless Themes: Platinum Level (11th grade) Prentice-Hall Literature - Timeless Voices, Timeless Themes: The American Experience (12th grade) Non Fiction and Fiction literature
Yes 0.00 %
Mathematics Carnegie - Integrated Math I Carnegie - Integrated Math II Odysseyware Mathematics
Yes 0.00 %
Science Prentice-Hall Biology Life Science with online resources Prentice-Hall Earth Science with online resources
Yes 0.00 %
History-Social Science Prentice-Hall Macgruder's 2006 American Government, California edition Prentice-Hall Economics in Action Prentice-Hall The Modern World Prentice-Hall Modern America West Educational Publishing Street Law, A Course in PracticalLaw 7th Edition
Yes 0.00 %
Note: Cells with N/A values do not require data.

2019-20 School Accountability Report Card for Maine Prairie High (Continuation) Page 5 of 12
School Facility Conditions and Planned Improvements
Maine Prairie High school meets or exceeds all state requirements on a school facility. The Dixon Unified School District along with North Bay Insurance performs yearly safety inspections with the purpose of identifying and correcting any and all safety issues and concerns. MPHS is an all portable campus, 8 portables in total. The portables are old but in adequate condition for students. The campus is clean and safe. A work order process is used to ensure efficient service and that emergency repairs are given the highest priority. All HVAC units undergo regular maintenance and cleaning. All classrooms currently have W IFI capabilities. Above and beyond the daily cleaning maintenance performed by custodial staff, the district schedules thorough cleaning of classrooms on a regular basis. There are no scheduled facility improvements.
School Facility Good Repair Status Using the most recently collected FIT data (or equivalent), provide the following:
• Determination of repair status for systems listed • Description of any needed maintenance to ensure good repair • The year and month in which the data were collected • The rate for each system inspected • The overall rating
Year and month of the most recent FIT report: August 2020
System Inspected Rating Repair Needed and Action Taken or Planned
Systems: Gas Leaks, Mechanical/HVAC, Sewer
XGood
Interior: Interior Surfaces XPoor
The District has completed a Facilities Needs Assessment and has passed A General Obligation Facility Improvement Bond. Over the next few years, the District will be engaged in several modernization projects.
Cleanliness: Overall Cleanliness, Pest/ Vermin Infestation
XGood
Electrical: Electrical XPoor
The District has completed a Facilities Needs Assessment and has passed A General Obligation Facility Improvement Bond. Over the next few years, the District will be engaged in several modernization projects.
Restrooms/Fountains: Restrooms, Sinks/ Fountains
XPoor
The District has completed a Facilities Needs Assessment and has passed A General Obligation Facility Improvement Bond. Over the next few years, the District will be engaged in several modernization projects.
Safety: Fire Safety, Hazardous Materials
XGood
Structural: Structural Damage, Roofs
XFair
External: Playground/School Grounds, Windows/ Doors/Gates/Fences
XFair
Overall Rating XFair

2019-20 School Accountability Report Card for Maine Prairie High (Continuation) Page 6 of 12
B. Pupil Outcomes
State Priority: Pupil Achievement The SARC provides the following information relevant to the State priority: Pupil Achievement (Priority 4): • Statewide assessments (i.e., California Assessment of Student Performance and Progress [CAASPP] System, which
includes the Smarter Balanced Summative Assessments for students in the general education population and the California Alternate Assessments [CAAs] for English language arts/literacy [ELA] and mathematics given in grades three through eight and grade eleven. Only eligible students may participate in the administration of the CAAs. CAAs items are aligned with alternate achievement standards, which are linked with the Common Core State Standards [CCSS] for students with the most significant cognitive disabilities); and
• The percentage of students who have successfully completed courses that satisfy the requirements for entrance to the University of California and the California State University, or career technical education sequences or programs of study.
CAASPP Test Results in ELA and Mathematics for All Students Grades Three through Eight and Grade Eleven Percentage of Students Meeting or Exceeding the State Standard
Subject School
2018-19 School
2019-20 District 2018-19
District 2019-20
State 2018-19
State 2019-20
English Language Arts/Literacy (grades 3-8 and 11)
14 N/A 41 N/A 50 N/A
Mathematics (grades 3-8 and 11)
0 N/A 33 N/A 39 N/A
Note: Cells with N/A values do not require data. Note: The 2019-2020 data are not available. Due to the COVID-19 pandemic, Executive Order N-30-20 was issued which waived the requirement for statewide testing for the 2019-2020 school year. Note: Percentages are not calculated when the number of students tested is ten or less, either because the number of students in this category is too small for statistical accuracy or to protect student privacy. Note: ELA and mathematics test results include the Smarter Balanced Summative Assessment and the CAA. The “Percent Met or Exceeded” is calculated by taking the total number of students who met or exceeded the standard on the Smarter Balanced Summative Assessment plus the total number of students who met the standard (i.e., achieved Level 3-Alternate) on the CAAs divided by the total number of students who participated in both assessments.
CAASPP Test Results in ELA by Student Group Grades Three through Eight and Grade Eleven (School Year 2019-2020)
Student Group Total
Enrollment Number Tested
Percent Tested
Percent Not
Tested
Percent Met or
Exceeded
All Students N/A N/A N/A N/A N/A
Male N/A N/A N/A N/A N/A
Female N/A N/A N/A N/A N/A
Black or African American N/A N/A N/A N/A N/A
American Indian or Alaska Native N/A N/A N/A N/A N/A
Asian N/A N/A N/A N/A N/A
Filipino N/A N/A N/A N/A N/A
Hispanic or Latino N/A N/A N/A N/A N/A
Native Hawaiian or Pacific Islander N/A N/A N/A N/A N/A
White N/A N/A N/A N/A N/A

2019-20 School Accountability Report Card for Maine Prairie High (Continuation) Page 7 of 12
Student Group Total
Enrollment Number Tested
Percent Tested
Percent Not
Tested
Percent Met or
Exceeded
Two or More Races N/A N/A N/A N/A N/A
Socioeconomically Disadvantaged N/A N/A N/A N/A N/A
English Learners N/A N/A N/A N/A N/A
Students with Disabilities N/A N/A N/A N/A N/A
Students Receiving Migrant Education Services N/A N/A N/A N/A N/A
Foster Youth N/A N/A N/A N/A N/A
Homeless N/A N/A N/A N/A N/A
Note: Cells with N/A values do not require data. Note: The 2019-2020 data are not available. Due to the COVID-19 pandemic, Executive Order N-30-20 was issued which waived the requirement for statewide testing for the 2019-2020 school year.
CAASPP Test Results in Mathematics by Student Group Grades Three through Eight and Grade Eleven (School Year 2019-2020)
Student Group Total
Enrollment Number Tested
Percent Tested
Percent Not
Tested
Percent Met or
Exceeded
All Students N/A N/A N/A N/A N/A
Male N/A N/A N/A N/A N/A
Female N/A N/A N/A N/A N/A
Black or African American N/A N/A N/A N/A N/A
American Indian or Alaska Native N/A N/A N/A N/A N/A
Asian N/A N/A N/A N/A N/A
Filipino N/A N/A N/A N/A N/A
Hispanic or Latino N/A N/A N/A N/A N/A
Native Hawaiian or Pacific Islander N/A N/A N/A N/A N/A
White N/A N/A N/A N/A N/A
Two or More Races N/A N/A N/A N/A N/A
Socioeconomically Disadvantaged N/A N/A N/A N/A N/A
English Learners N/A N/A N/A N/A N/A
Students with Disabilities N/A N/A N/A N/A N/A
Students Receiving Migrant Education Services N/A N/A N/A N/A N/A
Foster Youth N/A N/A N/A N/A N/A
Homeless N/A N/A N/A N/A N/A
Note: Cells with N/A values do not require data. Note: The 2019-2020 data are not available. Due to the COVID-19 pandemic, Executive Order N-30-20 was issued which waived the requirement for statewide testing for the 2019-2020 school year.

2019-20 School Accountability Report Card for Maine Prairie High (Continuation) Page 8 of 12
CAASPP Test Results in Science for All Students Grades Five, Eight, and High School Percentage of Students Meeting or Exceeding the State Standard
Subject School
2018-19 School
2019-20 District 2018-19
District 2019-20
State 2018-19
State 2019-20
Science (grades 5, 8 and high school) 2 N/A 23 N/A 30 N/A Note: Cells with N/A values do not require data. Note: The 2019-2020 data are not available. Due to the COVID-19 pandemic, Executive Order N-30-20 was issued which waived the requirement for statewide testing for the 2019-2020 school year. Note: The new California Science Test (CAST) was first administered operationally in the 2018-2019 school year.
CAASPP Test Results in Science by Student Group Grades Three through Eight and Grade Eleven (School Year 2019-2020)
Student Group Total
Enrollment Number Tested
Percent Tested
Percent Not
Tested
Percent Met or
Exceeded
All Students N/A N/A N/A N/A N/A
Male N/A N/A N/A N/A N/A
Female N/A N/A N/A N/A N/A
Black or African American N/A N/A N/A N/A N/A
American Indian or Alaska Native N/A N/A N/A N/A N/A
Asian N/A N/A N/A N/A N/A
Filipino N/A N/A N/A N/A N/A
Hispanic or Latino N/A N/A N/A N/A N/A
Native Hawaiian or Pacific Islander N/A N/A N/A N/A N/A
White N/A N/A N/A N/A N/A
Two or More Races N/A N/A N/A N/A N/A
Socioeconomically Disadvantaged N/A N/A N/A N/A N/A
English Learners N/A N/A N/A N/A N/A
Students with Disabilities N/A N/A N/A N/A N/A
Students Receiving Migrant Education Services N/A N/A N/A N/A N/A
Foster Youth N/A N/A N/A N/A N/A
Homeless N/A N/A N/A N/A N/A
Note: Cells with N/A values do not require data. Note: The 2019-2020 data are not available. Due to the COVID-19 pandemic, Executive Order N-30-20 was issued which waived the requirement for statewide testing for the 2019-2020 school year.

2019-20 School Accountability Report Card for Maine Prairie High (Continuation) Page 9 of 12
Career Technical Education Programs (School Year 2019-2020)
Career Technical Education Programs are a challenge on the alternative education site. Currently, service organizations are working with students in a variety of career related after school activities. The site utilizes Odysseware, and online educational program to provide students with CTE courses. During school closure and distance learning students are eligible for work experience credit.
Courses for University of California (UC) and/or California State University (CSU) Admission
UC/CSU Course Measure Percent
2019-20 Pupils Enrolled in Courses Required for UC/CSU Admission 67.78
2018-19 Graduates Who Completed All Courses Required for UC/CSU Admission 0
State Priority: Other Pupil Outcomes The SARC provides the following information relevant to the State priority: Other Pupil Outcomes (Priority 8): • Pupil outcomes in the subject areas of physical education.
California Physical Fitness Test Results (School Year 2019-2020)
Grade Level Percentage of Students
Meeting Four of Six Fitness Standards
Percentage of Students Meeting Five of Six Fitness Standards
Percentage of Students Meeting Six of Six Fitness Standards
5 N/A N/A N/A
7 N/A N/A N/A
9 N/A N/A N/A Note: Cells with N/A values do not require data. Note: The 2019–2020 data are not available. Due to the COVID-19 pandemic, Executive Order N-56-20 was issued which waived the requirement to administer the physical fitness performance test for the 2019–2020 school year.
C. Engagement
State Priority: Parental Involvement The SARC provides the following information relevant to the State priority: Parental Involvement (Priority 3): • Efforts the school district makes to seek parent input in making decisions for the school district and each school site
Opportunities for Parental Involvement (School Year 2020-2021)
Parents and guardians are always welcome on the Maine Prairie High School campus. All incoming students are required to meet with the Principal before their first day of attendance. Parent conferences, back to school night, open house, ELAC, and quarterly newsletters are just a few ways parents can engage with the school. Parents are invited to all school-wide celebratory events. W e are fortunate to have a parent liaison to assist parents with their student’s school journey. The parent liaison can be reached at 707-693-6340.

2019-20 School Accountability Report Card for Maine Prairie High (Continuation) Page 10 of 12
State Priority: Pupil Engagement The SARC provides the following information relevant to the State priority: Pupil Engagement (Priority 5): • High school dropout rates; and • High school graduation rates.
Dropout Rate and Graduation Rate (Four-Year Cohort Rate)
Indicator School
2016-17 School
2017-18 School
2018-19 District 2016-17
District 2017-18
District 2018-19
State 2016-17
State 2017-18
State 2018-19
Dropout Rate 51.2 41.2 46.2 12.3 13 13.1 9.1 9.6 9
Graduation Rate 17.1 27.5 28.8 83.3 80.5 82.5 82.7 83 84.5
State Priority: School Climate The SARC provides the following information relevant to the State priority: School Climate (Priority 6): • Pupil suspension rates; • Pupil expulsion rates; and • Other local measures on the sense of safety.
Suspensions and Expulsions (data collected between July through June, each full school year respectively)
Rate School
2017-18 School
2018-19 District 2017-18
District 2018-19
State 2017-18
State 2018-19
Suspensions 18.2 7.3 6.9 6.7 3.5 3.5
Expulsions 0.0 0.0 0.1 0.1 0.1 0.1
Suspensions and Expulsions for School Year 2019-2020 Only (data collected between July through February, partial school year due to the COVID-19 pandemic)
Rate School
2019-20 District 2019-20
State 2019-20
Suspensions 0.1 0.0 2.5
Expulsions 0.0 0.0 0.1 Note: The 2019-2020 suspensions and expulsions rate data are not comparable to prior year data because the 2019-2020 school year is a partial school year due to the COVID-19 crisis. As such, it would be inappropriate to make any comparisons in rates of suspensions and expulsions in the 2019-2020 school year compared to prior years.
School Safety Plan (School Year 2020-2021)
The safety of students and staff is a primary concern of MPHS. The School Safety plan was evaluated in September 2016 and revised in November 2016. The school safety plan is reviewed annually with all faculty and staff. Faculty and staff have been informed of the updates. Key elements of the safety plan include the school's physical environment, social environment, cultural environment, and the emergency response team. MPHS maintains a disaster preparedness plan and a crisis intervention plan which lays out steps that are to be taken to ensure student and staff safety during a disaster or crisis. The school is in compliance with all laws, rules, and regulations pertinent to hazardous materials and state earthquake standards. Fire, disaster, lockdown, intruder drills are conducted on a regular basis throughout the school year. Students are supervised throughout the day. All visitors are required to sign in at the school office and receive a visitor badge.

2019-20 School Accountability Report Card for Maine Prairie High (Continuation) Page 11 of 12
Average Class Size and Class Size Distribution (Secondary)
Subject
2017-18 Average
Class Size
2017-18 # of
Classes* Size 1-20
2017-18 # of
Classes* Size
21-32
2017-18 # of
Classes* Size 33+
2018-19 Average
Class Size
2018-19 # of
Classes* Size 1-20
2018-19 # of
Classes* Size
21-32
2018-19 # of
Classes* Size 33+
2019-20 Average
Class Size
2019-20 # of
Classes* Size 1-20
2019-20 # of
Classes* Size
21-32
2019-20 # of
Classes* Size 33+
English Language Arts
20 2 2 22 2 2 21 4 1
Mathematics 17 3 1 15 3 18 5
Science 15 3 15 3 19 3
Social Science 17 4 1 19 3 2 20 2 1
*Number of classes indicates how many classrooms fall into each size category (a range of total students per classroom). At the secondary school level, this information is reported by subject area rather than grade level.
Ratio of Pupils to Academic Counselor (School Year 2019-2020)
Title Ratio
Academic Counselors* 100 *One full time equivalent (FTE) equals one staff member working full time; one FTE could also represent two staff members who each work 50 percent of full time.
Student Support Services Staff (School Year 2019-2020)
Title Number of FTE*
Assigned to School
Counselor (Academic, Social/Behavioral or Career Development) 0.9
Library Media Teacher (Librarian)
Library Media Services Staff (Paraprofessional)
Psychologist
Social Worker
Nurse
Speech/Language/Hearing Specialist
Resource Specialist (non-teaching)
Other *One Full Time Equivalent (FTE) equals one staff member working full time; one FTE could also represent two staff members who each work 50 percent of full time.
Expenditures Per Pupil and School Site Teacher Salaries (Fiscal Year 2018-2019)
Level Total
Expenditures Per Pupil
Expenditures Per Pupil
(Restricted)
Expenditures Per Pupil
(Unrestricted)
Average Teacher Salary
School Site $10,686.00 $1,349.00 $9,337.00 $57,999.00
District N/A N/A $8,559.00 $62,062.00
Percent Difference - School Site and District N/A N/A
State N/A N/A $7,750.00 $75,706.00
Percent Difference - School Site and State N/A N/A Note: Cells with N/A values do not require data.

2019-20 School Accountability Report Card for Maine Prairie High (Continuation) Page 12 of 12
Types of Services Funded (Fiscal Year 2019-2020)
MPHS has a variety of services available to our scholars. Our counselor, mental health clinician, and parent liaison work tirelessly to support and guide students and their families. Vocational specialists and the State Department of Vocational Rehabilitation support our students with disabilities. The faculty and staff work with all students to secure appropriate resources to meet student needs. The community of Dixon also provides support to our scholars.
Teacher and Administrative Salaries (Fiscal Year 2018-2019)
Category District Amount
State Average For Districts
In Same Category
Beginning Teacher Salary $42,974 $47,145
Mid-Range Teacher Salary $64,867 $74,952
Highest Teacher Salary $86,402 $96,092
Average Principal Salary (Elementary) $102,491 $116,716
Average Principal Salary (Middle) $110,987 $120,813
Average Principal Salary (High) $114,458 $131,905
Superintendent Salary $187,101 $192,565
Percent of Budget for Teacher Salaries 32.0 31.0
Percent of Budget for Administrative Salaries 6.0 6.0 For detailed information on salaries, see the CDE Certificated Salaries & Benefits web page at https://www.cde.ca.gov/ds/fd/cs/.
Professional Development (Most Recent Three Years)
Measure 2018-19 2019-20 2020-21
Number of school days dedicated to Staff Development and Continuous Improvement 34 34 21
MPHS is a comprehensive support and improvement (CSI) due to graduation rates. The primary focus for staff development is AVID. Our staff attended the summer institute in 2020 and the ongoing workshops provided by AVID.

2019-20 School Accountability Report Card for Tremont Elementary Page 1 of 12
Tremont Elementary
School Accountability Report Card
Reported Using Data from the 2019-2020 School Year
Published During 2020-2021
By February 1 of each year, every school in California is required by state law to publish a School Accountability Report Card (SARC). The SARC contains information about the condition and performance of each California public school. Under the Local Control Funding Formula (LCFF) all local educational agencies (LEAs) are required to prepare a Local Control and Accountability Plan (LCAP), which describes how they intend to meet annual school-specific goals for all pupils, with specific activities to address state and local priorities. Additionally, data reported in an LCAP is to be consistent with data reported in the SARC.
• For more information about SARC requirements and access to prior year reports, see the California Department of Education (CDE) SARC web page at https://www.cde.ca.gov/ta/ac/sa/.
• For more information about the LCFF or the LCAP, see the CDE LCFF webpage at https://www.cde.ca.gov/fg/aa/lc/.
• For additional information about the school, parents/guardians and community members should contact the school principal or the district office.
DataQuest DataQuest is an online data tool located on the CDE DataQuest web page at https://dq.cde.ca.gov/dataquest/ that contains additional information about this school and comparisons of the school to the district and the county. Specifically, DataQuest is a dynamic system that provides reports for accountability (e.g., test data, enrollment, high school graduates, dropouts, course enrollments, staffing, and data regarding English learners). California School Dashboard The California School Dashboard (Dashboard) https://www.caschooldashboard.org/ reflects California’s new accountability and continuous improvement system and provides information about how LEAs and schools are meeting the needs of California’s diverse student population. The Dashboard contains reports that display the performance of LEAs, schools, and student groups on a set of state and local measures to assist in identifying strengths, challenges, and areas in need of improvement.
About This School
School Contact Information (School Year 2020-2021)
Entity Contact Information
School Name Tremont Elementary
Street 355 Pheasant Run Dr.
City, State, Zip Dixon, Ca, 95620-4219
Phone Number 707-693-6320
Principal Tori Peterson, Principal
Email Address [email protected]
Website http://tremont.dixonusd.org/
County-District-School (CDS) Code 48705326110282

2019-20 School Accountability Report Card for Tremont Elementary Page 2 of 12
District Contact Information (School Year 2020-2021)
Entity Contact Information
District Name Dixon Unified School District
Phone Number (707) 693-6300
Superintendent Brian Dolan
Email Address [email protected]
Website www.dixonusd.org
School Description and Mission Statement (School Year 2020-2021)
Dixon Unified School District is comprised of 3 Elementary Schools, 1 Middle School, 1 High School, and an Alternative High School. Tremont's population is approximately 391 student’s kindergarten through 5th grade. Tremont Elementary School promotes high academic success through high expectations and rigorous academic instruction. Tremont encourages active student engagement by providing each student with a diverse education in a safe, supportive, nurturing environment that promotes self-discipline, motivation, and excellence in learning. The Tremont team joins the parents and community to assist the students in developing 21st-century skills to become independent and self-sufficient life-long learners who will succeed and contribute responsibly in a global society. Staff members and parents participate on various committees that make decisions regarding the priorities and direction of the educational plan to ensure instructional programs are consistent with students' needs and comply with district goals. Leadership teams include the School Site Council (SSC), English Learner Advisory Council (ELAC) and Local Control Accountability Plan (LCAP). We strive to meet the needs of each of our students by adhering to the District's core vision and beliefs, which serves as guiding principles for site-level planning. The guiding core vision is: Plan and act to meet our students’ needs first, engage students in learning through innovative and effective instruction, invest in the growth and development of our staff, support learning through modern technology and safe facilities, and ensure on-going, measurable improvement through collaborations. All of these are the foundation of the district vision of: To close the achievement gap by preparing all students for college and career readiness and success in a global society. Tremont’s Vision is to provide a strong sense of community. About Our School The purpose of the California Dashboard is to provide students and parents with information about our school’s instructional programs, academic achievement, student activities, materials and facilities, and staff. Information about our district, Dixon Unified School District, is also provided. Parents and the community play an important role in our school by volunteering in the classroom, contributing to fundraisers, and supporting the school programs. The school staff strives to inform the community about the school’s educational program, student achievement, and extracurricular activities. W e value: Students – first in everything we do Community – meaningful and supportive relationships Collaboration – essential to student success Respect – for each and every one Achievement – high expectations improve performance

2019-20 School Accountability Report Card for Tremont Elementary Page 3 of 12
We Believe...
• All students can learn. • Students are our first priority. • Students benefit from family and community support. • All people have worth. • High expectations improve performance
Student Enrollment by Grade Level (School Year 2019-2020)
Grade Level Number of Students
Kindergarten 53
Grade 1 66
Grade 2 75
Grade 3 68
Grade 4 70
Grade 5 82
Total Enrollment 414
Student Enrollment by Student Group (School Year 2019-2020)
Student Group Percent of Total Enrollment
Black or African American 2.2
Asian 1.4
Filipino 1.2
Hispanic or Latino 51.4
White 35.5
Two or More Races 4.6
Socioeconomically Disadvantaged 51.2
English Learners 16.7
Students with Disabilities 19.1
Foster Youth 0.5
Homeless 1.9
A. Conditions of Learning
State Priority: Basic The SARC provides the following information relevant to the State priority: Basic (Priority 1):
• Degree to which teachers are appropriately assigned and fully credentialed in the subject area and for the pupils they are teaching;
• Pupils have access to standards-aligned instructional materials; and • School facilities are maintained in good repair

2019-20 School Accountability Report Card for Tremont Elementary Page 4 of 12
Teacher Credentials
Teachers School
2018-19 School
2019-20 School
2020-21 District 2020-21
With Full Credential 23 22 22 144
Without Full Credential 2 2 1 7
Teaching Outside Subject Area of Competence (with full credential) 1 0 0 3
Teacher Misassignments and Vacant Teacher Positions
Indicator 2018-19 2019-20 2020-21
Misassignments of Teachers of English Learners 0 0 0
Total Teacher Misassignments* 0 0 0
Vacant Teacher Positions 0 0 1 Note: “Misassignments” refers to the number of positions filled by teachers who lack legal authorization to teach that grade level, subject area, student group, etc. *Total Teacher Misassignments includes the number of Misassignments of Teachers of English Learners.
Quality, Currency, Availability of Textbooks and Other Instructional Materials (School Year 2020-2021) Year and month in which data were collected: August 2019
Subject Textbooks and Other Instructional
Materials/year of Adoption
From Most Recent
Adoption?
Percent Students Lacking Own
Assigned Copy
Reading/Language Arts California National Geographic Reach for Reading (Kindergarten - 1st grade) (Adopted 2017) Benchmark Advance (2nd - 5th grade) (Adopted 2017)
Yes 0.00 %
Mathematics Houghton Mifflin Harcourt - California Go Math (Adopted 2015)
Yes 0.00 %
Science Harcourt - California Science Yes 0.00 %
History-Social Science Pearson Scott Foresman - History-Social Science For California
Yes 0.00 %
Note: Cells with N/A values do not require data.

2019-20 School Accountability Report Card for Tremont Elementary Page 5 of 12
School Facility Conditions and Planned Improvements
Tremont is a 29-year-old school that meets all state requirements for school facilities. The campus currently contains 35 portable classrooms, a multipurpose room, library, black top area and grass field for activities, two play structures, and an administration office. 100% of our bathrooms are in working order. The Dixon Unified School District along with North Bay Schools Insurance performs yearly safety inspections with the purpose of identifying and correcting any and all safety issues and concerns. A work order process is used to ensure efficient service and that emergency repairs are given the highest priority. All HVAC units undergo regular maintenance and cleaning. All classrooms currently have W IFI capabilities. Above and beyond the daily cleaning maintenance performed by custodial staff, the district schedules thorough cleaning of classrooms on a regular basis. The front office is projected to undergo a reconfiguration during the summer of 2021, to allow the campus to be secure during school hours, and force all visitor traffic to check in with the front office.
School Facility Good Repair Status Using the most recently collected FIT data (or equivalent), provide the following:
• Determination of repair status for systems listed • Description of any needed maintenance to ensure good repair • The year and month in which the data were collected • The rate for each system inspected • The overall rating
Year and month of the most recent FIT report: August 2020
System Inspected Rating Repair Needed and Action Taken or Planned
Systems: Gas Leaks, Mechanical/HVAC, Sewer
XGood
Interior: Interior Surfaces XPoor
The District has completed a Facilities Needs Assessment and has passed A General Obligation Facility Improvement Bond. Over the next few years, the District will be engaged in several modernization projects.
Cleanliness: Overall Cleanliness, Pest/ Vermin Infestation
XGood
Electrical: Electrical XFair
Restrooms/Fountains: Restrooms, Sinks/ Fountains
XFair
Safety: Fire Safety, Hazardous Materials
XGood
Structural: Structural Damage, Roofs
XFair
External: Playground/School Grounds, Windows/ Doors/Gates/Fences
XFair
Overall Rating XFair

2019-20 School Accountability Report Card for Tremont Elementary Page 6 of 12
B. Pupil Outcomes
State Priority: Pupil Achievement The SARC provides the following information relevant to the State priority: Pupil Achievement (Priority 4): • Statewide assessments (i.e., California Assessment of Student Performance and Progress [CAASPP] System, which
includes the Smarter Balanced Summative Assessments for students in the general education population and the California Alternate Assessments [CAAs] for English language arts/literacy [ELA] and mathematics given in grades three through eight and grade eleven. Only eligible students may participate in the administration of the CAAs. CAAs items are aligned with alternate achievement standards, which are linked with the Common Core State Standards [CCSS] for students with the most significant cognitive disabilities); and
• The percentage of students who have successfully completed courses that satisfy the requirements for entrance to the University of California and the California State University, or career technical education sequences or programs of study.
CAASPP Test Results in ELA and Mathematics for All Students Grades Three through Eight and Grade Eleven Percentage of Students Meeting or Exceeding the State Standard
Subject School
2018-19 School
2019-20 District 2018-19
District 2019-20
State 2018-19
State 2019-20
English Language Arts/Literacy (grades 3-8 and 11)
51 N/A 41 N/A 50 N/A
Mathematics (grades 3-8 and 11)
43 N/A 33 N/A 39 N/A
Note: Cells with N/A values do not require data. Note: The 2019-2020 data are not available. Due to the COVID-19 pandemic, Executive Order N-30-20 was issued which waived the requirement for statewide testing for the 2019-2020 school year. Note: Percentages are not calculated when the number of students tested is ten or less, either because the number of students in this category is too small for statistical accuracy or to protect student privacy. Note: ELA and mathematics test results include the Smarter Balanced Summative Assessment and the CAA. The “Percent Met or Exceeded” is calculated by taking the total number of students who met or exceeded the standard on the Smarter Balanced Summative Assessment plus the total number of students who met the standard (i.e., achieved Level 3-Alternate) on the CAAs divided by the total number of students who participated in both assessments.
CAASPP Test Results in ELA by Student Group Grades Three through Eight and Grade Eleven (School Year 2019-2020)
Student Group Total
Enrollment Number Tested
Percent Tested
Percent Not
Tested
Percent Met or
Exceeded
All Students N/A N/A N/A N/A N/A
Male N/A N/A N/A N/A N/A
Female N/A N/A N/A N/A N/A
Black or African American N/A N/A N/A N/A N/A
American Indian or Alaska Native N/A N/A N/A N/A N/A
Asian N/A N/A N/A N/A N/A
Filipino N/A N/A N/A N/A N/A
Hispanic or Latino N/A N/A N/A N/A N/A
Native Hawaiian or Pacific Islander N/A N/A N/A N/A N/A
White N/A N/A N/A N/A N/A

2019-20 School Accountability Report Card for Tremont Elementary Page 7 of 12
Student Group Total
Enrollment Number Tested
Percent Tested
Percent Not
Tested
Percent Met or
Exceeded
Two or More Races N/A N/A N/A N/A N/A
Socioeconomically Disadvantaged N/A N/A N/A N/A N/A
English Learners N/A N/A N/A N/A N/A
Students with Disabilities N/A N/A N/A N/A N/A
Students Receiving Migrant Education Services N/A N/A N/A N/A N/A
Foster Youth N/A N/A N/A N/A N/A
Homeless N/A N/A N/A N/A N/A
Note: Cells with N/A values do not require data. Note: The 2019-2020 data are not available. Due to the COVID-19 pandemic, Executive Order N-30-20 was issued which waived the requirement for statewide testing for the 2019-2020 school year.
CAASPP Test Results in Mathematics by Student Group Grades Three through Eight and Grade Eleven (School Year 2019-2020)
Student Group Total
Enrollment Number Tested
Percent Tested
Percent Not
Tested
Percent Met or
Exceeded
All Students N/A N/A N/A N/A N/A
Male N/A N/A N/A N/A N/A
Female N/A N/A N/A N/A N/A
Black or African American N/A N/A N/A N/A N/A
American Indian or Alaska Native N/A N/A N/A N/A N/A
Asian N/A N/A N/A N/A N/A
Filipino N/A N/A N/A N/A N/A
Hispanic or Latino N/A N/A N/A N/A N/A
Native Hawaiian or Pacific Islander N/A N/A N/A N/A N/A
White N/A N/A N/A N/A N/A
Two or More Races N/A N/A N/A N/A N/A
Socioeconomically Disadvantaged N/A N/A N/A N/A N/A
English Learners N/A N/A N/A N/A N/A
Students with Disabilities N/A N/A N/A N/A N/A
Students Receiving Migrant Education Services N/A N/A N/A N/A N/A
Foster Youth N/A N/A N/A N/A N/A
Homeless N/A N/A N/A N/A N/A
Note: Cells with N/A values do not require data. Note: The 2019-2020 data are not available. Due to the COVID-19 pandemic, Executive Order N-30-20 was issued which waived the requirement for statewide testing for the 2019-2020 school year.

2019-20 School Accountability Report Card for Tremont Elementary Page 8 of 12
CAASPP Test Results in Science for All Students Grades Five, Eight, and High School Percentage of Students Meeting or Exceeding the State Standard
Subject School
2018-19 School
2019-20 District 2018-19
District 2019-20
State 2018-19
State 2019-20
Science (grades 5, 8 and high school) 25 N/A 23 N/A 30 N/A Note: Cells with N/A values do not require data. Note: The 2019-2020 data are not available. Due to the COVID-19 pandemic, Executive Order N-30-20 was issued which waived the requirement for statewide testing for the 2019-2020 school year. Note: The new California Science Test (CAST) was first administered operationally in the 2018-2019 school year.
State Priority: Other Pupil Outcomes The SARC provides the following information relevant to the State priority: Other Pupil Outcomes (Priority 8): • Pupil outcomes in the subject areas of physical education.
California Physical Fitness Test Results (School Year 2019-2020)
Grade Level Percentage of Students
Meeting Four of Six Fitness Standards
Percentage of Students Meeting Five of Six Fitness Standards
Percentage of Students Meeting Six of Six Fitness Standards
5 N/A N/A N/A
7 N/A N/A N/A
9 N/A N/A N/A Note: Cells with N/A values do not require data. Note: The 2019–2020 data are not available. Due to the COVID-19 pandemic, Executive Order N-56-20 was issued which waived the requirement to administer the physical fitness performance test for the 2019–2020 school year.
C. Engagement
State Priority: Parental Involvement The SARC provides the following information relevant to the State priority: Parental Involvement (Priority 3): • Efforts the school district makes to seek parent input in making decisions for the school district and each school site
Opportunities for Parental Involvement (School Year 2020-2021)
Parents have numerous opportunities to participate in their children’s education. Our parents are very active; however, we continue to seek more ways to keep the lines of communication open. Tremont values and includes all stakeholders in the educational process. At school, parent participation is active and a key component of our culture. Family members contribute to the Tremont community in many ways, including volunteering in the classroom, attending parent education classes, organizing and assisting in daily school activities, and participating in committees. The School Site Council (SSC) and Teacher Parents Organization (TPO) invite parent/guardian involvement in school planning and activities. School Site Council Committee (SSC) help plan and evaluate the overall school program and approval of yearly budget expenditures. The English Language Advisory Committee (ELAC) assists in assessing the needs of and offering support to English Learners. The Teacher-Parent Organization raises money for the school to use each year. Family volunteers staff other school-wide events such as book fairs, movie nights, holiday parties, festivals, and school beautification efforts. W eekly newsletters ensure that parents/guardians are informed about curriculum, activities, and functions at Tremont. Parents are also encouraged to participate in the Local Control Accountability Plan (LCAP) district committee to help plan and evaluate local school funding.

2019-20 School Accountability Report Card for Tremont Elementary Page 9 of 12
State Priority: School Climate The SARC provides the following information relevant to the State priority: School Climate (Priority 6): • Pupil suspension rates; • Pupil expulsion rates; and • Other local measures on the sense of safety.
Suspensions and Expulsions (data collected between July through June, each full school year respectively)
Rate School
2017-18 School
2018-19 District 2017-18
District 2018-19
State 2017-18
State 2018-19
Suspensions 1.6 1.9 6.9 6.7 3.5 3.5
Expulsions 0.0 0.0 0.1 0.1 0.1 0.1
Suspensions and Expulsions for School Year 2019-2020 Only (data collected between July through February, partial school year due to the COVID-19 pandemic)
Rate School
2019-20 District 2019-20
State 2019-20
Suspensions 0.0 0.0 2.5
Expulsions 0.0 0.0 0.1 Note: The 2019-2020 suspensions and expulsions rate data are not comparable to prior year data because the 2019-2020 school year is a partial school year due to the COVID-19 crisis. As such, it would be inappropriate to make any comparisons in rates of suspensions and expulsions in the 2019-2020 school year compared to prior years.
School Safety Plan (School Year 2020-2021)
Maintaining the safety and security of students and staff at Tremont Elementary School is a priority in our daily operations and long-term planning. W hen family members, volunteers, or representatives from outside agencies visit the campus, they first report to the office where they sign in and acquire a visitor badge. This protocol is encouraged with signage and reinforced by staff members. Students are supervised during all parts of their day. Certificated staff provides instruction and oversight during class time while classified staff supervises students during recess and lunch periods. The Comprehensive School Safety Plan is in compliance with Senate Bill 187. Yearly, the committee meets to review materials within this Safety Plan. In addition to an Incident Command structure, this document outlines responses to fires, floods, earthquakes, toxic spills, and campus intrusions. Specific instructions for staff and student responses are outlined in the plan. All staff and students practice fire drills monthly and lockdown drills at least four times a year to reinforce the procedures outlined in our Safety Plan. Should such a situation arise, school staff will remain on duty to ensure the welfare of all Tremont students until it is feasible and appropriate for parents and guardians to pick them up. The school maintains necessary first aid supplies in designated locations and these are inventoried and replaced each year

2019-20 School Accountability Report Card for Tremont Elementary Page 10 of 12
D. Other SARC Information
The information in this section is required to be in the SARC but is not included in the state priorities for LCFF.
Average Class Size and Class Size Distribution (Elementary)
Grade Level
2017-18 Average
Class Size
2017-18 # of
Classes* Size 1-20
2017-18 # of
Classes* Size
21-32
2017-18 # of
Classes* Size 33+
2018-19 Average
Class Size
2018-19 # of
Classes* Size 1-20
2018-19 # of
Classes* Size
21-32
2018-19 # of
Classes* Size 33+
2019-20 Average
Class Size
2019-20 # of
Classes* Size 1-20
2019-20 # of
Classes* Size
21-32
2019-20 # of
Classes* Size 33+
K
21 1 3 21 1 3 25 2
1
25 2 23 3 21 2 1
2
24 3 21 3 30 2 1
3
20 4 26 3 21 1 2
4
33 1 1 27 3 29 2
5
28 3 27 1 2 30 2
6
31 3
Other**
12 1 14 3 1 *Number of classes indicates how many classes fall into each size category (a range of total students per class). ** “Other” category is for multi-grade level classes.
Ratio of Pupils to Academic Counselor (School Year 2019-2020)
Title Ratio
Academic Counselors* 0 *One full time equivalent (FTE) equals one staff member working full time; one FTE could also represent two staff members who each work 50 percent of full time.
Student Support Services Staff (School Year 2019-2020)
Title Number of FTE*
Assigned to School
Counselor (Academic, Social/Behavioral or Career Development)
Library Media Teacher (Librarian)
Library Media Services Staff (Paraprofessional)
Psychologist
Social Worker
Nurse
Speech/Language/Hearing Specialist
Resource Specialist (non-teaching)
Other 0.4 *One Full Time Equivalent (FTE) equals one staff member working full time; one FTE could also represent two staff members who each work 50 percent of full time.

2019-20 School Accountability Report Card for Tremont Elementary Page 11 of 12
Expenditures Per Pupil and School Site Teacher Salaries (Fiscal Year 2018-2019)
Level Total
Expenditures Per Pupil
Expenditures Per Pupil
(Restricted)
Expenditures Per Pupil
(Unrestricted)
Average Teacher Salary
School Site $6,295.00 $769.00 $5,526.00 $59,743.00
District N/A N/A $8,559.00 $62,062.00
Percent Difference - School Site and District N/A N/A
State N/A N/A $7,750.00 $75,706.00
Percent Difference - School Site and State N/A N/A Note: Cells with N/A values do not require data.
Types of Services Funded (Fiscal Year 2019-2020)
Tremont Elementary receives Title I Funding and the School Site Council approved the School Plan for Student Achievement (SPSA) in August 2020. The SPSA included the following: funds to provide support through additional staff for Intervention and English Language Development instruction, Professional Development opportunities for staff, afterschool intervention tutoring, improvement of school climate and student behavior through Soul Shoppe and Positive Behavior Intervention and Supports (PBIS), Social-Emotional Learning (SEL) groups through Solano County Office of Education and supplementary materials and technology to provide additional support to the Common Core State Standards (CCSS). Our programs are adaptable to meet the needs of each child and student enrollment shifts as students achieve learning goals and others are identified to receive assistance.
Teacher and Administrative Salaries (Fiscal Year 2018-2019)
Category District Amount
State Average For Districts
In Same Category
Beginning Teacher Salary $42,974 $47,145
Mid-Range Teacher Salary $64,867 $74,952
Highest Teacher Salary $86,402 $96,092
Average Principal Salary (Elementary) $102,491 $116,716
Average Principal Salary (Middle) $110,987 $120,813
Average Principal Salary (High) $114,458 $131,905
Superintendent Salary $187,101 $192,565
Percent of Budget for Teacher Salaries 32.0 31.0
Percent of Budget for Administrative Salaries 6.0 6.0 For detailed information on salaries, see the CDE Certificated Salaries & Benefits web page at https://www.cde.ca.gov/ds/fd/cs/.

2019-20 School Accountability Report Card for Tremont Elementary Page 12 of 12
Professional Development (Most Recent Three Years)
Measure 2018-19 2019-20 2020-21
Number of school days dedicated to Staff Development and Continuous Improvement 46 21 42
Ongoing professional development of staff is an important part of improving our school programs and student achievement. Teachers have weekly collaboration time and at least 3 paid non-pupil professional development days throughout the school year and are encouraged to attend workshops and conferences both during the school year and during the summer months, paid for by DUSD. Professional Development at Tremont Elementary School is currently focused on: math instructional practices, supporting English Language Learners, AVID implementation of practices, Next Generation Science Standards (NGSS), classroom management strategies to increase student engagement, technology integration, and administering and using online Benchmark/ Math data to inform instruction using IO. These focus areas were selected in conjunction with the District's LCAP goals. All certificated and classified staff participate in trainings to support social-emotional learning and Positive Behavior Intervention and Supports. For certificated and classified, we emphasize instructional strategies for diverse learners with a wide range of abilities. The Dixon Unified School District is also involved in the Beginning Teacher Induction Program assigns new teachers with a mentor teacher. This program is a two-year mandatory program for all new beginning teachers. We understand the critical role that staff development plays in improving student achievement and we, as a community of learners, value learning at all levels.