lincoln elementary school school accountability report...
TRANSCRIPT
2015-16 School Accountability Report Card for Lincoln Elementary School Page 1 of 13
Lincoln Elementary School
School Accountability Report Card
Reported Using Data from the 2015-16 School Year
Published During 2016-17
By February 1 of each year, every school in California is required by state law to publish a School Accountability Report Card (SARC). The SARC contains information about the condition and performance of each California public school. Under the Local Control Funding Formula (LCFF) all local educational agencies (LEAs) are required to prepare a Local Control and Accountability Plan (LCAP), which describes how they intend to meet annual school-specific goals for all pupils, with specific activities to address state and local priorities. Additionally, data reported in an LCAP is to be consistent with data reported in the SARC. • For more information about SARC requirements, see the California Department of Education (CDE) SARC Web page at
http://www.cde.ca.gov/ta/ac/sa/. • For more information about the LCFF or LCAP, see the CDE LCFF Web page at http://www.cde.ca.gov/fg/aa/lc/. • For additional information about the school, parents/guardians and community members should contact the school principal or
the district office. DataQuest DataQuest is an online data tool located on the CDE DataQuest Web page at http://dq.cde.ca.gov/dataquest/ that contains additional information about this school and comparisons of the school to the district and the county. Specifically, DataQuest is a dynamic system that provides reports for accountability (e.g., test data, enrollment, high school graduates, dropouts, course enrollments, staffing, and data regarding English learners). Internet Access Internet access is available at public libraries and other locations that are publicly accessible (e.g., the California State Library). Access to the Internet at libraries and public locations is generally provided on a first-come, first-served basis. Other use restrictions may include the hours of operation, the length of time that a workstation may be used (depending on availability), the types of software programs available on a workstation, and the ability to print documents.
About This School Contact Information (School Year 2016-17)
School Contact Information
School Name------- Lincoln Elementary School
Street------- 6910 N. Gettysburg Place
City, State, Zip------- Stockton, CA, 95207-2513
Phone Number------- (209) 953-8652
Principal------- Logan Williams
E-mail Address------- [email protected]
Web Site------- http://le.lusd.net/
CDS Code 39685696041917
2015-16 School Accountability Report Card for Lincoln Elementary School Page 2 of 13
District Contact Information
District Name------- Lincoln Unified School District
Phone Number------- 209-953-8700
Superintendent-------
Thomas Uslan
E-mail Address------- [email protected]
Web Site------- www.lusd.net
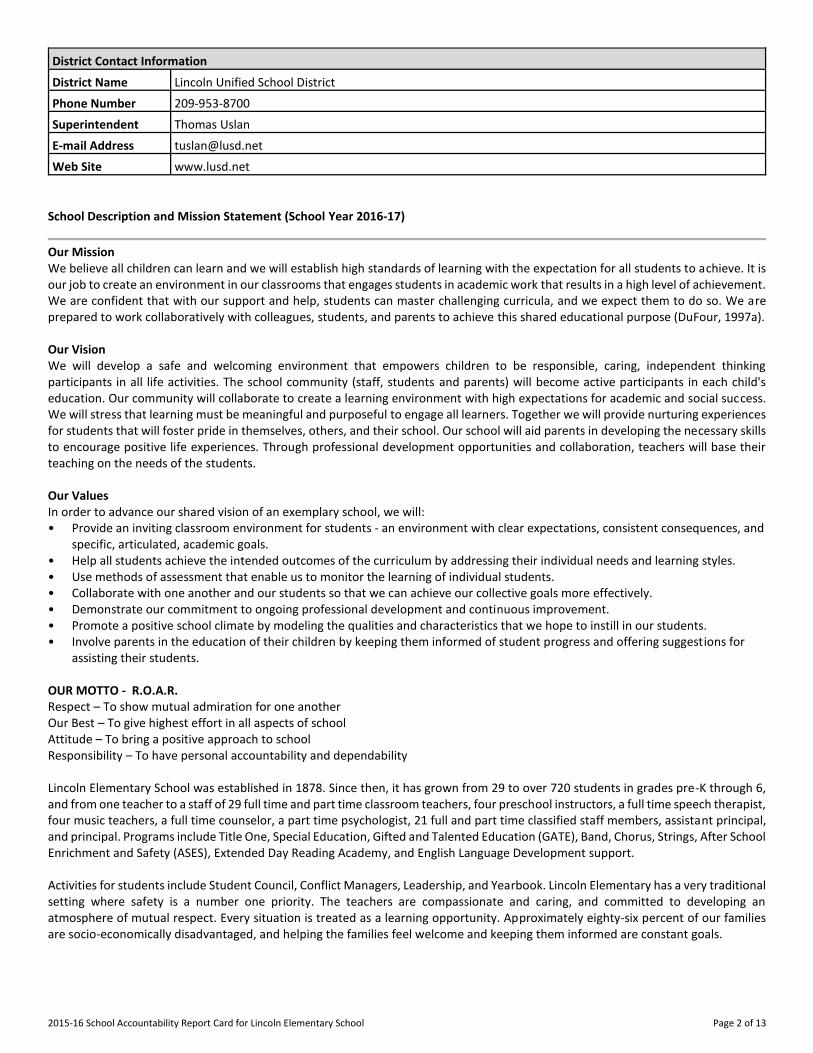
School Description and Mission Statement (School Year 2016-17)
Our Mission We believe all children can learn and we will establish high standards of learning with the expectation for all students to achieve. It is our job to create an environment in our classrooms that engages students in academic work that results in a high level of achievement. We are confident that with our support and help, students can master challenging curricula, and we expect them to do so. We are prepared to work collaboratively with colleagues, students, and parents to achieve this shared educational purpose (DuFour, 1997a). Our Vision We will develop a safe and welcoming environment that empowers children to be responsible, caring, independent thinking participants in all life activities. The school community (staff, students and parents) will become active participants in each child's education. Our community will collaborate to create a learning environment with high expectations for academic and social success. We will stress that learning must be meaningful and purposeful to engage all learners. Together we will provide nurturing experiences for students that will foster pride in themselves, others, and their school. Our school will aid parents in developing the necessary skills to encourage positive life experiences. Through professional development opportunities and collaboration, teachers will base their teaching on the needs of the students. Our Values In order to advance our shared vision of an exemplary school, we will: • Provide an inviting classroom environment for students - an environment with clear expectations, consistent consequences, and
specific, articulated, academic goals. • Help all students achieve the intended outcomes of the curriculum by addressing their individual needs and learning styles. • Use methods of assessment that enable us to monitor the learning of individual students. • Collaborate with one another and our students so that we can achieve our collective goals more effectively. • Demonstrate our commitment to ongoing professional development and continuous improvement. • Promote a positive school climate by modeling the qualities and characteristics that we hope to instill in our students. • Involve parents in the education of their children by keeping them informed of student progress and offering suggestions for
assisting their students. OUR MOTTO - R.O.A.R. Respect – To show mutual admiration for one another Our Best – To give highest effort in all aspects of school Attitude – To bring a positive approach to school Responsibility – To have personal accountability and dependability Lincoln Elementary School was established in 1878. Since then, it has grown from 29 to over 720 students in grades pre-K through 6, and from one teacher to a staff of 29 full time and part time classroom teachers, four preschool instructors, a full time speech therapist, four music teachers, a full time counselor, a part time psychologist, 21 full and part time classified staff members, assistant principal, and principal. Programs include Title One, Special Education, Gifted and Talented Education (GATE), Band, Chorus, Strings, After School Enrichment and Safety (ASES), Extended Day Reading Academy, and English Language Development support. Activities for students include Student Council, Conflict Managers, Leadership, and Yearbook. Lincoln Elementary has a very traditional setting where safety is a number one priority. The teachers are compassionate and caring, and committed to developing an atmosphere of mutual respect. Every situation is treated as a learning opportunity. Approximately eighty-six percent of our families are socio-economically disadvantaged, and helping the families feel welcome and keeping them informed are constant goals.
2015-16 School Accountability Report Card for Lincoln Elementary School Page 3 of 13
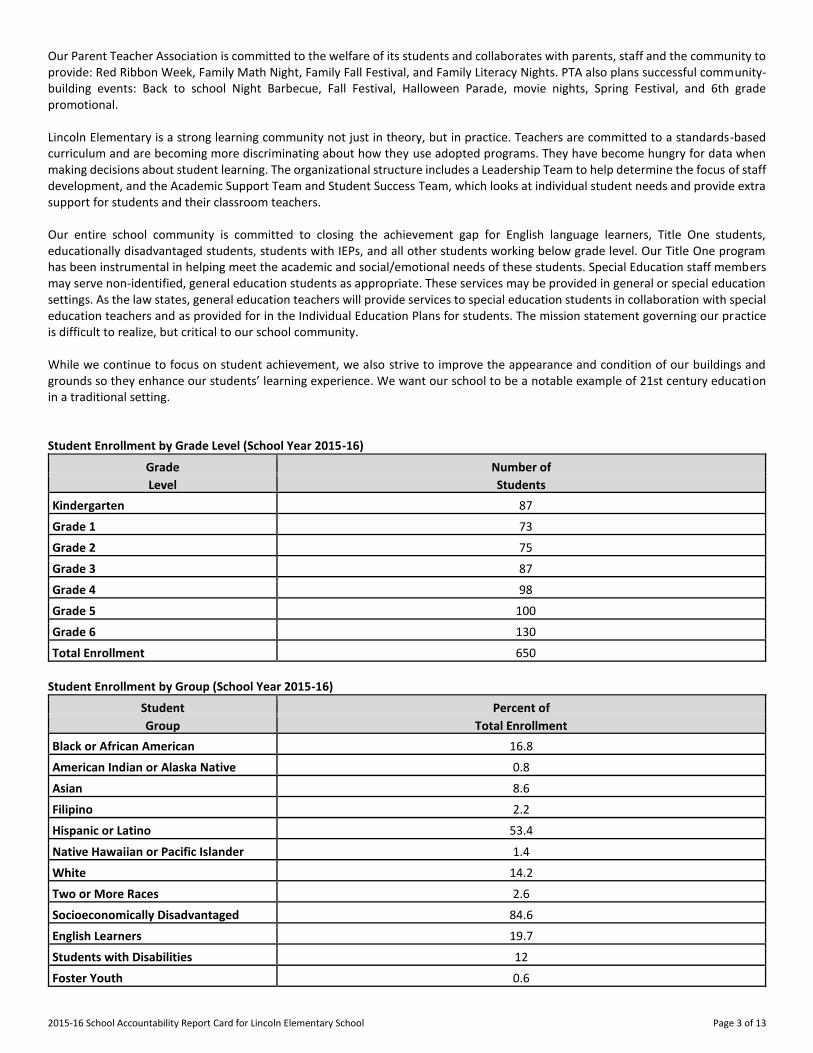
Our Parent Teacher Association is committed to the welfare of its students and collaborates with parents, staff and the community to provide: Red Ribbon Week, Family Math Night, Family Fall Festival, and Family Literacy Nights. PTA also plans successful community-building events: Back to school Night Barbecue, Fall Festival, Halloween Parade, movie nights, Spring Festival, and 6th grade promotional. Lincoln Elementary is a strong learning community not just in theory, but in practice. Teachers are committed to a standards-based curriculum and are becoming more discriminating about how they use adopted programs. They have become hungry for data when making decisions about student learning. The organizational structure includes a Leadership Team to help determine the focus of staff development, and the Academic Support Team and Student Success Team, which looks at individual student needs and provide extra support for students and their classroom teachers. Our entire school community is committed to closing the achievement gap for English language learners, Title One students, educationally disadvantaged students, students with IEPs, and all other students working below grade level. Our Title One program has been instrumental in helping meet the academic and social/emotional needs of these students. Special Education staff members may serve non-identified, general education students as appropriate. These services may be provided in general or special education settings. As the law states, general education teachers will provide services to special education students in collaboration with special education teachers and as provided for in the Individual Education Plans for students. The mission statement governing our practice is difficult to realize, but critical to our school community. While we continue to focus on student achievement, we also strive to improve the appearance and condition of our buildings and grounds so they enhance our students’ learning experience. We want our school to be a notable example of 21st century education in a traditional setting. Student Enrollment by Grade Level (School Year 2015-16)
Grade Number of
Level Students
Kindergarten 87
Grade 1 73
Grade 2 75
Grade 3 87
Grade 4 98
Grade 5 100
Grade 6 130
Total Enrollment 650
Student Enrollment by Group (School Year 2015-16)
Student Percent of
Group Total Enrollment
Black or African American 16.8
American Indian or Alaska Native 0.8
Asian 8.6
Filipino 2.2
Hispanic or Latino 53.4
Native Hawaiian or Pacific Islander 1.4
White 14.2
Two or More Races 2.6
Socioeconomically Disadvantaged 84.6
English Learners 19.7
Students with Disabilities 12
Foster Youth 0.6
2015-16 School Accountability Report Card for Lincoln Elementary School Page 4 of 13
A. Conditions of Learning
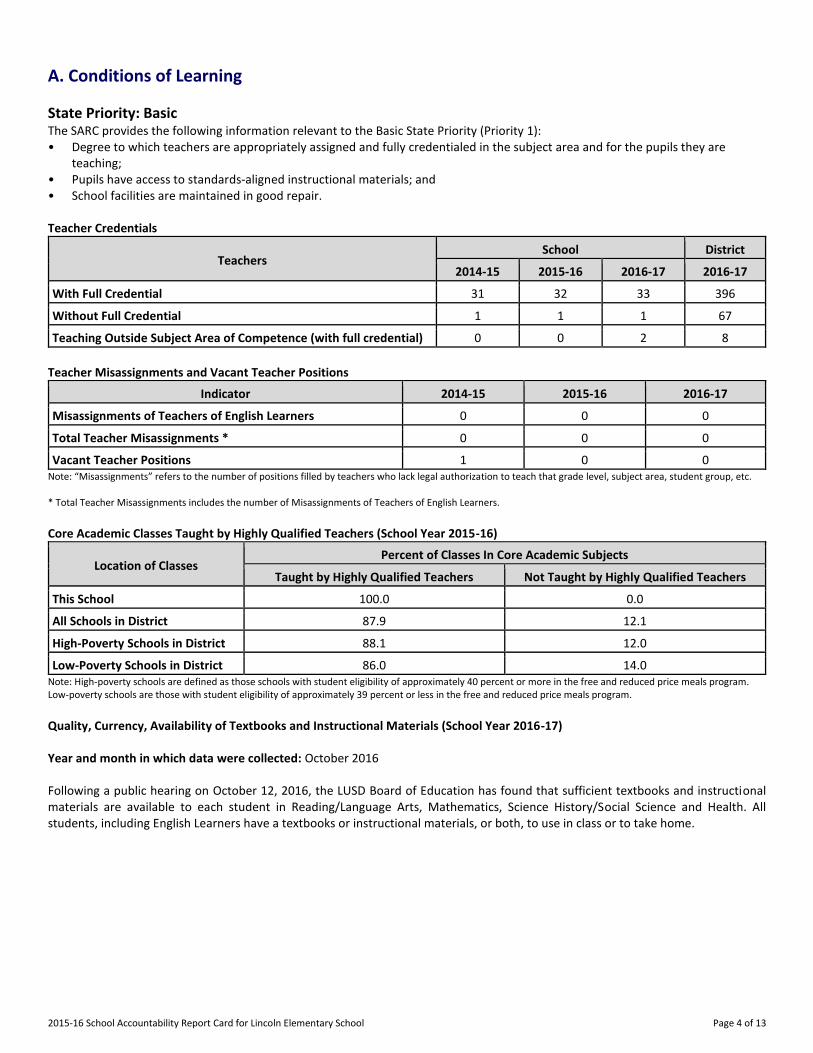
State Priority: Basic The SARC provides the following information relevant to the Basic State Priority (Priority 1): • Degree to which teachers are appropriately assigned and fully credentialed in the subject area and for the pupils they are
teaching; • Pupils have access to standards-aligned instructional materials; and • School facilities are maintained in good repair. Teacher Credentials
Teachers School District
2014-15 2015-16 2016-17 2016-17
With Full Credential 31 32 33 396
Without Full Credential 1 1 1 67
Teaching Outside Subject Area of Competence (with full credential) 0 0 2 8
Teacher Misassignments and Vacant Teacher Positions
Indicator 2014-15 2015-16 2016-17
Misassignments of Teachers of English Learners 0 0 0
Total Teacher Misassignments * 0 0 0
Vacant Teacher Positions 1 0 0 Note: “Misassignments” refers to the number of positions filled by teachers who lack legal authorization to teach that grade level, subject area, student group, etc. * Total Teacher Misassignments includes the number of Misassignments of Teachers of English Learners. Core Academic Classes Taught by Highly Qualified Teachers (School Year 2015-16)
Location of Classes Percent of Classes In Core Academic Subjects
Taught by Highly Qualified Teachers Not Taught by Highly Qualified Teachers
This School 100.0 0.0
All Schools in District 87.9 12.1
High-Poverty Schools in District 88.1 12.0
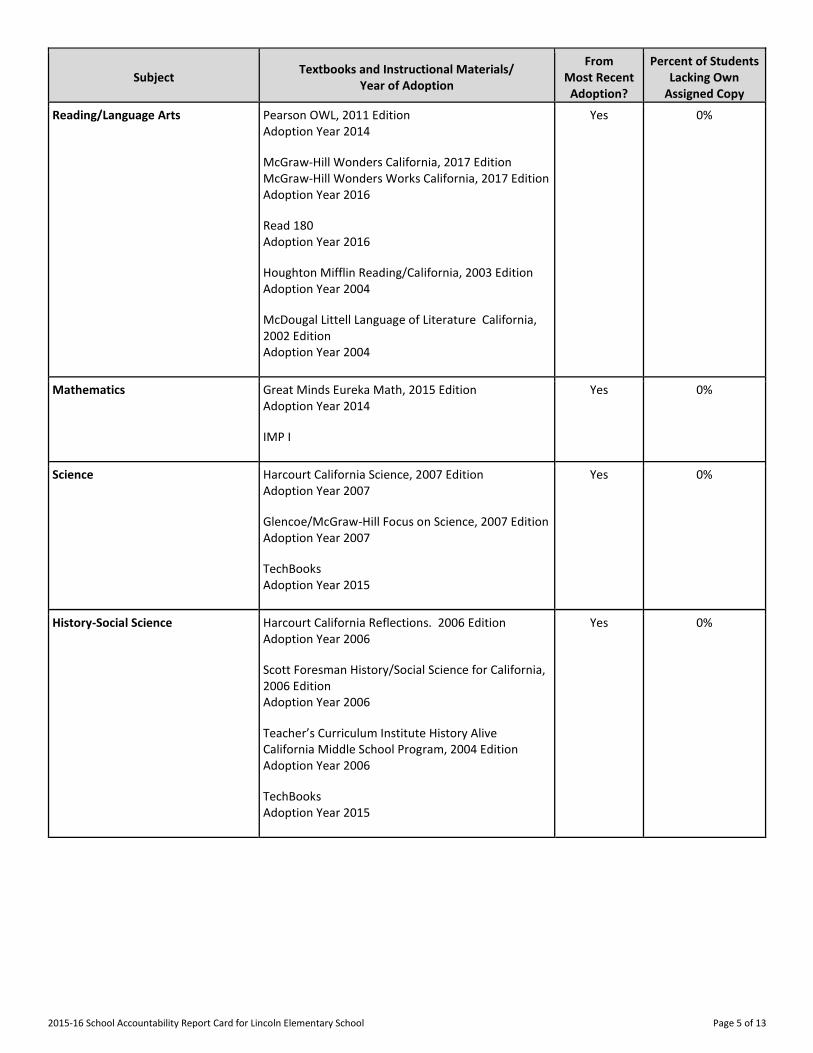
Low-Poverty Schools in District 86.0 14.0 Note: High-poverty schools are defined as those schools with student eligibility of approximately 40 percent or more in the free and reduced price meals program. Low-poverty schools are those with student eligibility of approximately 39 percent or less in the free and reduced price meals program. Quality, Currency, Availability of Textbooks and Instructional Materials (School Year 2016-17) Year and month in which data were collected: October 2016 Following a public hearing on October 12, 2016, the LUSD Board of Education has found that sufficient textbooks and instructional materials are available to each student in Reading/Language Arts, Mathematics, Science History/Social Science and Health. All students, including English Learners have a textbooks or instructional materials, or both, to use in class or to take home.
2015-16 School Accountability Report Card for Lincoln Elementary School Page 5 of 13
Subject Textbooks and Instructional Materials/
Year of Adoption
From Most Recent
Adoption?
Percent of Students Lacking Own
Assigned Copy
Reading/Language Arts Pearson OWL, 2011 Edition
Adoption Year 2014
McGraw-Hill Wonders California, 2017 Edition
McGraw-Hill Wonders Works California, 2017 Edition
Adoption Year 2016
Read 180
Adoption Year 2016
Houghton Mifflin Reading/California, 2003 Edition
Adoption Year 2004
McDougal Littell Language of Literature California, 2002 Edition
Adoption Year 2004
Yes 0%
Mathematics Great Minds Eureka Math, 2015 Edition
Adoption Year 2014
IMP I
Yes 0%
Science Harcourt California Science, 2007 Edition
Adoption Year 2007
Glencoe/McGraw-Hill Focus on Science, 2007 Edition
Adoption Year 2007
TechBooks
Adoption Year 2015
Yes 0%
History-Social Science Harcourt California Reflections. 2006 Edition
Adoption Year 2006
Scott Foresman History/Social Science for California, 2006 Edition
Adoption Year 2006
Teacher’s Curriculum Institute History Alive California Middle School Program, 2004 Edition
Adoption Year 2006
TechBooks
Adoption Year 2015
Yes 0%
2015-16 School Accountability Report Card for Lincoln Elementary School Page 6 of 13
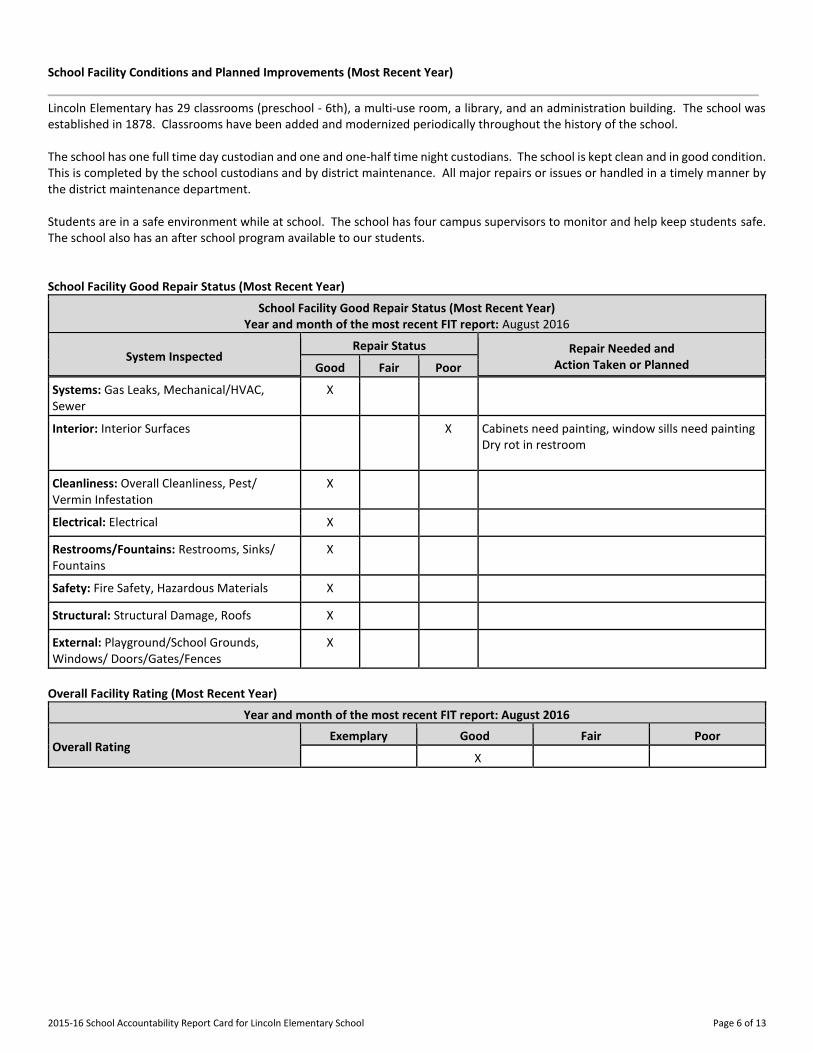
School Facility Conditions and Planned Improvements (Most Recent Year)
Lincoln Elementary has 29 classrooms (preschool - 6th), a multi-use room, a library, and an administration building. The school was established in 1878. Classrooms have been added and modernized periodically throughout the history of the school. The school has one full time day custodian and one and one-half time night custodians. The school is kept clean and in good condition. This is completed by the school custodians and by district maintenance. All major repairs or issues or handled in a timely manner by the district maintenance department. Students are in a safe environment while at school. The school has four campus supervisors to monitor and help keep students safe. The school also has an after school program available to our students. School Facility Good Repair Status (Most Recent Year)
School Facility Good Repair Status (Most Recent Year) Year and month of the most recent FIT report: August 2016
System Inspected Repair Status Repair Needed and
Action Taken or Planned Good Fair Poor
Systems: Gas Leaks, Mechanical/HVAC, Sewer
X
Interior: Interior Surfaces X Cabinets need painting, window sills need painting Dry rot in restroom
Cleanliness: Overall Cleanliness, Pest/ Vermin Infestation
X
Electrical: Electrical X
Restrooms/Fountains: Restrooms, Sinks/ Fountains
X
Safety: Fire Safety, Hazardous Materials X
Structural: Structural Damage, Roofs X
External: Playground/School Grounds, Windows/ Doors/Gates/Fences
X
Overall Facility Rating (Most Recent Year)
Year and month of the most recent FIT report: August 2016
Overall Rating Exemplary Good Fair Poor
X
2015-16 School Accountability Report Card for Lincoln Elementary School Page 7 of 13
B. Pupil Outcomes
State Priority: Pupil Achievement The SARC provides the following information relevant to the State priority: Pupil Achievement (Priority 4): • Statewide assessments (i.e., California Assessment of Student Performance and Progress [CAASPP] System, which includes the
Smarter Balanced Summative Assessments for students in the general education population and the California Alternate Assessments [CAAs] for English language arts/literacy [ELA] and mathematics given in grades three through eight and grade eleven. The CAAs have replaced the California Alternate Performance Assessment [CAPA] for ELA and mathematics, which were eliminated in 2015. Only eligible students may participate in the administration of the CAAs. CAA items are aligned with alternate achievement standards, which are linked with the Common Core State Standards [CCSS] for students with significant cognitive disabilities); and
• The percentage of students who have successfully completed courses that satisfy the requirements for entrance to the University of California and the California State University, or career technical education sequences or programs of study
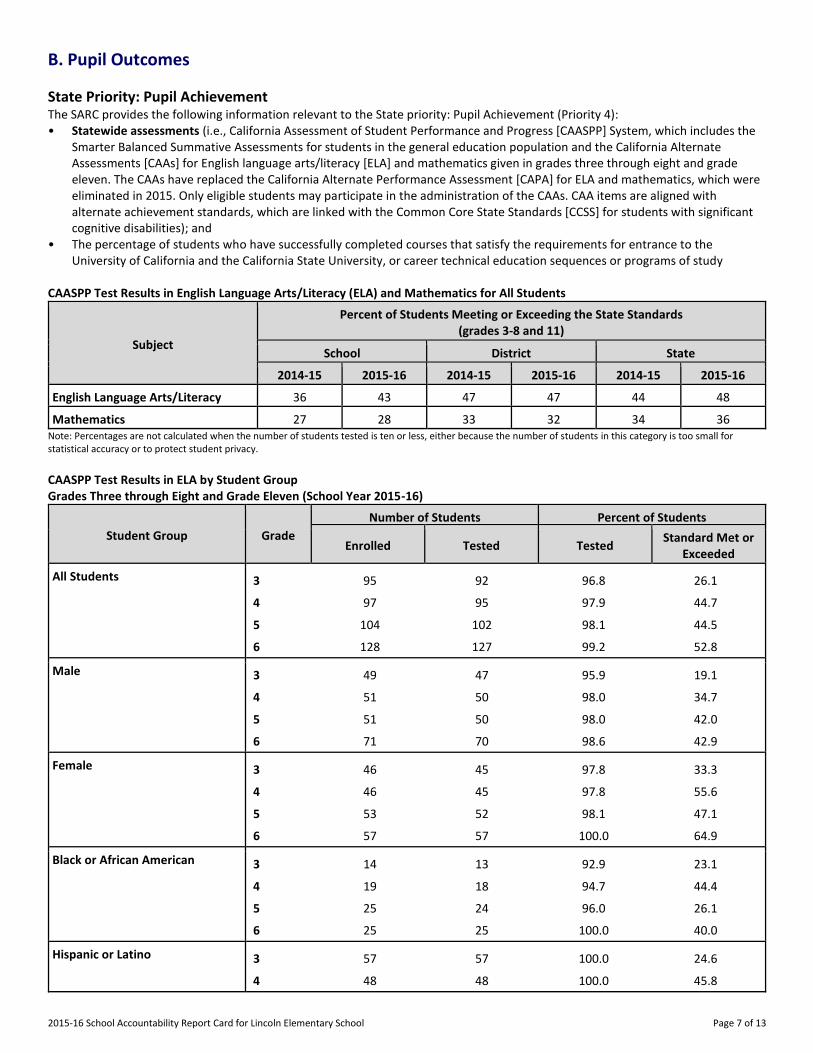
CAASPP Test Results in English Language Arts/Literacy (ELA) and Mathematics for All Students
Subject
Percent of Students Meeting or Exceeding the State Standards (grades 3-8 and 11)
School District State
2014-15 2015-16 2014-15 2015-16 2014-15 2015-16
English Language Arts/Literacy 36 43 47 47 44 48
Mathematics 27 28 33 32 34 36 Note: Percentages are not calculated when the number of students tested is ten or less, either because the number of students in this category is too small for statistical accuracy or to protect student privacy.
CAASPP Test Results in ELA by Student Group Grades Three through Eight and Grade Eleven (School Year 2015-16)
Student Group Grade
Number of Students Percent of Students
Enrolled Tested Tested Standard Met or
Exceeded
All Students 3 95 92 96.8 26.1
4 97 95 97.9 44.7
5 104 102 98.1 44.5
6 128 127 99.2 52.8
Male 3 49 47 95.9 19.1
4 51 50 98.0 34.7
5 51 50 98.0 42.0
6 71 70 98.6 42.9
Female 3 46 45 97.8 33.3
4 46 45 97.8 55.6
5 53 52 98.1 47.1
6 57 57 100.0 64.9
Black or African American 3 14 13 92.9 23.1
4 19 18 94.7 44.4
5 25 24 96.0 26.1
6 25 25 100.0 40.0
Hispanic or Latino 3 57 57 100.0 24.6
4 48 48 100.0 45.8
2015-16 School Accountability Report Card for Lincoln Elementary School Page 8 of 13
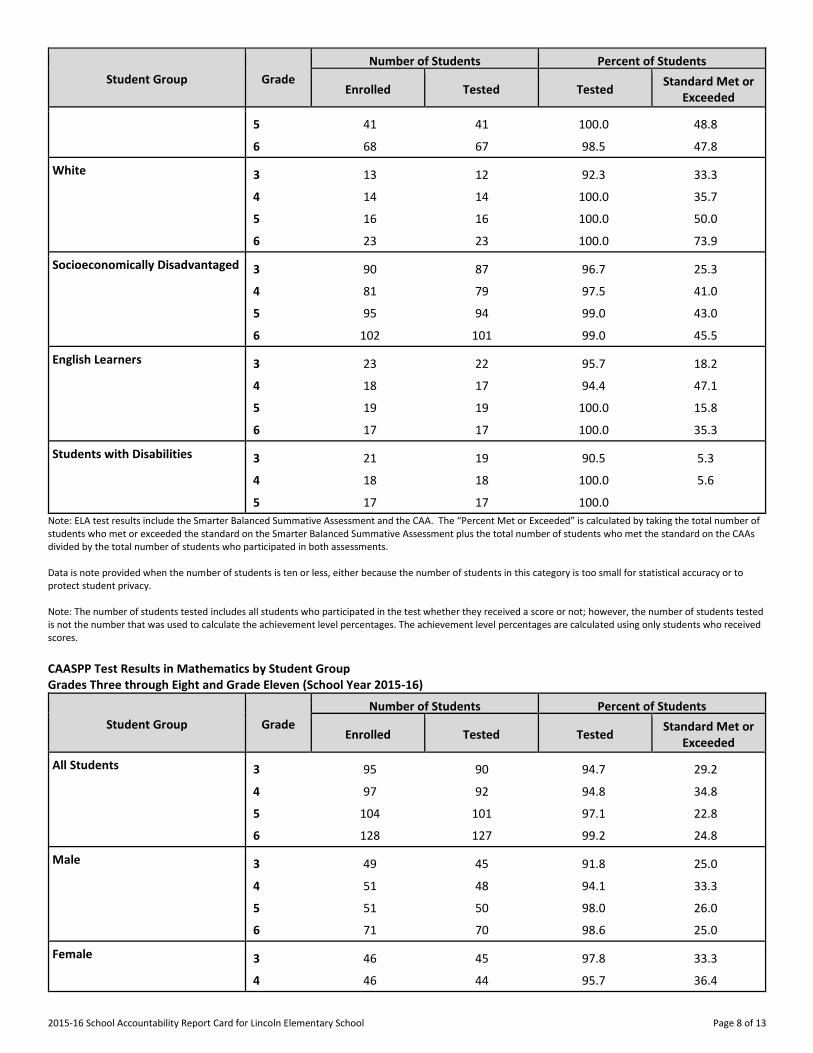
Student Group Grade
Number of Students Percent of Students
Enrolled Tested Tested Standard Met or
Exceeded
5 41 41 100.0 48.8
6 68 67 98.5 47.8
White 3 13 12 92.3 33.3
4 14 14 100.0 35.7
5 16 16 100.0 50.0
6 23 23 100.0 73.9
Socioeconomically Disadvantaged 3 90 87 96.7 25.3
4 81 79 97.5 41.0
5 95 94 99.0 43.0
6 102 101 99.0 45.5
English Learners 3 23 22 95.7 18.2
4 18 17 94.4 47.1
5 19 19 100.0 15.8
6 17 17 100.0 35.3
Students with Disabilities 3 21 19 90.5 5.3
4 18 18 100.0 5.6
5 17 17 100.0
Note: ELA test results include the Smarter Balanced Summative Assessment and the CAA. The “Percent Met or Exceeded” is calculated by taking the total number of students who met or exceeded the standard on the Smarter Balanced Summative Assessment plus the total number of students who met the standard on the CAAs divided by the total number of students who participated in both assessments. Data is note provided when the number of students is ten or less, either because the number of students in this category is too small for statistical accuracy or to protect student privacy. Note: The number of students tested includes all students who participated in the test whether they received a score or not; however, the number of students tested is not the number that was used to calculate the achievement level percentages. The achievement level percentages are calculated using only students who received scores.
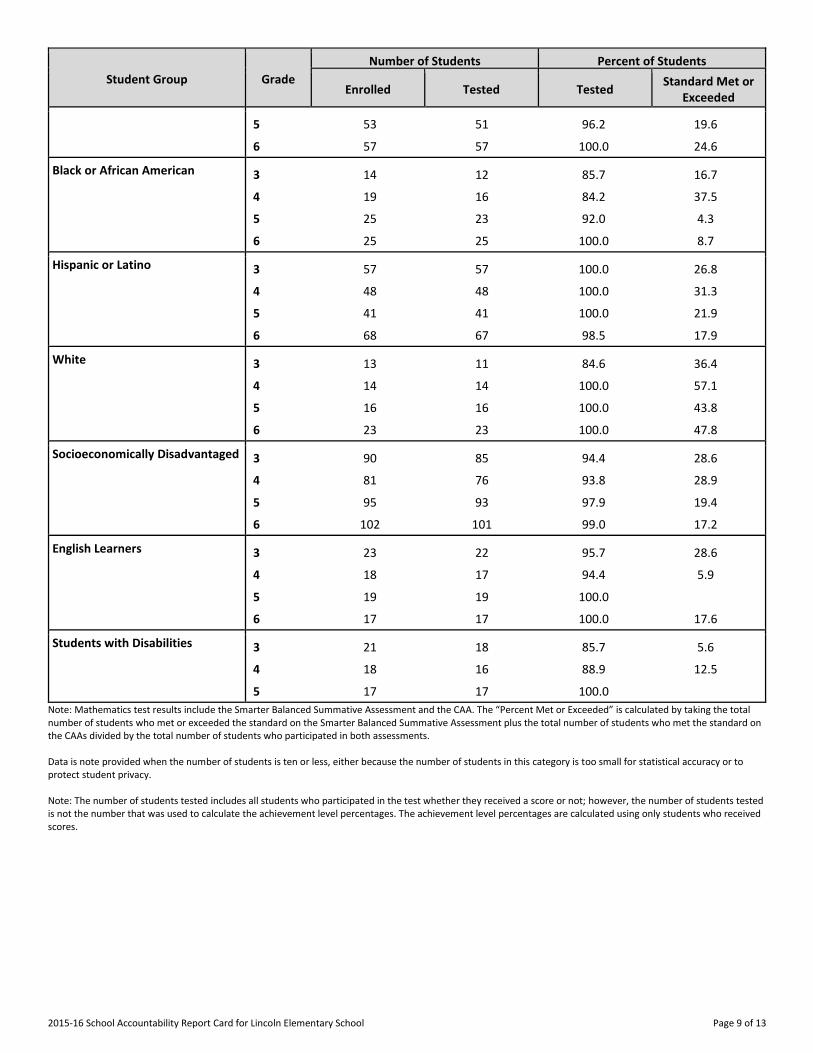
CAASPP Test Results in Mathematics by Student Group Grades Three through Eight and Grade Eleven (School Year 2015-16)
Student Group Grade
Number of Students Percent of Students
Enrolled Tested Tested Standard Met or
Exceeded
All Students 3 95 90 94.7 29.2
4 97 92 94.8 34.8
5 104 101 97.1 22.8
6 128 127 99.2 24.8
Male 3 49 45 91.8 25.0
4 51 48 94.1 33.3
5 51 50 98.0 26.0
6 71 70 98.6 25.0
Female 3 46 45 97.8 33.3
4 46 44 95.7 36.4
2015-16 School Accountability Report Card for Lincoln Elementary School Page 9 of 13
Student Group Grade
Number of Students Percent of Students
Enrolled Tested Tested Standard Met or
Exceeded
5 53 51 96.2 19.6
6 57 57 100.0 24.6
Black or African American 3 14 12 85.7 16.7
4 19 16 84.2 37.5
5 25 23 92.0 4.3
6 25 25 100.0 8.7
Hispanic or Latino 3 57 57 100.0 26.8
4 48 48 100.0 31.3
5 41 41 100.0 21.9
6 68 67 98.5 17.9
White 3 13 11 84.6 36.4
4 14 14 100.0 57.1
5 16 16 100.0 43.8
6 23 23 100.0 47.8
Socioeconomically Disadvantaged 3 90 85 94.4 28.6
4 81 76 93.8 28.9
5 95 93 97.9 19.4
6 102 101 99.0 17.2
English Learners 3 23 22 95.7 28.6
4 18 17 94.4 5.9
5 19 19 100.0
6 17 17 100.0 17.6
Students with Disabilities 3 21 18 85.7 5.6
4 18 16 88.9 12.5
5 17 17 100.0
Note: Mathematics test results include the Smarter Balanced Summative Assessment and the CAA. The “Percent Met or Exceeded” is calculated by taking the total number of students who met or exceeded the standard on the Smarter Balanced Summative Assessment plus the total number of students who met the standard on the CAAs divided by the total number of students who participated in both assessments. Data is note provided when the number of students is ten or less, either because the number of students in this category is too small for statistical accuracy or to protect student privacy. Note: The number of students tested includes all students who participated in the test whether they received a score or not; however, the number of students tested is not the number that was used to calculate the achievement level percentages. The achievement level percentages are calculated using only students who received scores.
2015-16 School Accountability Report Card for Lincoln Elementary School Page 10 of 13
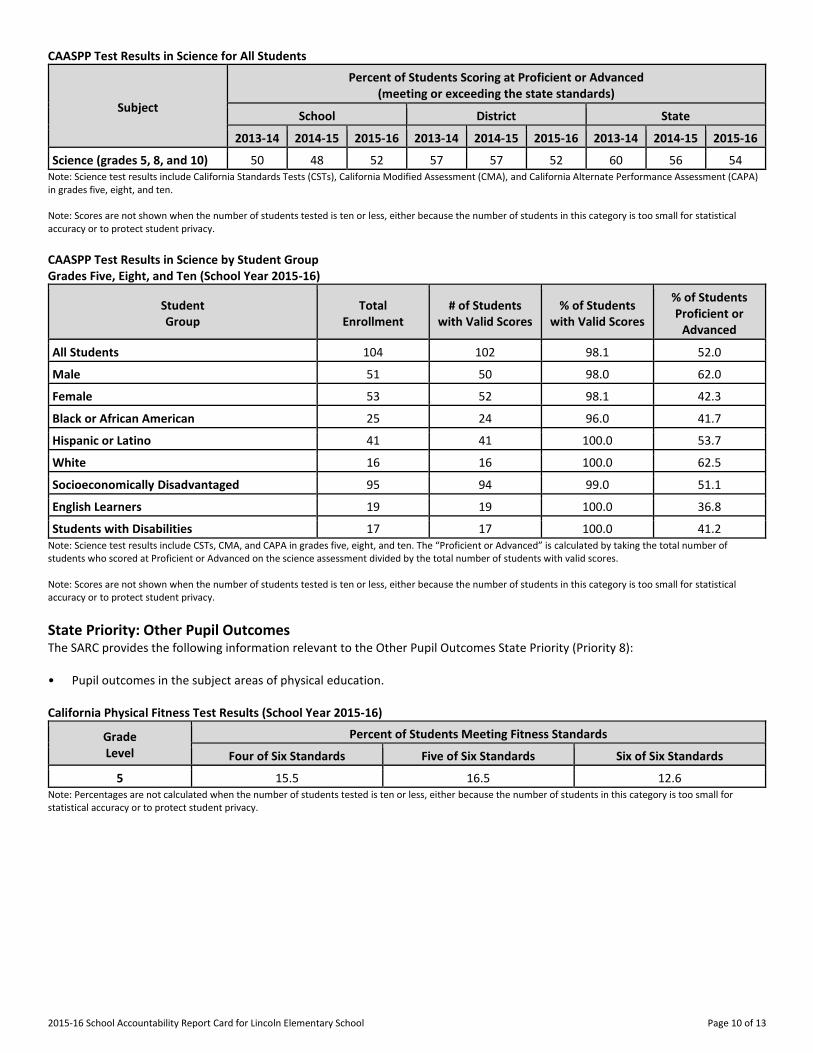
CAASPP Test Results in Science for All Students
Subject
Percent of Students Scoring at Proficient or Advanced (meeting or exceeding the state standards)
School District State
2013-14 2014-15 2015-16 2013-14 2014-15 2015-16 2013-14 2014-15 2015-16
Science (grades 5, 8, and 10) 50 48 52 57 57 52 60 56 54 Note: Science test results include California Standards Tests (CSTs), California Modified Assessment (CMA), and California Alternate Performance Assessment (CAPA) in grades five, eight, and ten. Note: Scores are not shown when the number of students tested is ten or less, either because the number of students in this category is too small for statistical accuracy or to protect student privacy.
CAASPP Test Results in Science by Student Group Grades Five, Eight, and Ten (School Year 2015-16)
Student Group
Total Enrollment
# of Students with Valid Scores
% of Students with Valid Scores
% of Students Proficient or
Advanced
All Students 104 102 98.1 52.0
Male 51 50 98.0 62.0
Female 53 52 98.1 42.3
Black or African American 25 24 96.0 41.7
Hispanic or Latino 41 41 100.0 53.7
White 16 16 100.0 62.5
Socioeconomically Disadvantaged 95 94 99.0 51.1
English Learners 19 19 100.0 36.8
Students with Disabilities 17 17 100.0 41.2 Note: Science test results include CSTs, CMA, and CAPA in grades five, eight, and ten. The “Proficient or Advanced” is calculated by taking the total number of students who scored at Proficient or Advanced on the science assessment divided by the total number of students with valid scores. Note: Scores are not shown when the number of students tested is ten or less, either because the number of students in this category is too small for statistical accuracy or to protect student privacy.
State Priority: Other Pupil Outcomes The SARC provides the following information relevant to the Other Pupil Outcomes State Priority (Priority 8): • Pupil outcomes in the subject areas of physical education. California Physical Fitness Test Results (School Year 2015-16)
Grade Level
Percent of Students Meeting Fitness Standards
Four of Six Standards Five of Six Standards Six of Six Standards
---5--- 15.5 16.5 12.6 Note: Percentages are not calculated when the number of students tested is ten or less, either because the number of students in this category is too small for statistical accuracy or to protect student privacy.
2015-16 School Accountability Report Card for Lincoln Elementary School Page 11 of 13
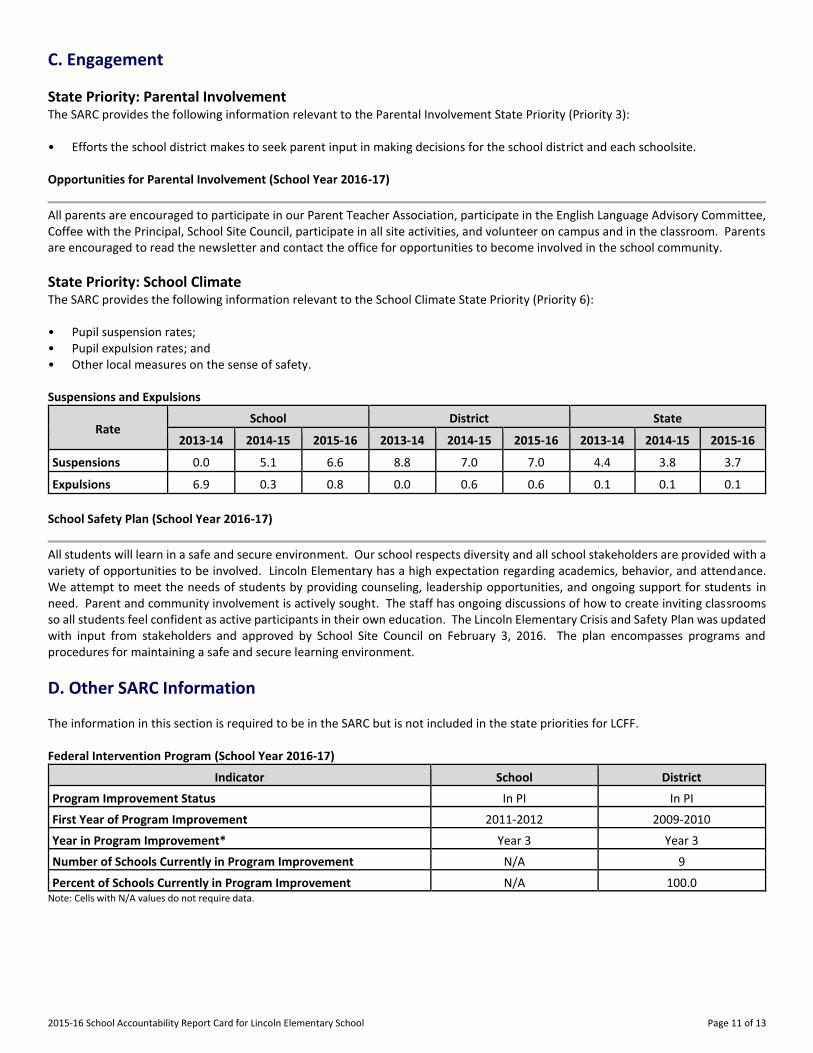
C. Engagement
State Priority: Parental Involvement The SARC provides the following information relevant to the Parental Involvement State Priority (Priority 3): • Efforts the school district makes to seek parent input in making decisions for the school district and each schoolsite. Opportunities for Parental Involvement (School Year 2016-17)
All parents are encouraged to participate in our Parent Teacher Association, participate in the English Language Advisory Committee, Coffee with the Principal, School Site Council, participate in all site activities, and volunteer on campus and in the classroom. Parents are encouraged to read the newsletter and contact the office for opportunities to become involved in the school community.
State Priority: School Climate The SARC provides the following information relevant to the School Climate State Priority (Priority 6): • Pupil suspension rates; • Pupil expulsion rates; and • Other local measures on the sense of safety. Suspensions and Expulsions
Rate School District State
2013-14 2014-15 2015-16 2013-14 2014-15 2015-16 2013-14 2014-15 2015-16
Suspensions------- 0.0 5.1 6.6 8.8 7.0 7.0 4.4 3.8 3.7
Expulsions------- 6.9 0.3 0.8 0.0 0.6 0.6 0.1 0.1 0.1
School Safety Plan (School Year 2016-17)
All students will learn in a safe and secure environment. Our school respects diversity and all school stakeholders are provided with a variety of opportunities to be involved. Lincoln Elementary has a high expectation regarding academics, behavior, and attendance. We attempt to meet the needs of students by providing counseling, leadership opportunities, and ongoing support for students in need. Parent and community involvement is actively sought. The staff has ongoing discussions of how to create inviting classrooms so all students feel confident as active participants in their own education. The Lincoln Elementary Crisis and Safety Plan was updated with input from stakeholders and approved by School Site Council on February 3, 2016. The plan encompasses programs and procedures for maintaining a safe and secure learning environment.
D. Other SARC Information
The information in this section is required to be in the SARC but is not included in the state priorities for LCFF. Federal Intervention Program (School Year 2016-17)
Indicator School District
Program Improvement Status In PI In PI
First Year of Program Improvement 2011-2012 2009-2010
Year in Program Improvement* Year 3 Year 3
Number of Schools Currently in Program Improvement N/A 9
Percent of Schools Currently in Program Improvement N/A 100.0 Note: Cells with N/A values do not require data.
2015-16 School Accountability Report Card for Lincoln Elementary School Page 12 of 13
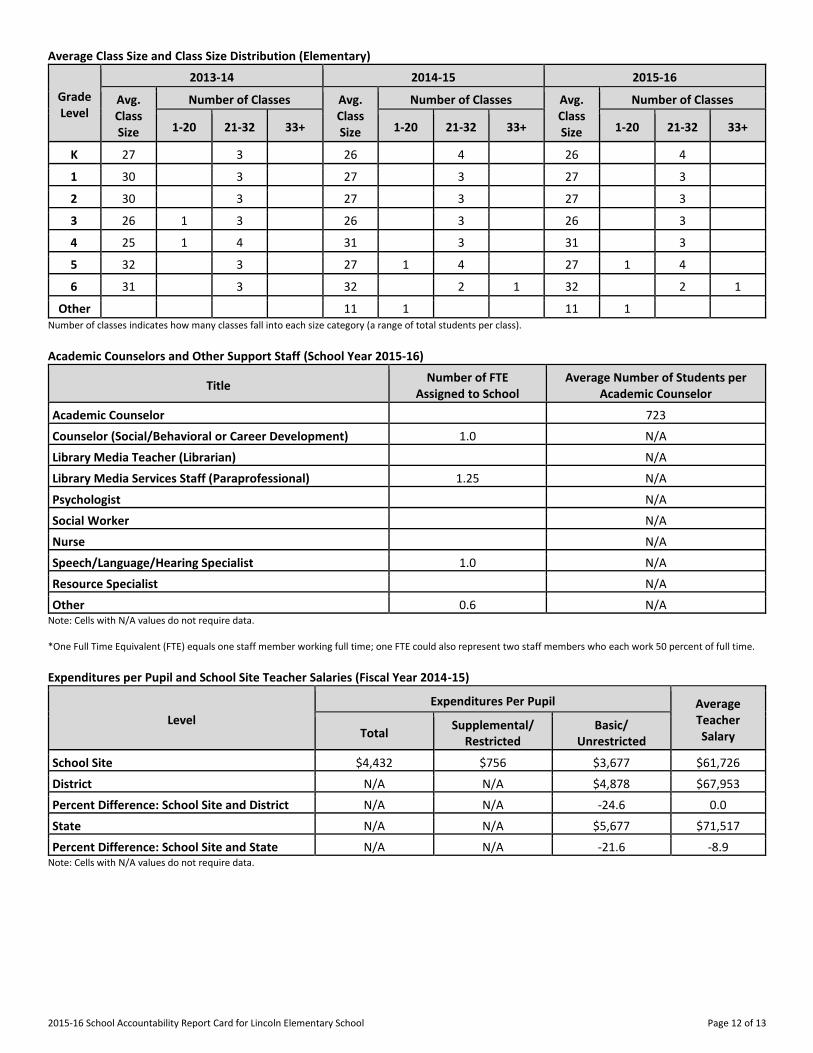
Average Class Size and Class Size Distribution (Elementary)
Grade Level
2013-14 2014-15 2015-16
Avg. Class Size
Number of Classes Avg. Class Size
Number of Classes Avg. Class Size
Number of Classes
1-20 21-32 33+ 1-20 21-32 33+ 1-20 21-32 33+
K
27 3 26 4 26 4
1
30 3 27 3 27 3
2
30 3 27 3 27 3
3
26 1 3 26 3 26 3
4
25 1 4 31 3 31 3
5
32 3 27 1 4 27 1 4
6
31 3 32 2 1 32 2 1
Other
11 1 11 1 Number of classes indicates how many classes fall into each size category (a range of total students per class).
Academic Counselors and Other Support Staff (School Year 2015-16)
Title Number of FTE
Assigned to School Average Number of Students per
Academic Counselor
Academic Counselor------- 723
Counselor (Social/Behavioral or Career Development) 1.0 N/A
Library Media Teacher (Librarian) N/A
Library Media Services Staff (Paraprofessional) 1.25 N/A
Psychologist------- N/A
Social Worker------- N/A
Nurse------- N/A
Speech/Language/Hearing Specialist 1.0 N/A
Resource Specialist------- N/A
Other------- 0.6 N/A Note: Cells with N/A values do not require data. *One Full Time Equivalent (FTE) equals one staff member working full time; one FTE could also represent two staff members who each work 50 percent of full time.
Expenditures per Pupil and School Site Teacher Salaries (Fiscal Year 2014-15)
Level
Expenditures Per Pupil Average Teacher Salary Total
Supplemental/ Restricted
Basic/ Unrestricted
School Site------- $4,432 $756 $3,677 $61,726
District------- N/A N/A $4,878 $67,953
Percent Difference: School Site and District N/A N/A -24.6 0.0
State------- N/A N/A $5,677 $71,517
Percent Difference: School Site and State N/A N/A -21.6 -8.9 Note: Cells with N/A values do not require data.
2015-16 School Accountability Report Card for Lincoln Elementary School Page 13 of 13
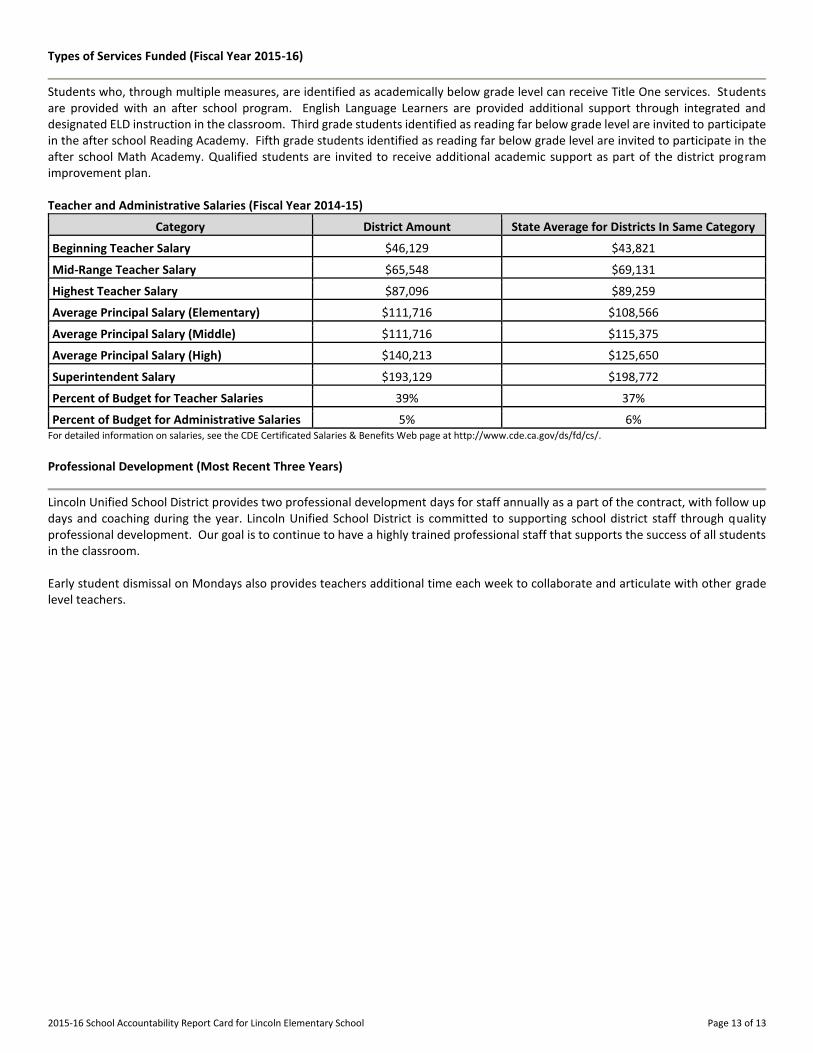
Types of Services Funded (Fiscal Year 2015-16)
Students who, through multiple measures, are identified as academically below grade level can receive Title One services. Students are provided with an after school program. English Language Learners are provided additional support through integrated and designated ELD instruction in the classroom. Third grade students identified as reading far below grade level are invited to participate in the after school Reading Academy. Fifth grade students identified as reading far below grade level are invited to participate in the after school Math Academy. Qualified students are invited to receive additional academic support as part of the district program improvement plan. Teacher and Administrative Salaries (Fiscal Year 2014-15)
Category District Amount State Average for Districts In Same Category
Beginning Teacher Salary $46,129 $43,821
Mid-Range Teacher Salary $65,548 $69,131
Highest Teacher Salary $87,096 $89,259
Average Principal Salary (Elementary) $111,716 $108,566
Average Principal Salary (Middle) $111,716 $115,375
Average Principal Salary (High) $140,213 $125,650
Superintendent Salary $193,129 $198,772
Percent of Budget for Teacher Salaries 39% 37%
Percent of Budget for Administrative Salaries 5% 6% For detailed information on salaries, see the CDE Certificated Salaries & Benefits Web page at http://www.cde.ca.gov/ds/fd/cs/. Professional Development (Most Recent Three Years)
Lincoln Unified School District provides two professional development days for staff annually as a part of the contract, with follow up days and coaching during the year. Lincoln Unified School District is committed to supporting school district staff through quality professional development. Our goal is to continue to have a highly trained professional staff that supports the success of all students in the classroom. Early student dismissal on Mondays also provides teachers additional time each week to collaborate and articulate with other grade level teachers.