school accountability report card school year...
TRANSCRIPT

School Accountability Report Card School Year 2009-10
Mission High School3750 18TH ST, SAN FRANCISCO, CA 94114
ERIC GUTHERTZ Principal:
Phone: 415-241-6240
(Published during 2010-11)
Fax: 415-626-1641
SFUSD School ID #: 725 Calif.School ID #: 3834082
SAN FRANCISCO UNIFIED SCHOOL DISTRICT Superintendent: Carlos Garcia
555 Franklin Street, San Francisco, CA 94102Phone: 415-241-6000 Web Site: www.sfusd.edu
SARC Contact:Research, Planning and Accountability
Ritu Khanna, Executive DirectorPhone: 415-241-6454 Fax: 415-241-6035
The School Accountability Report Card (SARC) which is required by law to be published annually, contains informationabout the condition and performance of each California public school. More information about SARC requirements is available on the SARC Web page at http://www.cde.ca.gov/ta/ac/sa/. For additional information about the school, parents and community members should contact the school principal or the district office.
DataQuest is an online data tool located at http://dq.cde.ca.gov/dataquest/ that contains additional information about thisschool and comparisons of the school to the district, the county, and the state. Specifically, DataQuest is a dynamic system that provides reports for accountability (e.g. Academic Performance Index [API], Adequate Yearly Progress [AYP], test data, enrollment, graduates, dropouts, course enrollments, staffing, and data regarding English learners.
Internet access is available at public libraries and other locations that are publicly accessible (e.g. the California State Library). Access to the Internet at libraries and other locations is generally provided on a first-come, first-served basis.Other use restrictions include the hours of operation, the length of time that a workstation may be used (depending on availability), the types of software programs available on a workstation, and the ability to print documents.
Section I - Data and Access
Page 1 of 21
School Description and Mission Statement This section provides information about the school's goals and programs.
Mission High School is very proud of its rich history. We have our very own Alumni Museum on campus which highlights the evolution of Mission High over the past 100+ years! Located right in front of the beautiful Dolores Park where the neighborhoods of the Mission, Noe Valley and the Castro meet. We are very proud of how our school reflects the cultural diversity of our neighborhood. We instill positive social values, acceptance and an appreciation for this diversity. Our academic focus schoolwide is aimed at preparing ALL of our students for college and careers with rigorous courses including a rich array of AP and Honors courses. Come visit us at the end of the year when all of our students share their rigorous portfolio work with the entire Mission community. We also have numerous business and college partnership to assist us in making sure that our students set high goals throughout their high school years and upon graduation. Recent graduates now attend Stanford, UCLA, UCB, Cornell, Spelman, and many other universities throughout the country.
Opportunities for Parental Involvement This section provides information about opportunities for parents to become involved with school activities.
Mission is continuing to implement our Secondary School Redesign to personalize the school so that students know they are part of a caring and supportive "team" of teachers and support staff committed to their academic success and social development. Parents and guardians will be able to easily access Teams through a Common Planning Time 3 times each week. Communication with parents and caregivers is critical, especially in the 9th grade to ensure high school success. Mission High holds parent orientation, back-to-school nights, and many other parent information events throughout the year. Mission High also welcomes parents to participate in our School Site Council, English-Language Advisory Council and other groups, such as our BSU and OLE clubs. We have two full-time parent liaisons to assist parents in their efforts to get involved in our school community.
Section II - About This School
000000000
0
K12345678
Ungraded Elem
Grade Level Enrollment212222200225
0859
9101112
Ungraded SecTotal Enrollment
Grade Level Enrollment
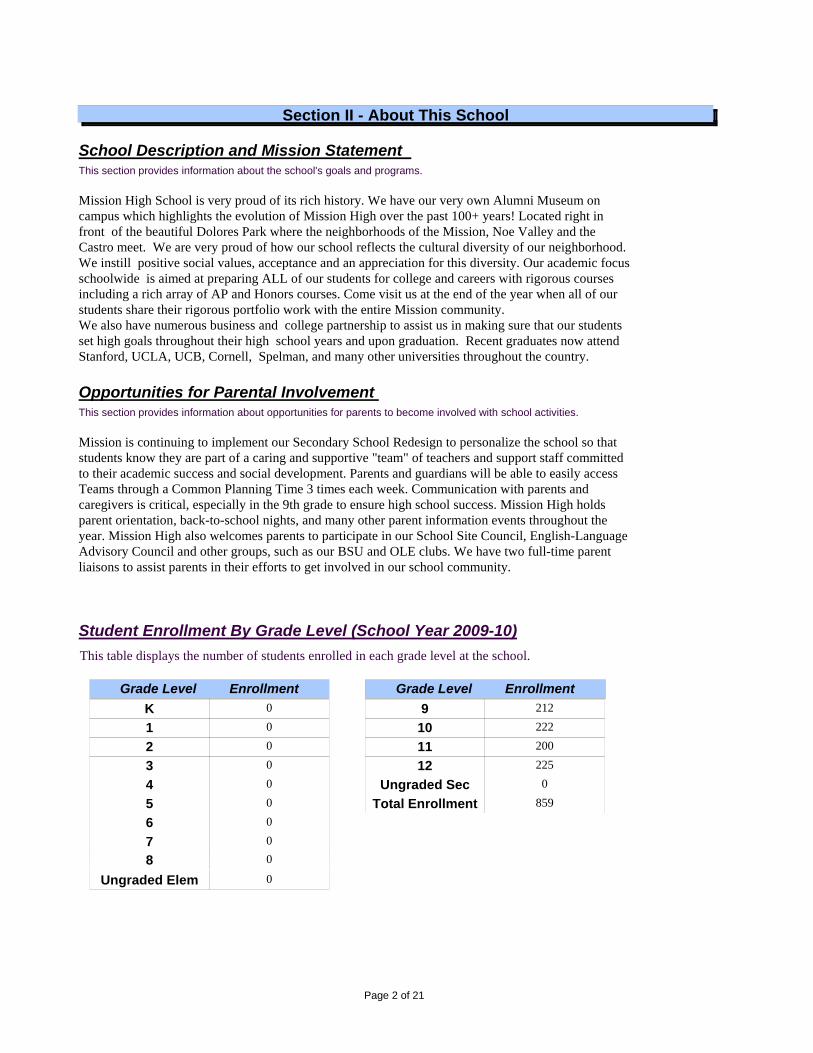
Student Enrollment By Grade Level (School Year 2009-10)This table displays the number of students enrolled in each grade level at the school.
Page 2 of 21

African AmericanAmerican Indian or Alaska Native
AsianFilipino
Group
Percent of Total Enrollment
Hispanic or LatinoPacific Islander
White (Not Hispanic)Multiple or No Response
16.41%0.58%
22.24%3.73%
45.29%0.47%7.57%3.73%
Student Enrollment By Group (School Year 2009-10)This table displays the percent of students enrolled at the school who are identified as being in aparticular group.
Socioeconomically DisadvantagedEnglish Learners
Students with Disabilities
59.84%44.82%14.20%
20222721
English
Math
Subject
3212
42237
18
3162
19181315
26.0523.7127.2625.44
5151617
1716410
15475
Number of Classrooms Number of Classrooms2009-10
33+
Avg Class Size 1-22 23-32 33+
Avg Class Size 1-22 23-32 33+
This table displays by subject area the average class size and number of classrooms that fall into each size category (a range of total students per classroom).
Average Class Size and Class Size Distribution (Secondary)
51292928
18191818
21221413
Number of ClassroomsAvg
Class Size
1-22 23-32
2008-09 2007-08
Science
Social Science
Section III (School Climate) begins on next page.
Page 3 of 21

Section III - School Climate
School Safety Plan (School Year 2009-10)This section provides information about the school's comprehensive safety plan.
Mission High is a very safe school. Come see for yourself! Our hallways are empty during class time because every student is in class and students feel safe at Mission. Mission is a truly safe, communal, supportive environment that works to take care of each other. In fact, when we went through our WASC Accreditation Process in 2006, "safety" was one of the most highly rated assets of our school as viewed by the outsider evaluators and also through student and parent surveys!We have six security guards strategically placed throughout the building and we work very closely with SFPD and the School Resource Officer Program with one officer on campus almost every day. The Small Learning Communities have provided students with an adult ally in the school that they can talk to about any issues or problems that arise.
Section IV (School Facilities) begins on next page.
Suspensions and ExpulsionsThis table displays the rate of suspensions and expulsions (the total number of incidents divided by the totalenrollment) at the school and district levels for the most recent three-year period.
260Expulsions
Rate 290
140
60
80
60
School District 2007-08 2008-09 2009-10 2007-08 2008-09 2009-10
Suspensions
Page 4 of 21

Section IV - School FacilitiesSchool Facility Conditions and Improvements
Repair Needed and Action Taken or Planned
Item Inspected Good Poor
Repair Status
This section provides information about the condition of the school's grounds, buildings, and restrooms, and a description of any planned or recently completed facility improvements.
In November of 2006, Mission High was named a San Francisco Landmark; a distinction long-overdue as stated by members of SF Landmark's Board! Mission has recently completed work after three years of intensive construction. The construction includes extensive renovation designed to provide accessibility to all areas of the building for full participation in all programs for students with special needs. We have also upgraded many areas of the building including restrooms, elevators and stairwells to comply with fire/life/safety codes and we have renovated our Art Deco Auditorium, which may be the most beautiful High School auditorium in San Francisco.
School Facility Good Repair Status This table displays the results of the most recently completed school site inspection to determine the school facility's good repair status.
Fair
Systems: Gas Leaks, Mechanical/HVAC, Sewer GOOD Rm 400: Broken radiator. Open 1/2 inch copper pipe by window - periodically water drips out WO
Interior: Interior Surfaces GOOD Café: Missing ceiling tile WO
Cleanliness: Overall and Pest Infestation GOOD Rm 400: Evidence of mice.Rm 411: Evidence of mice at floor wire molding Pest management co is scheduled to service site bi-weekly
Electrical: GOOD 1ST Girl Rstrm: Loose ceiling light in restroom across from Office.1st FLR Strwll: Broken light fixture at Exit Stair #4Rm 223, 227: 7. Several light bulbs inoperative.2nd FLR Girls Rstrm: Across from Rm 203, Broken light switch2nd FLR Boys Rstrm: Restroom across from Rm 200A, Light switch cover plate missing.Rm 334: Loose wall clock.Rm 408: Missing light cover. Some light covers loose. Work orders will be made for deficiencies listed above
Restrooms/Sinks/Fountains: 2nd FLR Girls Rstrm nr rm 203: Floor handle broken & Handicapped stall door does not open WO1ST FLR HLLWAY: Water fountains across from Main Office and by Boy's Gym inoperative.4th FLR Boys Rstrm: Missing sink handle4th FLR Hllway: Water fountain inoperative, no drainage Work orders will be made for deficiencies listed above
FAIR
Safety: Fire and Hazardous Materials GOOD 4th FLR Strwll: Sprinkler Riser Valve missing. WOPlayground: Emergency Exit Light broken at west courtyard door by Rm 102 WO
Structural: Damage, Roofs GOOD 2nd FLR Hllway: 15. Water damage east arcade wall. WO
Page 5 of 21

WO - Work Order. DM - Deferred Maintenance.
Section V (Teachers) begins on next page.
External: School Grounds, Windows, Doors GOOD 2nd FLR Hllway: Corridor Door by stair #6 does not open, stuck on floor. 4th FLR Strwll: Magnetic Door Holder - middle stairs across from Rm 407 out of place, needs to be re-installed.Rm 406: Door handle inoperativeRm 411: Broken window shadePlayground: Adjust door closure to West courtyard, door remains open. Work orders will be made for deficiencies listed above
Overall Summary of School Facility Good Repair StatusThis table displays the overall summary of the results of the most recently completed school site inspection.
XOverall Summary
Item InspectedExemplary Good Fair Poor
Facility Condition
Inspection Date 8/18/2010
Additional Comments
Page 6 of 21

Section V - Teachers
Teacher CredentialsThis table displays the number of teachers assigned to the school with a full credential, without a full credential,and those teaching outside of their subject area of competence. Detailed information about teacher qualificationscan be found at the CDE Web site at http://dq.cde.ca.gov/dataquest/.
612
With Full CredentialWithout Full Credential
Teachers
581
622
2007-08 2008-09 2009-10
3Teaching Outside Subject Area of Competence 1 0
310823
2009-10DistrictSchool
--------
Teacher Misassignments and Vacant Teacher Positions
0
0Misassignments of Teachers of English Learners
Total Teacher Misassignments
Indicator 0
3
1
8
2008-09 2009-10 2010-11
0Vacant Teacher Positions 0 0
This table displays the number of teacher misassignments (teachers assigned without proper legal authorization)and the number of vacant teacher positions (not filled by a single designated teacher assigned to teach the entirecourse at the beginning of the school year or semester). Note: Total Teacher Misassignments includes the number of Misassignments of Teachers of English Learners.
This SchoolAll Schools in District
High-Poverty Schools in DistrictLow-Poverty Schools in District
Location of Classes
98.896.196.197.9
Taught by NCLB Compliant Teachers
Core Academic Classes Taught by No Child Left Behind Compliant Teachers, 2009-10This table displays the percent of classes in core academic subjects taught by No Child Left Behind (NCLB) compliant and non-NCLB compliant teachers at the school, at all schools in the district, at high-poverty schools in the district (75or more in free/reduced lunch meal program), and at low-poverty schools in the district (25% or less in free/reduced lunc
1.23.93.92.1
Taught by non-NCLB Compliant Teachers
Percent of Classes in Core Academic Subjects
meal program). More information on teacher qualifications required under NCLB can be found on the CDE ImprovingTeacher and Principal Quality Web page at http://www.cde.ca.gov/nclb/sr/tq/.
Page 7 of 21

Section VI - Support Staff
Academic Counselors and Other Support Staff (School Year 2009-10)This table displays, in units of full-time equivalents (FTE), the number of academic counselors and other supportstaff who are assigned to the school and the average number of students per academic counselor. One FTE equals one staff member working full time; one FTE could also represent two staff members who each work 50% of full time
Academic CounselorLibrary Media Teacher (Librarian)
Title41
Number of FTE Assigned to
School
Library Media Services Staff (Paraprofessional)Psychologist / Social Worker
0
NurseSpeech/Language/Hearing SpecialistResource Specialist (non-teaching) 4
Other 1
220
Average Number of Students per
Academic Counselor
----------------------------
Note: For various reasons, including funding sources and employees serving multiple locations, many of the staffin these positions are listed as working at central administrative offices, and so, will not show up under a particular school's staffing count. If additional information is needed regarding staffing in these particular support roles, please contact the school.
Page 8 of 21

Section VII - Curriculum and Instructional Materials
Quality, Currency, and Availability of Textbooks and Instructional Materials
For complete lists of adopted textbooks, go to:http://portal.sfusd.edu/template/default.cfm?page=chief_academic.libserv
Section VIII (School Finances) begins on next page.
For High Schools (grades 912) The San Francisco Unified School District adopts instructional materials following the cycle of state frameworks and standards, and provides sufficient textbooks for all students to use in class and to take home in the core curriculum areas of reading/language arts, mathematics, science, and history/social studies. Instructional materials were adopted by the SFUSD Board of Education for the 2010‐2011 school year and were provided for all high school students enrolled in Chinese and Probability and Statistics classes. Class sets of health instructional materials were provided for high school health teachers. In addition, other Board‐adopted core curriculum materials were provided to remedy all insufficiencies identified through a survey and other activities at the annual Instructional Materials Hearing at the September 28, 2010 meeting of the Board of Education. All adopted high school instructional materials have been evaluated and determined locally to meet state standards for grades 9‐12. Appropriate science laboratory equipment is available for all laboratory science courses. For Elementary and Middle Schools (grades K8) The San Francisco Unified School District adopts instructional materials following the cycle of state frameworks and standards, and adopts K‐8 materials from the list of standards‐aligned materials that have been adopted by the State Board of Education. The district provides sufficient textbooks for all students to use in class and to take home in the core curriculum areas of reading/language arts, mathematics, science, and history/social studies. For 2010‐2011, instructional materials were provided for all students in grades K‐8. Replacements were provided for core curriculum areas as identified through a survey and other activities preceding the annual Instructional Materials Hearing at the September 28, 2010 meeting of the Board of Education.
Page 9 of 21

Section VIII - School Finances
Types of Services Funded (Fiscal Year 2009-10)
In addition to our comprehensive secondary education program designed to keep students in competitive standing for entrance into prestigious four year colleges and universities, we have many support programs as well.We have a fully functioning Wellness Center that contracts with dozens of Community Based Organizations in the city to provide support for students and their families. We have secured funding for an afterschool program that provides an array of activities for students to engage in after school and keep students off the street. We also have a immensely popular and fast growing Athletic Scholars Advancement Program (ASAP) that provides summer academic enrichment opportunities for students at college campuses all over the United States! ASAP serves any athlete at MHS which now includes well over half of the student body.In addition, we are one of only two high schools to receive the QEIA grant which allows us to have small class sizes for all of our students from 9th -12th grade and enusres that all of our faculty are highly trained and receive numerous hours of Professional Development yearly.
This section provides information about the programs and supplemental services that are available at the school and funded through either categorical or other sources.
Expenditures Per Pupil and School Site Teacher Salaries (Fiscal Year 2008-09)
$1,180School SiteDistrict
Level
$5,431 $4,251
$4,251
Total Expenditures
Per Pupil
Expenditures Per Pupil
Supplemental
Expenditures Per Pupil
Basic
Percent Difference - School Site and District 0%
$60,116$60,116
Average Teacher
Salary
0%
State $5,681
Percent Difference - School Site and State -25.2%$68,179-11.8%----
------------
----------------
This table displays a comparison of the school's per pupil expeditures from unrestricted (basic) sources with other schools in the district and throughout the state, and a comparison of the average teacher salary at the school site with
all schools in the district equally has been used. Detailed information regarding school expenditures and teacher salaries can be found at the CDE Web site at http://www.cde.ca.gov/ds/fd/ec/ and http://www.cde.ca.gov/ds/fd/cs/.
average teacher salaries at the district and state levels. The option to report expenditures and salaries for the benefit of
$42,377$67,667
Beginning Teacher SalaryMid-Range Teacher Salary
Category$39,774$64,207
District AmountState Average For Districts
In Same Category
$87,102$108,894
Highest Teacher SalaryAverage Principal Salary (Elementary)
$77,630$97,642
$113,713$124,531
Average Principal Salary (Middle)Average Principal Salary (High)
$101,073$106,144
$223,323Superintendent Salary $296,768Not availableNot available
Percent of Budget for Teacher SalariesPercent of Budget for Administrative Salaries
Not availableNot available
Teacher and Administrative Salaries (Fiscal Year 2008-09)This table displays district-level salary information for teachers, principals, and superintendents, and compares thesefigures to the state averages for districts of the same type and size. The table also displays teacher and administrative salaries as a percent of a district's budget, and compares these figures to the state averages for districts of the same typeand size. Detailed information regarding salaries can be found at the CDE Web site at http://www.cde.ca.gov/ds/fd/cs/.
Page 10 of 21

Page 11 of 21

Section IX - Student Performance
STAR Results for All Students - Three-Year ComparisonThis table displays the percent of students achieving at the Proficient or Advanced level (meeting or exceedingthe state standards).
19
13
22
17
English-Language Arts
Mathematics
ScienceHistory-Social Science
Subject 17
7
18
13
28
17
27
25
53
52
52
45
51
51
51
42
55
54
59
49
50
46
50
41
46
43
46
36
52
48
54
44
School District State 07-08 08-09 09-10 07-08 08-09 09-10 07-08 08-09 09-10
Standardized Testing and Reporting ProgramThe Standardized Testing and Reporting (STAR) Program consists of several key components, including the California Standards Tests (CSTs); The California Modified Assessment (CMA), and the California Alternate Perfomance Assessment (CAPA). The CSTs show how well students are doing in relation to the state content standards. The CSTsinclude English-language arts (ELA) and mathematics in grades 2 through 11; science in grades 5, 8 and 9-11; and history-social science in grades 8 and 10-11. The CAPA includes ELA, mathematics, and science in grades 2-11, and for science for grades 5, 8 and 10. The CAPA is given to those students with significant cognitive disabilities which prevent them from taking either the CSTs with accommodations or modifications or the CMA with accommodations. The CMAincludes ELA and mathematics for grades 3-8 and science in grade 5 and is an alternative assessment that is based on modified achievement standards. The CMA is designed to assess those students whose disabilities preclude them from achieving grade-level proficiency on an assessment of the California content standards with or without accommodations.Student scores are reported as performance levels. Detailed information regarding the STAR program results for eachgrade and performance level, including percents of students not tested, can be found on the CDE Standardized Testing and Reporting (STAR) results web site at http://star.cde.ca.gov. Program information regarding the STAR program can be found in the Explaining 2008 STAR Program Summary Results to the Public guide at http://www.cde.ca.gov/ta/tg/sr/documents/starpkt5intrpts.pdf. Note: Scores are not shown when the number of students tested is ten or less, either because the number of students in this category is too small for statistical accuracy or toprotect student privacy. In no case shall any group score be reported that would deliberately or inadvertently make public the score or performance of any individual student.
Page 12 of 21

Standardized Testing Reporting Results by Student Group - Most Recent Year This table displays the percent of students, by group, achieving at the Proficient or Advanced level (meeting orexceeding the state standards) for the most recent testing period.
African AmericanAmerican Indian or Alaska Native
AsianFilipino
Group13*4725
English-Language Arts
Hispanic or LatinoPacific Islander
White (not Hispanic)
18*65
% of Students Scoring at Proficient or Advanced
7*3811
Mathematics
5*32
24*42*
Science
19
*
24*3331
History-Social Science
19
53Male
FemaleEconomically Disadvantaged
English Learners
28292811
Students with DisabilitiesStudents Receiving Migrant Education
Services
33*
1716161330*
3618271527*
2823261218*
CAHSEE Results for All Students - Three-Year ComparisonThis table displays the percent of students achieving at the Proficient or Advanced level in ELA and mathematics.
22
27
English-Language Arts
Mathematics
Subject 22
27
29
39
55
62
55
62
60
63
53
51
53
51
54
53
School District State 07-08 08-09 09-10 07-08 08-09 09-10 07-08 08-09 09-10
California High School Exit ExaminationThe California High School Exit Examination (CAHSEE) is primarily used as a graduation requirement. However, thegrade 10 results of this exam are also used to establish the percentages of students at 3 proficiency levels (not proficientproficient, or advanced) in ELA and mathematics in order to compute Adequate Yearly Progress (AYP) designationsas required by the federal NCLB Act of 2001. Detailed information regarding CAHSEE results can be found at the CDweb site at http://cahsee.cde.ca.gov/. Note: Scores are not shown when the number of students tested is 10 or less,either because the number of students in this category is too small for statistical accuracy, or to protect student privacy.
Page 13 of 21

Section X (Accountability) begins on next page.
California Physical Fitness Test Results (School Year 2008-09)
Grade 5Grade 7Grade 9
Grade Level 0.0
0.023.4
Four of Six Standards
The California Physical Fitness Test is administered to students in grades 5, 7, and 9 only. This table displays by grade level the percent of students meeting fitness standards for the most recent testing period. Detailed information regardingthis test, and comparisons of a school's test results to the district and state levels, may be found at the CDE web site at http://www.cde.ca.gov/ta/tg/pf/. Note: To protect student privacy, scores are not shown when the number of students tested is 10 or less.
0.0
0.029.9
Five of Six Standards0.0
0.035.0
Six of Six StandardsPercent of Students Meeting Fitness Standards
CAHSEE Results by Student Group - Most Recent YearThis table displays the percent of students, by group, achieving at each performance level in English-language arts and mathematics for the most recent testing period.
African AmericanAmerican Indian or Alaska Native
AsianFilipino
Group
63.6*65*
Not Prof
Hispanic or LatinoPacific Islander
White (not Hispanic)
78*
English-Language Arts
21.2*
10*
Proficient
16*
15.2*
26*
Advanced
6*
Male 72Female 70
1714
1116
Economically DisadvantagedEnglish Learners
Students with DisabilitiesMigrant Education Services
7388
86.7*
16116.7*
111
6.7*
70.6*
32*
Not Prof
68*
Mathematics
26.5*
32*
Proficient
27*
2.9*36*
Advanced
5*
6062
3025
1013
6168
82.4*
2824
11.8*
127
5.9*
All Students 71 16 13 61 28 11
Page 14 of 21

Section X - AccountabilityAcademic Performance IndexThe Academic Performance Index (API) is an annual measure of the academic performance and progress of schoolsin California. API scores range from 200 to 1,000, with a statewide target of 800. Detailed information about the APIcan be found at the CDE Web site at http://www.cde.ca.gov/ta/ac/ap/.
API Ranks - Three-Year ComparisonThis table displays the school's statewide and similar schools API ranks. The statewide API rank ranges form 1 to 10. A statewide rank of 1 means that the school has an API score in the lowest 10 percent of all schools in the state, while astatewide rank of 10 means that the school has an API score in the highest 10 percent of all schools in the state. The similar schools API rank reflects how a school compares to 100 statistically matched "similar schools". A similar schoolrank of 1 means that the school's academic performance is comparable to the lowest performing 10 schools of the 100similar schools, while a similar schools rank of 10 means that the school's academic performance is better than at least 90 of the 100 similar schools.
StatewideSimilar Schools
API Rank13
2007
11
2008
11
2009
API Growth by Student Group - Three-Year ComparisonThis table displays by student group the actual API changes in points added or lost for the past three years, and the most recent API score. Note: Results for numerically significant student groups only.
All Students at the SchoolAfrican American
American Indian or Alaska NativeAsian
Group-3118
-47
2007-08
Filipino
Hispanic or LatinoPacific Islander
-30
Actual API Change
10-1
17
2008-09
23
7065
AS
2009-10
71
White (not Hispanic)
Socioeconomically Disadvantaged
English Learners
Students with Disabilities
-18
-37
31
32
69
53
API Growth by Student Group - 2010 Growth ComparisonThis table displays by student group the 2010 Growth API at the school, LEA, and state level.
Page 15 of 21

OverallParticipation Rate - English-Language Arts
AYP CriteriaNoNo
NoYes
School District
Participation Rate - MathematicsPercent Proficient - English-Language Arts
No YesNo
Percent Proficient - Mathematics No
AYP Overall and by Criteria (2009-10)This table displays an indication of whether the school and the district made AYP overall and whether the school and the district met each of the AYP criteria.
Adequate Yearly ProgressThe federal NCLB Act requires that all schools and districts meet the following Adequate Yearly Progress (AYP)
1) Participation rate on the state's standards-based assessments in English-language arts (ELA) and mathematics 2) Percent proficient on the state's standards-based assessments in ELA and mathematics 3) API as an additional indicator 4) Graduation rate (for secondary schools)Detailed information about AYP, including participation rates and percent proficient results by student group, can be found at the CDE Web site at http://www.cde.ca.gov/ta/ac/ay.
NoNo
API YesGraduation Rate Pend
YesNo
criteria:
All Students at the SchoolAfrican American
American Indian or Alaska NativeAsian
Group625505
712
School
Filipino
Hispanic or LatinoPacific Islander
512
2010 Growth API
791615730869
LEA
788
675654
767685728889
State
851
715754
White (not Hispanic)
Socioeconomically Disadvantaged
English Learners
Students with Disabilities
559
532
876
759
735
574
838
712
691
580
Page 16 of 21

Program Improvement StatusFirst Year of Program Improvement
Indicator In PI
2006-2007
School District
Year in Program ImprovementNumber of Schools Currently in Program Improvement
Year 332
Percent of Schools Currently in Program Improvement 29--------
Federal Intervention Program (School Year 2010-11)Schools and districts receiving federal Title I funding enter Program Improvement (PI) if they do not make AYP for twoconsecutive years in the same content area (English-language arts or mathematics) or on the same indicator (API or graduation rate). After entering PI, schools and districts advance to the next level of intervention with each additionalyear that they do not make AYP. Detailed information about PI indentification can be found at the CDE Web site athttp://www.cde.ca.gov/ta/ac/ay/.
Page 17 of 21

Section XI - School Completion and Postsecondary PreparationAdmission Requirements for California Public Universities
Admission requirements for the University of California (UC) follow guidelines set forth in the Master Plan, which requires that the top one-eighth of the state's high school graduates, as well as those transfer students who have successfully completed specified college work, be eligible for admission to the UC. These requirements are designed to ensure that all eligible students are adequately prepared for University-level work. For general admissions requirements please visit the University of California Web site at http://www.universityofcalifornia.edu/admissions/general.html.
University of California
Admission requirements for the Calfornia State University (CSU) use three factors to determine eligibility. They arespecific high school courses; grades in specified courses and test scores; and graduation from high school. Somecampuses have higher standards for particular majors or students who live outside the local campus area. Because of thenumber of students who apply, a few campuses have higher standards (supplementary admission criteria) for all applicantsMost CSU campuses utilize local admission guarantee policies for students who graduate or transfer from high schooland colleges that are historically served by a CSU campus in that region. For general admissions requirements pleasevisit the California State University Web site at http://www.calstate.edu/admission/.
California State University
960
Dropout Rate (1 year)Graduation Rate
Indicator 7
76275
584
586
283
480
481
678
School District State 06-07 07-08 08-09 06-07 07-08 08-09 06-07 07-08 08-09
Dropout Rate and Graduation RateThis table displays the school's one-year dropout rates and graduation rates for the most recent three-year period. Forcomparison purposes, data are also provided at the district and state levels. Detailed information about dropout rates and graduation rates can be found at the CDE Web site at http://dq.cde.ca.gov/dataquest/.
Completion of High School Graduation Requirements (School Year 2009-10)Students in California public schools must pass both the English-language arts and mathematics portions of the CaliforniaHigh School Exit Exam (CAHSEE) to receive a high school diploma. For students who began in 09-10 school year in the12th grade, as evidenced by that school year's October CBEDS enrollment, the table displays by student group the percent who met all state and local graduation requirements for grade 12 completion, including having passed both portions ofthe CAHSEE or received a local waiver or state exemption. Detailed information about the CAHSEE can be found at the CDE Web site at http://www.cde.ca.gov/ta/tg/hs/. Note: 'N/A' means that the student group is not numerically significant
Next page.....
Page 18 of 21

Career Technical Education Programs (School Year 2009-10)The section provides information about the Career Technical Education (CTE) programs.
The Career Technical Education Program (formerly called School-to-Career) is a sequence of courses that provides students with a coherent and rigourous content aligned with challenging academic standards and relevanttechnical knowledge and skills needed to prepare for further education and careers in current or emergingprofessions.
All StudentsAfrican American
American Indian or Alaska NativeAsian
Group75.979.3
100.080.3
School %
FilipinoHispanic or Latino
Pacific Islander
71.474.5
100.0
Graduating Class of 2010
88.376.1100.092.9
District %
89.880.277.8
UnavailableUnavailableUnavailableUnavailable
State %
UnavailableUnavailableUnavailable
White (not Hispanic) 61.9Socioeconomically Disadvantaged
English LearnersStudents with Disabilities
77.571.343.3
86.289.076.659.8
UnavailableUnavailableUnavailableUnavailable
Career Technical Education Participation (School Year 2009-10)
Number of PupilsPercent of pupils completing a CTE program and
earning a high school diploma
Measure456
87.5
CTE Program Participation
This table displays information about participation in the school's CTE programs.
Percent of CTE courses sequenced or articulated between the school and institutions of
postsecondary education
na
Page 19 of 21

Section XII (Instructional Planning) begins on next page.
Courses for University of California and/or California State University Admission
Students Enrolled in Courses Required for UC/CSU AdmissionGraduates Who Completed All Courses Required for UC/CSU Admission
Indicator
73.535.6
Percent
This table displays for the most recent year two measures related to the school's courses that are required for Universityof California (UC) and/or California State University (CSU) admission. Detailed information about student enrollment in and completion of courses required for UC/CSU admission can be found at the CDE Web site athttp://dq.cde.ca.gov/dataquest/.
Computer ScienceEnglish
Subject
1
Number of AP Classes Offered
Percent of Students in AP Courses
Fine and Performing ArtsForeign Language
Mathematics
Advanced Placement Courses This table displays for the most recent year the number of Advanced Placement (AP) courses that the school offered bysubject and the percent of the school's students enrolled in all AP courses. Detailed information about student enrollmentin AP courses can be found at the CDE Web site at http://dq.cde.ca.gov/dataquest/.
54
ScienceSocial Science
12
All Courses 5.813
----------------------------
Page 20 of 21

Section XII - Instructional Planning and Scheduling
This section provides information about the program for training the school's teachers and other professional staff.
Professional Development
Professional development is a part of every site plan and a major component of instructional support to departments.The district's professional development program provides opportunities for teachers to implement the district's corecurriculum for all students, update subject area expertise, use data to plan instructional improvement strategies andacquire new instructional strategies. Leadership development across content areas is facilitated centrally, and foreducators and parents each school continues to provide three full days of professional development during the academic year.
End of SARC Document.
Page 21 of 21