why is the benthos important? or - south bay salt pond ... · why is the benthos important? or pre-...
TRANSCRIPT

Why is the Benthos Important? OR
Pre- and Post- Salt Pond Restoration Assessment of Benthic Communities in South San Francisco Bay
Jan Thompson and Francis Parchaso Menlo Park, USGS

Benthic communities integrate ecosystem processes over wide spatial and temporal scales
• Therefore benthos are a critical part of the ecosystem that can help us understand if ecosystem function has changed.
• Preliminary results: an example of how a change in relative abundance or change of species can change function of the community.
To start - What is the ecosystem function of the benthic community?

Depth of animal determines predator
1. Benthic animals are important prey in the subtidal and intertidal regions
Oxidized Sediment
Anoxic Sediment
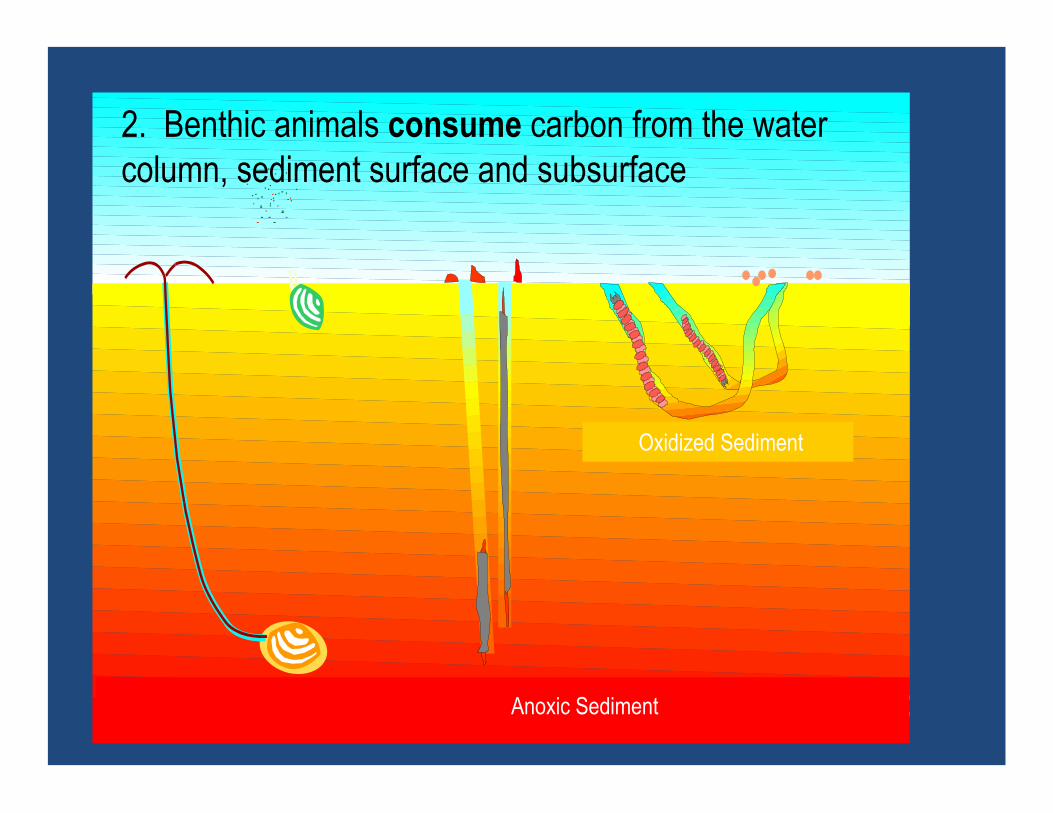
2. Benthic animals consume carbon from the water column, sediment surface and subsurface

Oxidized Sediment
Anoxic Sediment
2b. Burrowing and feeding mixes sediment and influences geochemical processing
Nitrogen

Higher Se Transfer
Lower Se Transfer
Courtesy Robin Stewart USGS, Menlo Park
3. Benthic animals are a vector for contaminants into the food web.

Have any of these benthic functions changed due to restoration? We start by looking at 1993-1995 and 2006-2009 benthic community structure and function.
We need to know who the animals are to define their position in the functioning ecosystem.
USGS

What they eat determines their position in food web and contaminant exposure.
Where they live limits their predators.
We then need to establish how & where the animals live before examining our 3 ecosystem functions (prey, consumer, vector).

1. Prey: Benthic community structure (species, size, habitat) limits predators.
Depth of animal determines predator
vims.edu
http://www.flickr.com/photos/8535738@N08/3312724793
USGS
USGS
USGS
http://farm3.static.flickr.com/2468/3859509675_eb9c2fa0a3.jpg

An example of what we can learn: We will explore the ecosystem effects of the recent change in abundance of the large species of bivalves in this system.

Bivalve biomass in shallows of South Bay are reduced each winter by seasonal bird and fish predation.
Poulton et al 2004 Thompson 2005, Thompson et al 2008
What we know: Bivalves have been a major prey source for birds and fish.
Biva
lve G
razin
g Rate
(m/d)

1980 1985 1990 1995 2000 2005
Benthic Predators
Cloern et al 2007 NCEAS Workgroup
What we know: Decadal scale changes in predators with ocean life stages may reduce/increase bivalve biomass
?

What we have learned so far: Bivalves have returned to the channel some years, less frequently in the shoals.
Pre-restoration
Post-restoration

What we have learned so far: Offshore predator patterns will complicate our understanding of restoration effects.
Pre-restoration
Post-restoration

‘95
‘06
An observation/question : Bivalves came back in the south more strongly than in the north and disappeared earlier in 2006 than in 1995. Is this relevant?
Bivalve Biomass Spring Summer Fall

An observation/question: Have surface deposit/filter feeding amphipods replaced the bivalves?
Filter Feeding Amphipod Filter Feeding Bivalves Filter Feeding Gemma gemma Subsurface Deposit Feeding Worms Surface Deposit Feeding Bivalves Surface Deposit/Filter Crustacean Surface Deposit Feeding Worms
April 2006
October 2006
Is that good?

Future Question: How do these kinds of bivalve dynamics affect/reflect their predators success?
http://www.flickr.com/photos/8535738@N08/3312724793
?
? ?
?

Mon
thly
Ave
rage
G
razi
ng R
ate
(m3
/m
2/d
)
2. Consumers: What we have learned so far: Bivalve mortality, due to winter predation, allows an annual spring phytoplankton bloom to develop.
Mon
thly
Av
erag
e
Chl a
(µg/
L) Average
Phytoplankton Biomass
Average Bivalve Grazing Rate
Thompson et al 2008

http://sfbay.wr.usgs.gov/access/wqdata/index.html
Phyto
plank
ton B
iomas
s
(Chlo
roph
yll a
mg/L)
What we have learned so far: Phytoplankton biomass has increased since the decline in bivalves. Bivalve absence is likely to be part of the cause.

Courtesy of Robin Stewart Stewart et al 2004
Dietary Threshold: 4.7-7.3µg g-1 dry wt
8-12 µg g-1 dry wt
3. Contaminant Vector- What we have learned so far: Species matter - Se concentrations in Corbula exceed the dietary toxicity threshold for birds and fish.

Minimum grazing in
spring Maximum biomass when
[Se] and predation is highest
What we have learned so far: Seasonal cycles of growth and predation matter.

Goal: We look at the benthos as an integrative component of the ecosystem that will reflect changes in function at a much broader scale than just the benthos.
Goal: Introduce some of our preliminary findings as an example of how we will do these analyses
Thanks for your attention

Thanks to our funding sources
• South Bay Salt Pond Restoration Project BWAS 2009-021
• USGS Toxics Program • USGS NRP Research Program • USGS Priority Ecosystem Studies Program