why gizmos work - explorelearning
TRANSCRIPT
WHY GIZMOSTM WORK: Empirical Evidence for the Instructional Effectiveness Of ExploreLearning’s Interactive Content Paul Cholmsky Director of Research & Design ExploreLearning December 2003
2 Table of Contents 1. Introduction ...................................................................................................................3
1.1 What is ‘empirical evidence of instructional effectiveness’? ...................................3 1.2 Why is empirical evidence of instructional effectiveness important?......................3 1.3 What kinds of empirical evidence are acceptable? ................................................4 1.4 How can a research-based consensus in the scientific literature be identified? ....4
2. Research-validated instructional techniques.................................................................5 2.1 Representing new knowledge in graphic/nonlinguistic formats ..............................7 2.2 Using manipulatives to explore new knowledge and practice applying it .............12 2.3 Generating and testing hypotheses about new knowledge ..................................17 2.4 Direct presentation, followed by application .........................................................19
3. Summary.....................................................................................................................21 4. References..................................................................................................................22 Complete list of Gizmos on ExploreLearning.com ..........................................................23
3 1. Introduction
Meta-analysis of educational research provides empirical evidence for the instructional effectiveness of ExploreLearning’s Gizmos.
1.1 What is ‘empirical evidence of instructional effectiveness’? Empirical evidence of instructional effectiveness means that claims about the effectiveness of a given instructional method or product are substantiated by scientific research. This research should be based on experimental studies where the effects of specific variables on student performance are isolated and measured. Ideally, these studies are conducted in actual classrooms across several different school settings, in order to verify that the instructional method or product will be effective for a wide range of students.
1.2 Why is empirical evidence of instructional effectiveness important?
Grounding instructional decisions in scientific research reduces the influence of pedagogical fads and gurus. Rather than struggling to constantly change and adapt to ‘the latest thing’, teachers can base their teaching methods on specific pedagogical principles that have been demonstrated to be successful. These research-validated methods provide a solid foundation upon which teachers can build and adapt their own teaching styles to best respond to the diverse needs of their students. The importance of using scientific research to drive educational decision-making has recently been ratified into law. The No Child Left Behind Act of 2001 (NCLB), which reauthorized the Elementary and Secondary Education Act, requires that "scientifically based research" be used as the basis for decisions about instructional methods and about federally-funded education programs in general. The strong emphasis placed on scientifically based research is evident from the fact that the phrase appears more than 100 times in the NCLB legislation (Neuman, 2002). The NCLB legislation also mandates that scientific research be factored into decisions regarding which educational products and technologies get adopted and used in K-12 classrooms. Educational technology can play an important role in disseminating best practices, because it can make research-validated instructional methods more practical to implement in the classroom on a regular basis. For example, teachers often struggle to incorporate opportunities for hands-on exploration of math and science concepts in their lesson plans due to time constraints. Well-designed computer simulations can make the incorporation of manipulatives in lesson plans much easier, and enable students to develop a richer and deeper conceptual understanding in a shorter period of time.
4 1.3 What kinds of empirical evidence are acceptable? According to the federally-funded paper, Using Research and Reason in Education: How Teachers Can Use Scientifically Based Research to Make Curricular & Instructional Decisions (Stanovich & Stanovich, 2003), empirical evidence of instructional effectiveness can come from any of the following sources:
• Demonstrated student achievement in formal testing situations implemented by the teacher, school district, or state;
• Published findings of research-based evidence that the instructional methods being used by teachers lead to student achievement; or
• Proof of reason-based practice that converges with a research-based consensus in the scientific literature.
1.4 How can a research-based consensus in the scientific literature be identified?
Scientific research is not infallible. There is always the possibility that individual studies may arrive at erroneous findings by chance or through experimenter error. Basing instructional practice on the results of a single study is therefore not advisable. However, asking educators to familiarize themselves with the literally thousands of research studies available on instructional methods is obviously not a feasible approach either. This challenge is not limited to educational research – the need to identify a research consensus from a large number of studies is common to most areas of scientific inquiry. To meet this need, a formal statistical method called meta-analysis has been developed for systematically comparing results across disparate studies. This method has been found to be very successful in medical research, and there is an increasing drive to make it the vehicle by which educational research is distilled for application in the nation’s classrooms.
More and more commentators on the educational research literature are calling for a greater emphasis on meta-analysis as a way of dampening the contentious disputes about conflicting studies that plague education and other behavioral sciences (Kavale & Forness, 1995; Rosnow & Rosenthal, 1989; Schmidt, 1996; Stanovich, 2001; Swanson, 1999). The method is useful for ending disputes that seem to be nothing more than a “he-said, she-said” debate. An emphasis on meta-analysis has often revealed that we actually have more stable and useful findings than is apparent from a perusal of the conflicts in our journals. (Stanovich & Stanovich , 2003, p.16-18)
This white paper is based on the findings reported in A Theory-Based Meta-Analysis of Research on Instruction (Marzano, 1998).
5
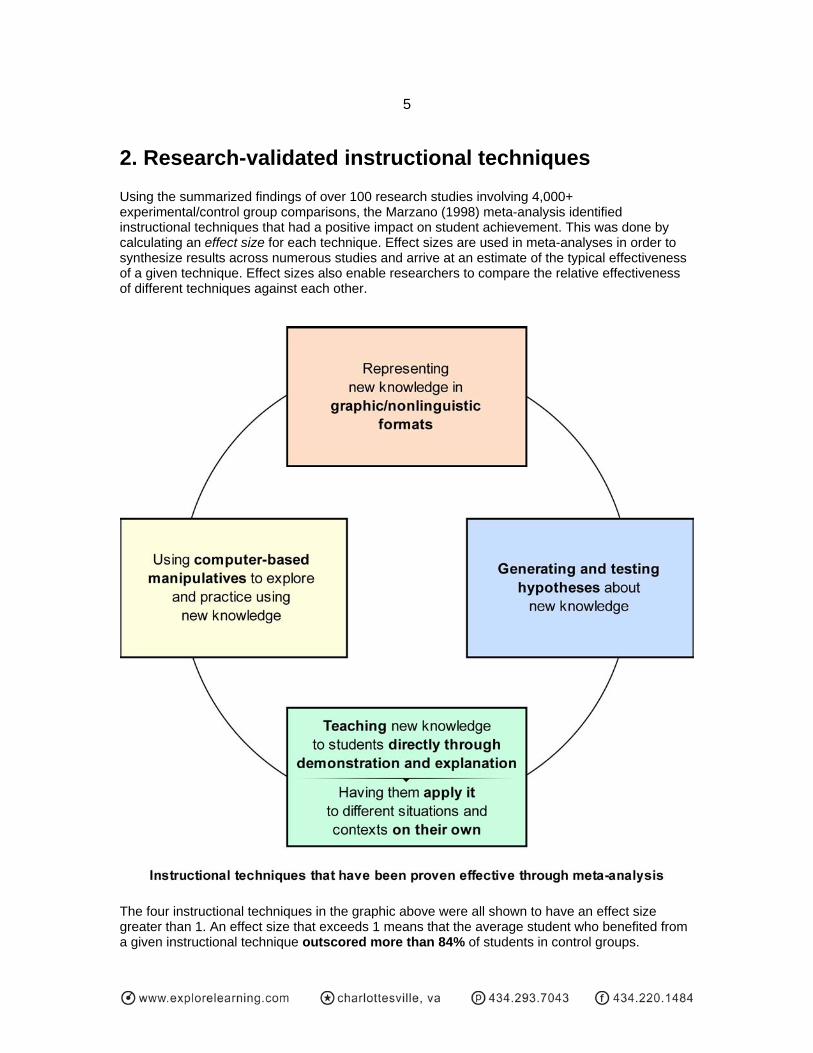
2. Research-validated instructional techniques Using the summarized findings of over 100 research studies involving 4,000+ experimental/control group comparisons, the Marzano (1998) meta-analysis identified instructional techniques that had a positive impact on student achievement. This was done by calculating an effect size for each technique. Effect sizes are used in meta-analyses in order to synthesize results across numerous studies and arrive at an estimate of the typical effectiveness of a given technique. Effect sizes also enable researchers to compare the relative effectiveness of different techniques against each other.
The four instructional techniques in the graphic above were all shown to have an effect size greater than 1. An effect size that exceeds 1 means that the average student who benefited from a given instructional technique outscored more than 84% of students in control groups.
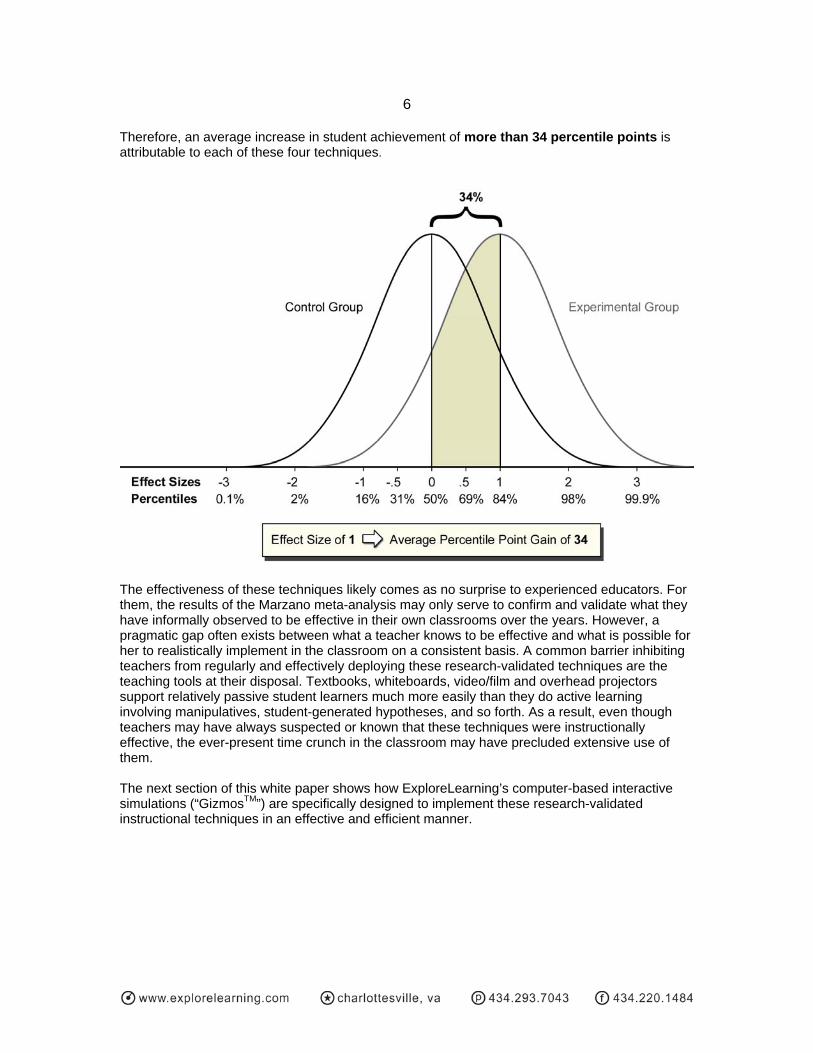
6 Therefore, an average increase in student achievement of more than 34 percentile points is attributable to each of these four techniques.
The effectiveness of these techniques likely comes as no surprise to experienced educators. For them, the results of the Marzano meta-analysis may only serve to confirm and validate what they have informally observed to be effective in their own classrooms over the years. However, a pragmatic gap often exists between what a teacher knows to be effective and what is possible for her to realistically implement in the classroom on a consistent basis. A common barrier inhibiting teachers from regularly and effectively deploying these research-validated techniques are the teaching tools at their disposal. Textbooks, whiteboards, video/film and overhead projectors support relatively passive student learners much more easily than they do active learning involving manipulatives, student-generated hypotheses, and so forth. As a result, even though teachers may have always suspected or known that these techniques were instructionally effective, the ever-present time crunch in the classroom may have precluded extensive use of them. The next section of this white paper shows how ExploreLearning’s computer-based interactive simulations (“GizmosTM”) are specifically designed to implement these research-validated instructional techniques in an effective and efficient manner.
7
2.1 Representing new knowledge in graphic/nonlinguistic formats
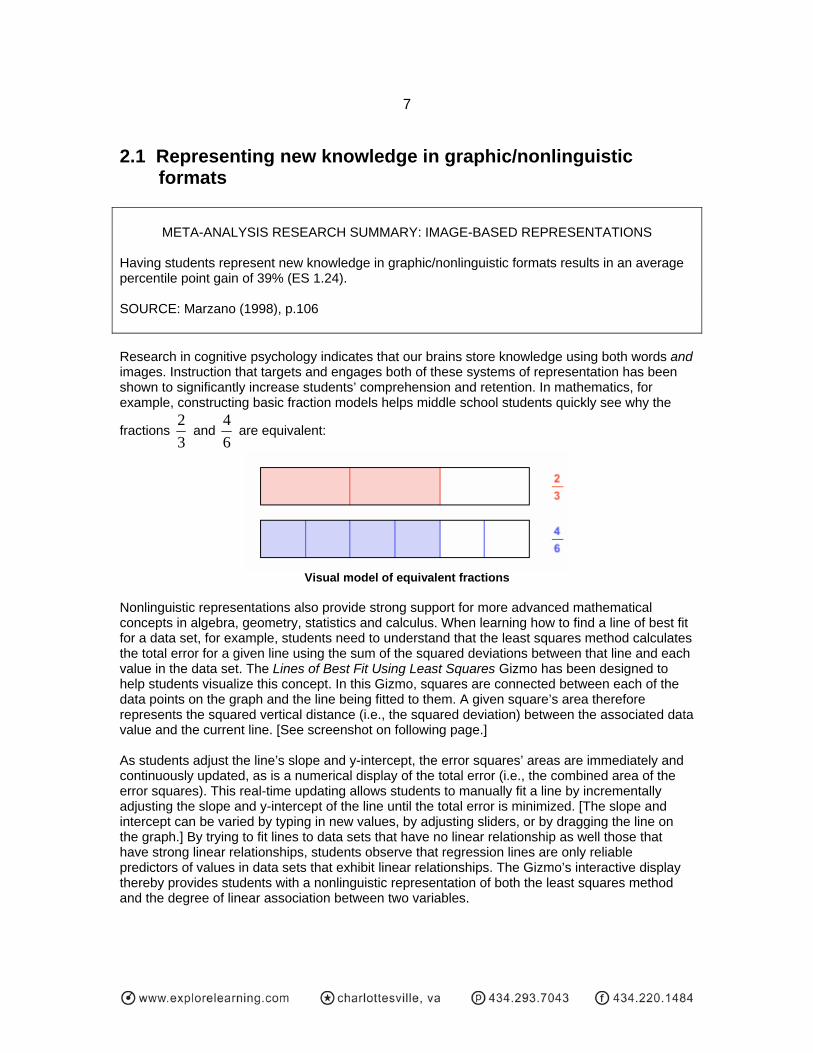
META-ANALYSIS RESEARCH SUMMARY: IMAGE-BASED REPRESENTATIONS Having students represent new knowledge in graphic/nonlinguistic formats results in an average percentile point gain of 39% (ES 1.24). SOURCE: Marzano (1998), p.106 Research in cognitive psychology indicates that our brains store knowledge using both words and images. Instruction that targets and engages both of these systems of representation has been shown to significantly increase students’ comprehension and retention. In mathematics, for example, constructing basic fraction models helps middle school students quickly see why the
fractions 32
and 64
are equivalent:
Visual model of equivalent fractions
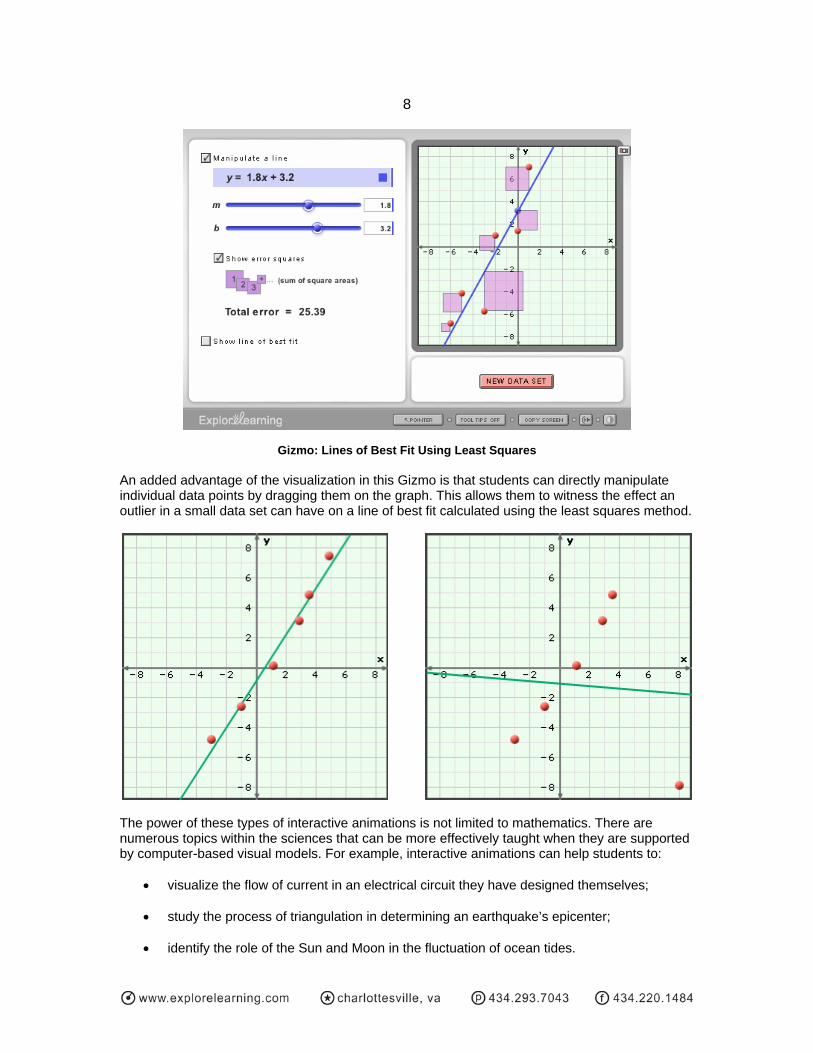
Nonlinguistic representations also provide strong support for more advanced mathematical concepts in algebra, geometry, statistics and calculus. When learning how to find a line of best fit for a data set, for example, students need to understand that the least squares method calculates the total error for a given line using the sum of the squared deviations between that line and each value in the data set. The Lines of Best Fit Using Least Squares Gizmo has been designed to help students visualize this concept. In this Gizmo, squares are connected between each of the data points on the graph and the line being fitted to them. A given square’s area therefore represents the squared vertical distance (i.e., the squared deviation) between the associated data value and the current line. [See screenshot on following page.] As students adjust the line’s slope and y-intercept, the error squares’ areas are immediately and continuously updated, as is a numerical display of the total error (i.e., the combined area of the error squares). This real-time updating allows students to manually fit a line by incrementally adjusting the slope and y-intercept of the line until the total error is minimized. [The slope and intercept can be varied by typing in new values, by adjusting sliders, or by dragging the line on the graph.] By trying to fit lines to data sets that have no linear relationship as well those that have strong linear relationships, students observe that regression lines are only reliable predictors of values in data sets that exhibit linear relationships. The Gizmo’s interactive display thereby provides students with a nonlinguistic representation of both the least squares method and the degree of linear association between two variables.
8
Gizmo: Lines of Best Fit Using Least Squares An added advantage of the visualization in this Gizmo is that students can directly manipulate individual data points by dragging them on the graph. This allows them to witness the effect an outlier in a small data set can have on a line of best fit calculated using the least squares method.
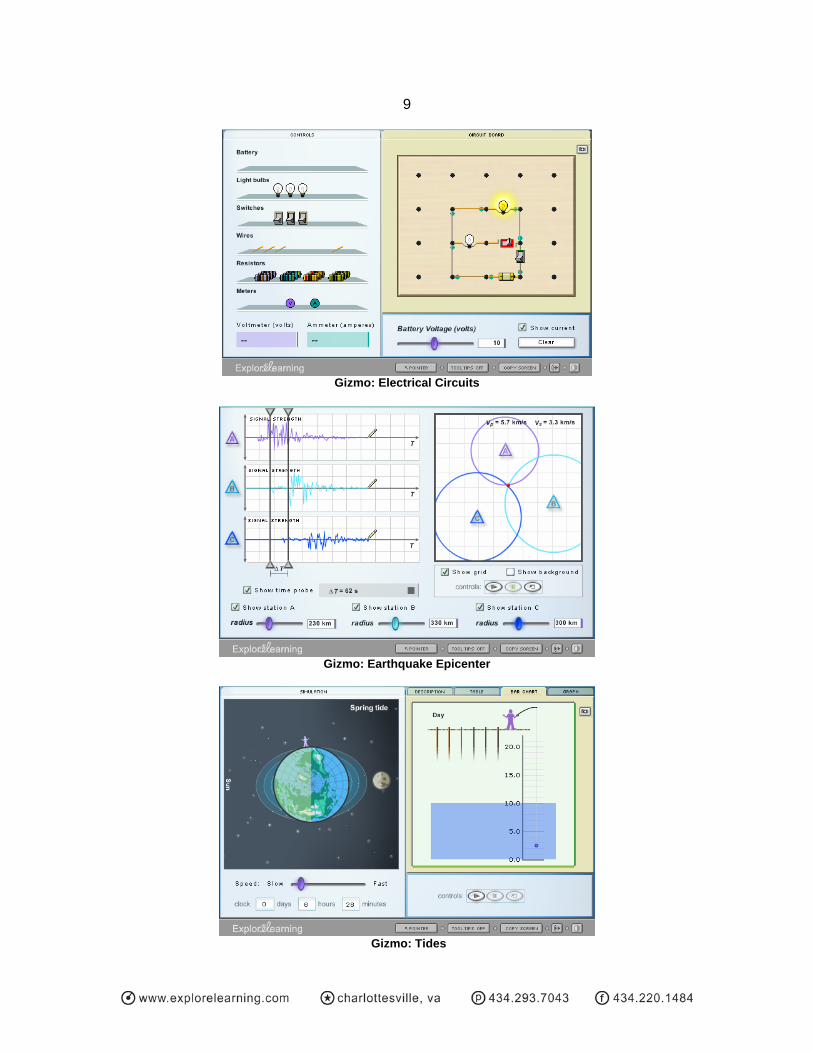
The power of these types of interactive animations is not limited to mathematics. There are numerous topics within the sciences that can be more effectively taught when they are supported by computer-based visual models. For example, interactive animations can help students to:
• visualize the flow of current in an electrical circuit they have designed themselves;
• study the process of triangulation in determining an earthquake’s epicenter;
• identify the role of the Sun and Moon in the fluctuation of ocean tides.
9
Gizmo: Electrical Circuits
Gizmo: Earthquake Epicenter
Gizmo: Tides

10 When students are guided in generating and exploring nonlinguistic representations, the research shows that the effects on achievement are dramatic. As noted by Marzano in his meta-analysis, explicitly engaging students in the creation and usage of nonlinguistic representation has even been shown to stimulate and increase activity in the brain (Gerlic & Jausovec, 1999). Unfortunately, research on actual classroom practice has also consistently shown a predominant emphasis on linguistic presentations of new knowledge to students (Marzano, Gaddy & Dean, 2000). Although many math and science textbooks have increased the number of images, diagrams, and other graphics on their pages in recent years, the fact that these visual representations cannot incorporate motion or be interactive constrains their instructional power. The pressure on educational publishers to keep page counts down in order to control costs also places a limit on the number of visuals that can be feasibly included in print-based materials. Although most teachers incorporate a certain number of visual representations into their teaching using whiteboards or overheads, it is often cumbersome and time-consuming to use these tools to enrich instruction with visuals in a comprehensive manner. From a practical standpoint, computer-based simulations are the ideal medium for visualizations of mathematical and scientific concepts. An additional benefit of ExploreLearning’s visual models is that they are user-manipulable, unlike video or film. Gizmos enable teachers and students to quickly progress through many different concepts or scenarios in a single session, dramatically expanding the range of what can be shown, explained, and explored in the classroom. Classroom discussions become more interactive and responsive to students’ specific interests and difficulties, since their questions can be immediately examined and answered using manipulable visual models. Then, when students are studying on their own, Gizmos let them become active and engaged learners rather than passive observers of sequences of images in a textbook. Research also shows how teachers can help students take full advantage of nonlinguistic representations by guiding them to incorporate visual models, diagrams and images into their study habits. The What Works in Classroom Instruction report (Marzano, Gaddy & Dean, 2000, p.40-47) stresses the importance of including diagrams and other images in note-taking:
A very flexible note-taking strategy…is referred to as a combination technique….To use this note-taking strategy, students must stop periodically and make a graphic representation of their notes or portray the information in some visual way. At the end of their note-taking, or periodically throughout the process, students record summary statements of what they have learned….This note-taking method takes extra time, but is very useful because students review the information a number of times — first, as they record their notes; second, as they create drawings or other graphics for their notes; and third, as they record summary statements of what they have learned. …one of the common misconceptions about note-taking is that “less is more.”…Researchers Nye, Crooks, Powlie, and Tripp (1984) explain that their examination of guides prepared by universities to teach students how to take notes found that “five out of ten guides examined emphasized the importance of keeping notes ‘brief’ and not putting too much material in notes” (p. 95). Yet, in their study of the effects of note-taking, Nye et al. found a very strong relationship between the amount of information taken in notes and students’ achievement on examinations. (emphasis ours)
Note-taking strategies such as the combination technique are supported by the ‘Copy Screen’ button that is included in every ExploreLearning Gizmo. This button places a screenshot of the Gizmo into the computer’s clipboard. [Many Gizmos also include ‘camera’ buttons that allow individual graphs or diagrams to be copied as well.] This enables students to quickly and easily

11 paste images they generate using Gizmos into their notes or assignments. Teachers can also use this feature to add customized images to their own course materials or tests. In summary, ExploreLearning’s Gizmos allow teachers to richly infuse their mathematics and science courses with high-quality, easy-to-use visual models.
12
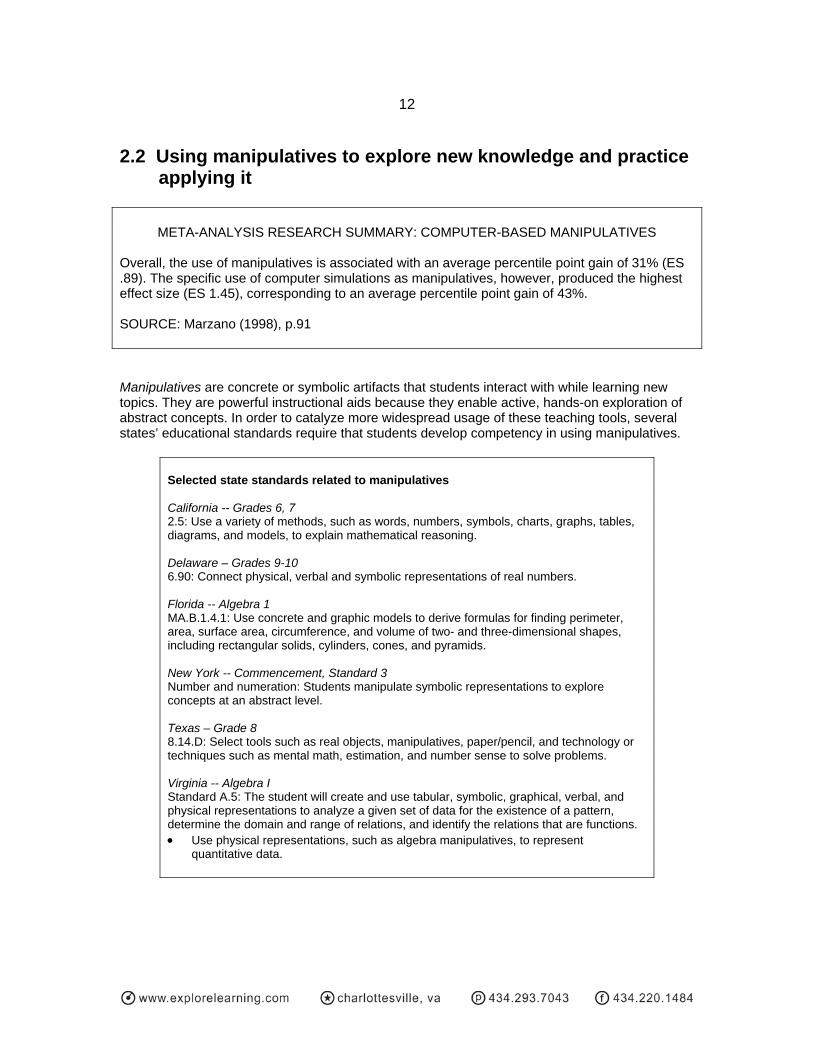
2.2 Using manipulatives to explore new knowledge and practice applying it
META-ANALYSIS RESEARCH SUMMARY: COMPUTER-BASED MANIPULATIVES Overall, the use of manipulatives is associated with an average percentile point gain of 31% (ES .89). The specific use of computer simulations as manipulatives, however, produced the highest effect size (ES 1.45), corresponding to an average percentile point gain of 43%. SOURCE: Marzano (1998), p.91 Manipulatives are concrete or symbolic artifacts that students interact with while learning new topics. They are powerful instructional aids because they enable active, hands-on exploration of abstract concepts. In order to catalyze more widespread usage of these teaching tools, several states’ educational standards require that students develop competency in using manipulatives.
Selected state standards related to manipulatives California -- Grades 6, 7 2.5: Use a variety of methods, such as words, numbers, symbols, charts, graphs, tables, diagrams, and models, to explain mathematical reasoning. Delaware – Grades 9-10 6.90: Connect physical, verbal and symbolic representations of real numbers. Florida -- Algebra 1 MA.B.1.4.1: Use concrete and graphic models to derive formulas for finding perimeter, area, surface area, circumference, and volume of two- and three-dimensional shapes, including rectangular solids, cylinders, cones, and pyramids. New York -- Commencement, Standard 3 Number and numeration: Students manipulate symbolic representations to explore concepts at an abstract level. Texas – Grade 8 8.14.D: Select tools such as real objects, manipulatives, paper/pencil, and technology or techniques such as mental math, estimation, and number sense to solve problems. Virginia -- Algebra I Standard A.5: The student will create and use tabular, symbolic, graphical, verbal, and physical representations to analyze a given set of data for the existence of a pattern, determine the domain and range of relations, and identify the relations that are functions. • Use physical representations, such as algebra manipulatives, to represent
quantitative data.

13 Research has shown that computer-based manipulatives are even more effective than ones involving physical objects. Some of the reasons for this increased effectiveness are outlined by Clements & McMillen (1996):
Computer manipulatives link the concrete and the symbolic by means of feedback. For example, a major advantage of the computer is the ability to associate active experience with manipulatives to symbolic representations. The computer connects manipulatives that students make, move, and change with numbers and words. Many students fail to relate their actions on manipulatives with the notation system used to describe these actions. The computer links the two. Computer manipulatives dynamically link multiple representations. Such computer links can help students connect many types of representations, such as pictures, tables, graphs, and equations…[allowing] students to see immediately the changes in a graph as they change data in a table. These links can also be dynamic. Students might stretch a computer geoboard's rectangle and see the measures of the sides, perimeter, and area change with their actions. Computers change the very nature of the manipulative. Students can do things [using computer-based manipulatives] that they cannot do with physical manipulatives.
The ExploreLearning library contains many examples of the optimal computer manipulative described by Clements and McMillen. For example, students learning about systems of linear equations can access several Gizmos that focus on this topic. Using these Gizmos, they can manipulate lines in their algebraic form or by dragging them directly on a graph, and instantly see the results of their actions as each of the multiple representations updates in real-time.
Gizmo: Solving Linear Systems by Graphing
14
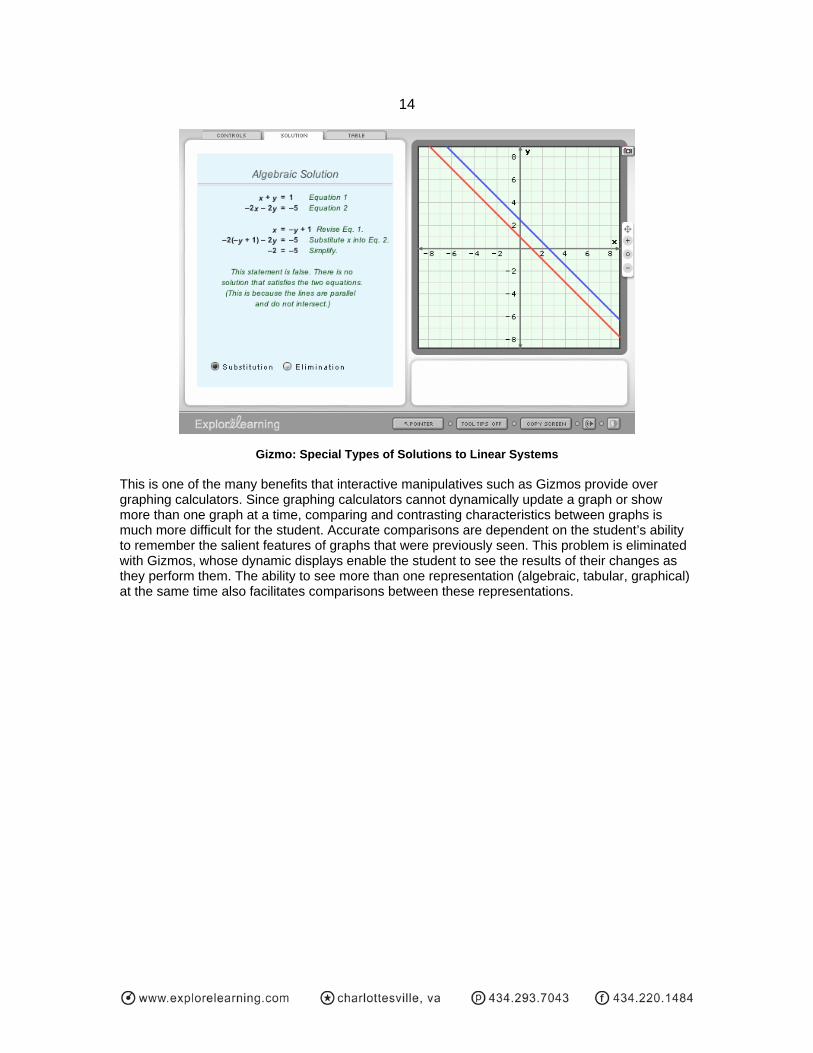
Gizmo: Special Types of Solutions to Linear Systems This is one of the many benefits that interactive manipulatives such as Gizmos provide over graphing calculators. Since graphing calculators cannot dynamically update a graph or show more than one graph at a time, comparing and contrasting characteristics between graphs is much more difficult for the student. Accurate comparisons are dependent on the student’s ability to remember the salient features of graphs that were previously seen. This problem is eliminated with Gizmos, whose dynamic displays enable the student to see the results of their changes as they perform them. The ability to see more than one representation (algebraic, tabular, graphical) at the same time also facilitates comparisons between these representations.
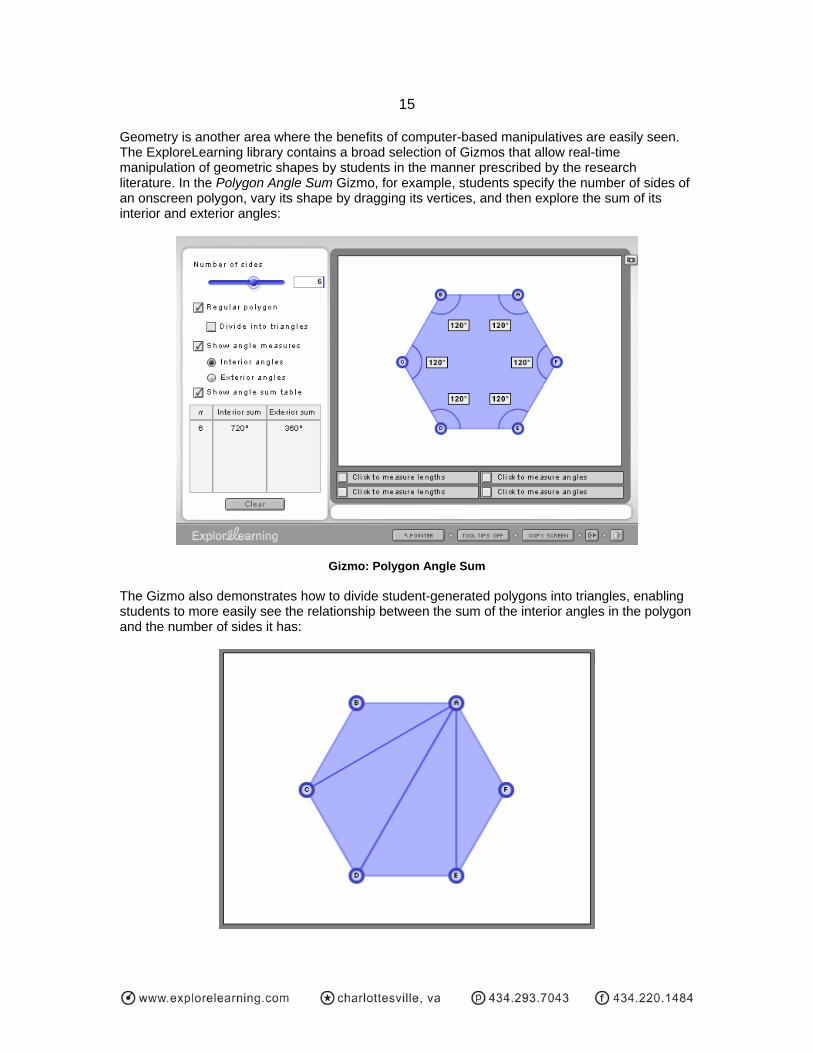
15 Geometry is another area where the benefits of computer-based manipulatives are easily seen. The ExploreLearning library contains a broad selection of Gizmos that allow real-time manipulation of geometric shapes by students in the manner prescribed by the research literature. In the Polygon Angle Sum Gizmo, for example, students specify the number of sides of an onscreen polygon, vary its shape by dragging its vertices, and then explore the sum of its interior and exterior angles:
Gizmo: Polygon Angle Sum The Gizmo also demonstrates how to divide student-generated polygons into triangles, enabling students to more easily see the relationship between the sum of the interior angles in the polygon and the number of sides it has:
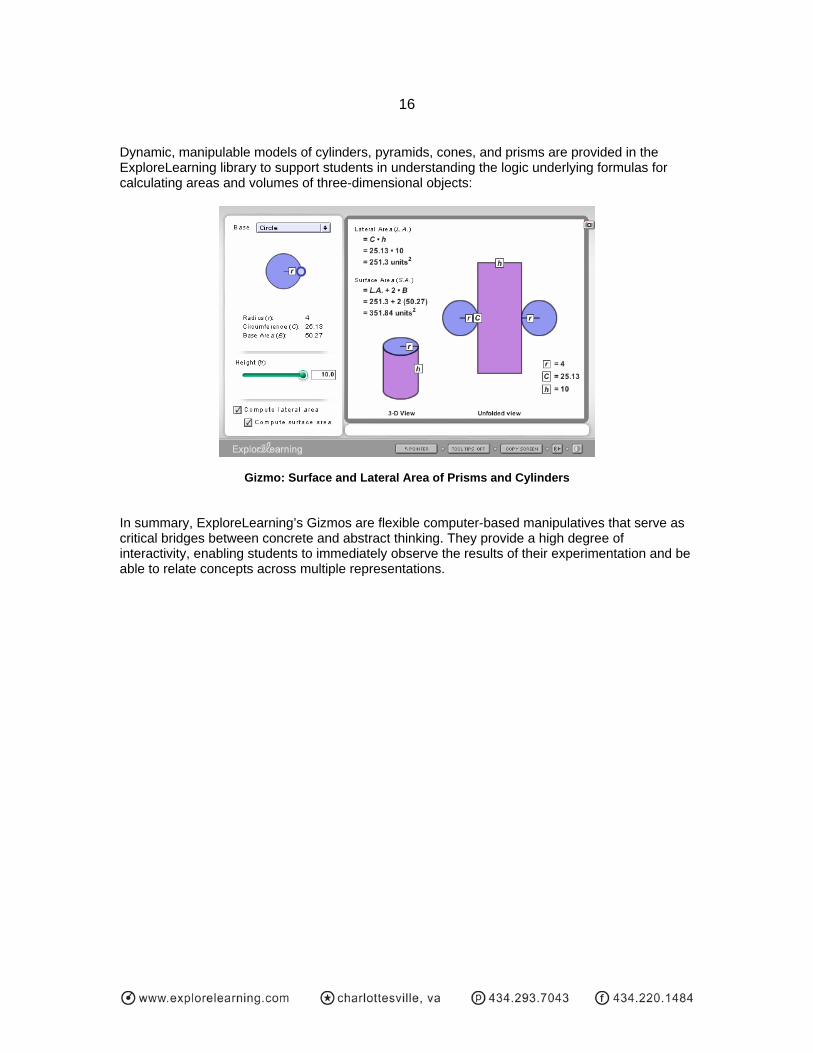
16 Dynamic, manipulable models of cylinders, pyramids, cones, and prisms are provided in the ExploreLearning library to support students in understanding the logic underlying formulas for calculating areas and volumes of three-dimensional objects:
Gizmo: Surface and Lateral Area of Prisms and Cylinders In summary, ExploreLearning’s Gizmos are flexible computer-based manipulatives that serve as critical bridges between concrete and abstract thinking. They provide a high degree of interactivity, enabling students to immediately observe the results of their experimentation and be able to relate concepts across multiple representations.
17
2.3 Generating and testing hypotheses about new knowledge
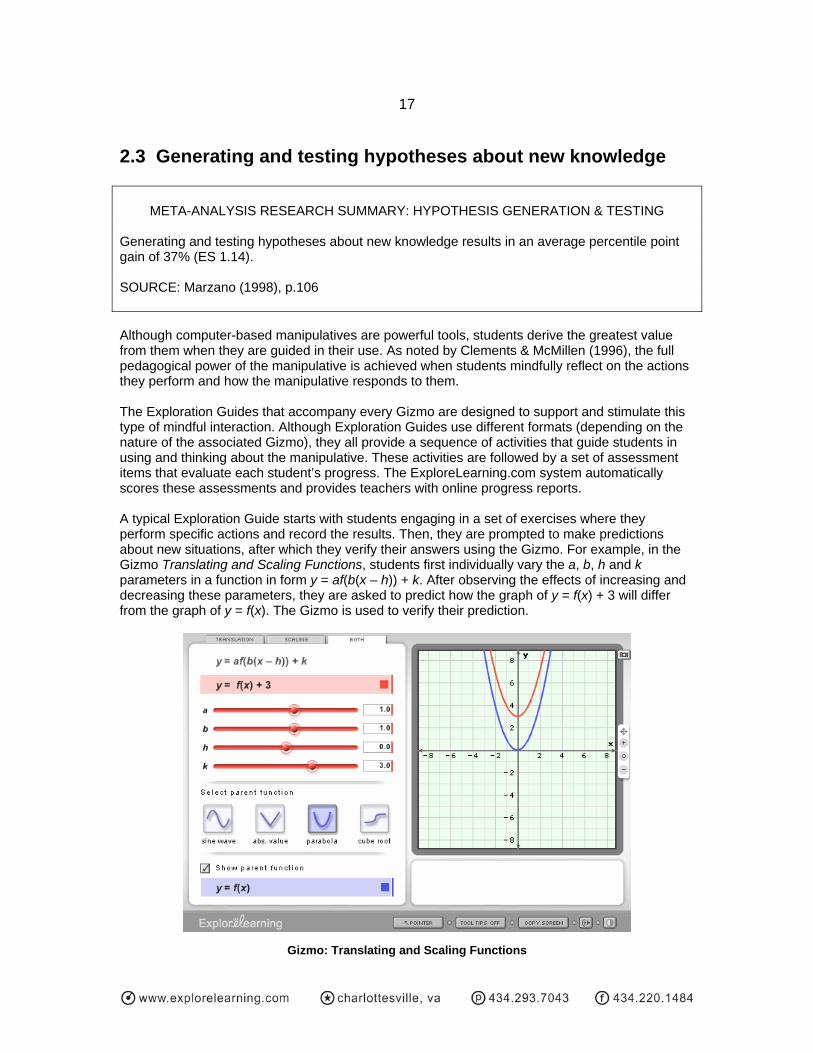
META-ANALYSIS RESEARCH SUMMARY: HYPOTHESIS GENERATION & TESTING Generating and testing hypotheses about new knowledge results in an average percentile point gain of 37% (ES 1.14). SOURCE: Marzano (1998), p.106 Although computer-based manipulatives are powerful tools, students derive the greatest value from them when they are guided in their use. As noted by Clements & McMillen (1996), the full pedagogical power of the manipulative is achieved when students mindfully reflect on the actions they perform and how the manipulative responds to them. The Exploration Guides that accompany every Gizmo are designed to support and stimulate this type of mindful interaction. Although Exploration Guides use different formats (depending on the nature of the associated Gizmo), they all provide a sequence of activities that guide students in using and thinking about the manipulative. These activities are followed by a set of assessment items that evaluate each student’s progress. The ExploreLearning.com system automatically scores these assessments and provides teachers with online progress reports. A typical Exploration Guide starts with students engaging in a set of exercises where they perform specific actions and record the results. Then, they are prompted to make predictions about new situations, after which they verify their answers using the Gizmo. For example, in the Gizmo Translating and Scaling Functions, students first individually vary the a, b, h and k parameters in a function in form y = af(b(x – h)) + k. After observing the effects of increasing and decreasing these parameters, they are asked to predict how the graph of y = f(x) + 3 will differ from the graph of y = f(x). The Gizmo is used to verify their prediction.
Gizmo: Translating and Scaling Functions
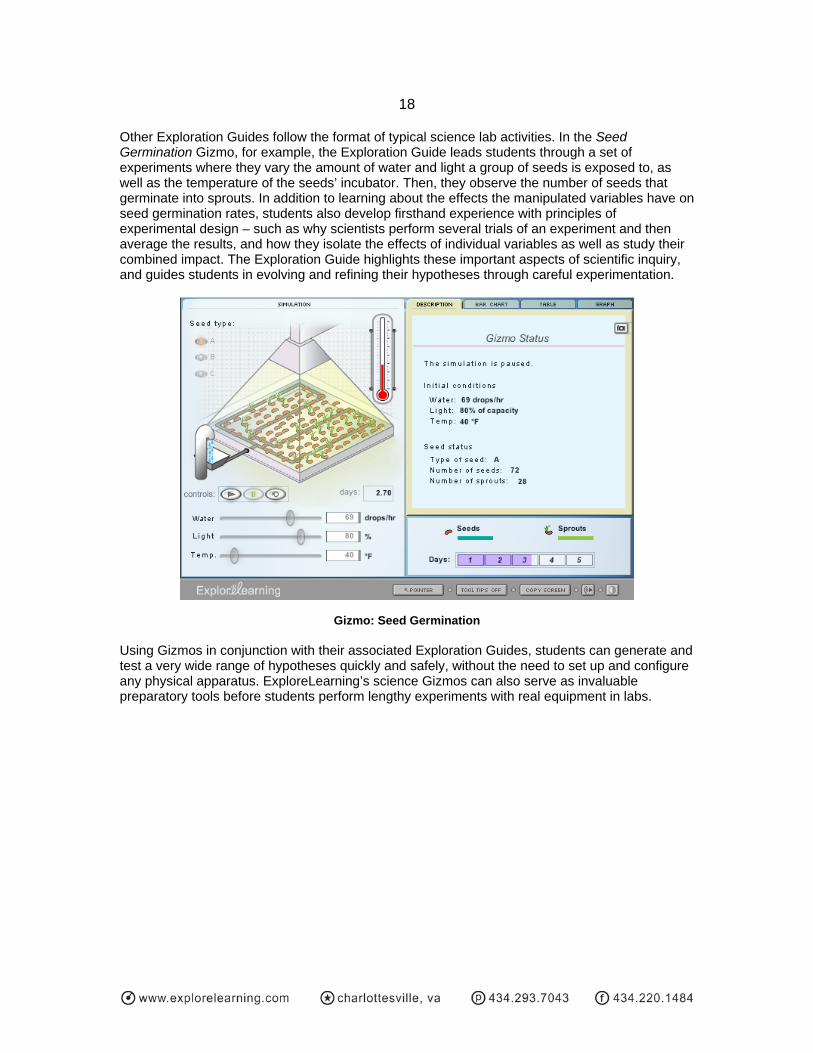
18 Other Exploration Guides follow the format of typical science lab activities. In the Seed Germination Gizmo, for example, the Exploration Guide leads students through a set of experiments where they vary the amount of water and light a group of seeds is exposed to, as well as the temperature of the seeds’ incubator. Then, they observe the number of seeds that germinate into sprouts. In addition to learning about the effects the manipulated variables have on seed germination rates, students also develop firsthand experience with principles of experimental design – such as why scientists perform several trials of an experiment and then average the results, and how they isolate the effects of individual variables as well as study their combined impact. The Exploration Guide highlights these important aspects of scientific inquiry, and guides students in evolving and refining their hypotheses through careful experimentation.
Gizmo: Seed Germination Using Gizmos in conjunction with their associated Exploration Guides, students can generate and test a very wide range of hypotheses quickly and safely, without the need to set up and configure any physical apparatus. ExploreLearning’s science Gizmos can also serve as invaluable preparatory tools before students perform lengthy experiments with real equipment in labs.
19
2.4 Direct presentation, followed by application
META-ANALYSIS RESEARCH SUMMARY: PRESENTATION FOLLOWED BY APPLICATION Demonstrating new concepts to students in a direct fashion and then having them apply the concepts to different situations is an effective instructional sequence. • Initial direct presentation of conceptual categories, generalizations, and principles is
associated with an average percentile point gain of 49% (ES = 2.55).
• Having students apply conceptual categories, generalizations, and principles to new situations after being taught them is associated with an average percentile point gain of 38% (ES = 1.16).
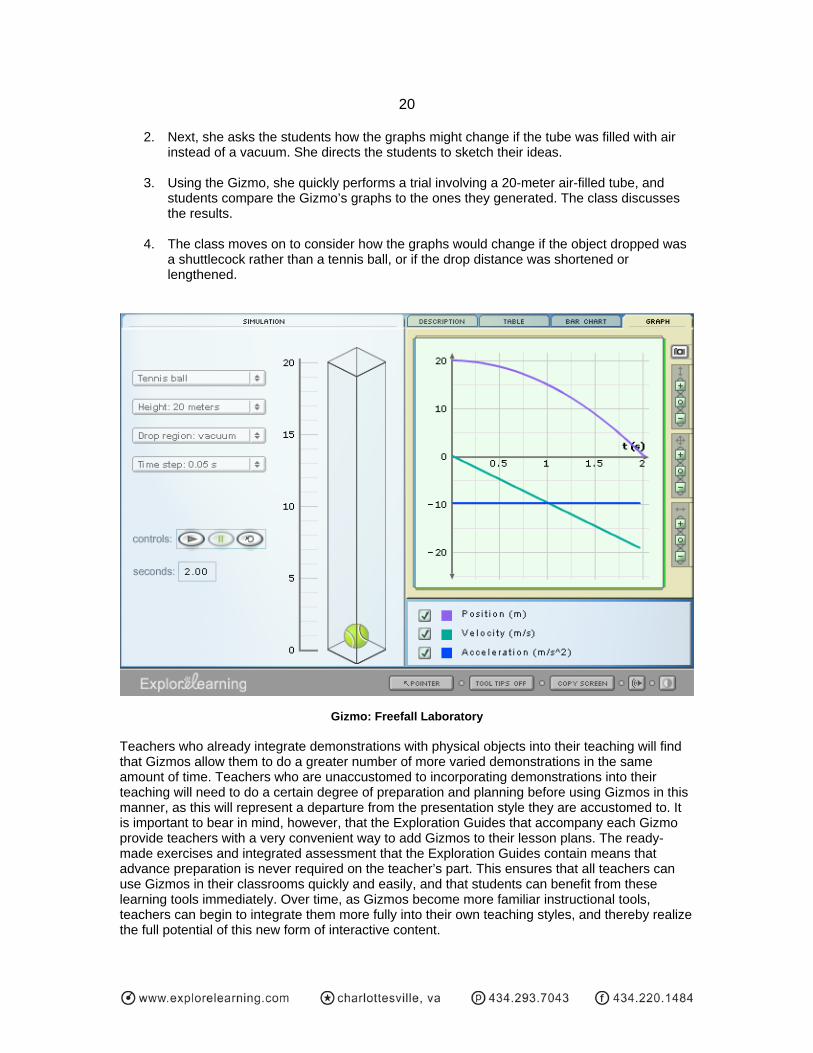
SOURCE: Marzano (1998), p.106 Although the Exploration Guides that accompany all ExploreLearning Gizmos permit them to be used by students in a self-directed manner, this is not the only way in which Gizmos are designed to be used. As the Marzano (1998) meta-analysis notes, students learn effectively and efficiently when they are first taught new conceptual categories, generalizations, and principles directly, only after which they apply them on their own. Ideally, then, educational software should support this instructional sequence by serving two main objectives: first, it should support teachers in presenting new knowledge to students, and second, it should support students in applying and extending what they have learned on a more individual basis. Most educational software products, however, are designed exclusively for use by individual students in extended tutorial-style one-on-one sessions, with no explicit role for the teacher. This kind of software is cumbersome or impossible to integrate directly into classroom teaching as a demonstration or explanation aid. As a result, these products provide little or no support to teachers when they are first introducing a topic to their students, or when they are trying to stimulate classroom discussion. Furthermore, when a set tutorial is integrated within the software, teachers cannot flexibly differentiate the level or focus of instruction for different groups of students. ExploreLearning’s Gizmos, on the other hand, are highly modular and flexible. They are designed to fit the needs of a broad range of teachers and instructional settings, regardless of whether a classroom has a single computer connected to an overhead projector or whether there is one computer per student. Teachers can integrate Gizmos as presentation aids when they are first teaching a topic to their students, then use them to anchor and stimulate classroom discussions, and finally have students apply and practice new concepts and skills on their own through the Gizmo. For example, using the Gizmo Freefall Laboratory, teachers can quickly discuss and demonstrate the effect of varying parameters in an experiment, and then have students make conjectures about the results:
1. The teacher tells her students that she is going to simulate a tennis ball dropping through a 20 meter-high tube containing a vacuum. She uses the Freefall Laboratory Gizmo (projected on a screen at the front of her class) to demonstrate this scenario and show the graphs of position, velocity and acceleration that result.
20
2. Next, she asks the students how the graphs might change if the tube was filled with air instead of a vacuum. She directs the students to sketch their ideas.
3. Using the Gizmo, she quickly performs a trial involving a 20-meter air-filled tube, and students compare the Gizmo’s graphs to the ones they generated. The class discusses the results.
4. The class moves on to consider how the graphs would change if the object dropped was a shuttlecock rather than a tennis ball, or if the drop distance was shortened or lengthened.
Gizmo: Freefall Laboratory Teachers who already integrate demonstrations with physical objects into their teaching will find that Gizmos allow them to do a greater number of more varied demonstrations in the same amount of time. Teachers who are unaccustomed to incorporating demonstrations into their teaching will need to do a certain degree of preparation and planning before using Gizmos in this manner, as this will represent a departure from the presentation style they are accustomed to. It is important to bear in mind, however, that the Exploration Guides that accompany each Gizmo provide teachers with a very convenient way to add Gizmos to their lesson plans. The ready-made exercises and integrated assessment that the Exploration Guides contain means that advance preparation is never required on the teacher’s part. This ensures that all teachers can use Gizmos in their classrooms quickly and easily, and that students can benefit from these learning tools immediately. Over time, as Gizmos become more familiar instructional tools, teachers can begin to integrate them more fully into their own teaching styles, and thereby realize the full potential of this new form of interactive content.
21
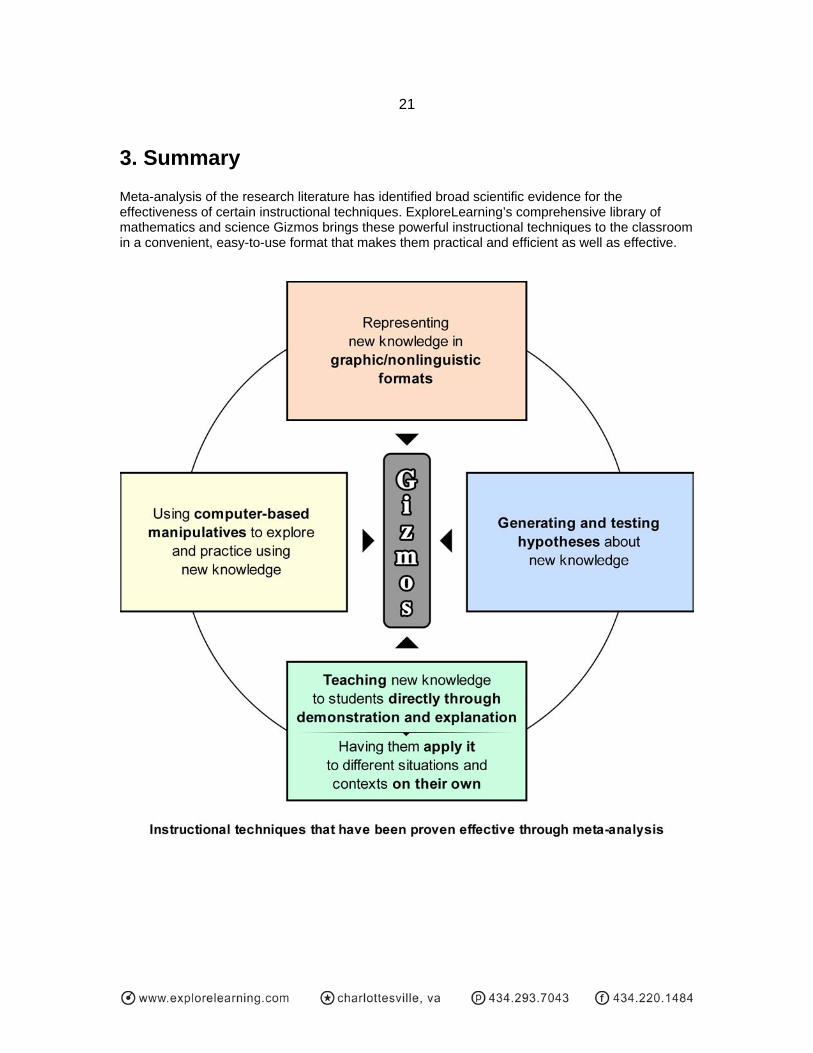
3. Summary Meta-analysis of the research literature has identified broad scientific evidence for the effectiveness of certain instructional techniques. ExploreLearning’s comprehensive library of mathematics and science Gizmos brings these powerful instructional techniques to the classroom in a convenient, easy-to-use format that makes them practical and efficient as well as effective.
22
4. References Clements, D.H., & McMillen, S. (1996). Rethinking concrete manipulatives. Teaching children mathematics, 2(5), 270-279. [Available at: http://www.terc.edu/investigations/relevant/html/rethinkingconcrete.html] Gerlic, I., & Jausovec, N. (1999). Multimedia: Differences in cognitive processes observed with EEG. Educational Technology Research and Development, 47(3), 5–14. Marzano, R.J. (1998). A theory-based meta-analysis of research on instruction. Aurora, CO: Mid-continent Research for Education and Learning. Marzano, R.J., Gaddy, B.B., & Dean, C. (2000). What works in classroom instruction. Aurora, CO: Mid-continent Research for Education and Learning. Neuman, S.B. (2002) Welcome and introduction. Washington, DC: Department of Education working group conference on the use of scientifically based research in education (February 6, 2002). [Available at: http://www.ed.gov/nclb/methods/whatworks/research/index.html] No Child Left Behind Act of 2001, Pub. L. No. 107-110 (2002). [Available at: http://www.ed.gov/policy/elsec/leg/esea02/index.html] Stanovich, P.J., & Stanovich, K.E. (2003). Using Research and Reason in Education: How Teachers Can Use Scientifically-Based Research to Make Curricular & Instructional Decisions. Portsmouth, NH: RMC Research Corp.
23
Complete list of Gizmos on ExploreLearning.com (updated 05/14/07)
• Calorimetry Lab • Cell Division • 2D Collisions • Cell Energy Cycle • 2D Eclipse • Cell Structure • 3D and Orthographic Views – Activity A • Center of Mass • 3D and Orthographic Views – Activity B • Chemical Equation Balancing • 3D Eclipse • Chicken Genetics • Chords and Arcs • Absolute Value of a Complex Number • Circle: Circumference and Area • Absolute Value of a Quadratic Function • Circles • Absolute Value with Linear Functions –
Activity A • Circuits • Classifying Quadrilaterals – Activity A • Absolute Value with Linear Functions –
Activity B • Classifying Quadrilaterals – Activity B • Classifying Triangles • Absolute Value with Linear Functions –
Activity C • Coastal Winds and Clouds • Adding and Subtracting Integers • Colligative Properties • Adding and Subtracting Integers with
Chips • Collision Theory • Comparing and Ordering Decimals
• Adding Real Numbers • Comparing and Ordering Fractions • Adding Vectors • Comparing and Ordering Integers • Addition and Subtraction of Polynomials • Comparing and Ordering Rational
Numbers • Addition of Polynomials – Activity A • Addition of Polynomials – Activity B • Complex Numbers in Polar Form • Additive Color v2 • Compound Independent and Dependent
Events • Additive Colors • Compound Independent Events • Advanced Circuits • Compound Inequalities • Air Track • Concurrent Lines, Medians, and
Altitudes • Archimedes' Principle • Area of Parallelograms – Activity A
• Conditional Statement • Area of Parallelograms – Activity B • Congruence in Right Triangles • Arithmetic and Geometric Sequences • Construct Parallel and Perpendicular
Lines • Arithmetic Sequences • Atwood Machine
• Constructing Box–and–Whisker Plots • Constructing Congruent Segments and
Angles • Balancing Chemical Equations • Basic Prism • Correlation • Beam to Moon (Ratios and Proportions) • Cosine Function • Biconditional Statement • Coulomb Force (Static) • Binomial Probabilities • Covalent Bonds • Bisectors in Triangles • Cubic Function Activity • Bohr Model of Hydrogen • Bohr Model: Introduction
• Defining a Line with Two Points • Box–and–Whisker Plots • Dehydration Synthesis • Boyle's Law and Charles' Law • Density Experiment: Slice and Dice • Building DNA • Density Lab • Building Topographical Maps • Density Laboratory

24
• Density via Comparison • Factoring Special Products • Describing Data Using Statistics • Fan Cart Physics • Determining a Spring Constant • Finding Factors with Area Models • Determining Density via Water
Displacement • Finding Patterns • Floating Log
• Diffusion • Food Chain • Dilations • Fourth–Degree Polynomials – Activity A • Direct and Inverse Variation • Fourth–Degree Polynomials – Activity B • Direct Variation • Fractions with Unlike Denominators • Disease Spread • Freefall Lab – Terminal Velocity • Distance Formula – Activity A • Freefall Laboratory • Distance Formula – Activity B • Freezing Point of Salt Water • Distance–Time and Velocity–Time
Graphs • Functions Involving Square Roots
• Distance–Time Graphs • General Form of a Rational Function • Dividing Exponential Expressions • Geoboard: The Pythagorean Theorem • Dividing Fractions • Geometric Probability – Activity A • Dividing Mixed Numbers • Geometric Probability – Activity B • Dividing Polynomials Using Synthetic
Division • Geometric Sequences • Golf Range! • DNA Fingerprint Analysis • Gravitational Force • Doppler Effect (1 source) • Greenhouse Effect • Doppler Shift
• Doppler Shift Advanced • H–R Diagram • Drug Dosage • Half–life • Dye Elimination • Half–life Laboratory • Hardy–Weinberg Equilibrium • Earthquake – Determination of
Epicenter • Hearing: Frequency and Volume • Heat Transfer by Conduction • Earthquake – Recording Station • Herschel Experiment • Effect of Environment on New Life Form • Histograms • Effect of Temperature on Gender • Holiday Snowflake Designer • Elapsed Time • Household Energy Usage • Electron Configuration • Human Evolution – Skull Analysis • Element Builder • Human Homeostasis • Ellipse – Activity A • Human Karyotyping • Ellipse – Activity B • Hurricane Motion • Energy Conversion in a System • Hyperbola – Activity A • Energy of a Pendulum • Hyperbola – Activity B • Estimating Population Size
• Estimating Sums and Differences • Identifying Nutrients • Evolution: Mutation and Selection • Improper Fractions and Mixed Numbers • Evolution: Natural and Artificial
Selection • Inclined Plane – Rolling Objects • Exploring Data Using Histograms • Inclined Plane – Simple Machine • Exponential Functions – Activity A • Inclined Plane – Sliding Objects • Exponential Functions – Activity B • Independent and Dependent Events • Exponential Functions – Activity C • Inequalities Involving Absolute Values • Exponential Growth and Decay –
Activity A • Inscribing Angles • Interdependence of Plants and Animals
• Exponential Growth and Decay – Activity B
• Introduction to Functions • Investigating Angle Theorems – Activity
A • Exponents and Power Rules

25
• Investigating Angle Theorems – Activity B
• Number Systems
• Investigating Parallel Lines and Planes • Ocean Mapping • Ionic Bonds • Operations with Radical Expressions • Isosceles and Equilateral Triangles • Orbital Motion – Kepler's Laws
• Order of Operations • Laser Reflection • Ordering and Approximating Square
Roots • Limiting Reactants • Line Plots • Ordering Percents, Fractions and
Decimals • Linear Functions • Ordering Percents, Fractions and
Decimals Greater Than 1 • Linear Inequalities in Two Variables –
Activity A • Osmosis • Linear Inequalities in Two Variables –
Activity B • Linear Programming – Activity A • Parabola with Horizontal Directrix • Linear Programming – Activity B • Parabolas – Activity A • Lines of Best Fit Using Least Squares –
Activity A • Parabolas – Activity B • Parabolas – Activity C
• Lines of Best Fit Using Least Squares – Activity B
• Parallelogram Conditions • Paramecium Homeostasis
• Logarithmic Functions – Activity A • Part:Part and Part:Whole Ratios • Logarithmic Functions – Activity B • Penumbra Effect • Logarithmic Functions: Translating and
Scaling • Percent of Change • Percents and Proportions • Longitudinal Waves • Percents, Fractions and Decimals • Perimeter, Circumference, and Area –
Activity A • Magnetic Induction • Maximize Area • Perimeter, Circumference, and Area –
Activity B • Mean, Median and Mode • Microevolution • Perimeters and Areas of Similar Figures • Minimize Perimeter • Period of a Pendulum • Modeling and Solving Two–Step
Equations • Period of a Pendulum – Large Angle • Period of Mass on a Spring
• Modeling Linear Systems – Activity A • Permutations • Modeling Linear Systems – Activity B • Permutations and Combinations • Modeling One–Step Equations – Activity
A • pH Analysis • pH Analysis: Quad Color Indicator
• Modeling One–Step Equations – Activity B • Phase Changes
• Phased Array • Modeling the Factorization of ax2+bx+c • Photoelectric Effect • Modeling the Factorization of x2+bx+c • Photosynthesis – Activity B • Moment of Inertia • Photosynthesis Lab • Moon Phases • Pith Ball Lab • Moonrise, Moonset, and Phases • Plate Tectonics • Mouse Genetics (One Trait) • Point–Slope Form of a Line – Activity A • Mouse Genetics (Two Traits) • Point–Slope Form of a Line – Activity B • Multiplying Exponential Expressions • Points in Polar Coordinates • Multiplying Fractions • Points in the Complex Plane – Activity A • Multiplying Mixed Numbers • Points in the Complex Plane – Activity B • Multiplying with Decimals • Points in the Coordinate Plane – Activity
A • Mystery Powder Analysis
• Points in the Coordinate Plane – Activity B • Natural Selection
• Nuclear Decay

26
• Points in the Coordinate Plane – Activity C
• RNA and Protein Synthesis • Rock Classification
• Pollination: Flower to Fruit • Rock Cycle • Polling: City • Roller Coaster Physics • Polling: Neighborhood • Roots of a Quadratic • Polygon Angle Sum – Activity A • Rotation/Revolution of Venus and Earth • Polygon Angle Sum – Activity B • Rotations, Reflections and Translations • Polynomials and Linear Factors • Populations and Samples • Scatter Plots – Activity A • Porosity • Scatter Plots – Activity B • Potential Energy on Shelves • Seasons Around the World • Prisms and Cylinders – Activity A • Seasons in 3D • Prisms and Cylinders – Activity B • Seasons: Earth, Moon, and Sun • Probability Simulations • Seasons: Why do we have them? • Proportions and Common Multipliers • See–Saw Torque • Proving Triangles Congruent • Seed Germination • Pulley Lab • Shoot the Monkey! • Pyramids and Cones – Activity A • Sight vs. Sound Reflexes • Pyramids and Cones – Activity B • Similar Figures – Activity A • Pythagorean Theorem – Activity A • Similar Figures – Activity B • Pythagorean Theorem – Activity B • Similar Polygons
• Similarity in Right Triangles • Quadratic and Absolute Value Functions • Simple and Compound Interest • Quadratic Functions • Simple Harmonic Motion • Quadratic Inequalities – Activity A • Simplifying Radicals – Activity A • Quadratic Inequalities – Activity B • Simplifying Radicals – Activity B • Quadratics in Factored Form • Simplifying Trigonometric Expressions • Quadratics in Polynomial Form – Activity
A • Sine and Cosine Ratios – Activity A • Sine and Cosine Ratios – Activity B
• Quadratics in Polynomial Form – Activity B
• Sine Function • Sine, Cosine and Tangent
• Quadratics in Vertex Form – Activity A • Slope – Activity A • Quadratics in Vertex Form – Activity B • Slope – Activity B • Quadratics: Polynomial Form in y • Slope – Activity C
• Slope–Intercept Form of a Line – Activity A • Rabbit Population by Season
• Radical Functions • Slope–Intercept Form of a Line – Activity B • Rainfall and Bird Beaks
• Slope–Intercept Form of a Line – Activity C
• Rational Functions • Ray Tracing
• Solar System Explorer • Ray Tracing (Lenses) • Solubility and Temperature • Ray Tracing (Mirrors) • Solving Equations By Graphing Each
Side • Reading Topographical Maps • Real Number Line – Activity A
• Solving Equations with Decimals • Real Number Line – Activity B • Solving Formulas for any Variable • Real–Time Histogram • Solving Inequalities Using Multiplication
and Division • Rectangle: Perimeter and Area • Reflections
• Solving Linear Inequalities using Addition and Subtraction • Reflections of a Linear Function
• Reflections of a Quadratic Function • Solving Linear Inequalities using Multiplication and Division • Refraction
• Relative Humidity • Solving Linear Systems by Graphing • Reverse the Field • Solving Two–Step Equations • Riemann Sum

27
• Solving Using Trend Lines • Vector Addition • Sound Beats • Vectors • Sound Beats and Sine Waves • Virus Life Cycle (Lytic) • Special Quadrilaterals • Special Types of Solutions to Linear
Systems • Water Cycle • Water Pollution
• Square Roots • Weather Maps • Standard Form of a Line • Star Spectra • Zap It! Game • Stem–and–Leaf Plots • Stoichiometry
• Subtractive Color v2 • Subtractive Colors • Sum and Difference Identities for Sine
and Cosine • Sums and Differences with Decimals • Surface and Lateral Area of Prisms and
Cylinders • Surface and Lateral Area of Pyramids
and Cones • System of Two Quadratic Inequalities • Systems of Linear Equations – Activity A • Systems of Linear Equations – Activity B • Systems of Linear Inequalities (Slope–
intercept form) – Activity A • Systems of Linear Inequalities (Slope–
intercept form) – Activity B • Systems of Linear Inequalities
(Standard form)
• Tangent Function • Tangent Ratio • Temperature and Particle Motion • Theoretical and Experimental Probability • Tides • Time Estimation • Torque and Moment of Inertia • Translating and Scaling Functions • Translating and Scaling Sine and
Cosine Functions – Activity A • Translating and Scaling Sine and
Cosine Functions – Activity B • Translations • Triangle Angle Sum – Activity A • Triangle Angle Sum – Activity B • Triangle Inequalities • Triple Beam Balance
• Uniform Circular Motion • Unit Circle • Using Algebraic Equations • Using Algebraic Expressions • Using Tables, Rules and Graphs