whole foods market, inc. - tippie college of business€¦ · whole foods market, inc. (nasdaq:...
TRANSCRIPT
Krause Fund Research Spring 2017 Consumer Staples
ANALYSTS Yue Li [email protected] Hannah Hendricks [email protected] Rachel Langholz [email protected] COMPANY OVERVIEW Whole Foods Market, Inc. (NASDAQ: WFM) is recognized as the nation’s leading natural and organic foods grocer within the broader food retail industry. With the unique designation as the first “Certified Organic” supermarket, WFM primarily operates within the continental U.S. with smaller presences in Canada and the United Kingdom. The firm largely competes within its perishable and non-perishable verticals on the basis of product leadership, which relies on high quality standards and strong product differentiation. Furthermore, WFM has introduced a newer, low-cost store model “365 by Whole Foods Market” to increase its engagement with a broader customer base and rebuild its market share lost to large-scale food retailers. STOCK PERFORMANCE HIGHLIGHTS 52 Week High $35.58 52 Week Low $27.67 Beta Value 0.89 Average Daily Volume 5.70 m SHAREHIGHLIGHTS Market Capitalization $11.00 b Shares Outstanding 318.56 m Book Value per share $10.34 EPS (Trailing Twelve Months) $1.38 Trailing P/E Ratio 24.92 Dividend Yield 1.60% Dividend Payout Ratio 39.13% COMPANY PERFORMANCE HIGHLIGHTS ROA 8.19% ROE 13.58% Sales $15.81 b
Whole Foods Market, Inc. (NASDAQ: WFM)
Recommendation: SELL
Current Price: $34.52 Target Price Range: $25.00 – $28.00
U.S. LARGEST ORGANIC GROCER
CHALLENGES • Intensifying Competition: Due to a growing number of retailers entering the organic food market, WFM has experienced a stark decline in store traffic and same-store sales. Considering WFM’s recent sluggish performance, we forecast fewer new stores openings going forward, decreasing from 24 in 2016 to 18 in the CV year. • “365 by Whole Foods Market”: Given a shift in consumer preferences, we anticipate this lower-cost store format to be the dominant driver of future revenues, accounting for over 80% of additional stores opening in the CV year. However, it may not prove to be a viable source for long-term organic growth. • Stock Underperformance: While the S&P 500 increased 15% over the last 12 months, there was only a 4% gain in WFM, which lost over 50% of its value since October 2013. • Increased Stake by Activist Investor: Jana Partners built an 8.8% stake in WFM to urge accelerated operational improvements to better compete with large-scale grocers. The dissemination of this news caused WFM’s price to surge over 10% on Monday, April 10, 2017. ONE-YEAR STOCK PERFORMANCE
Source: Yahoo! Finance
April 17, 2017
2
EXECUTIVE SUMMARY Our team is issuing a SELL rating for Whole Foods Market, Inc. (NASDAQ: WFM) for the Krause Fund portfolio due to the ambiguous prospects ahead of WFM. As the nation’s first and largest organic food grocer, WFM has long been facing incremental competition from traditional supermarkets, specialty stores, and online retailers entering this niche market. Especially, the recent deteriorating customer traffic and troubling same-store sales have presented the company with a host of challenges. In addition to refining growth strategy to focus on strengthening customer loyalty, WFM has also launched a value-based smaller-size store format named 365 by Whole Foods Market aiming to regain market share as a response. Although we expect that the implementation of these two tactics would mitigate the unsatisfactory performance to some degree, it may not be sustainable in the long-term. Incorporating all these factors into our valuation model, we generated a target price range of $25.00 – $28.00. While the recent news of the activist investor seeking potential takeover of WFM implies upside potential in share price, we believe WFM is overvalued from a fair market value perspective, leading to our recommendation of selling the stock.
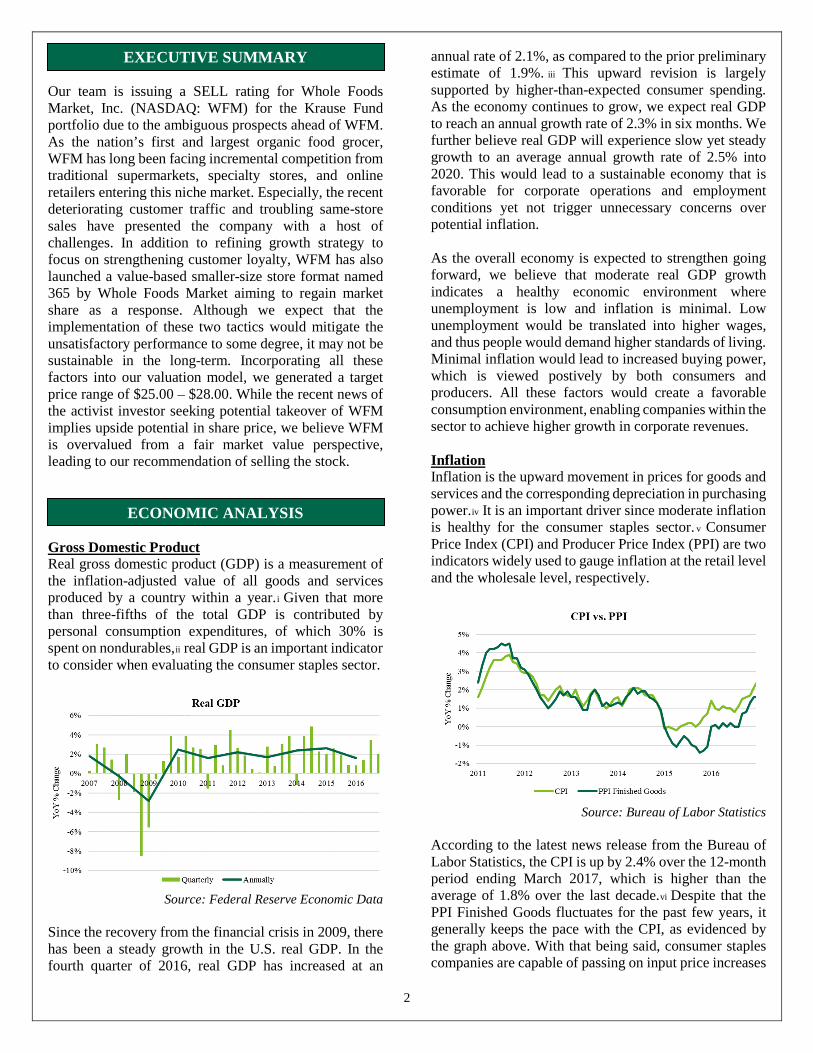
ECONOMIC ANALYSIS Gross Domestic Product Real gross domestic product (GDP) is a measurement of the inflation-adjusted value of all goods and services produced by a country within a year.i Given that more than three-fifths of the total GDP is contributed by personal consumption expenditures, of which 30% is spent on nondurables,ii real GDP is an important indicator to consider when evaluating the consumer staples sector.
Source: Federal Reserve Economic Data
Since the recovery from the financial crisis in 2009, there has been a steady growth in the U.S. real GDP. In the fourth quarter of 2016, real GDP has increased at an
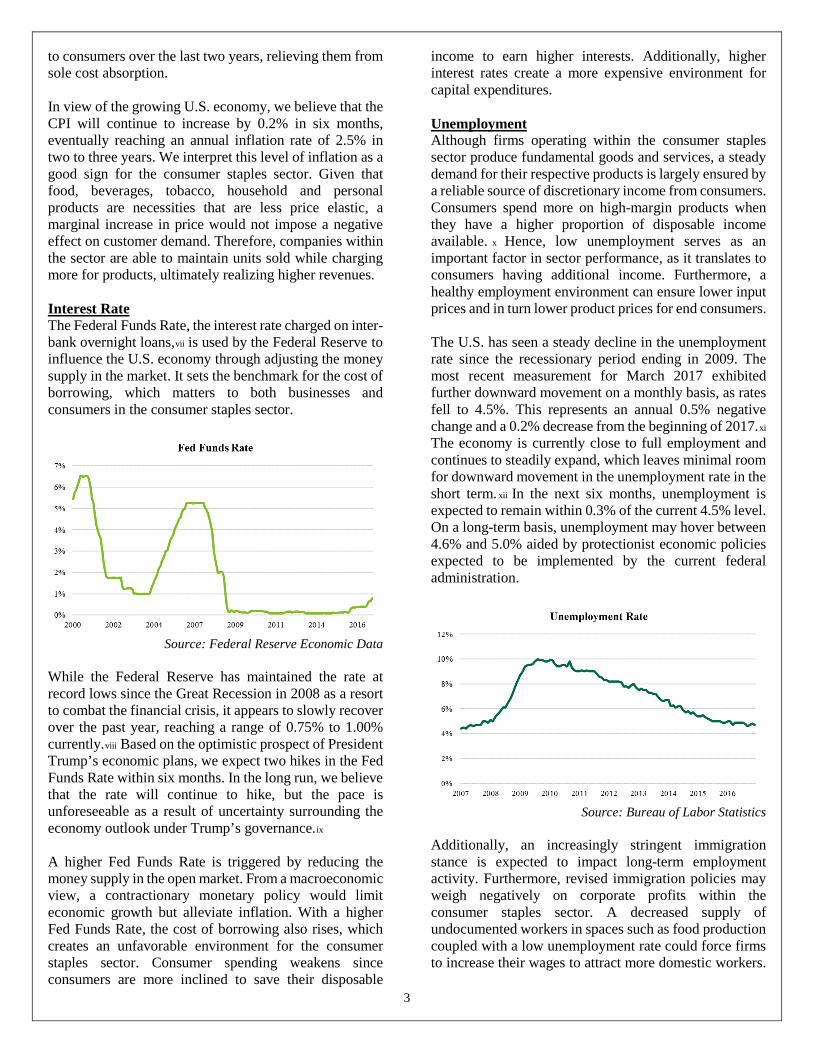
annual rate of 2.1%, as compared to the prior preliminary estimate of 1.9%. iii This upward revision is largely supported by higher-than-expected consumer spending. As the economy continues to grow, we expect real GDP to reach an annual growth rate of 2.3% in six months. We further believe real GDP will experience slow yet steady growth to an average annual growth rate of 2.5% into 2020. This would lead to a sustainable economy that is favorable for corporate operations and employment conditions yet not trigger unnecessary concerns over potential inflation. As the overall economy is expected to strengthen going forward, we believe that moderate real GDP growth indicates a healthy economic environment where unemployment is low and inflation is minimal. Low unemployment would be translated into higher wages, and thus people would demand higher standards of living. Minimal inflation would lead to increased buying power, which is viewed postively by both consumers and producers. All these factors would create a favorable consumption environment, enabling companies within the sector to achieve higher growth in corporate revenues. Inflation Inflation is the upward movement in prices for goods and services and the corresponding depreciation in purchasing power.iv It is an important driver since moderate inflation is healthy for the consumer staples sector. v Consumer Price Index (CPI) and Producer Price Index (PPI) are two indicators widely used to gauge inflation at the retail level and the wholesale level, respectively.
Source: Bureau of Labor Statistics
According to the latest news release from the Bureau of Labor Statistics, the CPI is up by 2.4% over the 12-month period ending March 2017, which is higher than the average of 1.8% over the last decade.vi Despite that the PPI Finished Goods fluctuates for the past few years, it generally keeps the pace with the CPI, as evidenced by the graph above. With that being said, consumer staples companies are capable of passing on input price increases
3
to consumers over the last two years, relieving them from sole cost absorption. In view of the growing U.S. economy, we believe that the CPI will continue to increase by 0.2% in six months, eventually reaching an annual inflation rate of 2.5% in two to three years. We interpret this level of inflation as a good sign for the consumer staples sector. Given that food, beverages, tobacco, household and personal products are necessities that are less price elastic, a marginal increase in price would not impose a negative effect on customer demand. Therefore, companies within the sector are able to maintain units sold while charging more for products, ultimately realizing higher revenues. Interest Rate The Federal Funds Rate, the interest rate charged on inter-bank overnight loans,vii is used by the Federal Reserve to influence the U.S. economy through adjusting the money supply in the market. It sets the benchmark for the cost of borrowing, which matters to both businesses and consumers in the consumer staples sector.
Source: Federal Reserve Economic Data
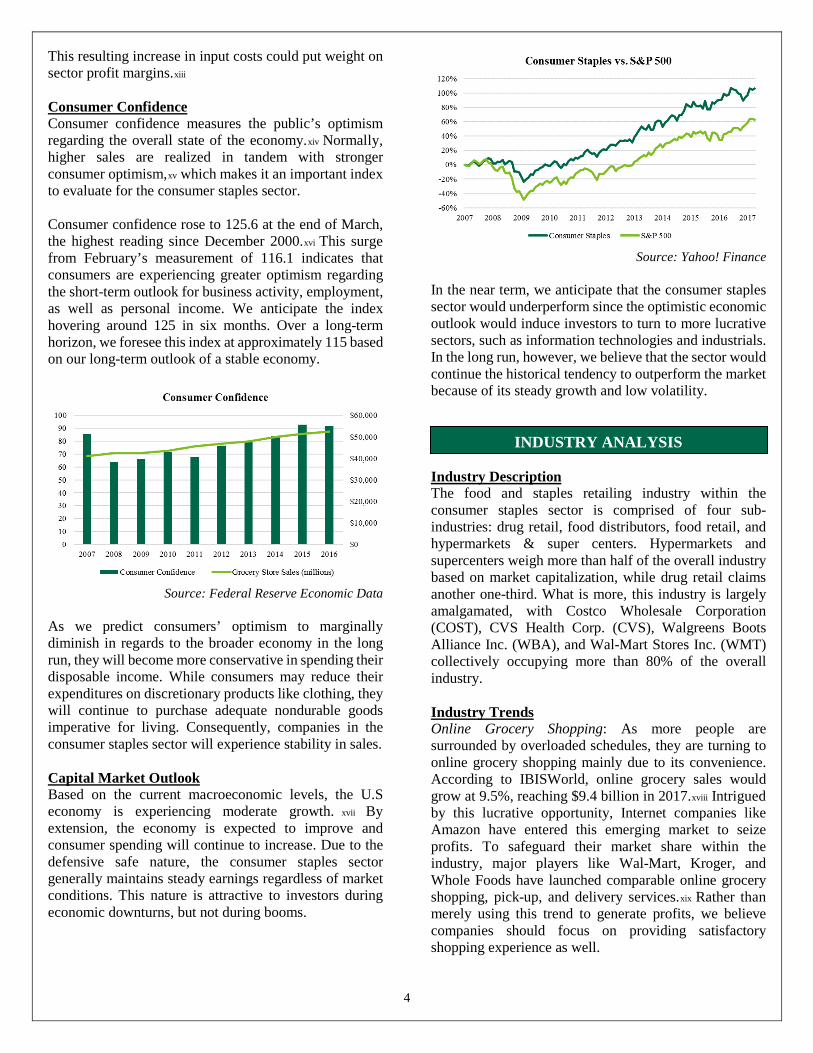
While the Federal Reserve has maintained the rate at record lows since the Great Recession in 2008 as a resort to combat the financial crisis, it appears to slowly recover over the past year, reaching a range of 0.75% to 1.00% currently.viii Based on the optimistic prospect of President Trump’s economic plans, we expect two hikes in the Fed Funds Rate within six months. In the long run, we believe that the rate will continue to hike, but the pace is unforeseeable as a result of uncertainty surrounding the economy outlook under Trump’s governance.ix A higher Fed Funds Rate is triggered by reducing the money supply in the open market. From a macroeconomic view, a contractionary monetary policy would limit economic growth but alleviate inflation. With a higher Fed Funds Rate, the cost of borrowing also rises, which creates an unfavorable environment for the consumer staples sector. Consumer spending weakens since consumers are more inclined to save their disposable
income to earn higher interests. Additionally, higher interest rates create a more expensive environment for capital expenditures. Unemployment Although firms operating within the consumer staples sector produce fundamental goods and services, a steady demand for their respective products is largely ensured by a reliable source of discretionary income from consumers. Consumers spend more on high-margin products when they have a higher proportion of disposable income available. x Hence, low unemployment serves as an important factor in sector performance, as it translates to consumers having additional income. Furthermore, a healthy employment environment can ensure lower input prices and in turn lower product prices for end consumers. The U.S. has seen a steady decline in the unemployment rate since the recessionary period ending in 2009. The most recent measurement for March 2017 exhibited further downward movement on a monthly basis, as rates fell to 4.5%. This represents an annual 0.5% negative change and a 0.2% decrease from the beginning of 2017.xi The economy is currently close to full employment and continues to steadily expand, which leaves minimal room for downward movement in the unemployment rate in the short term.xii In the next six months, unemployment is expected to remain within 0.3% of the current 4.5% level. On a long-term basis, unemployment may hover between 4.6% and 5.0% aided by protectionist economic policies expected to be implemented by the current federal administration.
Source: Bureau of Labor Statistics
Additionally, an increasingly stringent immigration stance is expected to impact long-term employment activity. Furthermore, revised immigration policies may weigh negatively on corporate profits within the consumer staples sector. A decreased supply of undocumented workers in spaces such as food production coupled with a low unemployment rate could force firms to increase their wages to attract more domestic workers.
4
This resulting increase in input costs could put weight on sector profit margins.xiii Consumer Confidence Consumer confidence measures the public’s optimism regarding the overall state of the economy.xiv Normally, higher sales are realized in tandem with stronger consumer optimism,xv which makes it an important index to evaluate for the consumer staples sector. Consumer confidence rose to 125.6 at the end of March, the highest reading since December 2000.xvi This surge from February’s measurement of 116.1 indicates that consumers are experiencing greater optimism regarding the short-term outlook for business activity, employment, as well as personal income. We anticipate the index hovering around 125 in six months. Over a long-term horizon, we foresee this index at approximately 115 based on our long-term outlook of a stable economy.
Source: Federal Reserve Economic Data
As we predict consumers’ optimism to marginally diminish in regards to the broader economy in the long run, they will become more conservative in spending their disposable income. While consumers may reduce their expenditures on discretionary products like clothing, they will continue to purchase adequate nondurable goods imperative for living. Consequently, companies in the consumer staples sector will experience stability in sales. Capital Market Outlook Based on the current macroeconomic levels, the U.S economy is experiencing moderate growth. xvii By extension, the economy is expected to improve and consumer spending will continue to increase. Due to the defensive safe nature, the consumer staples sector generally maintains steady earnings regardless of market conditions. This nature is attractive to investors during economic downturns, but not during booms.
Source: Yahoo! Finance
In the near term, we anticipate that the consumer staples sector would underperform since the optimistic economic outlook would induce investors to turn to more lucrative sectors, such as information technologies and industrials. In the long run, however, we believe that the sector would continue the historical tendency to outperform the market because of its steady growth and low volatility.
INDUSTRY ANALYSIS Industry Description The food and staples retailing industry within the consumer staples sector is comprised of four sub-industries: drug retail, food distributors, food retail, and hypermarkets & super centers. Hypermarkets and supercenters weigh more than half of the overall industry based on market capitalization, while drug retail claims another one-third. What is more, this industry is largely amalgamated, with Costco Wholesale Corporation (COST), CVS Health Corp. (CVS), Walgreens Boots Alliance Inc. (WBA), and Wal-Mart Stores Inc. (WMT) collectively occupying more than 80% of the overall industry. Industry Trends Online Grocery Shopping: As more people are surrounded by overloaded schedules, they are turning to online grocery shopping mainly due to its convenience. According to IBISWorld, online grocery sales would grow at 9.5%, reaching $9.4 billion in 2017.xviii Intrigued by this lucrative opportunity, Internet companies like Amazon have entered this emerging market to seize profits. To safeguard their market share within the industry, major players like Wal-Mart, Kroger, and Whole Foods have launched comparable online grocery shopping, pick-up, and delivery services.xix Rather than merely using this trend to generate profits, we believe companies should focus on providing satisfactory shopping experience as well.
5
Organic Food Market: The increasing preferences towards healthy products among consumers has provided strong demand for the organic food market. It is projected that the organic food market would continue to grow at 14% annually into 2018, xx encouraging more small retailers to take advantage of this niche to capture returns. Alternatively, mainstream retailers adapt themselves to the emerging trend by devoting more shelf space to organic products.xxi Furthermore, they are taking steps to designate stores exclusively for organic goods. Moving forward, companies shall seek ways to offer organic products at lower prices that are affordable to more income-restrained individuals, which would help with enlarging current customer base. Mergers and Acquisitions: Nowadays, the intense competition among drugstores, food retailing stores, and supermarkets has contributed to the prevalence of acquisitions within the industry. Larger industry players consider acquisitions as the fast yet reliable approach to expand their existing geographic presence and attain higher earnings. The number of M&A announcements concerning S&P 1500 companies in the food and staples retailing industry has reached 22 for the first half of 2016, as compared to a total of 19 for 2015.
xxiii
xxii Although acquisition provides the easiest way for companies to grow, it is indeed an inorganic type of growth. Studies show that the enormous premiums paid on deals destroy shareholders value most of the times. Consequently, we anticipate companies relying on utilizing their core competencies and strengths to generate more organic growth. Industry Climate The current competitive climate within the food retail sub-industry is high as increasing competition comes from external industry players, including supercenters and alternative retailers such as warehouse clubs. Furthermore, the food retail sub-industry is becoming increasingly consolidated as key internal players look to defend against intense pricing competition.xxiv Specialty and organic retailers like WFM are seeing their market share decline at the hands of conventional retailers who have entered the organic food space and have the capacity to offer products at lower prices. Porter’s Five Forces Analysis Threat of Competition: High Among the leading food retailers, limited product differentiation and moderate-to-high consumer mobility create a highly competitive environment. Additionally, accommodative pricing and a wide product selection serve as the primary drivers of competition among major players within the food retail sub-industry. Private-label brands have remained popular among consumers following the economic downturn, especially higher-end
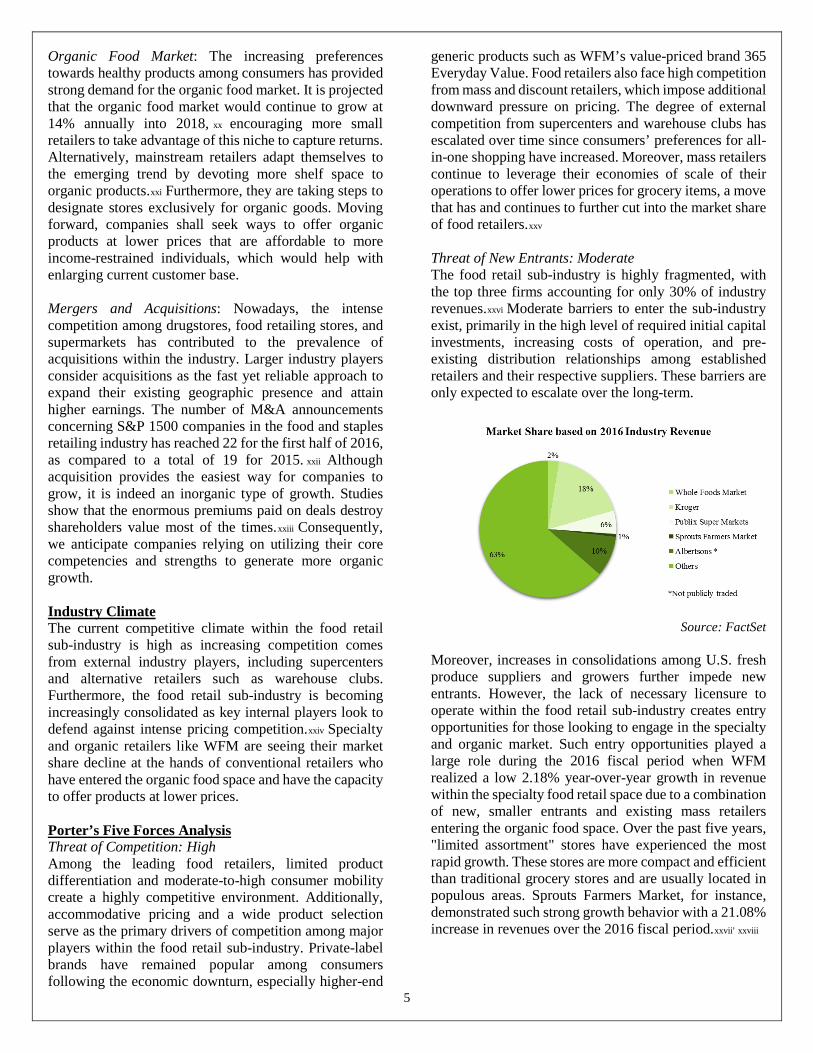
generic products such as WFM’s value-priced brand 365 Everyday Value. Food retailers also face high competition from mass and discount retailers, which impose additional downward pressure on pricing. The degree of external competition from supercenters and warehouse clubs has escalated over time since consumers’ preferences for all-in-one shopping have increased. Moreover, mass retailers continue to leverage their economies of scale of their operations to offer lower prices for grocery items, a move that has and continues to further cut into the market share of food retailers.xxv Threat of New Entrants: Moderate The food retail sub-industry is highly fragmented, with the top three firms accounting for only 30% of industry revenues.xxvi Moderate barriers to enter the sub-industry exist, primarily in the high level of required initial capital investments, increasing costs of operation, and pre-existing distribution relationships among established retailers and their respective suppliers. These barriers are only expected to escalate over the long-term.
Source: FactSet
Moreover, increases in consolidations among U.S. fresh produce suppliers and growers further impede new entrants. However, the lack of necessary licensure to operate within the food retail sub-industry creates entry opportunities for those looking to engage in the specialty and organic market. Such entry opportunities played a large role during the 2016 fiscal period when WFM realized a low 2.18% year-over-year growth in revenue within the specialty food retail space due to a combination of new, smaller entrants and existing mass retailers entering the organic food space. Over the past five years, "limited assortment" stores have experienced the most rapid growth. These stores are more compact and efficient than traditional grocery stores and are usually located in populous areas. Sprouts Farmers Market, for instance, demonstrated such strong growth behavior with a 21.08% increase in revenues over the 2016 fiscal period.xxvii xxviii,
6
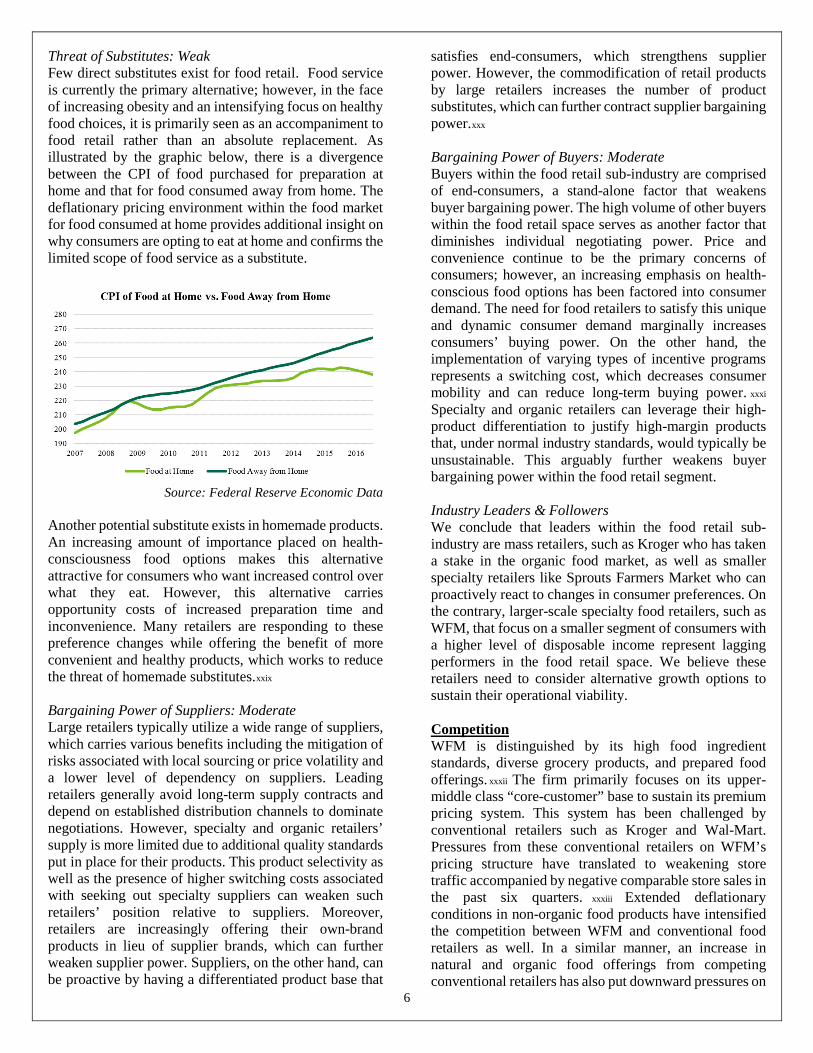
Threat of Substitutes: Weak Few direct substitutes exist for food retail. Food service is currently the primary alternative; however, in the face of increasing obesity and an intensifying focus on healthy food choices, it is primarily seen as an accompaniment to food retail rather than an absolute replacement. As illustrated by the graphic below, there is a divergence between the CPI of food purchased for preparation at home and that for food consumed away from home. The deflationary pricing environment within the food market for food consumed at home provides additional insight on why consumers are opting to eat at home and confirms the limited scope of food service as a substitute.
Source: Federal Reserve Economic Data
Another potential substitute exists in homemade products. An increasing amount of importance placed on health-consciousness food options makes this alternative attractive for consumers who want increased control over what they eat. However, this alternative carries opportunity costs of increased preparation time and inconvenience. Many retailers are responding to these preference changes while offering the benefit of more convenient and healthy products, which works to reduce the threat of homemade substitutes.xxix Bargaining Power of Suppliers: Moderate Large retailers typically utilize a wide range of suppliers, which carries various benefits including the mitigation of risks associated with local sourcing or price volatility and a lower level of dependency on suppliers. Leading retailers generally avoid long-term supply contracts and depend on established distribution channels to dominate negotiations. However, specialty and organic retailers’ supply is more limited due to additional quality standards put in place for their products. This product selectivity as well as the presence of higher switching costs associated with seeking out specialty suppliers can weaken such retailers’ position relative to suppliers. Moreover, retailers are increasingly offering their own-brand products in lieu of supplier brands, which can further weaken supplier power. Suppliers, on the other hand, can be proactive by having a differentiated product base that
satisfies end-consumers, which strengthens supplier power. However, the commodification of retail products by large retailers increases the number of product substitutes, which can further contract supplier bargaining power.xxx Bargaining Power of Buyers: Moderate Buyers within the food retail sub-industry are comprised of end-consumers, a stand-alone factor that weakens buyer bargaining power. The high volume of other buyers within the food retail space serves as another factor that diminishes individual negotiating power. Price and convenience continue to be the primary concerns of consumers; however, an increasing emphasis on health-conscious food options has been factored into consumer demand. The need for food retailers to satisfy this unique and dynamic consumer demand marginally increases consumers’ buying power. On the other hand, the implementation of varying types of incentive programs represents a switching cost, which decreases consumer mobility and can reduce long-term buying power. xxxi Specialty and organic retailers can leverage their high-product differentiation to justify high-margin products that, under normal industry standards, would typically be unsustainable. This arguably further weakens buyer bargaining power within the food retail segment. Industry Leaders & Followers We conclude that leaders within the food retail sub-industry are mass retailers, such as Kroger who has taken a stake in the organic food market, as well as smaller specialty retailers like Sprouts Farmers Market who can proactively react to changes in consumer preferences. On the contrary, larger-scale specialty food retailers, such as WFM, that focus on a smaller segment of consumers with a higher level of disposable income represent lagging performers in the food retail space. We believe these retailers need to consider alternative growth options to sustain their operational viability. Competition WFM is distinguished by its high food ingredient standards, diverse grocery products, and prepared food offerings. xxxii
xxxiii
The firm primarily focuses on its upper-middle class “core-customer” base to sustain its premium pricing system. This system has been challenged by conventional retailers such as Kroger and Wal-Mart. Pressures from these conventional retailers on WFM’s pricing structure have translated to weakening store traffic accompanied by negative comparable store sales in the past six quarters. Extended deflationary conditions in non-organic food products have intensified the competition between WFM and conventional food retailers as well. In a similar manner, an increase in natural and organic food offerings from competing conventional retailers has also put downward pressures on
7
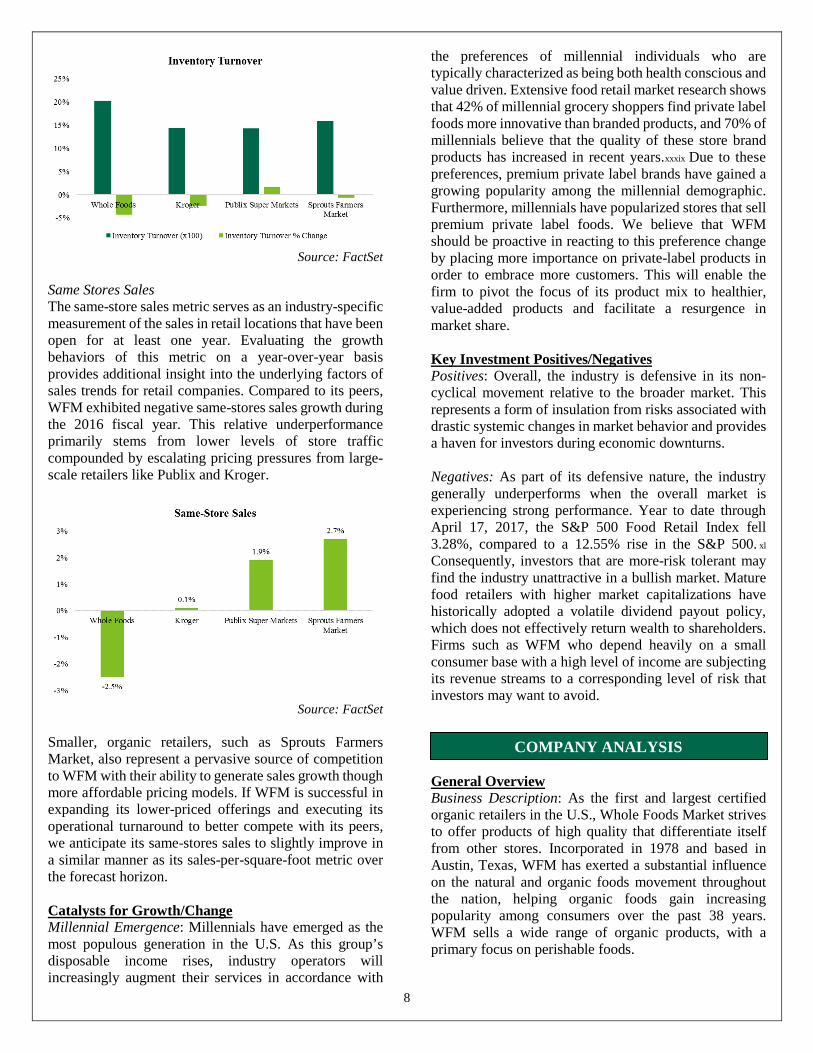
WFM’s comparable store sales. The grocer has confirmed cancellations of two lease agreements and plans to close nine store locations in 2Q 2017.xxxiv This decline in sales growth combined with WFM’s high pricing structure, increased marketing expenditures, and continued growth efforts have all translated to downward earnings revisions for the 2017 fiscal period. xxxv We expect this decline to directly influence management to decrease projected growth estimates via store expansions in future quarters. Total Return to Shareholders WFM has realized negative returns during the past 12-month period; however, such behavior in equity pricing within the broader food retail industry is not unfounded. Sprouts Farmers Markets exhibited extremely strong returns the last 12 months, which was attributed in part to its small size, lower price structure, and innate ability to respond quickly to changing customer sentiment. This presents a challenge to WFM as it attempts to penetrate the market where Sprouts Farmers Markets currently dominates through the expansion of its smaller 365 store format.
Source: FactSet
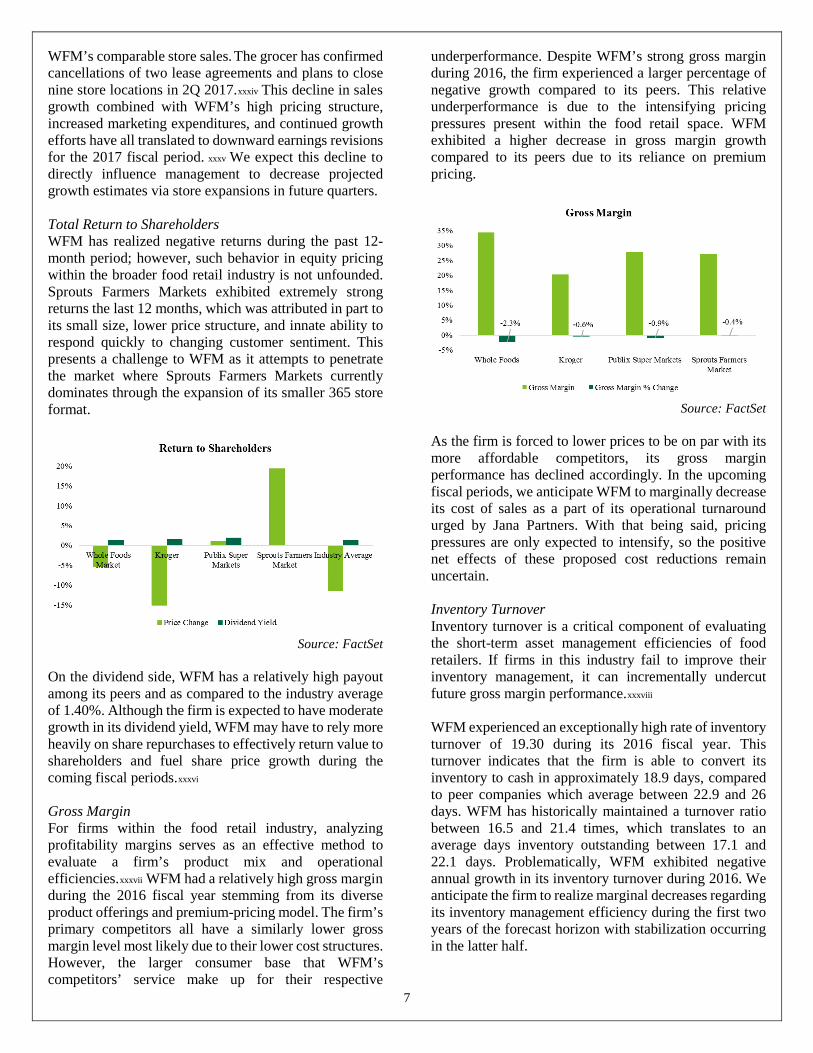
On the dividend side, WFM has a relatively high payout among its peers and as compared to the industry average of 1.40%. Although the firm is expected to have moderate growth in its dividend yield, WFM may have to rely more heavily on share repurchases to effectively return value to shareholders and fuel share price growth during the coming fiscal periods.xxxvi Gross Margin For firms within the food retail industry, analyzing profitability margins serves as an effective method to evaluate a firm’s product mix and operational efficiencies.xxxvii WFM had a relatively high gross margin during the 2016 fiscal year stemming from its diverse product offerings and premium-pricing model. The firm’s primary competitors all have a similarly lower gross margin level most likely due to their lower cost structures. However, the larger consumer base that WFM’s competitors’ service make up for their respective
underperformance. Despite WFM’s strong gross margin during 2016, the firm experienced a larger percentage of negative growth compared to its peers. This relative underperformance is due to the intensifying pricing pressures present within the food retail space. WFM exhibited a higher decrease in gross margin growth compared to its peers due to its reliance on premium pricing.
Source: FactSet
As the firm is forced to lower prices to be on par with its more affordable competitors, its gross margin performance has declined accordingly. In the upcoming fiscal periods, we anticipate WFM to marginally decrease its cost of sales as a part of its operational turnaround urged by Jana Partners. With that being said, pricing pressures are only expected to intensify, so the positive net effects of these proposed cost reductions remain uncertain. Inventory Turnover Inventory turnover is a critical component of evaluating the short-term asset management efficiencies of food retailers. If firms in this industry fail to improve their inventory management, it can incrementally undercut future gross margin performance.xxxviii WFM experienced an exceptionally high rate of inventory turnover of 19.30 during its 2016 fiscal year. This turnover indicates that the firm is able to convert its inventory to cash in approximately 18.9 days, compared to peer companies which average between 22.9 and 26 days. WFM has historically maintained a turnover ratio between 16.5 and 21.4 times, which translates to an average days inventory outstanding between 17.1 and 22.1 days. Problematically, WFM exhibited negative annual growth in its inventory turnover during 2016. We anticipate the firm to realize marginal decreases regarding its inventory management efficiency during the first two years of the forecast horizon with stabilization occurring in the latter half.
8
Source: FactSet Same Stores Sales The same-store sales metric serves as an industry-specific measurement of the sales in retail locations that have been open for at least one year. Evaluating the growth behaviors of this metric on a year-over-year basis provides additional insight into the underlying factors of sales trends for retail companies. Compared to its peers, WFM exhibited negative same-stores sales growth during the 2016 fiscal year. This relative underperformance primarily stems from lower levels of store traffic compounded by escalating pricing pressures from large-scale retailers like Publix and Kroger.
Source: FactSet
Smaller, organic retailers, such as Sprouts Farmers Market, also represent a pervasive source of competition to WFM with their ability to generate sales growth though more affordable pricing models. If WFM is successful in expanding its lower-priced offerings and executing its operational turnaround to better compete with its peers, we anticipate its same-stores sales to slightly improve in a similar manner as its sales-per-square-foot metric over the forecast horizon. Catalysts for Growth/Change Millennial Emergence: Millennials have emerged as the most populous generation in the U.S. As this group’s disposable income rises, industry operators will increasingly augment their services in accordance with
the preferences of millennial individuals who are typically characterized as being both health conscious and value driven. Extensive food retail market research shows that 42% of millennial grocery shoppers find private label foods more innovative than branded products, and 70% of millennials believe that the quality of these store brand products has increased in recent years.xxxix Due to these preferences, premium private label brands have gained a growing popularity among the millennial demographic. Furthermore, millennials have popularized stores that sell premium private label foods. We believe that WFM should be proactive in reacting to this preference change by placing more importance on private-label products in order to embrace more customers. This will enable the firm to pivot the focus of its product mix to healthier, value-added products and facilitate a resurgence in market share. Key Investment Positives/Negatives Positives: Overall, the industry is defensive in its non-cyclical movement relative to the broader market. This represents a form of insulation from risks associated with drastic systemic changes in market behavior and provides a haven for investors during economic downturns. Negatives: As part of its defensive nature, the industry generally underperforms when the overall market is experiencing strong performance. Year to date through April 17, 2017, the S&P 500 Food Retail Index fell 3.28%, compared to a 12.55% rise in the S&P 500. xl Consequently, investors that are more-risk tolerant may find the industry unattractive in a bullish market. Mature food retailers with higher market capitalizations have historically adopted a volatile dividend payout policy, which does not effectively return wealth to shareholders. Firms such as WFM who depend heavily on a small consumer base with a high level of income are subjecting its revenue streams to a corresponding level of risk that investors may want to avoid.
COMPANY ANALYSIS General Overview Business Description: As the first and largest certified organic retailers in the U.S., Whole Foods Market strives to offer products of high quality that differentiate itself from other stores. Incorporated in 1978 and based in Austin, Texas, WFM has exerted a substantial influence on the natural and organic foods movement throughout the nation, helping organic foods gain increasing popularity among consumers over the past 38 years. WFM sells a wide range of organic products, with a primary focus on perishable foods.
9
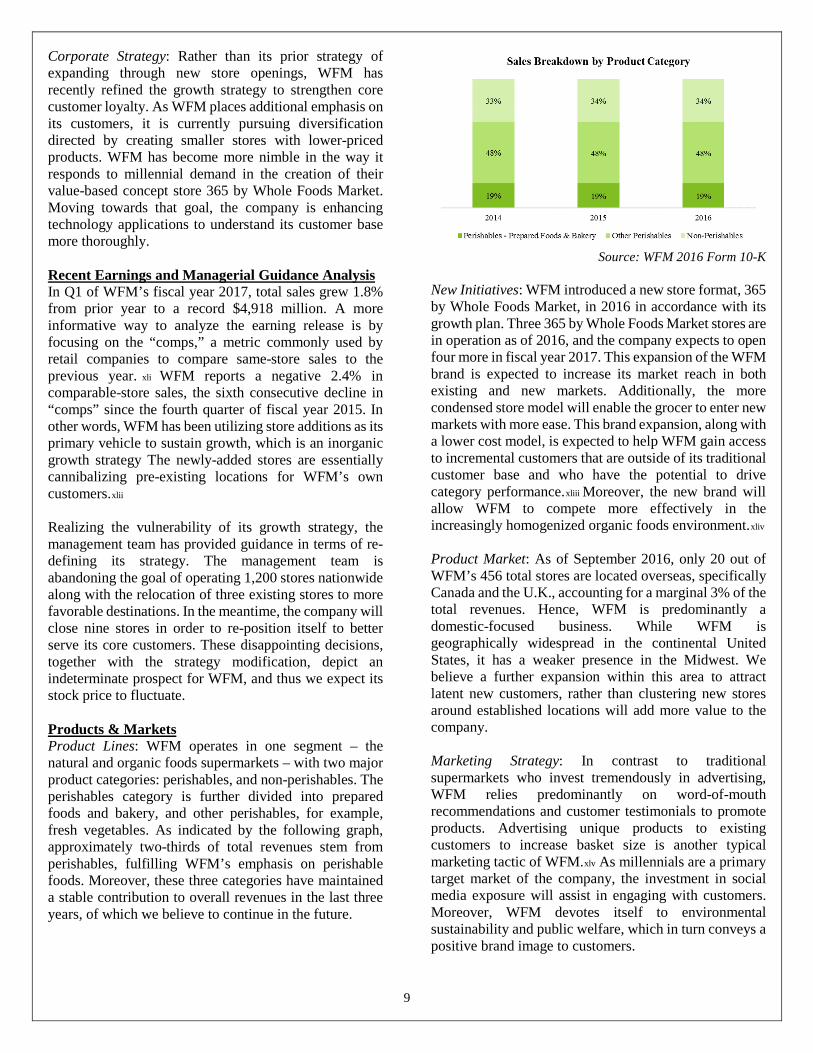
Corporate Strategy: Rather than its prior strategy of expanding through new store openings, WFM has recently refined the growth strategy to strengthen core customer loyalty. As WFM places additional emphasis on its customers, it is currently pursuing diversification directed by creating smaller stores with lower-priced products. WFM has become more nimble in the way it responds to millennial demand in the creation of their value-based concept store 365 by Whole Foods Market. Moving towards that goal, the company is enhancing technology applications to understand its customer base more thoroughly. Recent Earnings and Managerial Guidance Analysis In Q1 of WFM’s fiscal year 2017, total sales grew 1.8% from prior year to a record $4,918 million. A more informative way to analyze the earning release is by focusing on the “comps,” a metric commonly used by retail companies to compare same-store sales to the previous year. xli WFM reports a negative 2.4% in comparable-store sales, the sixth consecutive decline in “comps” since the fourth quarter of fiscal year 2015. In other words, WFM has been utilizing store additions as its primary vehicle to sustain growth, which is an inorganic growth strategy The newly-added stores are essentially cannibalizing pre-existing locations for WFM’s own customers.xlii Realizing the vulnerability of its growth strategy, the management team has provided guidance in terms of re-defining its strategy. The management team is abandoning the goal of operating 1,200 stores nationwide along with the relocation of three existing stores to more favorable destinations. In the meantime, the company will close nine stores in order to re-position itself to better serve its core customers. These disappointing decisions, together with the strategy modification, depict an indeterminate prospect for WFM, and thus we expect its stock price to fluctuate. Products & Markets Product Lines: WFM operates in one segment – the natural and organic foods supermarkets – with two major product categories: perishables, and non-perishables. The perishables category is further divided into prepared foods and bakery, and other perishables, for example, fresh vegetables. As indicated by the following graph, approximately two-thirds of total revenues stem from perishables, fulfilling WFM’s emphasis on perishable foods. Moreover, these three categories have maintained a stable contribution to overall revenues in the last three years, of which we believe to continue in the future.
Source: WFM 2016 Form 10-K
New Initiatives: WFM introduced a new store format, 365 by Whole Foods Market, in 2016 in accordance with its growth plan. Three 365 by Whole Foods Market stores are in operation as of 2016, and the company expects to open four more in fiscal year 2017. This expansion of the WFM brand is expected to increase its market reach in both existing and new markets. Additionally, the more condensed store model will enable the grocer to enter new markets with more ease. This brand expansion, along with a lower cost model, is expected to help WFM gain access to incremental customers that are outside of its traditional customer base and who have the potential to drive category performance.xliii Moreover, the new brand will allow WFM to compete more effectively in the increasingly homogenized organic foods environment.xliv Product Market: As of September 2016, only 20 out of WFM’s 456 total stores are located overseas, specifically Canada and the U.K., accounting for a marginal 3% of the total revenues. Hence, WFM is predominantly a domestic-focused business. While WFM is geographically widespread in the continental United States, it has a weaker presence in the Midwest. We believe a further expansion within this area to attract latent new customers, rather than clustering new stores around established locations will add more value to the company. Marketing Strategy: In contrast to traditional supermarkets who invest tremendously in advertising, WFM relies predominantly on word-of-mouth recommendations and customer testimonials to promote products. Advertising unique products to existing customers to increase basket size is another typical marketing tactic of WFM.xlv As millennials are a primary target market of the company, the investment in social media exposure will assist in engaging with customers. Moreover, WFM devotes itself to environmental sustainability and public welfare, which in turn conveys a positive brand image to customers.
10
Significant Customers: Instead of a particularly large customer base, WFM has a more concentrated customer base. As suggested by the trademark “America’s Healthiest Grocery store,” WFM positions itself towards health-conscious individuals. Studies demonstrate that millennials and working parents at the ages from 30 to 50 represent the most common customers at an average Whole Foods store.
xlvii
xlvi In comparison to the 65 and older demographic that is projected to grow at a rate of over 60% between 2014 and 2030, the working-age population is expected to increase at a much slower rate of 5.09% over the same interval. Admittedly, WFM faces challenges as it appears limited to its current customer base. However, on the basis of this demographic shift, it can realize much more if it tries to target products at the older population in the coming decades as well. Merchandising Process and Suppliers: WFM is dedicated to procuring only quality products from local, regional and national producers. Most of the procurement takes place at the regional and national levels, which aids WFM in negotiating discounts based on volume purchased with major vendors. United Natural Foods is the single largest supplier of WFM, accounting for roughly 32.5% of WFM’s total purchases in 2016. Due to its dependence on this third-party supplier, WFM has designated United Natural Foods as its primary dry grocery and frozen food supplier through 2025 to strengthen their long-term relationship. However, a unilateral termination of the agreement from United Natural Foods could still have an adverse impact on WFM’s operations if an alternative supplier is not in place. Moreover, any interruption or inability of United Natural Foods in delivering products would materially interfere WFM’s normal course of business. Catalysts for Growth/Change Potential Takeover: Due to recent headwinds in WFM’s growth, Jana Partners LLC has built up an 8.8% stake in the firm on April 10, 2017. The activist investor is urging the company to improve its technology and operational efficiencies and is exploring the option of an eventual sale. Looking forward, this urgency from Jana Partners to turn around the firm’s pricing practices and increase outlays in technology are expected to yield operational improvements, and in turn, increase WFM’s ability to compete with its large-scale grocer peers.xlviii Refining of Growth Strategy: WFM is in the process of refining its growth strategy to best serve its core customers as well as adjust its current model utilizing advanced data analytics. Moreover, the firm is investing in data management capabilities so as to directly address its customers’ preferences of safety and healthy consumption. Such efforts are expected to help the firm increase its loyalty among its existing customers who
have a higher level of discretionary income and willing to place a premium on product quality. S.W.O.T. Analysis Strengths High Quality Standards: WFM believes that its quality standards set it apart from other supermarkets, which has facilitated the company to main a strong customer base. Banning hundreds of ingredients commonly sold in other stores, WFM is able to attract customers willing to pay a premium for high quality foods.xlix Although WFM has seen its market share decline at the hands of large-scale grocers, we believe the firm’s pioneering of high product standards coupled with its loyal customer base would help it retain its position within the organic food space. Favorable Industry Trends: Over the past fiscal periods, there has been increased awareness regarding long-term well-being and the role of healthy eating that contributes to overall wellness. Customer concerns regarding ethical food sourcing and overall environmental health are becoming increasingly important alongside more traditional factors such as price and store ambiance. We believe WFM will continue to lever its existing reputation of corporate social responsibility to strengthen its market share and maximize its engagement with health-oriented consumers. Weaknesses “Whole Paycheck” Image: In a study that compared prices of 14 grocery items at WFM with comparable items at rival stores, WFM was the most expensive. Additionally, six out of the eight more costly items at WFM were 40% more expensive than the next cheapest option elsewhere.l This quantifiable high-cost of WFM’s products has translated into a negative perception of the firm’s underlying business model and in turn has shut out a large segment of end-consumers. Declining Same Store Sales: WFM’s comparable store sales has decreased year over year by 2.5%, and Q1 2017 has witnessed the sixth consecutive quarter of negative same-store sales. This consistent decline in sales growth is partially attributed to a growing amount of organic product offerings by large mainstream retailers such as Kroger and Costco Wholesale. This data resulted in a downward revision in sales growth forecasts and management voicing a need for the firm to “thin out” its presence in certain markets. li We see this continued decline in critical same-store sales growth combined with management’s downward earnings guidance for the remainder of the 2017 fiscal period to be an overall negative prospect for mid-term operational performance.
11
Opportunities Online Grocery Shopping: As WFM’s customer demographic is shifting and transitioning to participate in the expanding online market, we believe that providing online shopping services would be beneficial for the company. WFM has initiated a partnership with the delivery service provider Instacart to expand its online grocery shopping strategy. lii WFM can further expand this capability to the majority of its brick and mortar stores in order to better compete with online retailers to satisfy consumers who prioritize convenience in their shopping. Private Label Penetration: One of the firm’s top priorities is increasing the exposure of its private brands.liii WFM’s smaller format store, 365 by Whole Foods Market, is modeled after the firm’s lower-cost, private brand 365 Everyday Value. This venture by WFM is concurrent with Kroger expanding its own corporate brands in addition to general retailers, such as Wal-Mart’s opening smaller “express” locations. We believe that a successful expansion of the 365 store format and private-label brands would allow WFM to compete more aggressively with general grocers and potentially reclaim market share lost from said competitors. Threats Competition: As industry trends show a more health-conscious U.S. population, other grocers and companies have prioritized health-centered products. During the last few years, WFM has experienced competition from new entrants including Sprouts Farmers Market and Trader Joe’s as well as traditional grocers like Kroger and Costco who have been expanding their organic offerings. If the firm’s lower-cost stores and private label brands do not successfully expand its market reach, WFM may continue to see sluggish sales growth stemming from its limited consumer base.
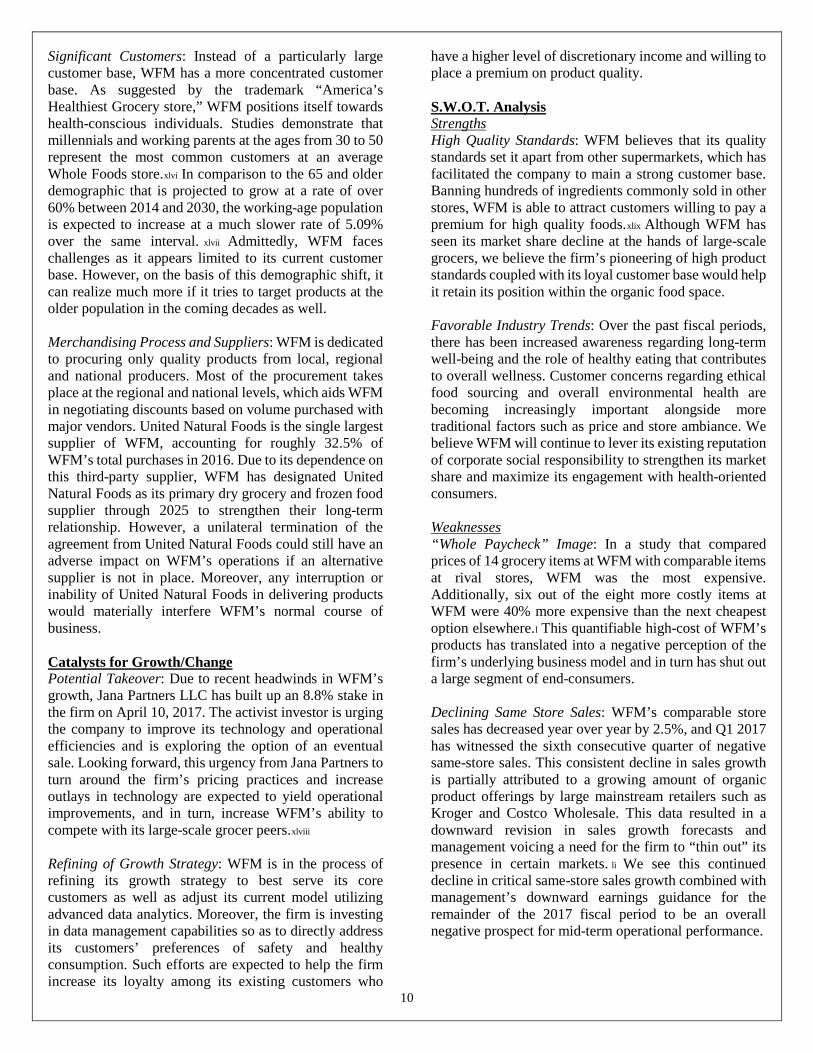
VALUATION ANALYSIS Key Assumptions Revenue Decomposition: Based on our long-term forecast of the 2.5% real GDP growth and WFM’s historical performance, we anticipate that WFM as an off-cyclical consumer staples company would grow its revenue at a gradual pace, maintaining a rate of 2.47% into the steady growth rate period. We decompose WFM’s revenue by number of stores, average square feet per store, and sales per square feet. Number of Stores: We derive our forecast of 24 new stores opening, three of which are 365 by Whole Foods Market, in 2017 from the most recent financial report. In view of
the increasing competitive organic products market, we expect WFM to cut down its new store openings moving forward. Hence, the number of new stores opened is predicted to be 20 each year for the following two years, which is then level off to 18 per year in 2020 and beyond. Additionally, with WFM’s emphasis of the 365 concept stores, we believe this concept format would gradually dominate future new store openings, eventually accounting for 89% of newly opened stores in 2021.
Source: Forecasted F/S
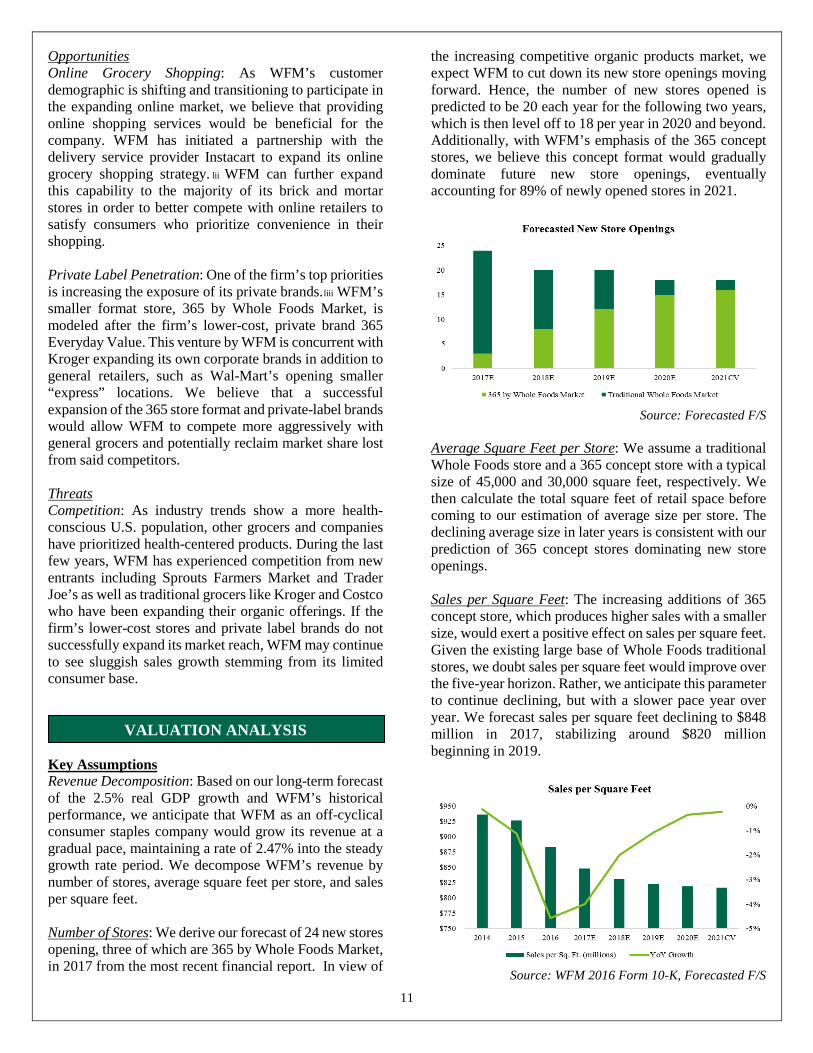
Average Square Feet per Store: We assume a traditional Whole Foods store and a 365 concept store with a typical size of 45,000 and 30,000 square feet, respectively. We then calculate the total square feet of retail space before coming to our estimation of average size per store. The declining average size in later years is consistent with our prediction of 365 concept stores dominating new store openings. Sales per Square Feet: The increasing additions of 365 concept store, which produces higher sales with a smaller size, would exert a positive effect on sales per square feet. Given the existing large base of Whole Foods traditional stores, we doubt sales per square feet would improve over the five-year horizon. Rather, we anticipate this parameter to continue declining, but with a slower pace year over year. We forecast sales per square feet declining to $848 million in 2017, stabilizing around $820 million beginning in 2019.
Source: WFM 2016 Form 10-K, Forecasted F/S
12
Based on our forecast of the above parameters, we derive the resulting total sales and yearly growth rates. Given the historical stable contribution to the overall revenue from three different product categories, we allocate revenue to individual category by applying the corresponding average historical percentage to total sales. Cost of Goods Sold: With more 365 concept stores that provide affordable options in existence, theoretically the gross profit percentage would drop, which in turn implies a larger portion of sales revenue would be consumed by cost of goods sold. However, we believe the technology and distribution improvement impelled by Jana Partners would exert a much stronger impact on lowering the cost of goods sold. As a result, we forecast cost of goods sold as a percentage of sales to decrease by 5 basis points in 2017, stabilizing at 62.39% thereafter. Pre-Opening Expenses: As we expect fewer new stores openings by WFM, it is reasonable to lower our prediction of future pre-opening expenses. We therefore forecast a drop of 2 basis points in future pre-opening expenses as a percentage of sales during years when there is a decline in the number of stores newly opened. Relocation, Store Closure & Lease Termination Costs: Given the stark competition within the organic products market and WFM’s recently re-position of its growth strategy, we anticipate additional store relocation and closure in the coming future. As a result, we factor this opinion in our forecast by adding 5 more basis points of sales every year to relocation, store closure & lease termination costs. Selling, General & Administrative Expenses: We believe the majority of the operational efficiency urged by Jana Partners would be realized in the selling, general and administrative departments. As a result, we forecast selling, general & administrative expenses as a percentage of sales to decrease by 0.1% to 28.44% in 2017, which is then followed by a decline of 2 basis points annually in later years. Long-Term Debt: We forecast long-term debt as a constant percentage of prior year’s total non-cash assets to maintain a stable capital structure. Since most of WFM’s debt comes from off-balance sheet operating leases, long-term debt, which is comprised of solely capital lease obligations, has been a relatively small portion of total liabilities for five years prior to 2016. Given that WFM has just completed the offering of its $1 billion senior note due 2025 last year, we thereby determine the 18.98% derived from the 2016 figure to be the proper factor in our estimation of long-term debt.
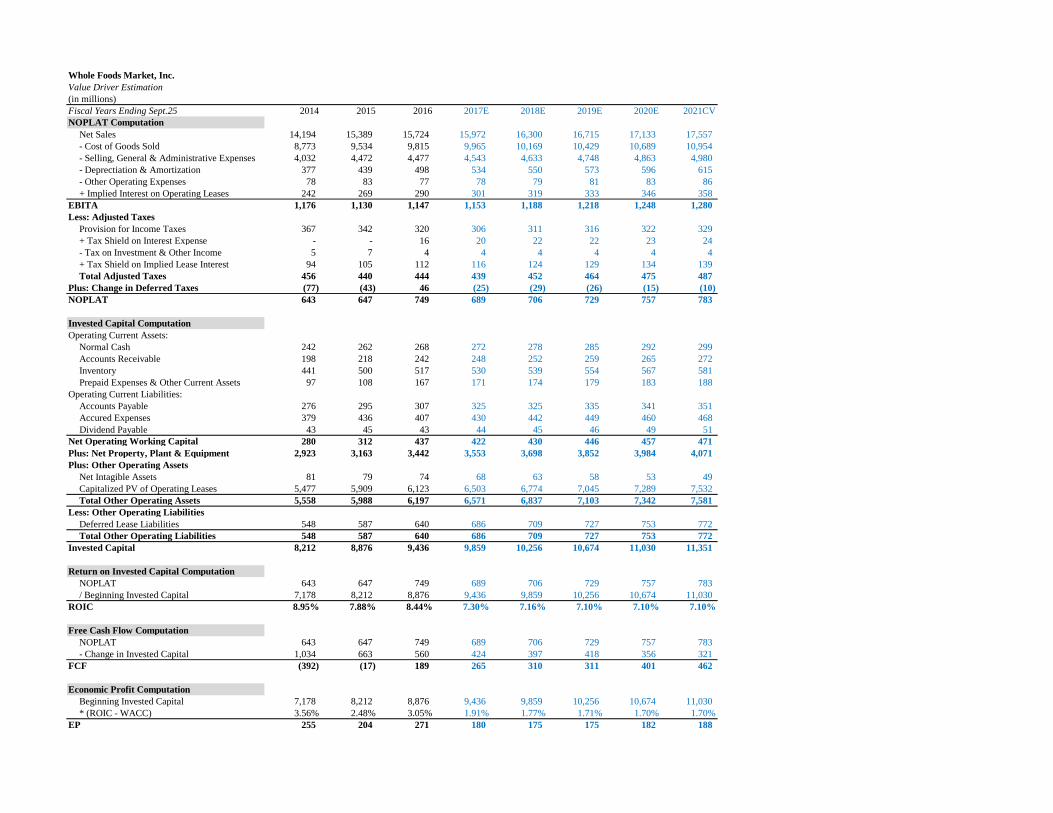
Weighted Average Cost of Capital (WACC) Cost of Equity: We estimate the cost of equity for WFM based on the Capital Asset Pricing Model (CAPM). We use the current yield to maturity (YTM) of 2.92% on the 30-year Treasury bond as the risk-free rate. We derive the risk premium of 4.51% from Aswath Domodaran’s implied equity risk premium as of 4/1/2017. liv After examining various unadjusted raw betas produced by Bloomberg, we determine a beta of 0.89 would best represent the current risk exposure of WFM. These inputs result in a cost of equity of 6.95%. Cost of Debt: We estimate the pre-tax cost of debt for WFM by adding a reasonable default premium to the risk-free rate of 2.92%. To derive the default premium, we first researched the average default premium within consumer staples sector via Bloomberg based on WFM’ current debt rating of BBB-.lv However, there is too few data pertinent to BBB- rating bonds, and thus we expanded our estimation to include all BBB+, BBB, and BBB- bonds to avoid biased representation. Additionally, we believe averaging the typical default premium for both consumer staples sector and consumer discretionary sector better portrays the nature of WFM. After taking all these procedures into account, we calculate a default premium of 1.993%, producing a pre-tax cost of debt of 4.91%. With a marginal tax rate of 38.69%, we get an after-tax cost of debt of 3.01%. WACC: We determine WFM’s current market capitalization to be its market value of equity and we estimate the market value of debt by adding the present value of operating leases to the debt value taken from the balance sheet. Consequently, we generate a capital structure comprising of 60.50% equity and 39.50% debt for WFM. Our calculation yields a WACC of 5.39%. Discounted Cash Flow & Economic Profit Models The discounted cash flow (DCF) and economic profit (EP) models utilize the key value drivers of net operating profit less adjusted taxes (NOPLAT) and invested capital (IC). These two value drivers are then used to calculate the future free cash flows (FCF) and EP values for each respective model during the 5-year horizon. From both models, we calculate an unadjusted intrinsic stock price of $24.71. An adjustment to bring the price from the previous fiscal year end to the current date produces a target price of $25.44. This adjusted price suggests that WFM is currently overvalued by 35.69% relative to its stock price of $34.52. We have taken a more conservative approach with a slightly negative outlook when projecting sales growth over the five-year forecast horizon. This is primarily based on the firm’s negative comparable store sales realized in the past six quarters as well as management’s
13
Q1 2017 downward revision in store growth. WFM is still expected to realize consistently positive FCF due to equally consistent NOPLAT values over its forecast horizon. Additionally, we anticipate the firm’s return on invested capital (ROIC) to deteriorate during the first three years of the forecast horizon due to the continued capital expenditures in the face of moderate growth. Thereafter, ROIC is expected to stabilize at 7.10% facilitated by a recovery in sales growth. We believe that the DCF and EP valuation methodologies yield the most accurate intrinsic stock price due in part to the fact that WFM uses the same methodology for its own valuation purposes.lvi Furthermore, the DCF method takes into consideration multiple operating metrics such as comparable store sales growth, underlying economic indicators such as demographic changes, and projected invested capital (IC) when calculating a final target price. Dividend Discount Model The dividend discount model yields an intrinsic stock price of $26.76. The adjustment from the previous fiscal year end to the current date brings the target price to $27.54. This price from the DDM method suggests that WFM is currently overvalued by 25.34% relative to its current trading price. This method relies heavily on WFM’s future dividend payout policy, which we have forecasted to increase for the duration of the forecast horizon based on managerial guidance. Although the adjusted price is close to the stock price derived from the DCF and EP models, WFM has exhibited a somewhat volatile dividend payout policy in the past six fiscal periods. This historical dividend behavior makes us hesitant to rely heavily on the DDM valuation methodology as an accurate calculation of WFM’s intrinsic price. Relative P/E Valuation Our relative valuation model consists of seven firms within the broader food retailing industry, including two organic/specialty retailers that directly compete with WFM.
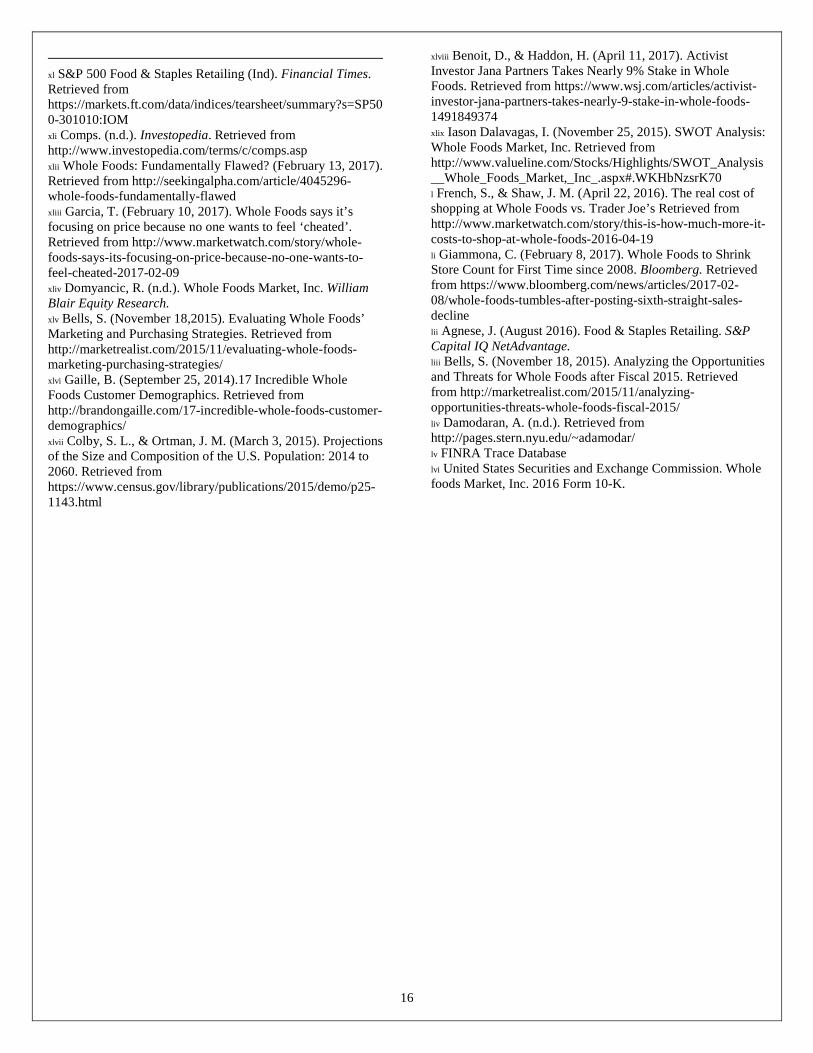
Source: Bloomberg, FactSet
These firms are selected on the basis of their market penetration within the food retail space, their relative profiles of operations, and their market capitalizations relative to WFM’s $11 billion. Larger, non-organic and specialty food retailers are included in the analysis, such as Wal-Mart and Kroger, due to being directly competitive with WFM. We arrive at an intrinsic price between $28.70 and $30.73 based on the two and one-year industry average forward P/E ratios and WFM’s 2018 and 2017 EPS estimates, respectively. This suggests an overvaluation between 12.33% and 20.28% based on the current stock price of $34.52. The resulting target stock prices are slightly higher than both of those calculated using the DCF/EP and DDM valuation methodologies, most likely due to the smaller stock of underlying operating metrics built into the relative valuation model. In summary, the combination of the firm’s inflated stock price due to market expectations of a possible takeover and all four models yielding relatively low intrinsic stock prices indicates that WFM is currently overvalued. This further validates our decision to “sell” WFM and take no action on the security.
SENSITIVITY ANALYSIS Beta vs. Risk Premium We are interested in testing the impact of changes in WACC on the valuation, as both beta and the risk premium are primary components in the WACC calculation. Holding other variables constant, a 0.3% change in the risk premium yields a value from $22.79 to $28.41 while a 0.6 change in beta yields a value from $22.76 to $28.44. Overall, these assumptions have the most significant influence on the final valuation. WACC vs. CV NOPLAT Growth In comparing these two metrics, we are interested in observing how a decrease in the cost of borrowing would affect the share price through sales growth. We forecast the CV NOPLAT growth to be the same as the growth rate of sales revenue in the CV year, which is affected by the ability to borrow cheaply. On the upside, a 0.3% increase in CV NOPLAT growth, together with a decrease in WACC of 0.3% generates a value of $34.50, representing approximately 35.61% increase in the intrinsic value. %COGS of Sales vs. %SG&A of Sales Cost of goods sold (COGS) and selling, general and administrative (SG&A) expenses comprise the largest proportion of expenses. Since we factor potential cost-saving benefits from technology, distribution, and operational improvement pressured by Jana Partners into
Company Name Share Price
P/E 17 P/E 18
Costco Wholesale 169.70$ 29.9 26.4Kroger 30.00$ 13.6 12.9
Ingles Markets 44.40$ 16.1 15.1Natural Grocers 10.82$ 22.1 20.0
Sprouts Farmers Market 22.94$ 26.1 22.7SpartanNash 35.18$ 15.2 14.3
Wal-Mart Stores 73.49$ 17.0 16.2Whole Foods Market 34.52$ 22.5 21.9
14
our assumptions for both accounts, we are interested in how variation in these costs would affect the stock price. If both costs as percentages of sales are to increase 0.3%, WFM would exhibit a price of $18.98. By contrast, if the cost-cutting activities are more effective than we anticipate, a 0.3% reduction in both costs would generate a price of $31.90. Pre-Tax Cost of Debt vs. Marginal Tax Rate In a political environment where tax rates are likely to change, we are interested in the effect of a change in the marginal tax rate and the pre-tax cost of debt. As an average of debt ratings is used in the computation of the default premium, we are aware of the subjectivity in the calculation and how that may impact WFM’s intrinsic value. A $0.23 price increase is realized should both rates decrease 0.3%. Holding other variables constant, a rise in the pre-tax cost of debt to 5.21% would bring the price to $25.59. Risk-Free Rate vs. CV ROIC Growth As interest rates have been rising in the general economy, we want to test how an equivalent increase in the risk-free rate and CV ROIC growth could impact the company’s intrinsic value. A 0.3% increase in the risk-free rate, accompanied by an equivalent rise in the growth rate of ROIC in the CV year, results in a price of $23.05. Capital Expenditures vs. %Depreciation of Net PPE Given that the majority of WFM’s capital expenditures are related to new stores openings, we acknowledge that any variation in the number of new stores to be opened would have a significant influence on WFM’s capital investments. Should WFM incur 3% less capital expenditures in 2017, together with a 0.3% change in depreciation as a percentage of net PPE, a price range of $25.48 to $26.04 would be generated.
IMPORTANT DISCLAIMER This report was created by students enrolled in the Applied Equity Valuation (FIN:4250) class at the University of Iowa. The report was originally created to offer an internal investment recommendation for the University of Iowa Krause Fund and its advisory board. The report also provides potential employers and other interested parties an example of the students’ skills, knowledge and abilities. Members of the Krause Fund are not registered investment advisors, brokers or officially licensed financial professionals. The investment advice contained in this report does not represent an offer or solicitation to buy or sell any of the securities mentioned. Unless otherwise noted, facts and figures included in this report are from publicly available sources. This report is
not a complete compilation of data, and its accuracy is not guaranteed. From time to time, the University of Iowa, its faculty, staff, students, or the Krause Fund may hold a financial interest in the companies mentioned in this report.
15
Reference
i Real Gross Domestic Product (GDP). (n.d.). Investopedia. Retrieved from http://www.investopedia.com/terms/r/realgdp.asp ii Fisher Investments, Cannivet, M., & Teufel, A. S. (2009). Fishers Investments on Consumer Staples. Hoboken, NJ: John Wiley & Sons, Inc. iii Gross Domestic Product: Fourth Quarter and Annual 2016 (Third Estimate). (March 30, 2017). Bureau of Economic Analysis. Retrieved from https://www.bea.gov/newsreleases/national/gdp/2017/gdp4q16_3rd.htm iv Inflation. (n.d.). Investopedia. Retrieved from http://www.investopedia.com/terms/i/inflation.asp v Fisher Investments, Cannivet, M., & Teufel, A. S. (2009). Fishers Investments on Consumer Staples. Hoboken, NJ: John Wiley & Sons, Inc. vi Consumer Price Index Summary. (April 14, 2017). Bureau of Labor Statistics. Retrieved from https://www.bls.gov/news.release/cpi.nr0.htm vii Federal Funds Rate. (n.d.). Investopedia. Retrieved from http://www.investopedia.com/terms/f/federalfundsrate.asp viii Decisions Regarding Monetary Policy Implementation. (March 15, 2017). Board of Governors of the Federal Reserve System. Retrieved from https://www.federalreserve.gov/newsevents/pressreleases/monetary20170315a.htm ix Crutsinger, M. (January 4, 2017). If economy heats up, Fed rate hikes may accelerate. The Salt Lake Tribune. Retrieved from http://www.sltrib.com/home/4780822-155/if-economy-heats-up-fed-rate x D'Costa, V. (October 2016). Meat, Beef & Poultry Processing in the US. IBIS World. xi Employee Situation Summary. (April 7, 2017). Bureau of Labor Statistics. Retrieved from https://www.bls.gov/news.release/empsit.nr0.htm xii Horsley, S. (January 29, 2017). Ahead of Trump’s First Jobs Report, A Look at His Remarks on the Numbers. NPR. Retrieved from http://www.npr.org/2017/01/29/511493685/ahead-of-trumps-first-jobs-report-a-look-at-his-remarks-on-the-numbers xiii Lahart, J. (March 23, 2017). Fewer Immigrants, Higher Prices, Lower Profits. The Wall Street Journal. Retrieved from https://www.wsj.com/articles/fewer-immigrants-higher-prices-lower-profits-1490279355?tesla=y xiv Consumer Confidence Index (CCI). (n.d.). Investopedia. Retrieved from http://www.investopedia.com/terms/c/cci.asp xv Consumer Confidence. (n.d.). Retrieved from http://mam.econoday.com/byshoweventfull.asp?fid=477922&cust=mam#top xvi Consumer Confidence Survey. (n.d.) Retrieved from https://www.conference-board.org/data/consumerconfidence.cfm xvii Zacks Equity Research. (January 25, 2017). Will an Improving Economy Benefit Consumer Staples Stocks? NASDAQ. Retrieved from http://www.nasdaq.com/article/will-an-improving-economy-benefit-consumer-staples-stocks-cm738386 xviii Online Grocery Shopping on Pace For 9.5 Percent Annual Growth. (n.d.). Retrieved from
http://www.retailleader.com/top-story-research-online_grocery_shopping_on_pace_for_9.5_percent_annual_growth-1635.html xix Enright, A. (April 14, 2016). Wal-Mart and Kroger expand e-grocery services. Retrieved from https://www.internetretailer.com/2016/04/14/wal-mart-and-kroger-expand-e-grocery-services xx Daniells, S. (January 3, 2014). US Organic Food Market to Grow 14% from 2014-18. Retrieved from http://www.foodnavigator-usa.com/Markets/US-organic-food-market-to-grow-14-from-2013-18 xxi Offner, J. (August 15, 2016). Organics Claiming More Retail Shelf Space, Suppliers Say. Retrieved from http://www.thepacker.com/marketing-profiles/organic-produce/organics-claiming-more-retail-shelf-space-suppliers-say xxii Agnese, J. (August 2016). Food & Staples Retailing. S&P Capital IQ NetAdvantage. xxiii Christensen, C. M., Alton, R., Rising, C., & Waldeck, A. (March 2011). The Big Idea: The New M&A Playbook. Harvard Business Review. Retrieved from https://hbr.org/2011/03/the-big-idea-the-new-ma-playbook xxiv Agnese, J. (August 2016). Food & Staples Retailing. S&P Capital IQ NetAdvantage. xxv Hurley, M. (January 2017). Supermarkets & Grocery Stores in the US. IBISWorld. xxvi United States – Food & Grocery Retail. (October 19, 2016). Retrieved from http://advantage.marketline.com.proxy.lib.uiowa.edu/Product?pid=MLIP2133-0054&view=d0e411 xxvii Hurley, M. (January 2017). Supermarkets & Grocery Stores in the US. IBISWorld. xxviii FactSet Company/Security, Industry Quick Screen. xxix United States – Food & Grocery Retail. (October 19, 2016). Retrieved from http://advantage.marketline.com.proxy.lib.uiowa.edu/Product?pid=MLIP2133-0054&view=d0e411 xxx United States – Food & Grocery Retail. (October 19, 2016). Retrieved from http://advantage.marketline.com.proxy.lib.uiowa.edu/Product?pid=MLIP2133-0054&view=d0e411 xxxi United States – Food & Grocery Retail. (October 19, 2016). Retrieved from http://advantage.marketline.com.proxy.lib.uiowa.edu/Product?pid=MLIP2133-0054&view=d0e411 xxxii United States Securities and Exchange Commission. Whole foods Market, Inc. 2016 Form 10-K. xxxiii Domyancic, R. (n.d.). Whole Foods Market, Inc. William Blair Equity Research. xxxiv United States Securities and Exchange Commission. Whole foods Market, Inc. 2016 Form 10-K. xxxv Domyancic, R. (n.d.). Whole Foods Market, Inc. William Blair Equity Research. xxxvi FactSet Company/Security, Industry Quick Screen. xxxvii Agnese, J. (February 2017). Food & Staples Retailing. S&P Capital IQ NetAdvantage. xxxviii Agnese, J. (February 2017). Food & Staples Retailing. S&P Capital IQ NetAdvantage xxxix Procurement Research Reports. (n.d.). IBISWorld.
16
xl S&P 500 Food & Staples Retailing (Ind). Financial Times. Retrieved from https://markets.ft.com/data/indices/tearsheet/summary?s=SP500-301010:IOM xli Comps. (n.d.). Investopedia. Retrieved from http://www.investopedia.com/terms/c/comps.asp xlii Whole Foods: Fundamentally Flawed? (February 13, 2017). Retrieved from http://seekingalpha.com/article/4045296-whole-foods-fundamentally-flawed xliii Garcia, T. (February 10, 2017). Whole Foods says it’s focusing on price because no one wants to feel ‘cheated’. Retrieved from http://www.marketwatch.com/story/whole-foods-says-its-focusing-on-price-because-no-one-wants-to-feel-cheated-2017-02-09 xliv Domyancic, R. (n.d.). Whole Foods Market, Inc. William Blair Equity Research. xlv Bells, S. (November 18,2015). Evaluating Whole Foods’ Marketing and Purchasing Strategies. Retrieved from http://marketrealist.com/2015/11/evaluating-whole-foods-marketing-purchasing-strategies/ xlvi Gaille, B. (September 25, 2014).17 Incredible Whole Foods Customer Demographics. Retrieved from http://brandongaille.com/17-incredible-whole-foods-customer-demographics/ xlvii Colby, S. L., & Ortman, J. M. (March 3, 2015). Projections of the Size and Composition of the U.S. Population: 2014 to 2060. Retrieved from https://www.census.gov/library/publications/2015/demo/p25-1143.html
xlviii Benoit, D., & Haddon, H. (April 11, 2017). Activist Investor Jana Partners Takes Nearly 9% Stake in Whole Foods. Retrieved from https://www.wsj.com/articles/activist-investor-jana-partners-takes-nearly-9-stake-in-whole-foods-1491849374 xlix Iason Dalavagas, I. (November 25, 2015). SWOT Analysis: Whole Foods Market, Inc. Retrieved from http://www.valueline.com/Stocks/Highlights/SWOT_Analysis__Whole_Foods_Market,_Inc_.aspx#.WKHbNzsrK70 l French, S., & Shaw, J. M. (April 22, 2016). The real cost of shopping at Whole Foods vs. Trader Joe’s Retrieved from http://www.marketwatch.com/story/this-is-how-much-more-it-costs-to-shop-at-whole-foods-2016-04-19 li Giammona, C. (February 8, 2017). Whole Foods to Shrink Store Count for First Time since 2008. Bloomberg. Retrieved from https://www.bloomberg.com/news/articles/2017-02-08/whole-foods-tumbles-after-posting-sixth-straight-sales-decline lii Agnese, J. (August 2016). Food & Staples Retailing. S&P Capital IQ NetAdvantage. liii Bells, S. (November 18, 2015). Analyzing the Opportunities and Threats for Whole Foods after Fiscal 2015. Retrieved from http://marketrealist.com/2015/11/analyzing-opportunities-threats-whole-foods-fiscal-2015/ liv Damodaran, A. (n.d.). Retrieved from http://pages.stern.nyu.edu/~adamodar/ lv FINRA Trace Database lvi United States Securities and Exchange Commission. Whole foods Market, Inc. 2016 Form 10-K.
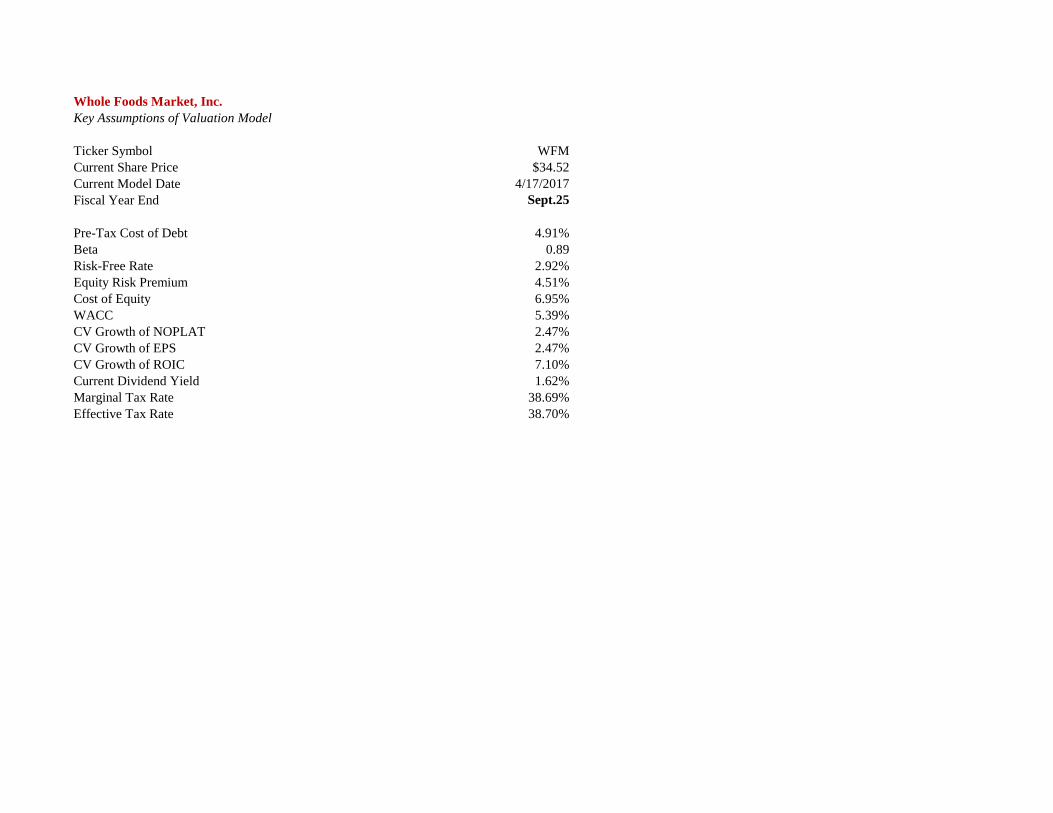
Whole Foods Market, Inc.Key Assumptions of Valuation Model
Ticker Symbol WFMCurrent Share Price $34.52 Current Model Date 4/17/2017Fiscal Year End Sept.25
Pre-Tax Cost of Debt 4.91%Beta 0.89Risk-Free Rate 2.92%Equity Risk Premium 4.51%Cost of Equity 6.95%WACC 5.39%CV Growth of NOPLAT 2.47%CV Growth of EPS 2.47%CV Growth of ROIC 7.10%Current Dividend Yield 1.62%Marginal Tax Rate 38.69%Effective Tax Rate 38.70%
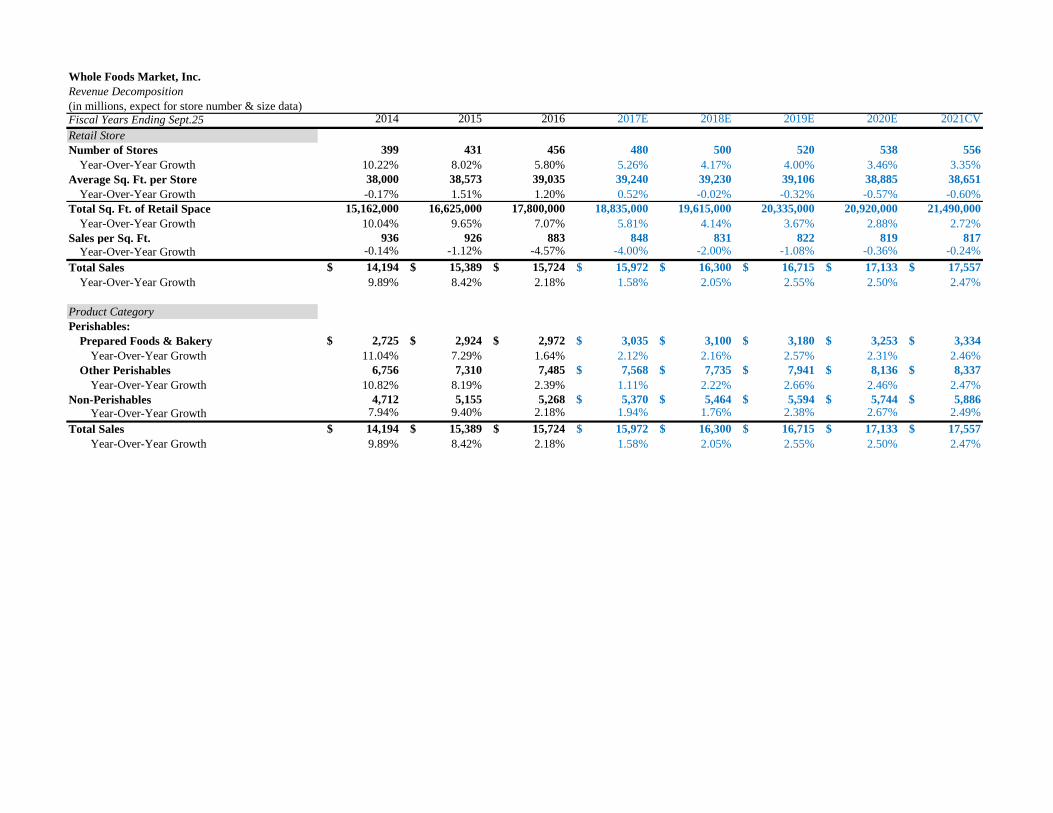
Whole Foods Market, Inc.Revenue Decomposition(in millions, expect for store number & size data)Fiscal Years Ending Sept.25 2014 2015 2016 2017E 2018E 2019E 2020E 2021CVRetail StoreNumber of Stores 399 431 456 480 500 520 538 556
Year-Over-Year Growth 10.22% 8.02% 5.80% 5.26% 4.17% 4.00% 3.46% 3.35%Average Sq. Ft. per Store 38,000 38,573 39,035 39,240 39,230 39,106 38,885 38,651
Year-Over-Year Growth -0.17% 1.51% 1.20% 0.52% -0.02% -0.32% -0.57% -0.60%Total Sq. Ft. of Retail Space 15,162,000 16,625,000 17,800,000 18,835,000 19,615,000 20,335,000 20,920,000 21,490,000
Year-Over-Year Growth 10.04% 9.65% 7.07% 5.81% 4.14% 3.67% 2.88% 2.72%Sales per Sq. Ft. 936 926 883 848 831 822 819 817
Year-Over-Year Growth -0.14% -1.12% -4.57% -4.00% -2.00% -1.08% -0.36% -0.24%Total Sales $ 14,194 $ 15,389 $ 15,724 $ 15,972 $ 16,300 $ 16,715 $ 17,133 $ 17,557
Year-Over-Year Growth 9.89% 8.42% 2.18% 1.58% 2.05% 2.55% 2.50% 2.47%
Product CategoryPerishables:
Prepared Foods & Bakery $ 2,725 $ 2,924 $ 2,972 $ 3,035 $ 3,100 $ 3,180 $ 3,253 $ 3,334 Year-Over-Year Growth 11.04% 7.29% 1.64% 2.12% 2.16% 2.57% 2.31% 2.46%
Other Perishables 6,756 7,310 7,485 $ 7,568 $ 7,735 $ 7,941 $ 8,136 $ 8,337 Year-Over-Year Growth 10.82% 8.19% 2.39% 1.11% 2.22% 2.66% 2.46% 2.47%
Non-Perishables 4,712 5,155 5,268 $ 5,370 $ 5,464 $ 5,594 $ 5,744 $ 5,886 Year-Over-Year Growth 7.94% 9.40% 2.18% 1.94% 1.76% 2.38% 2.67% 2.49%
Total Sales $ 14,194 $ 15,389 $ 15,724 $ 15,972 $ 16,300 $ 16,715 $ 17,133 $ 17,557 Year-Over-Year Growth 9.89% 8.42% 2.18% 1.58% 2.05% 2.55% 2.50% 2.47%
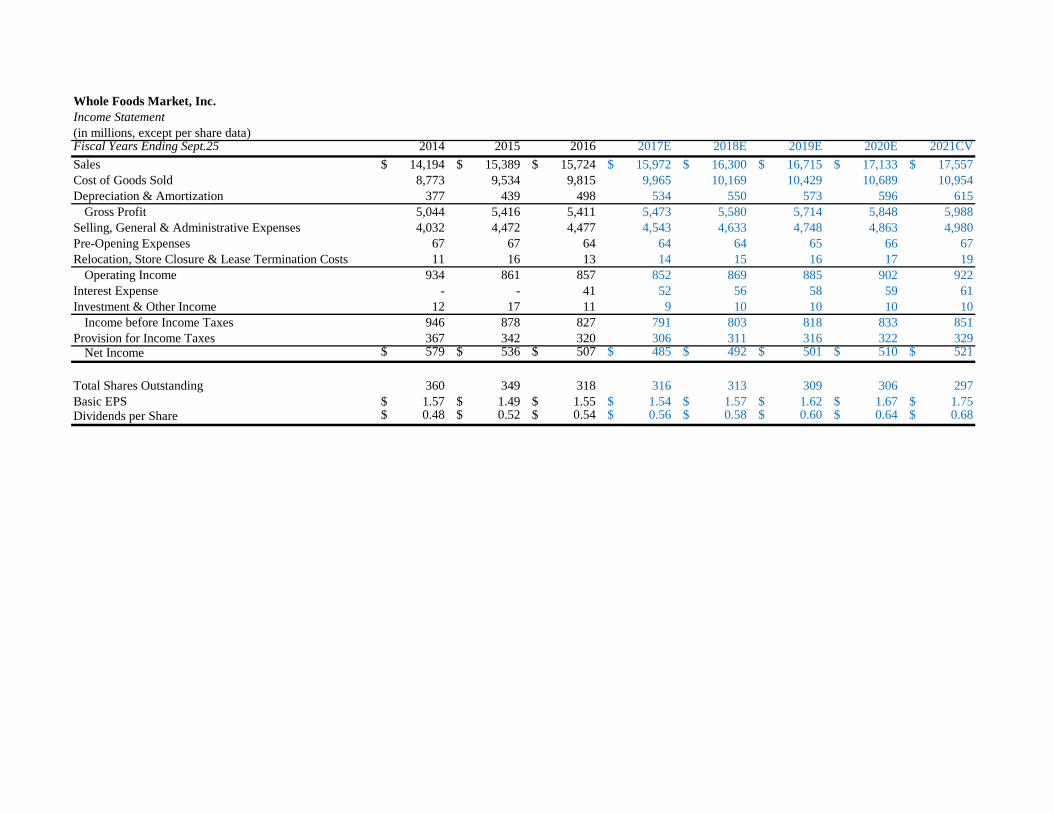
Whole Foods Market, Inc.Income Statement(in millions, except per share data)Fiscal Years Ending Sept.25 2014 2015 2016 2017E 2018E 2019E 2020E 2021CVSales $ 14,194 $ 15,389 $ 15,724 $ 15,972 $ 16,300 $ 16,715 $ 17,133 $ 17,557 Cost of Goods Sold 8,773 9,534 9,815 9,965 10,169 10,429 10,689 10,954 Depreciation & Amortization 377 439 498 534 550 573 596 615
Gross Profit 5,044 5,416 5,411 5,473 5,580 5,714 5,848 5,988 Selling, General & Administrative Expenses 4,032 4,472 4,477 4,543 4,633 4,748 4,863 4,980 Pre-Opening Expenses 67 67 64 64 64 65 66 67 Relocation, Store Closure & Lease Termination Costs 11 16 13 14 15 16 17 19
Operating Income 934 861 857 852 869 885 902 922 Interest Expense - - 41 52 56 58 59 61 Investment & Other Income 12 17 11 9 10 10 10 10
Income before Income Taxes 946 878 827 791 803 818 833 851 Provision for Income Taxes 367 342 320 306 311 316 322 329
Net Income $ 579 $ 536 $ 507 $ 485 $ 492 $ 501 $ 510 $ 521
Total Shares Outstanding 360 349 318 316 313 309 306 297 Basic EPS $ 1.57 $ 1.49 $ 1.55 $ 1.54 $ 1.57 $ 1.62 $ 1.67 $ 1.75 Dividends per Share $ 0.48 $ 0.52 $ 0.54 $ 0.56 $ 0.58 $ 0.60 $ 0.64 $ 0.68
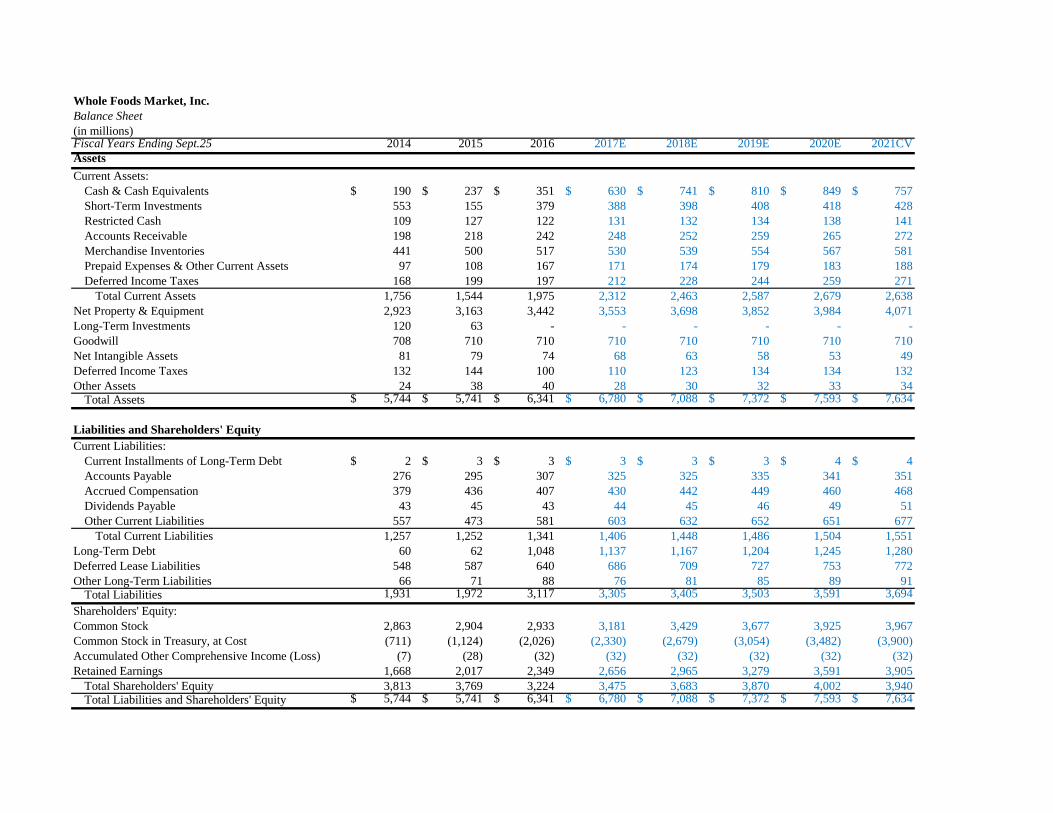
Whole Foods Market, Inc.Balance Sheet(in millions)Fiscal Years Ending Sept.25 2014 2015 2016 2017E 2018E 2019E 2020E 2021CV AssetsCurrent Assets:
Cash & Cash Equivalents $ 190 $ 237 $ 351 $ 630 $ 741 $ 810 $ 849 $ 757 Short-Term Investments 553 155 379 388 398 408 418 428 Restricted Cash 109 127 122 131 132 134 138 141 Accounts Receivable 198 218 242 248 252 259 265 272 Merchandise Inventories 441 500 517 530 539 554 567 581 Prepaid Expenses & Other Current Assets 97 108 167 171 174 179 183 188 Deferred Income Taxes 168 199 197 212 228 244 259 271
Total Current Assets 1,756 1,544 1,975 2,312 2,463 2,587 2,679 2,638 Net Property & Equipment 2,923 3,163 3,442 3,553 3,698 3,852 3,984 4,071 Long-Term Investments 120 63 - - - - - - Goodwill 708 710 710 710 710 710 710 710 Net Intangible Assets 81 79 74 68 63 58 53 49 Deferred Income Taxes 132 144 100 110 123 134 134 132 Other Assets 24 38 40 28 30 32 33 34
Total Assets $ 5,744 $ 5,741 $ 6,341 $ 6,780 $ 7,088 $ 7,372 $ 7,593 $ 7,634
Liabilities and Shareholders' EquityCurrent Liabilities:
Current Installments of Long-Term Debt $ 2 $ 3 $ 3 $ 3 $ 3 $ 3 $ 4 $ 4 Accounts Payable 276 295 307 325 325 335 341 351 Accrued Compensation 379 436 407 430 442 449 460 468 Dividends Payable 43 45 43 44 45 46 49 51 Other Current Liabilities 557 473 581 603 632 652 651 677
Total Current Liabilities 1,257 1,252 1,341 1,406 1,448 1,486 1,504 1,551 Long-Term Debt 60 62 1,048 1,137 1,167 1,204 1,245 1,280 Deferred Lease Liabilities 548 587 640 686 709 727 753 772 Other Long-Term Liabilities 66 71 88 76 81 85 89 91
Total Liabilities 1,931 1,972 3,117 3,305 3,405 3,503 3,591 3,694 Shareholders' Equity:Common Stock 2,863 2,904 2,933 3,181 3,429 3,677 3,925 3,967 Common Stock in Treasury, at Cost (711) (1,124) (2,026) (2,330) (2,679) (3,054) (3,482) (3,900)Accumulated Other Comprehensive Income (Loss) (7) (28) (32) (32) (32) (32) (32) (32)Retained Earnings 1,668 2,017 2,349 2,656 2,965 3,279 3,591 3,905
Total Shareholders' Equity 3,813 3,769 3,224 3,475 3,683 3,870 4,002 3,940 Total Liabilities and Shareholders' Equity $ 5,744 $ 5,741 $ 6,341 $ 6,780 $ 7,088 $ 7,372 $ 7,593 $ 7,634
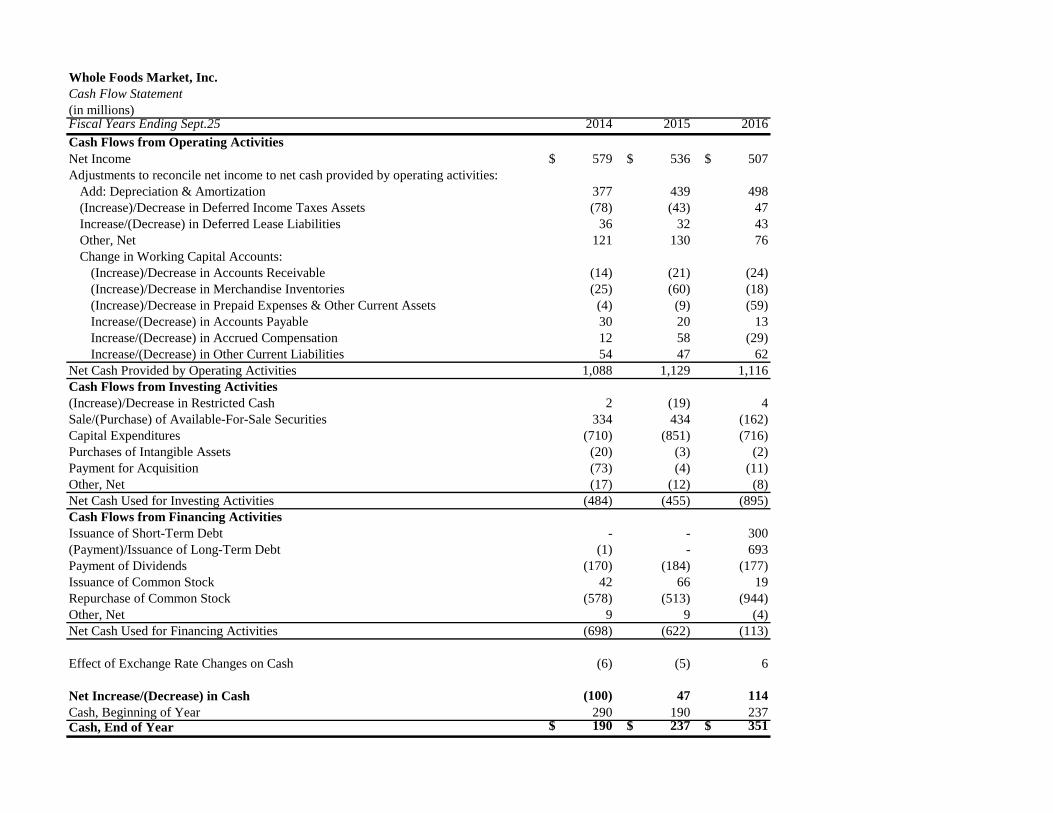
Whole Foods Market, Inc.Cash Flow Statement(in millions)Fiscal Years Ending Sept.25 2014 2015 2016Cash Flows from Operating ActivitiesNet Income $ 579 $ 536 $ 507 Adjustments to reconcile net income to net cash provided by operating activities:
Add: Depreciation & Amortization 377 439 498 (Increase)/Decrease in Deferred Income Taxes Assets (78) (43) 47 Increase/(Decrease) in Deferred Lease Liabilities 36 32 43 Other, Net 121 130 76 Change in Working Capital Accounts:
(Increase)/Decrease in Accounts Receivable (14) (21) (24)(Increase)/Decrease in Merchandise Inventories (25) (60) (18)(Increase)/Decrease in Prepaid Expenses & Other Current Assets (4) (9) (59)Increase/(Decrease) in Accounts Payable 30 20 13 Increase/(Decrease) in Accrued Compensation 12 58 (29)Increase/(Decrease) in Other Current Liabilities 54 47 62
Net Cash Provided by Operating Activities 1,088 1,129 1,116 Cash Flows from Investing Activities(Increase)/Decrease in Restricted Cash 2 (19) 4 Sale/(Purchase) of Available-For-Sale Securities 334 434 (162)Capital Expenditures (710) (851) (716)Purchases of Intangible Assets (20) (3) (2)Payment for Acquisition (73) (4) (11)Other, Net (17) (12) (8)Net Cash Used for Investing Activities (484) (455) (895)Cash Flows from Financing ActivitiesIssuance of Short-Term Debt - - 300 (Payment)/Issuance of Long-Term Debt (1) - 693 Payment of Dividends (170) (184) (177)Issuance of Common Stock 42 66 19 Repurchase of Common Stock (578) (513) (944)Other, Net 9 9 (4)Net Cash Used for Financing Activities (698) (622) (113)
Effect of Exchange Rate Changes on Cash (6) (5) 6
Net Increase/(Decrease) in Cash (100) 47 114 Cash, Beginning of Year 290 190 237 Cash, End of Year $ 190 $ 237 $ 351
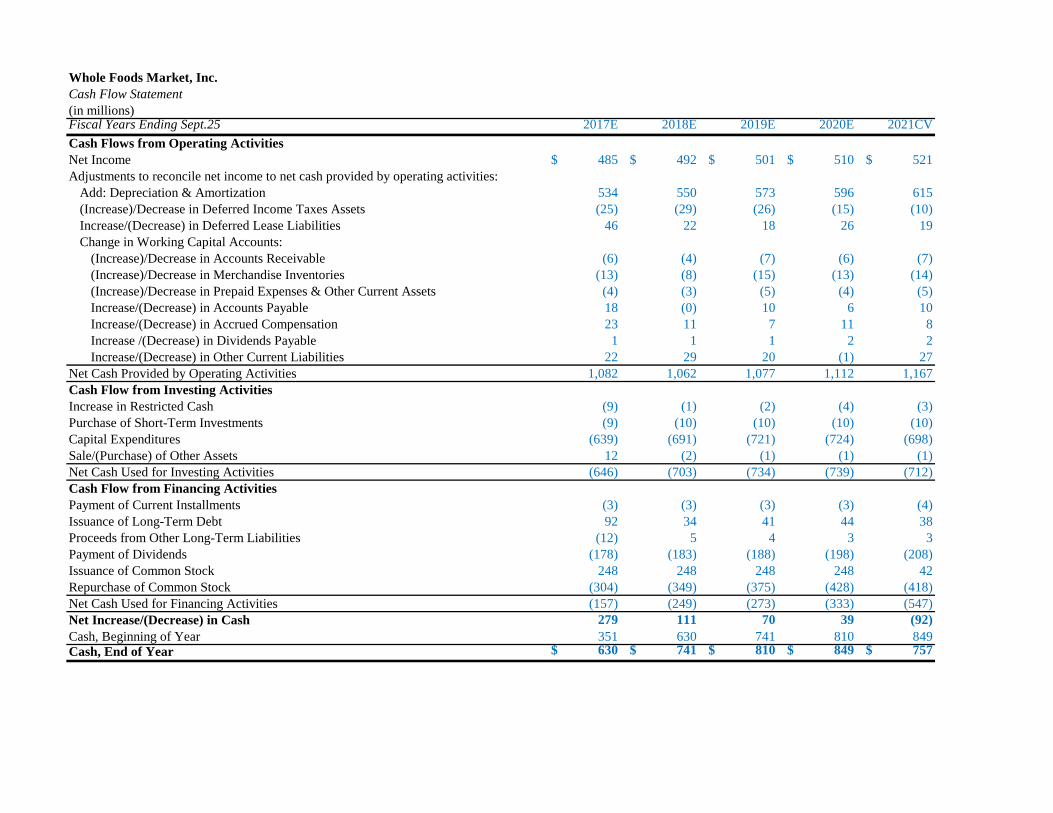
Whole Foods Market, Inc.Cash Flow Statement(in millions)Fiscal Years Ending Sept.25 2017E 2018E 2019E 2020E 2021CV Cash Flows from Operating ActivitiesNet Income $ 485 $ 492 $ 501 $ 510 $ 521 Adjustments to reconcile net income to net cash provided by operating activities:
Add: Depreciation & Amortization 534 550 573 596 615 (Increase)/Decrease in Deferred Income Taxes Assets (25) (29) (26) (15) (10)Increase/(Decrease) in Deferred Lease Liabilities 46 22 18 26 19 Change in Working Capital Accounts:
(Increase)/Decrease in Accounts Receivable (6) (4) (7) (6) (7)(Increase)/Decrease in Merchandise Inventories (13) (8) (15) (13) (14)(Increase)/Decrease in Prepaid Expenses & Other Current Assets (4) (3) (5) (4) (5)Increase/(Decrease) in Accounts Payable 18 (0) 10 6 10 Increase/(Decrease) in Accrued Compensation 23 11 7 11 8 Increase /(Decrease) in Dividends Payable 1 1 1 2 2 Increase/(Decrease) in Other Current Liabilities 22 29 20 (1) 27
Net Cash Provided by Operating Activities 1,082 1,062 1,077 1,112 1,167 Cash Flow from Investing ActivitiesIncrease in Restricted Cash (9) (1) (2) (4) (3)Purchase of Short-Term Investments (9) (10) (10) (10) (10)Capital Expenditures (639) (691) (721) (724) (698)Sale/(Purchase) of Other Assets 12 (2) (1) (1) (1)Net Cash Used for Investing Activities (646) (703) (734) (739) (712)Cash Flow from Financing ActivitiesPayment of Current Installments (3) (3) (3) (3) (4)Issuance of Long-Term Debt 92 34 41 44 38 Proceeds from Other Long-Term Liabilities (12) 5 4 3 3 Payment of Dividends (178) (183) (188) (198) (208)Issuance of Common Stock 248 248 248 248 42 Repurchase of Common Stock (304) (349) (375) (428) (418)Net Cash Used for Financing Activities (157) (249) (273) (333) (547)Net Increase/(Decrease) in Cash 279 111 70 39 (92)Cash, Beginning of Year 351 630 741 810 849 Cash, End of Year $ 630 $ 741 $ 810 $ 849 $ 757
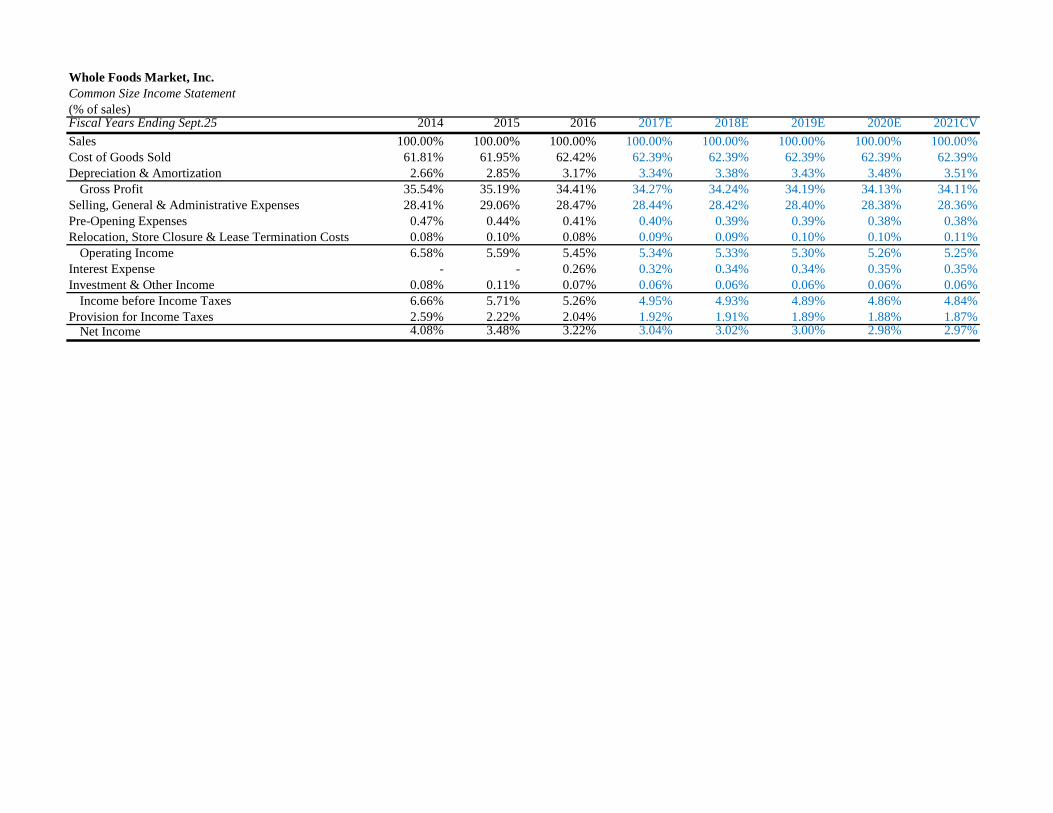
Whole Foods Market, Inc.Common Size Income Statement(% of sales)Fiscal Years Ending Sept.25 2014 2015 2016 2017E 2018E 2019E 2020E 2021CVSales 100.00% 100.00% 100.00% 100.00% 100.00% 100.00% 100.00% 100.00%Cost of Goods Sold 61.81% 61.95% 62.42% 62.39% 62.39% 62.39% 62.39% 62.39%Depreciation & Amortization 2.66% 2.85% 3.17% 3.34% 3.38% 3.43% 3.48% 3.51%
Gross Profit 35.54% 35.19% 34.41% 34.27% 34.24% 34.19% 34.13% 34.11%Selling, General & Administrative Expenses 28.41% 29.06% 28.47% 28.44% 28.42% 28.40% 28.38% 28.36%Pre-Opening Expenses 0.47% 0.44% 0.41% 0.40% 0.39% 0.39% 0.38% 0.38%Relocation, Store Closure & Lease Termination Costs 0.08% 0.10% 0.08% 0.09% 0.09% 0.10% 0.10% 0.11%
Operating Income 6.58% 5.59% 5.45% 5.34% 5.33% 5.30% 5.26% 5.25%Interest Expense - - 0.26% 0.32% 0.34% 0.34% 0.35% 0.35%Investment & Other Income 0.08% 0.11% 0.07% 0.06% 0.06% 0.06% 0.06% 0.06%
Income before Income Taxes 6.66% 5.71% 5.26% 4.95% 4.93% 4.89% 4.86% 4.84%Provision for Income Taxes 2.59% 2.22% 2.04% 1.92% 1.91% 1.89% 1.88% 1.87%
Net Income 4.08% 3.48% 3.22% 3.04% 3.02% 3.00% 2.98% 2.97%
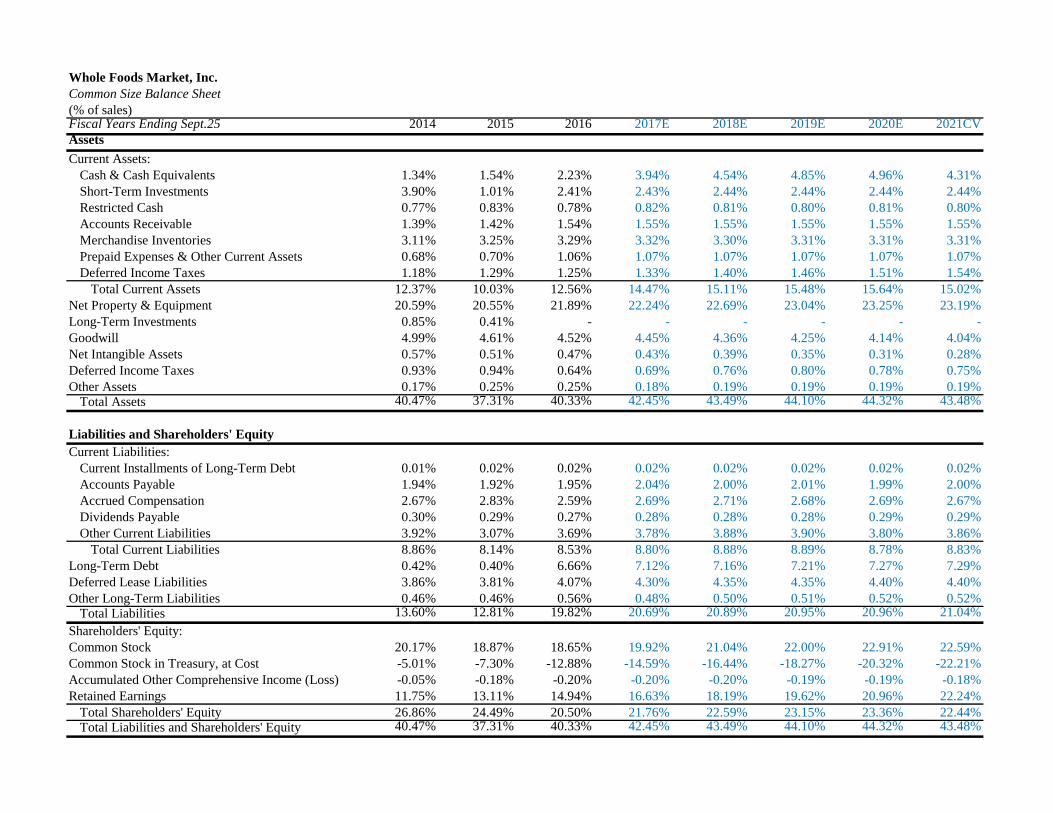
Whole Foods Market, Inc.Common Size Balance Sheet(% of sales)Fiscal Years Ending Sept.25 2014 2015 2016 2017E 2018E 2019E 2020E 2021CVAssetsCurrent Assets:
Cash & Cash Equivalents 1.34% 1.54% 2.23% 3.94% 4.54% 4.85% 4.96% 4.31%Short-Term Investments 3.90% 1.01% 2.41% 2.43% 2.44% 2.44% 2.44% 2.44%Restricted Cash 0.77% 0.83% 0.78% 0.82% 0.81% 0.80% 0.81% 0.80%Accounts Receivable 1.39% 1.42% 1.54% 1.55% 1.55% 1.55% 1.55% 1.55%Merchandise Inventories 3.11% 3.25% 3.29% 3.32% 3.30% 3.31% 3.31% 3.31%Prepaid Expenses & Other Current Assets 0.68% 0.70% 1.06% 1.07% 1.07% 1.07% 1.07% 1.07%Deferred Income Taxes 1.18% 1.29% 1.25% 1.33% 1.40% 1.46% 1.51% 1.54%
Total Current Assets 12.37% 10.03% 12.56% 14.47% 15.11% 15.48% 15.64% 15.02%Net Property & Equipment 20.59% 20.55% 21.89% 22.24% 22.69% 23.04% 23.25% 23.19%Long-Term Investments 0.85% 0.41% - - - - - - Goodwill 4.99% 4.61% 4.52% 4.45% 4.36% 4.25% 4.14% 4.04%Net Intangible Assets 0.57% 0.51% 0.47% 0.43% 0.39% 0.35% 0.31% 0.28%Deferred Income Taxes 0.93% 0.94% 0.64% 0.69% 0.76% 0.80% 0.78% 0.75%Other Assets 0.17% 0.25% 0.25% 0.18% 0.19% 0.19% 0.19% 0.19%
Total Assets 40.47% 37.31% 40.33% 42.45% 43.49% 44.10% 44.32% 43.48%
Liabilities and Shareholders' EquityCurrent Liabilities:
Current Installments of Long-Term Debt 0.01% 0.02% 0.02% 0.02% 0.02% 0.02% 0.02% 0.02%Accounts Payable 1.94% 1.92% 1.95% 2.04% 2.00% 2.01% 1.99% 2.00%Accrued Compensation 2.67% 2.83% 2.59% 2.69% 2.71% 2.68% 2.69% 2.67%Dividends Payable 0.30% 0.29% 0.27% 0.28% 0.28% 0.28% 0.29% 0.29%Other Current Liabilities 3.92% 3.07% 3.69% 3.78% 3.88% 3.90% 3.80% 3.86%
Total Current Liabilities 8.86% 8.14% 8.53% 8.80% 8.88% 8.89% 8.78% 8.83%Long-Term Debt 0.42% 0.40% 6.66% 7.12% 7.16% 7.21% 7.27% 7.29%Deferred Lease Liabilities 3.86% 3.81% 4.07% 4.30% 4.35% 4.35% 4.40% 4.40%Other Long-Term Liabilities 0.46% 0.46% 0.56% 0.48% 0.50% 0.51% 0.52% 0.52%
Total Liabilities 13.60% 12.81% 19.82% 20.69% 20.89% 20.95% 20.96% 21.04%Shareholders' Equity:Common Stock 20.17% 18.87% 18.65% 19.92% 21.04% 22.00% 22.91% 22.59%Common Stock in Treasury, at Cost -5.01% -7.30% -12.88% -14.59% -16.44% -18.27% -20.32% -22.21%Accumulated Other Comprehensive Income (Loss) -0.05% -0.18% -0.20% -0.20% -0.20% -0.19% -0.19% -0.18%Retained Earnings 11.75% 13.11% 14.94% 16.63% 18.19% 19.62% 20.96% 22.24%
Total Shareholders' Equity 26.86% 24.49% 20.50% 21.76% 22.59% 23.15% 23.36% 22.44%Total Liabilities and Shareholders' Equity 40.47% 37.31% 40.33% 42.45% 43.49% 44.10% 44.32% 43.48%
Whole Foods Market, Inc.Value Driver Estimation(in millions)Fiscal Years Ending Sept.25 2014 2015 2016 2017E 2018E 2019E 2020E 2021CVNOPLAT Computation
Net Sales 14,194 15,389 15,724 15,972 16,300 16,715 17,133 17,557 - Cost of Goods Sold 8,773 9,534 9,815 9,965 10,169 10,429 10,689 10,954 - Selling, General & Administrative Expenses 4,032 4,472 4,477 4,543 4,633 4,748 4,863 4,980 - Deprectiation & Amortization 377 439 498 534 550 573 596 615 - Other Operating Expenses 78 83 77 78 79 81 83 86 + Implied Interest on Operating Leases 242 269 290 301 319 333 346 358
EBITA 1,176 1,130 1,147 1,153 1,188 1,218 1,248 1,280 Less: Adjusted Taxes
Provision for Income Taxes 367 342 320 306 311 316 322 329 + Tax Shield on Interest Expense - - 16 20 22 22 23 24 - Tax on Investment & Other Income 5 7 4 4 4 4 4 4 + Tax Shield on Implied Lease Interest 94 105 112 116 124 129 134 139 Total Adjusted Taxes 456 440 444 439 452 464 475 487
Plus: Change in Deferred Taxes (77) (43) 46 (25) (29) (26) (15) (10) NOPLAT 643 647 749 689 706 729 757 783
Invested Capital Computation Operating Current Assets:
Normal Cash 242 262 268 272 278 285 292 299 Accounts Receivable 198 218 242 248 252 259 265 272 Inventory 441 500 517 530 539 554 567 581 Prepaid Expenses & Other Current Assets 97 108 167 171 174 179 183 188
Operating Current Liabilities: Accounts Payable 276 295 307 325 325 335 341 351 Accured Expenses 379 436 407 430 442 449 460 468 Dividend Payable 43 45 43 44 45 46 49 51
Net Operating Working Capital 280 312 437 422 430 446 457 471 Plus: Net Property, Plant & Equipment 2,923 3,163 3,442 3,553 3,698 3,852 3,984 4,071 Plus: Other Operating Assets
Net Intagible Assets 81 79 74 68 63 58 53 49 Capitalized PV of Operating Leases 5,477 5,909 6,123 6,503 6,774 7,045 7,289 7,532 Total Other Operating Assets 5,558 5,988 6,197 6,571 6,837 7,103 7,342 7,581
Less: Other Operating LiabilitiesDeferred Lease Liabilities 548 587 640 686 709 727 753 772 Total Other Operating Liabilities 548 587 640 686 709 727 753 772
Invested Capital 8,212 8,876 9,436 9,859 10,256 10,674 11,030 11,351
Return on Invested Capital ComputationNOPLAT 643 647 749 689 706 729 757 783 / Beginning Invested Capital 7,178 8,212 8,876 9,436 9,859 10,256 10,674 11,030
ROIC 8.95% 7.88% 8.44% 7.30% 7.16% 7.10% 7.10% 7.10%
Free Cash Flow ComputationNOPLAT 643 647 749 689 706 729 757 783 - Change in Invested Capital 1,034 663 560 424 397 418 356 321
FCF (392) (17) 189 265 310 311 401 462
Economic Profit ComputationBeginning Invested Capital 7,178 8,212 8,876 9,436 9,859 10,256 10,674 11,030 * (ROIC - WACC) 3.56% 2.48% 3.05% 1.91% 1.77% 1.71% 1.70% 1.70%
EP 255 204 271 180 175 175 182 188
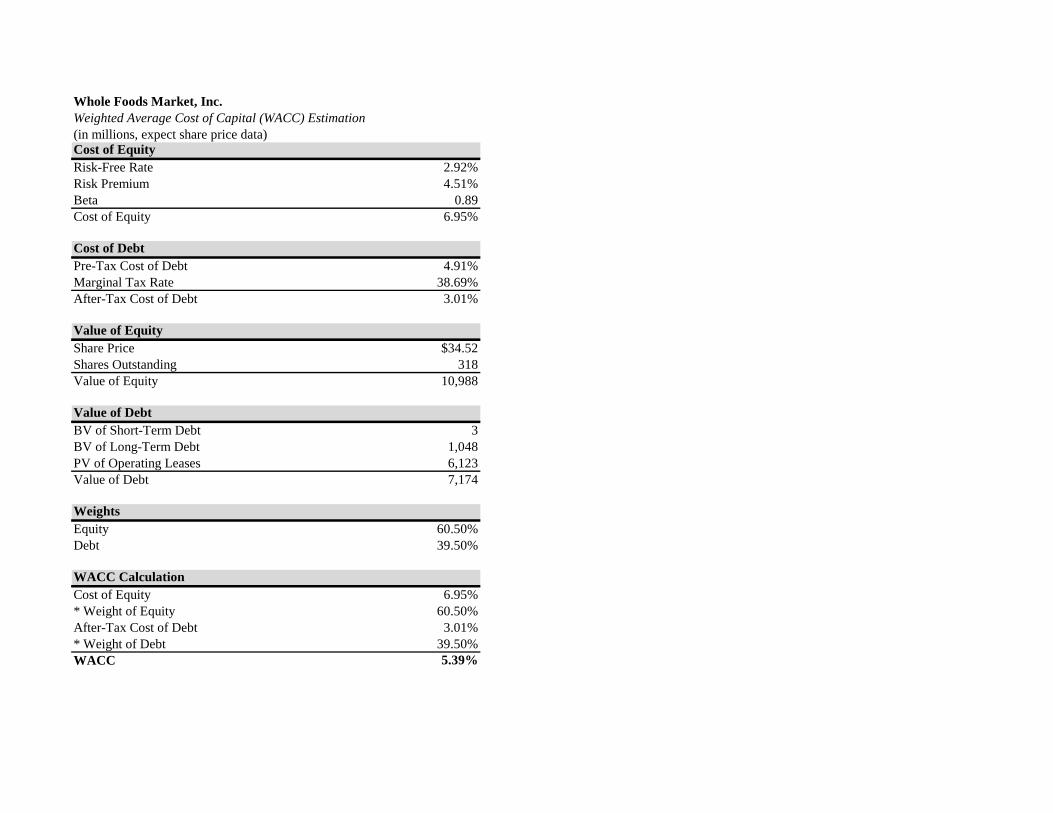
Whole Foods Market, Inc.Weighted Average Cost of Capital (WACC) Estimation(in millions, expect share price data)Cost of EquityRisk-Free Rate 2.92%Risk Premium 4.51%Beta 0.89Cost of Equity 6.95%
Cost of DebtPre-Tax Cost of Debt 4.91%Marginal Tax Rate 38.69%After-Tax Cost of Debt 3.01%
Value of EquityShare Price $34.52 Shares Outstanding 318 Value of Equity 10,988
Value of DebtBV of Short-Term Debt 3BV of Long-Term Debt 1,048 PV of Operating Leases 6,123 Value of Debt 7,174
WeightsEquity 60.50%Debt 39.50%
WACC CalculationCost of Equity 6.95%* Weight of Equity 60.50%After-Tax Cost of Debt 3.01%* Weight of Debt 39.50%WACC 5.39%

Whole Foods Market, Inc.Discounted Cash Flow (DCF) and Economic Profit (EP) Valuation Models(in millions, expect share price data)Key Inputs: CV Growth 2.47% CV ROIC 7.10% WACC 5.39% Cost of Equity 6.95%
Fiscal Years Ending Sept.25 2016 2017E 2018E 2019E 2020E 2021CV 2016 2017E 2018E 2019E 2020E 2021CV
Discounted Cash Flow Model Economic Profit ModelFree Cash Flow 265 310 311 401 Economic Profit 180 175 175 182 Continuing Value 17,466 Continuing Value 6,436 Future Cash Flows 265 310 311 401 17,466 Future Cash Flows 180 175 175 182 6,436 Discount Periods 1 2 3 4 4 Discount Periods 1 2 3 4 4Discounted Cash Flows 252 279 266 325 14,155 Discounted Cash Flows 171 157 150 147 5216
PV of Economic Profit 5,841 Beginning Invested Capital 9,436
Value of Operating Assets 15,277 Value of Operating Assets 15,277 Excess Cash 83 Excess Cash 83 Short-Term Investments 379 Short-Term Investments 379 Restricted Cash 122 Restricted Cash 122 Other Assets 40 Other Assets 40 Current Installments of Long-Term Debt (3) Current Installments of Long-Term Debt (3)Long-Term Debt (1,048) Long-Term Debt (1,048)Other Current Liabilities (581) Other Current Liabilities (581)Other Long-Term Liabilities (88) Other Long-Term Liabilities (88)PV of Operating Leases (6,123) PV of Operating Leases (6,123)PV of Employee Stock Options Plan (191) PV of Employee Stock Options Plan (191)Value of Equity 7,867 Value of Equity 7,867 Shares Outstanding 318 Shares Outstanding 318 Intrinsic Stock Price $ 24.71 Intrinsic Stock Price $ 24.71
Today 4/17/2017 Today 4/17/2017Fiscal Year Ending 9/25/2016 Fiscal Year Ending 9/25/2016Elapsed Fraction 0.559 Elapsed Fraction 0.559(Cost of Equity - Annual Dividend Yield) 5.33% (Cost of Equity - Annual Dividend Yield) 5.33%Adjusted Stock Price $ 25.44 Adjusted Stock Price $ 25.44
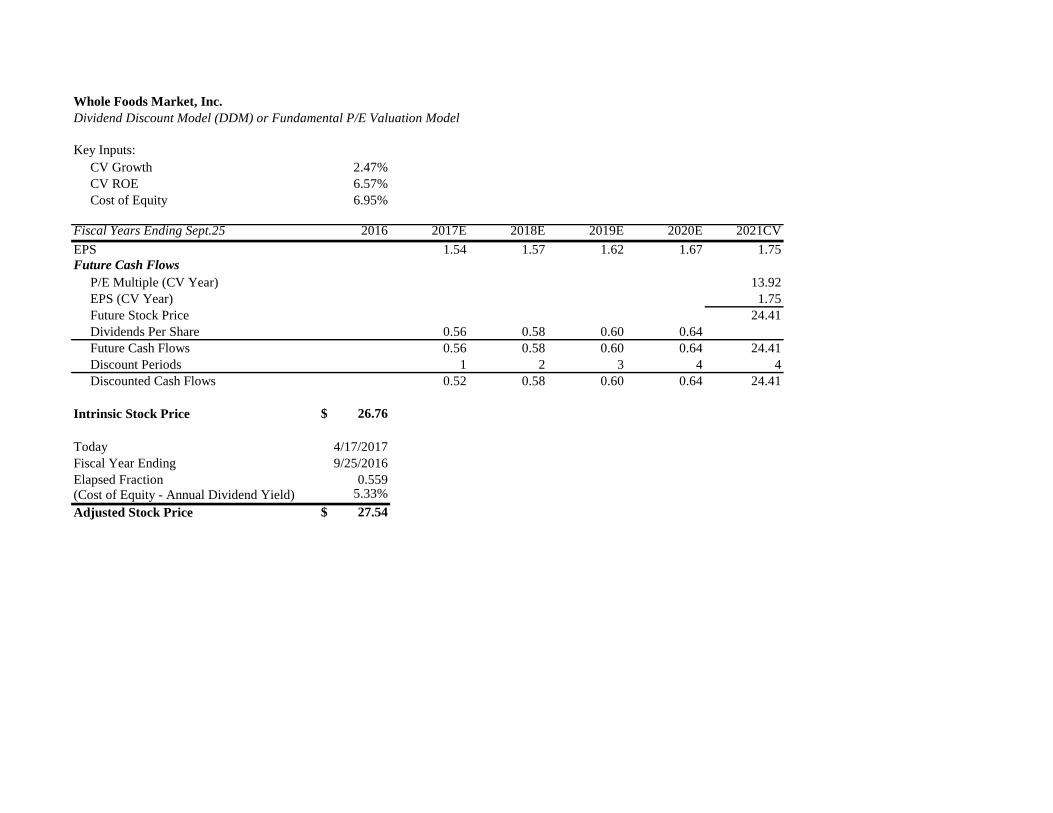
Whole Foods Market, Inc.Dividend Discount Model (DDM) or Fundamental P/E Valuation Model
Key Inputs: CV Growth 2.47% CV ROE 6.57% Cost of Equity 6.95%
Fiscal Years Ending Sept.25 2016 2017E 2018E 2019E 2020E 2021CVEPS 1.54 1.57 1.62 1.67 1.75 Future Cash Flows P/E Multiple (CV Year) 13.92 EPS (CV Year) 1.75 Future Stock Price 24.41 Dividends Per Share 0.56 0.58 0.60 0.64 Future Cash Flows 0.56 0.58 0.60 0.64 24.41 Discount Periods 1 2 3 4 4 Discounted Cash Flows 0.52 0.58 0.60 0.64 24.41
Intrinsic Stock Price $ 26.76
Today 4/17/2017Fiscal Year Ending 9/25/2016Elapsed Fraction 0.559(Cost of Equity - Annual Dividend Yield) 5.33%Adjusted Stock Price $ 27.54
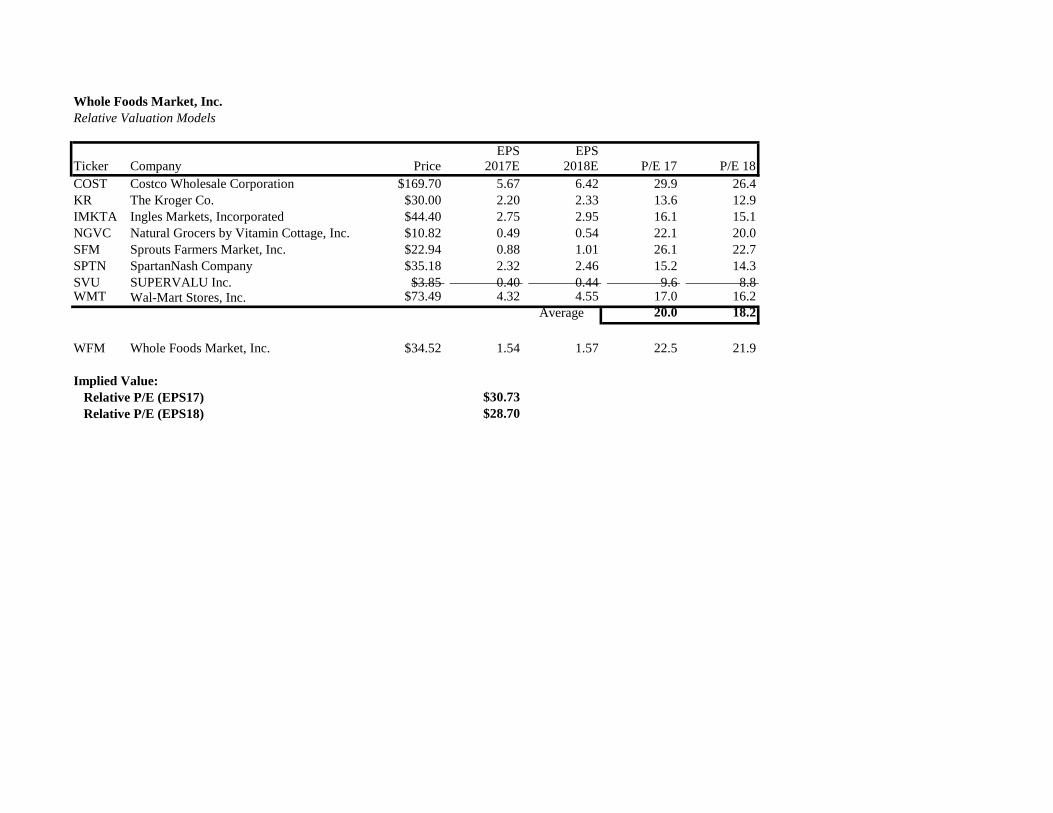
Whole Foods Market, Inc.Relative Valuation Models
EPS EPSTicker Company Price 2017E 2018E P/E 17 P/E 18COST Costco Wholesale Corporation $169.70 5.67 6.42 29.9 26.4 KR The Kroger Co. $30.00 2.20 2.33 13.6 12.9 IMKTA Ingles Markets, Incorporated $44.40 2.75 2.95 16.1 15.1 NGVC Natural Grocers by Vitamin Cottage, Inc. $10.82 0.49 0.54 22.1 20.0 SFM Sprouts Farmers Market, Inc. $22.94 0.88 1.01 26.1 22.7 SPTN SpartanNash Company $35.18 2.32 2.46 15.2 14.3 SVU SUPERVALU Inc. $3.85 0.40 0.44 9.6 8.8 WMT Wal-Mart Stores, Inc. $73.49 4.32 4.55 17.0 16.2
Average 20.0 18.2
WFM Whole Foods Market, Inc. $34.52 1.54 1.57 22.5 21.9
Implied Value: Relative P/E (EPS17) $30.73 Relative P/E (EPS18) $28.70
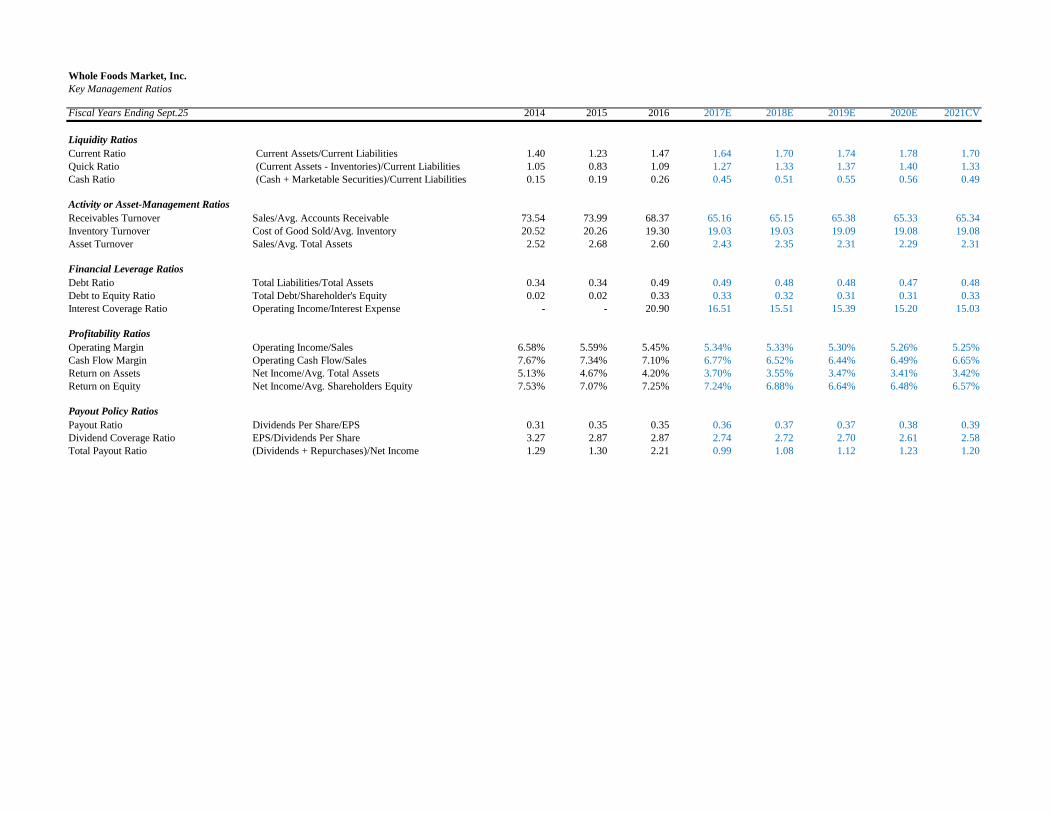
Whole Foods Market, Inc.Key Management Ratios
Fiscal Years Ending Sept.25 2014 2015 2016 2017E 2018E 2019E 2020E 2021CV
Liquidity RatiosCurrent Ratio Current Assets/Current Liabilities 1.40 1.23 1.47 1.64 1.70 1.74 1.78 1.70Quick Ratio (Current Assets - Inventories)/Current Liabilities 1.05 0.83 1.09 1.27 1.33 1.37 1.40 1.33Cash Ratio (Cash + Marketable Securities)/Current Liabilities 0.15 0.19 0.26 0.45 0.51 0.55 0.56 0.49
Activity or Asset-Management RatiosReceivables Turnover Sales/Avg. Accounts Receivable 73.54 73.99 68.37 65.16 65.15 65.38 65.33 65.34Inventory Turnover Cost of Good Sold/Avg. Inventory 20.52 20.26 19.30 19.03 19.03 19.09 19.08 19.08Asset Turnover Sales/Avg. Total Assets 2.52 2.68 2.60 2.43 2.35 2.31 2.29 2.31
Financial Leverage RatiosDebt Ratio Total Liabilities/Total Assets 0.34 0.34 0.49 0.49 0.48 0.48 0.47 0.48Debt to Equity Ratio Total Debt/Shareholder's Equity 0.02 0.02 0.33 0.33 0.32 0.31 0.31 0.33Interest Coverage Ratio Operating Income/Interest Expense - - 20.90 16.51 15.51 15.39 15.20 15.03
Profitability RatiosOperating Margin Operating Income/Sales 6.58% 5.59% 5.45% 5.34% 5.33% 5.30% 5.26% 5.25%Cash Flow Margin Operating Cash Flow/Sales 7.67% 7.34% 7.10% 6.77% 6.52% 6.44% 6.49% 6.65%Return on Assets Net Income/Avg. Total Assets 5.13% 4.67% 4.20% 3.70% 3.55% 3.47% 3.41% 3.42%Return on Equity Net Income/Avg. Shareholders Equity 7.53% 7.07% 7.25% 7.24% 6.88% 6.64% 6.48% 6.57%
Payout Policy RatiosPayout Ratio Dividends Per Share/EPS 0.31 0.35 0.35 0.36 0.37 0.37 0.38 0.39Dividend Coverage Ratio EPS/Dividends Per Share 3.27 2.87 2.87 2.74 2.72 2.70 2.61 2.58Total Payout Ratio (Dividends + Repurchases)/Net Income 1.29 1.30 2.21 0.99 1.08 1.12 1.23 1.20
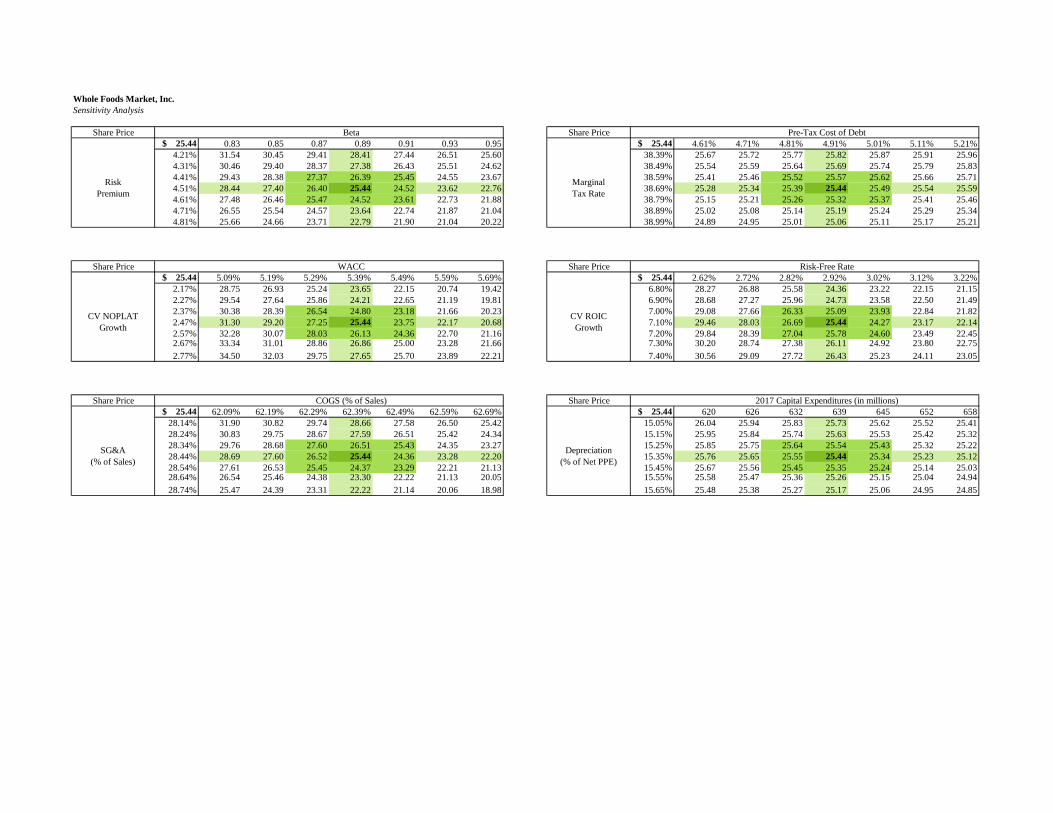
Whole Foods Market, Inc.Sensitivity Analysis
Share Price Beta Share Price Pre-Tax Cost of Debt $ 25.44 0.83 0.85 0.87 0.89 0.91 0.93 0.95 $ 25.44 4.61% 4.71% 4.81% 4.91% 5.01% 5.11% 5.21%
4.21% 31.54 30.45 29.41 28.41 27.44 26.51 25.60 38.39% 25.67 25.72 25.77 25.82 25.87 25.91 25.964.31% 30.46 29.40 28.37 27.38 26.43 25.51 24.62 38.49% 25.54 25.59 25.64 25.69 25.74 25.79 25.834.41% 29.43 28.38 27.37 26.39 25.45 24.55 23.67 38.59% 25.41 25.46 25.52 25.57 25.62 25.66 25.714.51% 28.44 27.40 26.40 25.44 24.52 23.62 22.76 38.69% 25.28 25.34 25.39 25.44 25.49 25.54 25.594.61% 27.48 26.46 25.47 24.52 23.61 22.73 21.88 38.79% 25.15 25.21 25.26 25.32 25.37 25.41 25.464.71% 26.55 25.54 24.57 23.64 22.74 21.87 21.04 38.89% 25.02 25.08 25.14 25.19 25.24 25.29 25.344.81% 25.66 24.66 23.71 22.79 21.90 21.04 20.22 38.99% 24.89 24.95 25.01 25.06 25.11 25.17 25.21
Share Price WACC Share Price Risk-Free Rate $ 25.44 5.09% 5.19% 5.29% 5.39% 5.49% 5.59% 5.69% $ 25.44 2.62% 2.72% 2.82% 2.92% 3.02% 3.12% 3.22%
2.17% 28.75 26.93 25.24 23.65 22.15 20.74 19.42 6.80% 28.27 26.88 25.58 24.36 23.22 22.15 21.152.27% 29.54 27.64 25.86 24.21 22.65 21.19 19.81 6.90% 28.68 27.27 25.96 24.73 23.58 22.50 21.492.37% 30.38 28.39 26.54 24.80 23.18 21.66 20.23 7.00% 29.08 27.66 26.33 25.09 23.93 22.84 21.822.47% 31.30 29.20 27.25 25.44 23.75 22.17 20.68 7.10% 29.46 28.03 26.69 25.44 24.27 23.17 22.142.57% 32.28 30.07 28.03 26.13 24.36 22.70 21.16 7.20% 29.84 28.39 27.04 25.78 24.60 23.49 22.452.67% 33.34 31.01 28.86 26.86 25.00 23.28 21.66 7.30% 30.20 28.74 27.38 26.11 24.92 23.80 22.752.77% 34.50 32.03 29.75 27.65 25.70 23.89 22.21 7.40% 30.56 29.09 27.72 26.43 25.23 24.11 23.05
Share Price COGS (% of Sales) Share Price 2017 Capital Expenditures (in millions) $ 25.44 62.09% 62.19% 62.29% 62.39% 62.49% 62.59% 62.69% $ 25.44 620 626 632 639 645 652 658
28.14% 31.90 30.82 29.74 28.66 27.58 26.50 25.42 15.05% 26.04 25.94 25.83 25.73 25.62 25.52 25.4128.24% 30.83 29.75 28.67 27.59 26.51 25.42 24.34 15.15% 25.95 25.84 25.74 25.63 25.53 25.42 25.3228.34% 29.76 28.68 27.60 26.51 25.43 24.35 23.27 15.25% 25.85 25.75 25.64 25.54 25.43 25.32 25.2228.44% 28.69 27.60 26.52 25.44 24.36 23.28 22.20 15.35% 25.76 25.65 25.55 25.44 25.34 25.23 25.1228.54% 27.61 26.53 25.45 24.37 23.29 22.21 21.13 15.45% 25.67 25.56 25.45 25.35 25.24 25.14 25.0328.64% 26.54 25.46 24.38 23.30 22.22 21.13 20.05 15.55% 25.58 25.47 25.36 25.26 25.15 25.04 24.9428.74% 25.47 24.39 23.31 22.22 21.14 20.06 18.98 15.65% 25.48 25.38 25.27 25.17 25.06 24.95 24.85
CV NOPLATGrowth
SG&A(% of Sales)
RiskPremium
CV ROICGrowth
Depreciation(% of Net PPE)
MarginalTax Rate
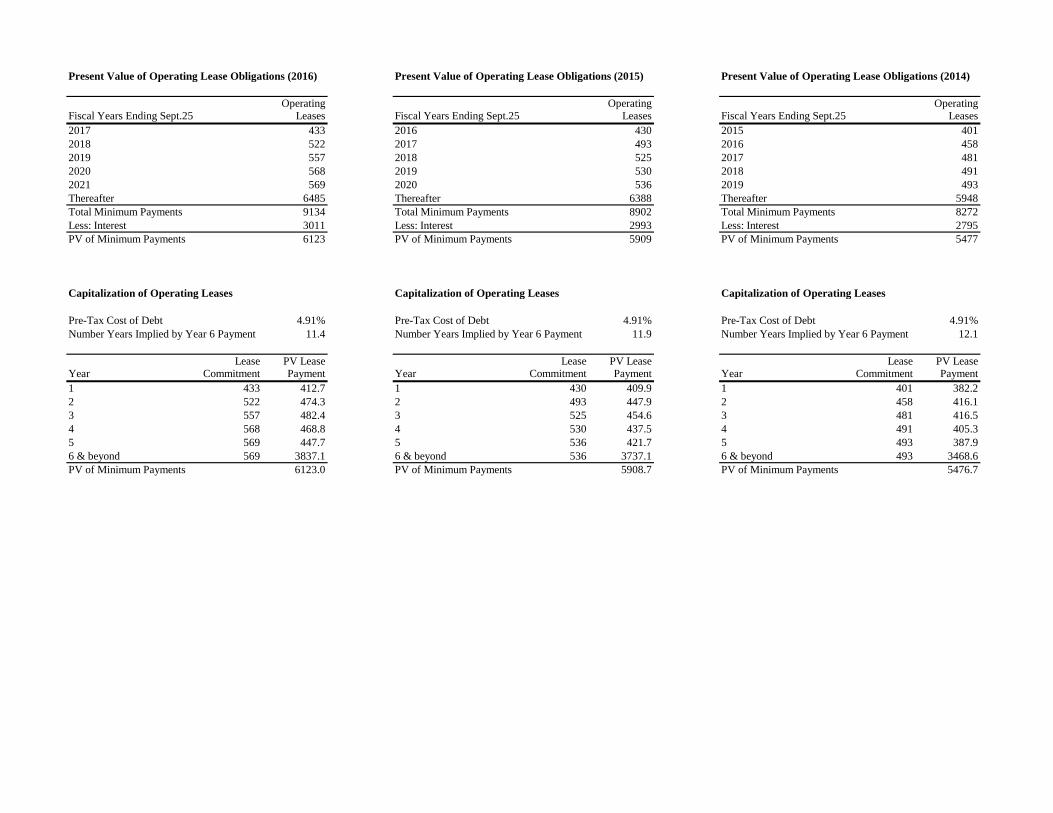
Present Value of Operating Lease Obligations (2016) Present Value of Operating Lease Obligations (2015) Present Value of Operating Lease Obligations (2014)
Operating Operating OperatingFiscal Years Ending Sept.25 Leases Fiscal Years Ending Sept.25 Leases Fiscal Years Ending Sept.25 Leases2017 433 2016 430 2015 4012018 522 2017 493 2016 4582019 557 2018 525 2017 4812020 568 2019 530 2018 4912021 569 2020 536 2019 493Thereafter 6485 Thereafter 6388 Thereafter 5948Total Minimum Payments 9134 Total Minimum Payments 8902 Total Minimum Payments 8272Less: Interest 3011 Less: Interest 2993 Less: Interest 2795PV of Minimum Payments 6123 PV of Minimum Payments 5909 PV of Minimum Payments 5477
Capitalization of Operating Leases Capitalization of Operating Leases Capitalization of Operating Leases
Pre-Tax Cost of Debt 4.91% Pre-Tax Cost of Debt 4.91% Pre-Tax Cost of Debt 4.91%Number Years Implied by Year 6 Payment 11.4 Number Years Implied by Year 6 Payment 11.9 Number Years Implied by Year 6 Payment 12.1
Lease PV Lease Lease PV Lease Lease PV LeaseYear Commitment Payment Year Commitment Payment Year Commitment Payment1 433 412.7 1 430 409.9 1 401 382.22 522 474.3 2 493 447.9 2 458 416.13 557 482.4 3 525 454.6 3 481 416.54 568 468.8 4 530 437.5 4 491 405.35 569 447.7 5 536 421.7 5 493 387.96 & beyond 569 3837.1 6 & beyond 536 3737.1 6 & beyond 493 3468.6PV of Minimum Payments 6123.0 PV of Minimum Payments 5908.7 PV of Minimum Payments 5476.7
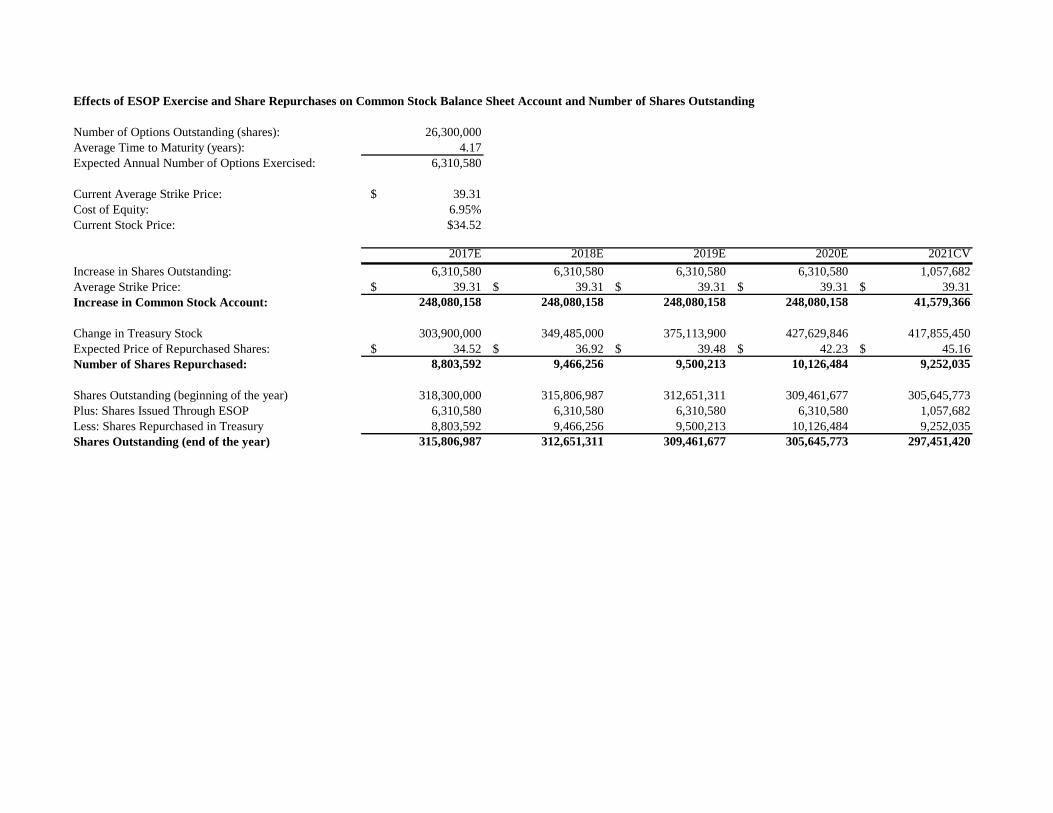
Effects of ESOP Exercise and Share Repurchases on Common Stock Balance Sheet Account and Number of Shares Outstanding
Number of Options Outstanding (shares): 26,300,000Average Time to Maturity (years): 4.17Expected Annual Number of Options Exercised: 6,310,580
Current Average Strike Price: $ 39.31 Cost of Equity: 6.95%Current Stock Price: $34.52
2017E 2018E 2019E 2020E 2021CVIncrease in Shares Outstanding: 6,310,580 6,310,580 6,310,580 6,310,580 1,057,682Average Strike Price: $ 39.31 $ 39.31 $ 39.31 $ 39.31 $ 39.31 Increase in Common Stock Account: 248,080,158 248,080,158 248,080,158 248,080,158 41,579,366
Change in Treasury Stock 303,900,000 349,485,000 375,113,900 427,629,846 417,855,450Expected Price of Repurchased Shares: $ 34.52 $ 36.92 $ 39.48 $ 42.23 $ 45.16 Number of Shares Repurchased: 8,803,592 9,466,256 9,500,213 10,126,484 9,252,035
Shares Outstanding (beginning of the year) 318,300,000 315,806,987 312,651,311 309,461,677 305,645,773Plus: Shares Issued Through ESOP 6,310,580 6,310,580 6,310,580 6,310,580 1,057,682Less: Shares Repurchased in Treasury 8,803,592 9,466,256 9,500,213 10,126,484 9,252,035 Shares Outstanding (end of the year) 315,806,987 312,651,311 309,461,677 305,645,773 297,451,420
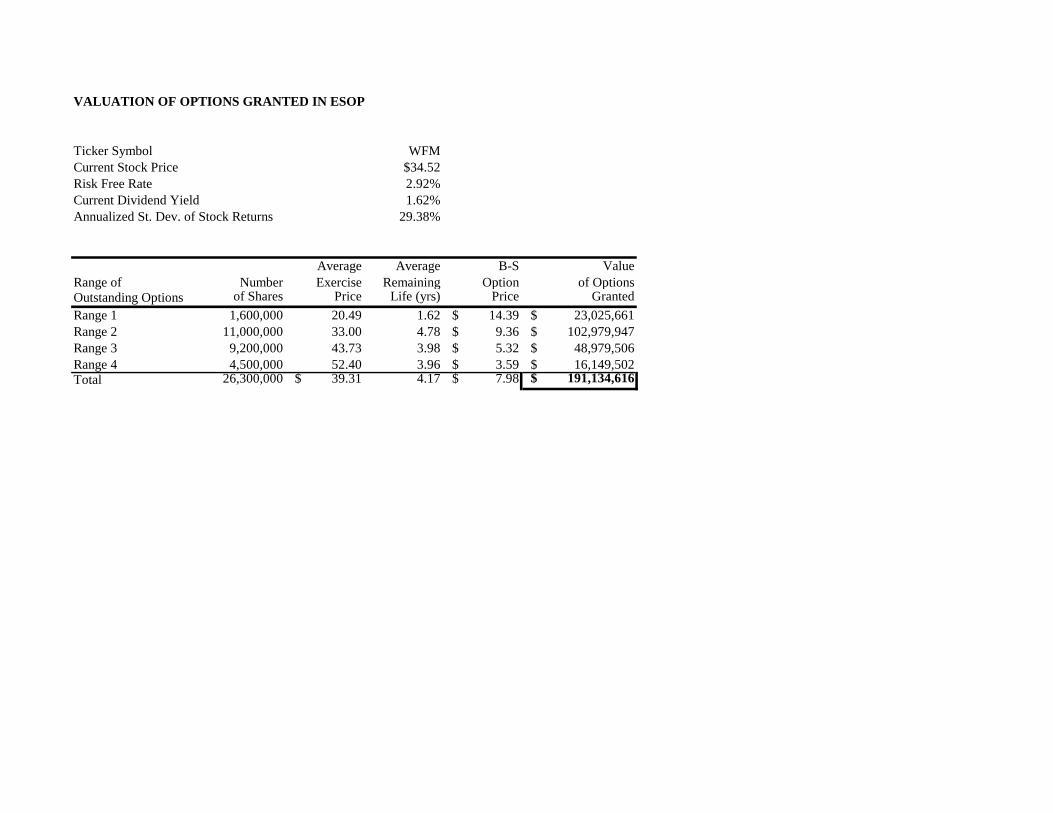
VALUATION OF OPTIONS GRANTED IN ESOP
Ticker Symbol WFMCurrent Stock Price $34.52 Risk Free Rate 2.92%Current Dividend Yield 1.62%Annualized St. Dev. of Stock Returns 29.38%
Average Average B-S Value Range of Number Exercise Remaining Option of Options Outstanding Options of Shares Price Life (yrs) Price Granted Range 1 1,600,000 20.49 1.62 $ 14.39 $ 23,025,661 Range 2 11,000,000 33.00 4.78 $ 9.36 $ 102,979,947 Range 3 9,200,000 43.73 3.98 $ 5.32 $ 48,979,506 Range 4 4,500,000 52.40 3.96 $ 3.59 $ 16,149,502 Total 26,300,000 $ 39.31 4.17 $ 7.98 $ 191,134,616