what can the waterberg achieve? - … can the waterberg achieve... · what can the waterberg...
TRANSCRIPT

What can the Waterberg achieve?
PDF created with pdfFactory Pro trial version www.pdffactory.com

1
Contents
• Global Coal market
• SA Coal market trends
• Energy demand and supply in SA.
• Alternative energy for SA
• Waterberg Coal field
• Exxaro’s development plan for Waterberg
• What’s happening ?
• Constraints
• Future potential
PDF created with pdfFactory Pro trial version www.pdffactory.com

2
Strong Industry Outlook
2
4
6
8
1970 1975 1980 1985 1990 1995 2000 2005 2010 2015 2020 2025
•World Coal Consumption Continuing to Grow
(Bn tpa)
•World Power Generation Mix – Coal to Maintain Its Share2002
High Growth Low GrowthReference
Source: EIA
Source: IEA from ABSA
2030
2%
17%
19% 7%
39%
16%
Coal
OilGas
Nuclear
HydroOther
6%
9%
29% 4%
39%13%
Coal
OilGas
Nuclear
HydroOther
16,074TWh 31,657TWh
– Strong fundamentals for the local and global coal markets
– Significant power generation investments to be made in South Africa to meet demand following long period of underinvestment
• Electricity demand growing at 1,200MW per annum for the next 20 years, approximately eight new power stations will be required
• 89% of Eskom’s installed capacity iscoal-fired
– Coal’s share of global power generation expected to be sustained while total capacity continues to grow
– China continuing to drive global demand while supply constraints remain
– RBCT expansion will enable increased exports from South Africa
– Prices expected to recede but remain at high levels from a historical perspective
PDF created with pdfFactory Pro trial version www.pdffactory.com

3
MARKET PRICES
Prices USD/T
0
20
40
60
80
100
120
140
160
180
200
1985
1987
1989
1991
1993
1995
1997
1999
2001
2003
2005
2007
2009
2011
2013
Years
US
D/T
HCCSSCCSteam API4Market Coke
• Global demand is driven by the Asian factor – a structural shift in prices foreseen on the long term
• Coal and coke prices coming off a high due strong demand and coke shortages
• Steam coal prices driven by demand and freight rates
• Commodity price rise due to weakened US dollar
PDF created with pdfFactory Pro trial version www.pdffactory.com

4
RBCT EXPORT TERMINAL
• RBCT expansions announced Nov 2005
• Construction April 2006 to June 2009• 72 to 91Mtpa• 4Mtpa to small BEE miners•6Mtpa to SDCT•9Mtpa subscription to larger BEE companies
•Exxaro will have 6.3Mt
PDF created with pdfFactory Pro trial version www.pdffactory.com
5
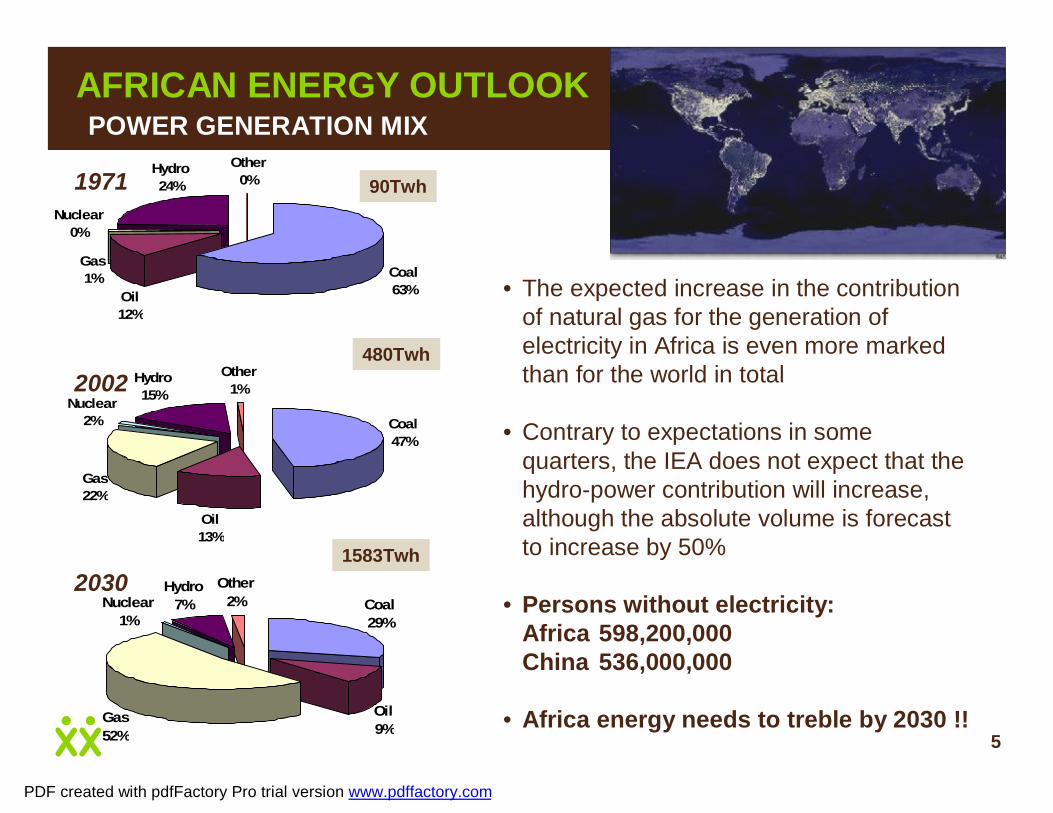
AFRICAN ENERGY OUTLOOKPOWER GENERATION MIX
• The expected increase in the contribution of natural gas for the generation of electricity in Africa is even more marked than for the world in total
• Contrary to expectations in some quarters, the IEA does not expect that the hydro-power contribution will increase, although the absolute volume is forecast to increase by 50%
• Persons without electricity:Africa 598,200,000 China 536,000,000
• Africa energy needs to treble by 2030 !!
Other0%
Oil12%
Hydro24%
Coal63%
Nuclear0%
Gas1%
1971
Coal47%
Oil13%
Gas22%
Nuclear2%
Hydro15%
Other1%2002
Coal29%
Oil9%
Gas52%
Other2%Nuclear
1%
Hydro7%
2030
90Twh
480Twh
1583Twh
PDF created with pdfFactory Pro trial version www.pdffactory.com

6
SA energy outlook: electricity generation capacity
Source : Eskom
• Due to a long hiatus in electricity generation capacity investment during the last decade or two, a significant backlog has developed
• Considerable investment will be required in the decades ahead with an expected concomitant impact on prices
PDF created with pdfFactory Pro trial version www.pdffactory.com

7
The cost of future energy production
• The crux of the debate – what will the future production costs of the different types of primary energy be?
• Fossil fuel derived energy will be with us for years to come……..
Source : IEA 2005
PDF created with pdfFactory Pro trial version www.pdffactory.com

8- 5.00 10.00 15.00 20.00 25.00
DenmarkItaly
AustriaPortugal
JapanIrelandFrance
SwitzerlandGermany
UKHungaryFinland
SlovakiaSpain
GreeceMexicoPolandTurkeyCzech
USChinese Taipei
KoreaNorway
AustraliaSouth Africa
US c/kWh
Industry Households
COSTS OF ELECTRICITY - WORLDWIDE
PDF created with pdfFactory Pro trial version www.pdffactory.com

9
89%
4%
5%
2%1%
Coal-fired
Nuclear
Pumped StorageHydroOil-fired
South African power generation mix
Eskom’s installed power generation portfolio Total installed capacity : 39,154 MW
Source: Eskom website
Eskom95%
Munics5%
Source: South African Coal Statistics, 2001
Installed capacity in SA (41 086 MW)
PDF created with pdfFactory Pro trial version www.pdffactory.com

10
Alternative forms of energy ?
• Hydro Electricity
• Nuclear
• Solar
• Wind
• Coal bed methane/LNG
• Fuel Cells
• LPG Gas
• Bio Mass
Inga?
PDF created with pdfFactory Pro trial version www.pdffactory.com

11
• Massive potential for hydro electricity (40 000 MWe) in the Congo river
But• Political instability• Massive infrastructure needed
for electricity generation and distribution (it’s a long way from Coega!)
•high capex•long lead-time
The Inga potential…
IngaInga
Will come to fruition only in Will come to fruition only in 55--20 years from now20 years from now
PDF created with pdfFactory Pro trial version www.pdffactory.com

12
Nox pollution image of world showing Loyd’s blanket in Highveld
The expansion of electricity generation in the MpumalangaHighveld and Gauteng will be limited due to pollution levels.
Source: &Source: &BeeldBeeld (13/10/04)(13/10/04)
PDF created with pdfFactory Pro trial version www.pdffactory.com

13
Where will all the Coal come from??
0
50
100
150
200
2002
2003
2004
2005
2006
2007
2008
2009
2010
2011
2012
2013
2014
2015
2016
2017
2018
2019
2020
2021
2022
2023
2024
2025
2026
2027
2028
2029
2030
2031
2032
2033
Coa
l (M
t per
ann
um)
Arnot
Hendrina
Matla
Kendal
Duvha
Tutuka
Majuba
Lethabo
Matimba
Kriel
Demand
Very ExpensiveCoal (if available)
Arnot Depleted
Optimum StopsMatla Depleted
Duvha PS stops(50 years old)
Demand Growth @ 2.5% per annum
Kriel Depleted
AVAILABILITY OF COAL TO ESKOM'S POWER STATIONS(CURRENT SOURCES)
Where will all the coal come from?Where will all the coal come from?Source SACRSource SACR
Source: Year reports, SA Coal Report
PDF created with pdfFactory Pro trial version www.pdffactory.com
14
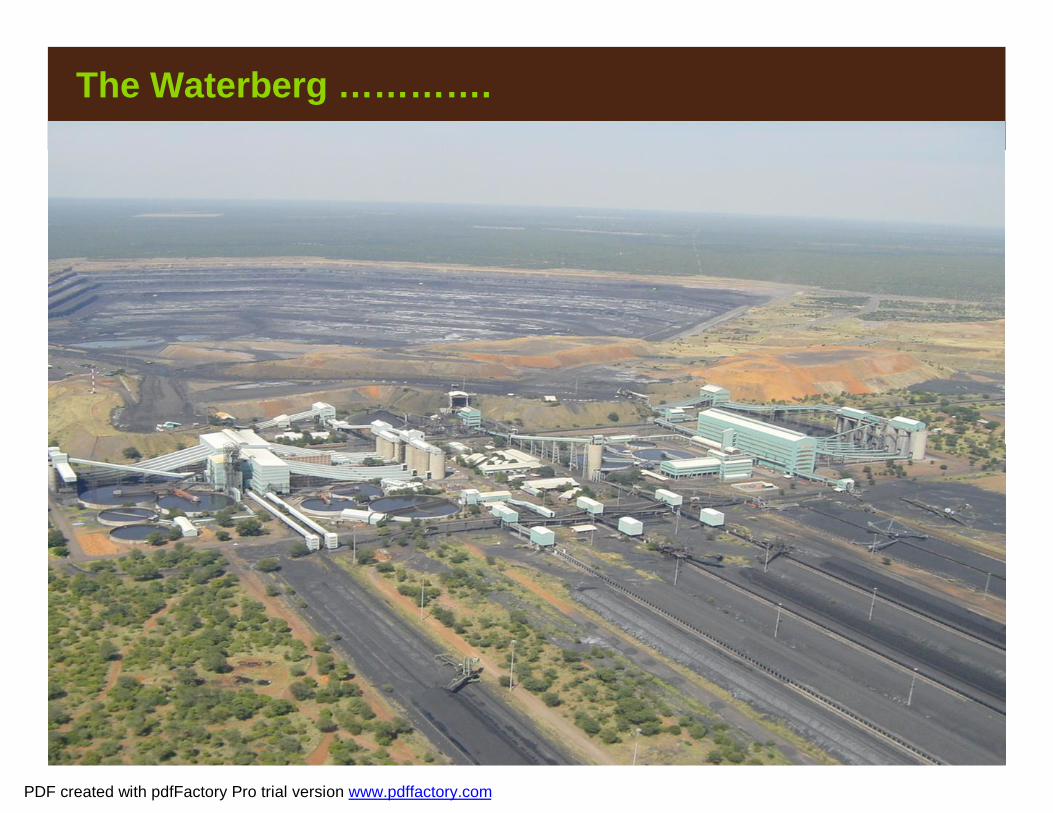
The Waterberg ………….
PDF created with pdfFactory Pro trial version www.pdffactory.com

15
Zoetfontein Fault
Daarby FaultCurrent Pit
Botswana
Deep Coal (250m below surface)
Open Pit Mine-able Coal
Eenzaamheid Fault
Fault Bounded by•Zoetfontein fault along the Northern side•Eenzaamheid fault along the Southern boundary•Daarby fault divides the coal field into open-pit mineable and underground mineablereserves•Stretches 40kms from N to S and 88kms E to W.• Extends Westwards into Botswana•More than 40% of the remaining coal resources in RSA
The Waterberg Coal field
PDF created with pdfFactory Pro trial version www.pdffactory.com

16
I NFERRED
I NFERRED
MEASURESD
I ND I CATED
I ND I CATED
Grootegeluk mine area
DaarbyDaarby FaultFault
EenzaamheidEenzaamheid FaultFault
Current PitCurrent Pit
4040-- year pit layoutyear pit layout
Reserves in Reserves in excess of 400 excess of 400
yearsyears
InferredInferred
InferredInferred IndicatedIndicated
MeasuredMeasured
PDF created with pdfFactory Pro trial version www.pdffactory.com

17
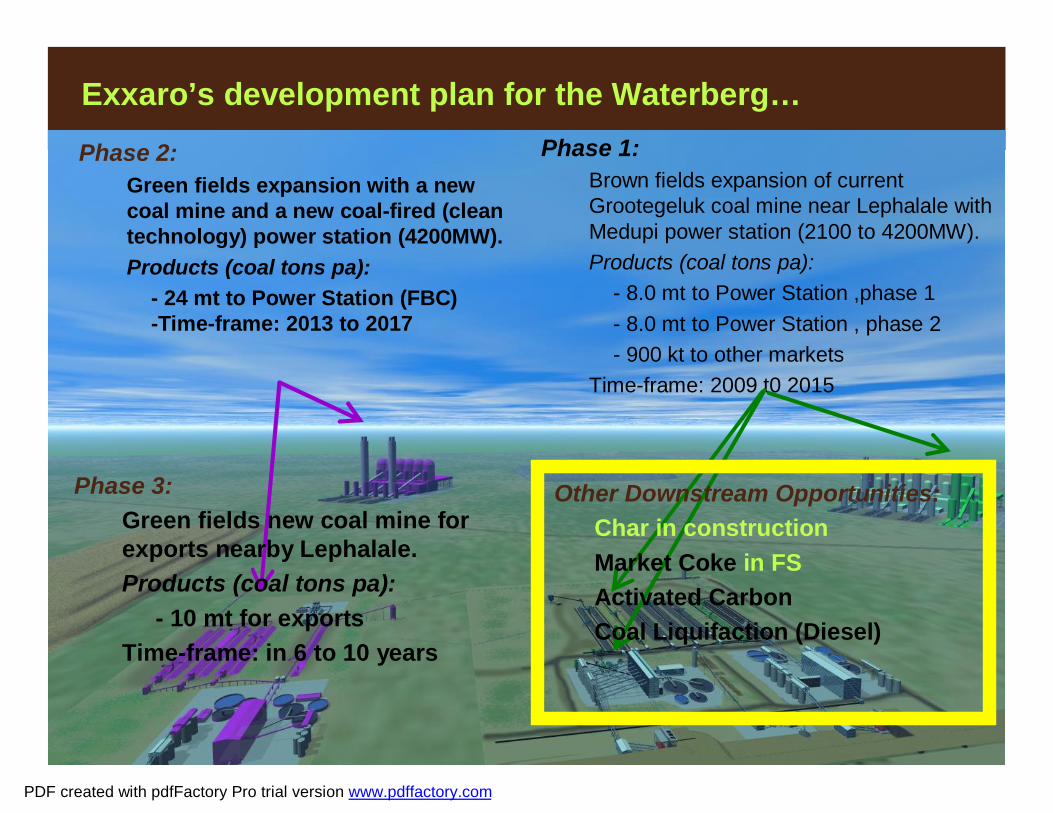
Phase 1:Brown fields expansion of current Grootegeluk coal mine near Lephalale with Medupi power station (2100 to 4200MW).Products (coal tons pa):
- 8.0 mt to Power Station ,phase 1- 8.0 mt to Power Station , phase 2 - 900 kt to other markets
Time-frame: 2009 t0 2015
Phase 2:Green fields expansion with a new coal mine and a new coal-fired (clean technology) power station (4200MW).Products (coal tons pa):
- 24 mt to Power Station (FBC)-Time-frame: 2013 to 2017
Phase 3:Green fields new coal mine for exports nearby Lephalale.Products (coal tons pa):
- 10 mt for exportsTime-frame: in 6 to 10 years
Other Downstream Opportunities:Char in constructionMarket Coke in FSActivated CarbonCoal Liquifaction (Diesel)
Exxaro’s development plan for the Waterberg…
PDF created with pdfFactory Pro trial version www.pdffactory.com

18
GEOLOGICAL PROFILE
16.5
7.56
9.37
6.53
9.04
10.15
13.50
6.54
3.204.105.703.708.204.104.30
AVERAGE THICKNESS (m)
OVERBURDEN
ZONE 11
ZONE 10
ZONE 9
ZONE 8
ZONE 7
ZONE 5
ZONE 6
INTERBEDDED SCZONE 4
INTERBED SCINTERBED SC
ZONE 3INTERBED SC
ZONE 2
ZONES
BENCH 1
BENCH 2
BENCH 3
BENCH 4
BENCH 5
BENCH 6BENCH 7a
BENCH 7bBENCH 8
BENCH 9a,bBENCH 10
BENCH 11
Upper Ecca:Bright Coal with inter-
bedded shale
Lower Ecca:Dull Coal, Sand stone
and Carbonaceous shale
•• Total resources in Total resources in mineral rights area: mineral rights area: 6.016Bn tons6.016Bn tons
•• LOM >75 yearsLOM >75 years
PDF created with pdfFactory Pro trial version www.pdffactory.com

19
Grootegeluk – Overall process flow
Iscor
Steel
BENCH 1
GG 1
POWER STATION
COAL
SEMI-SOFTCOKING
COAL 10% ASH
WASTEDUMPS
MET.PRODUCTS
GG 3
BENCH 2
BENCH 3
BENCH 4
BENCH 5
BENCH 6GG 2
BENCH 7
BENCH 8
BENCH 9ABENCH 9B
BENCH 10
BENCH 11GG 4/5
PCI PRODUCT 10% ASH
Export
Matimba
SaldanhaSteel
LocalDuffPeas
Small NutsLarge Nuts
MittalGG6
PDF created with pdfFactory Pro trial version www.pdffactory.com

20
GG 6 Beneficiation plant
PDF created with pdfFactory Pro trial version www.pdffactory.com

21
GG 6 plant commissioned
PDF created with pdfFactory Pro trial version www.pdffactory.com

22
22Medupi
Matimba
Grootegeluk
MEDUPI PROJECTGeographical
Layout
PDF created with pdfFactory Pro trial version www.pdffactory.com

23
MEDUPI PROJECTPit Layout
PDF created with pdfFactory Pro trial version www.pdffactory.com

24
MATERIAL FLOWBENCH PLANT DESTINATION 24
BENCH 7b
BENCH 11
BENCH 1
BENCH 2
BENCH 3
BENCH 4
BENCH 5
BENCH 6BENCH 7aBENCH 8
BENCH 9a,bBENCH 10
GG1
GG2
GG3
GG4/5
Export
Iscor/ ICC
MatimbaA
Saldanha
Local
SSCC10% Ash
PowerStaton Coal
PCI10% Ash
MET.Coal
GG6
GG8
MatimbaB
GG7
PowerStaton Coal
Small NutsDuffPeas
Medupi
Mittal
PDF created with pdfFactory Pro trial version www.pdffactory.com

25
ROM production……..25
6 PACK: Mining Tons per Bench / Year
0.00
20.00
40.00
60.00
80.00
100.00
120.00
07 08 09 10 11 12 13 14 15 16 17 18 19 20 21 22 23 24 25 26 27 28 29 30 31 32 33 34 35 36 37 38 39 40 41 42 43 44 45 46 47 48 49 50 51 52
Tons
.
Bench 1 Bench 2 Bench 3 Bench 4 Bench 5 Bench 6 Bench 7A Bench 7B Bench 8 Bench 9A Bench 9B Bench 10 Bench 11
107mt ROM
PDF created with pdfFactory Pro trial version www.pdffactory.com
26
Phase 1:Brown fields expansion of current Grootegeluk coal mine near Lephalale with Medupi power station (2100 to 4200MW).Products (coal tons pa):
- 8.0 mt to Power Station ,phase 1- 8.0 mt to Power Station , phase 2 - 900 kt to other markets
Time-frame: 2009 t0 2015
Phase 2:Green fields expansion with a new coal mine and a new coal-fired (clean technology) power station (4200MW).Products (coal tons pa):
- 24 mt to Power Station (FBC)-Time-frame: 2013 to 2017
Phase 3:Green fields new coal mine for exports nearby Lephalale.Products (coal tons pa):
- 10 mt for exportsTime-frame: in 6 to 10 years
Other Downstream Opportunities:Char in constructionMarket Coke in FSActivated CarbonCoal Liquifaction (Diesel)
Exxaro’s development plan for the Waterberg…
PDF created with pdfFactory Pro trial version www.pdffactory.com

27
Downstream value generation
Exxaro Exxaro
PDF created with pdfFactory Pro trial version www.pdffactory.com
28
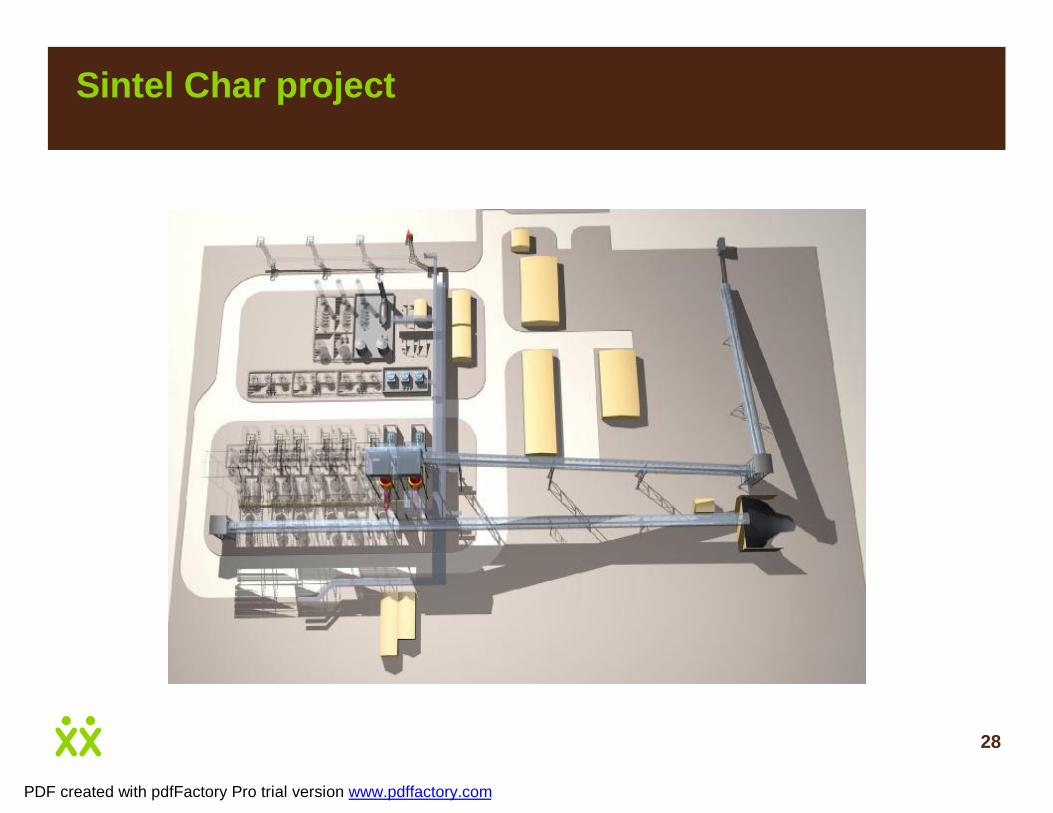
Sintel Char project
PDF created with pdfFactory Pro trial version www.pdffactory.com

29
Char plant in construction…
PDF created with pdfFactory Pro trial version www.pdffactory.com

30
And progressing….
Commissioning Nov 2007
PDF created with pdfFactory Pro trial version www.pdffactory.com

31
PROJECTED COAL PRODUCTION
0
5
10
15
20
25
30
35
40
45
50
Current Year 1 Year 2 Year 3 Year 4 Year 5 Year 6 Year 7 Year 8 Year 9 Year 10 Year 11 Year 12 Year 13
Tons
per
ann
um (m
illio
ns)
CokingSteamEskom
Phase 1 GG6
Phase 2
Phase 3
P 3 could be moved
earlier
Coal production volumes
2006 Production
18,5mt !
PDF created with pdfFactory Pro trial version www.pdffactory.com

32
Grootegeluk Expansion
Rail capacity
Projected Waterberg Rail Requirements (May 2007)
0
2
4
6
8
10
12
14
16
18
20
22
24
26M
illio
n to
ns
Exxaro "Probable"
Exxaro "Bankable"
Kumba "2005"
Exxaro "High"
Exxaro "Probable" 4.2 4.2 4.6 5.4 6.7 7.2 7.8 12.5 17.4 18.1 18.6 19.6 20.1 20.6 21.1 21.6 21.6 21.6 21.6 21.6 21.6 21.6 21.6 21.6
Exxaro "Bankable" 4.2 4.2 4.6 5.4 6.7 7.2 7.5 12.0 16.4 16.6 16.6 16.6 16.6 16.6 16.6 16.6 16.6 16.6 16.6 16.6 16.6 16.6 16.6 16.6
Kumba "2005" 5.5 6.2 6.2 6.4 6.6 7.6 8.6 9.3 9.4 10.9 15.9 15.9
Exxaro "High" 4.3 4.3 4.7 5.5 6.9 7.3 8.0 12.1 16.6 20.9 21.6 22.8 23.4 24.0 24.6 25.2 25.2 25.2 25.2 25.2 25.2 25.2 25.2 25.2
2007
2008
2009
2010
2011
2012
2013
2014
2015
2016
2017
2018
2019
2020
2021
2022
2023
2024
2025
2026
2027
2028
2029
2030
PDF created with pdfFactory Pro trial version www.pdffactory.com

(March 05)
Grootegeluk
Thabazimbi
Northam
RustenburgPyramid-South
Pretoria Greenview
Sentrarand
Witbank
Blackhill
WelgedagDelmas Ogies
HawerklipSaaiwater
Broodsnyersplaas
ERMELOHamelfontein
OvervaalPanbult
KempPiet Retief
Paul PietersburgMahulumbe
Sikame
Vryheid Vryheid-East
S W A Z I L A N D
Lenjanedrif
EnqolothiNsese
RBCTTo Empangeni
To DurbanElandslaagte
GlencoeHattinghspruit
DannhauserBallengeich
Ngagane
Talana
Volksrust
NewcastleUtrecht
Trichardt BethalTo Springs
Halfgewonnen
To Germiston
Twistdraai
Leeuwpan
RAIL INFRASTRUCTURERAIL INFRASTRUCTURE
= COAL Line = General Freight
AAAAA = GG Destinations
Kelty/Leandra
Van der Bijl
Rustenburg
RBCT
Saldhanha
Technical options identified ie electrification etcCosting in progress
PDF created with pdfFactory Pro trial version www.pdffactory.com

34
Alternative rail routes…
PDF created with pdfFactory Pro trial version www.pdffactory.com
35
Conclusion
• Development plan on track
• Infrastructural constraints being addressed
• Downstream projects on track
See you in the Waterberg !!!!!
PDF created with pdfFactory Pro trial version www.pdffactory.com