what can flour fortification achieve in the next 5 … can flour fortification achieve in the next 5...
TRANSCRIPT

What Can Flour Fortification Achieve in the Next 5 Years?Using Numbers to Put Pieces of the Puzzle Together
Jack BagrianskyFFI Consultant

Anemia Significant Public Health Problem: ~ 325 million anemia cases
0%
10%
20%
30%
40%
50%
60%
Malaysia Thailand Vietnam Indonesia Philippines PRC
% A
nem
ia
Children Women Reproductive Age Men
10,360,000
14,490,000
75,600,000
20,420,000
200,280,000
3,750,00
Only clinical anemia. Not including iron deficiency only

Flour Fortification is a Low Cost & Low Risk Intervention
Product DevelopedMarket PreparedCapacity in PlaceLow Investment
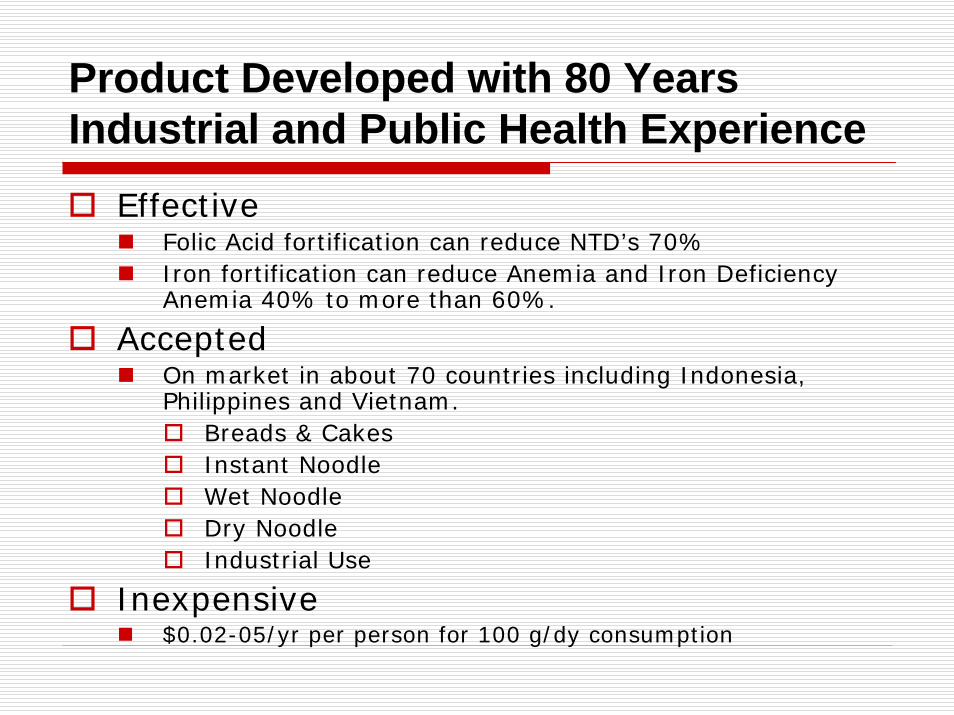
Product Developed with 80 Years Industrial and Public Health Experience
EffectiveFolic Acid fortification can reduce NTD’s 70% Iron fortification can reduce Anemia and Iron Deficiency Anemia 40% to more than 60%.
AcceptedOn market in about 70 countries including Indonesia, Philippines and Vietnam.
Breads & CakesInstant NoodleWet NoodleDry NoodleIndustrial Use
Inexpensive$0.02-05/yr per person for 100 g/dy consumption

Food Processors & Consumer Trend to Higher Nutrition Awareness in Asia
Large Companies: China’s Jinmailang investment in enhancing nutritional qualities of instant noodles ~ €4.9m.*
Maggi whole wheat noodles target mothers and youth restricting consumption because “refined flour is perceived as unhealthy.”
“A roaring success.”**
Smaller Companies:Vietnam Customer Survey suggests lack of awareness but positive orientation to fortification.
** Asia Pacific-Food technology.com * AC Nielsen Report

Milling Capacity in place: Simple Technical Pathway
Large Mills w/ 100% of National Ouput
Vietnam 16Indonesia 5Thailand 8Malaysia 13Philippines 16
* Frost & Sullivan Consultants: Malaysia, Thailand, Vietnam, Indonesia, Philippines and Singapore
Large capacity mills.Modern sophisticated management.Low Start-Up Costs
Systems/feeders in placeLow Recurring Costs
$0.60-1.50/per MTLow technical barriers to entry
Already add micro-ingredients Established Supply Chain SE Asia Food fortification revenue in 6 SE Asian markets $46.7 million 2005*
Possible to fortify 100% of milling production.

Can Industry Absorb one-time $0.60-1.50/MT added input cost?

Can Consumers Absorb a one-time 0.5-1% Price Rise?
10 Year Annual % Changes in Consumer and Food Price Indexes
100%110%120%130%140%150%160%170%180%190%
1995 1996 1997 1998 1999 2000 2001 2002 2003 2004 2005
Malaysia: CPI
Malaysia: FPI
Thailand: CPI
Thailand: FPI
Vietnam: CPI
Vietnam: FPI
Phillipines: CPI
Phillipines: FPI
Consumer and Food Price Indexes Up 27-82% over 10 yrs
ADB
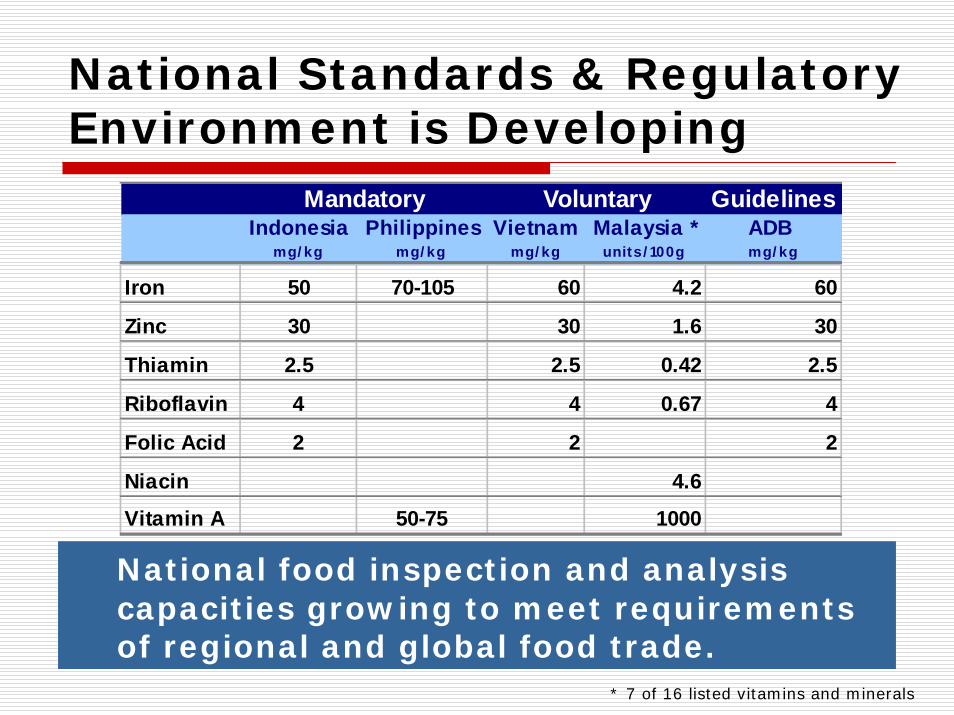
National Standards & Regulatory Environment is Developing
GuidelinesIndonesia Philippines Vietnam Malaysia * ADB
mg/ kg mg/ kg mg/ kg units/ 100g mg/ kg
Iron 50 70-105 60 4.2 60
Zinc 30 30 1.6 30
Thiamin 2.5 2.5 0.42 2.5
Riboflavin 4 4 0.67 4
Folic Acid 2 2 2
Niacin 4.6
Vitamin A 50-75 1000
Mandatory Voluntary
National food inspection and analysis capacities growing to meet requirements of regional and global food trade.
* 7 of 16 listed vitamins and minerals

What will 75 g portion of noodles with 60 ppm added iron achieve?
Iron Nutrition Scenario
10
4.5
4.5
1813.4
0
5
10
15
20
Daily Iron Intake WHO EAR for AdultWoman
US RDA
mg/
day
iron
Current Intake 1st Noodle Serving 2nd Noodle Serving
*Vietnam Nat Nutrition Survey: mean intake ~ 70%RDA Estimated Average Requirement
Calculation: 75g x 60 ppm = 4.5 mg intake
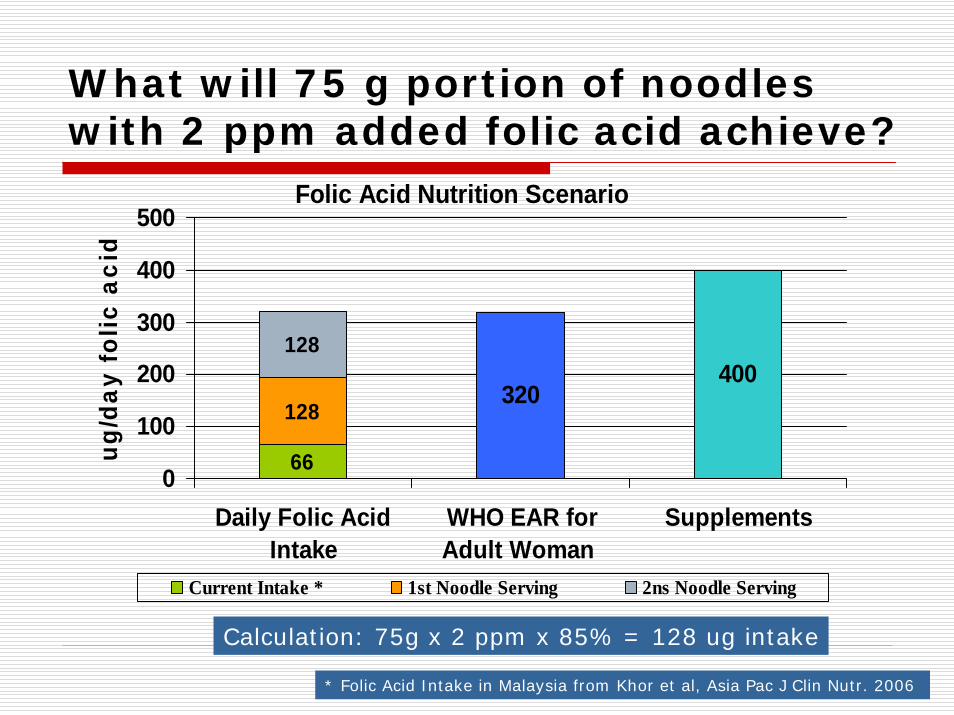
What will 75 g portion of noodles with 2 ppm added folic acid achieve?
Folic Acid Nutrition Scenario
400
66
128
128
320
0
100
200
300
400
500
Daily Folic AcidIntake
WHO EAR forAdult Woman
Supplements
ug/d
ay f
olic
aci
d
Current Intake * 1st Noodle Serving 2ns Noodle Serving
* Folic Acid Intake in Malaysia from Khor et al, Asia Pac J Clin Nutr. 2006
Calculation: 75g x 2 ppm x 85% = 128 ug intake

Coverage, Targeting
Do at-risk populations eat enough flour for fortification to make a significant difference?

Secondary Staple: Do People Consume Enough to Make a Difference?
Wheat % Calories from All Cereals
0%
10%
20%
30%40%
50%
60%
China Indonesia Malaysia Philippines Thailand Viet Nam
% kcal wheat
2000
2001
2002
2003
2004
2005

Wheat Flour Consumption increasing in ASEAN Countries
Annual % Increases in National Consumption (FAO)
0%
100%
200%
300%
400%
China Indonesia Malaysia Philippines Thailand Viet Nam1992 1993 1994 1995 1996 1997 1998 1999 2000 2001 2002 2003 2004 2005
Given the trend in income growth and urbanization elasticitiessuggest wheat consumption will grow faster, while growth in riceconsumption will be much slower.*
Fabiosa, Center for Ag & Rural Development, 2006

Reaches Vulnerable & Low Income Populations
InexpensiveInstant Noodles in Thailand cost ~ 5 Baht while rice with curry on the street costs between Baht 15-20.*
Widely Consumed among urban poorJakarta: Noodles widely consumed among urban poor.**
Poorest consume street food because no fuel for cooking.Thailand: “The economic bubble has blown away. Real demand is in place. In every industry, volume has dropped dramatically. Only Instant Noodles reported 25-30% growth.”*
Noodle sales are a key indicator of economic down turn in Thailand – just as sales of potatoes increase in the West during economic downturn.*
Anemia and folic acid deficiency are public health issue in affluent populations as well.
* Asia Pacific Management Forum 1999 ** ADB, Indonesia Urban Nutrition RETA

Urban Poor: Growing Consumer Market
2004 20150 0 0 ,0 0 0 0 0 0 ,0 0 0 0 0 0 ,0 0 0
PRC 516.7 685.4 168.7
Indonesia 103.4 144.4 40.9
Malaysia 16.5 22.3 5.8
Philippines 50.5 67.4 16.9
Thailand 20.4 25.0 4.6
Viet Nam 21.6 30.0 8.4
New Urban Consumers
10 Yr Urban Population Growth
“700 million people in Asia live on less than US$1 a day, 400 million of which reside in urban areas. Each day a further 120,000 people are added to the populations of Asian cities due to rural-urban migration.” ADB, 2006

Scenarios for the Future:What if all the flour in East & South East Asia were fortified?
What is the Nutrition protection and benefits at current consumption.

Beyond the Average: What’s real intake of flour consumers?
Average Consumption FAO
Consumers Urban Pop + 10%
Estimated Average Intake of Flour Consumers
g/dy % g/dy
PRC 164 43% 377
Indonesia 48 52% 93
Malaysia 156 73% 214
Philippines 62 68% 91
Thailand 64 35% 182
Viet Nam 26 29% 91
National average / % Consumer = Average g/dy for consumers

Nutrition Protection Delivered at Estimated Consumption
Added Iron Intake @ 60ppm
% Daily Iron Needs (WHO
EAR)
Added Folic Acid @ 2
ppm**
% Daily Folic Acid Needs (WHO
EAR)g/ dy mg/ dy % 13.4 EA R ug/ dy % 320 EA R
Viet Nam 91 5 41% 155 48%
Indonesia 93 6 42% 158 49%
Philippines 91 5 41% 155 48%
Thailand 182 11 81% 309 97%
Malaysia 214 13 96% 364 114%
PRC* 377 23 169% 401 125%
Iron Nutrition Folic Acid Nutrition
Estimated "Corrected" Consumption
*1.25 ppm folic acid** 85% retention
(Consumption X added units)/EAR = % Daily Needs

Benefits: Improved Folic Acid Nutrition with Coverage & Consumption Projections
Problem CoverageCurrent Est
NTD/yrProjected
Nutrition InputAssumed
EffectivenessEstimated
Consumers # % ug/dy % % # %
Indonesia 11,013 155 27% 52% 1,541 14%
Philippines 4,944 158 28% 68% 928 19%
Viet Nam 4,038 155 27% 29% 312 8%
Thailand 2,472 309 54% 35% 469 19%
Malaysia 1,340 364 64% 73% 621 46%
PRC 80,000 401 70% 43% 24,332 30%
BenefitsIntervention Potential NTD
Cases Prevented
Assume: 400 ug/dy (supplements) Delivers Optimal (70%) Protection
# NTD Cases x % Effectiveness x % Coverage = Lower # NTD Cases

What’s the Effectiveness of Iron Fortification for Consumers?
% ReductionNational Evaluation Venezuela (ID) 59.5%
Venezuela (Anemia) 43.8%Efficacy Trial Vietnam 88.4%
Range & Magnitude of What's Possible
Iron Nutrition Input Assumed Effectiveness % Average Requirement %
PRC 169% 50%Malaysia 96% 28%Thailand 81% 24%Indonesia 42% 12%Viet Nam 41% 12%Philippines 41% 12%
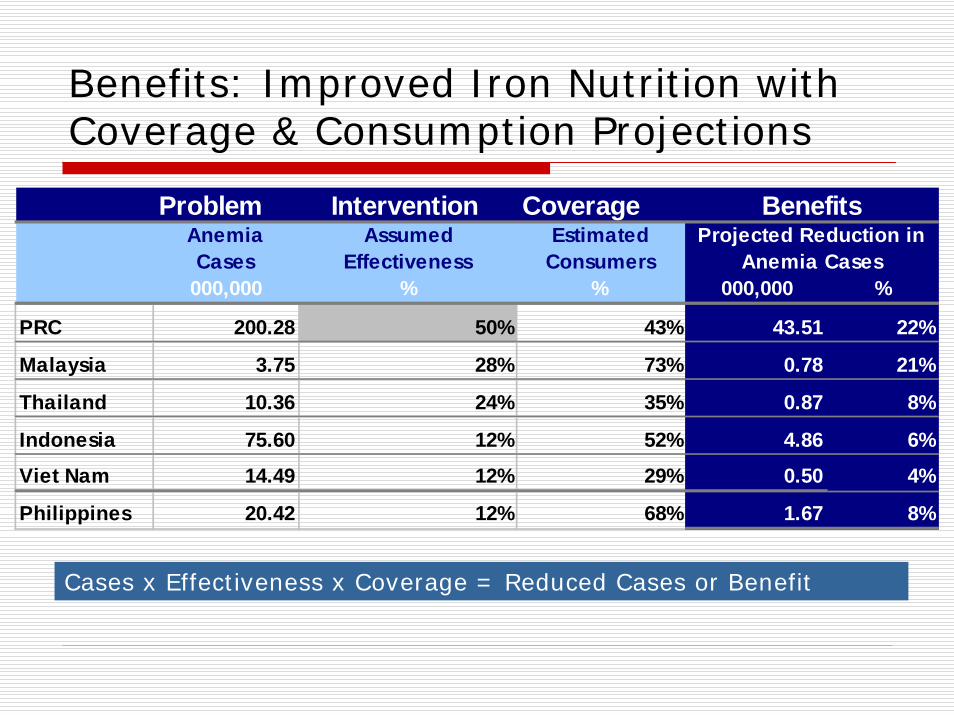
Benefits: Improved Iron Nutrition with Coverage & Consumption Projections
Problem CoverageAnemia Cases
Assumed Effectiveness
Estimated Consumers
000,000 % % 000,000 %
PRC 200.28 50% 43% 43.51 22%
Malaysia 3.75 28% 73% 0.78 21%
Thailand 10.36 24% 35% 0.87 8%
Indonesia 75.60 12% 52% 4.86 6%
Viet Nam 14.49 12% 29% 0.50 4%
Philippines 20.42 12% 68% 1.67 8%
Projected Reduction in Anemia Cases
Intervention Benefits
Cases x Effectiveness x Coverage = Reduced Cases or Benefit

National Reduction in Anemia Reduces National Economic Loss
Future Losses
Child Cognition
Male Workers
Female Workers Losses % GDP
$ 000,000/ yr $ 000,000/ yr $ 000,000/ yr $ 000,000/ yr % % $ 000,000
PRC 1482.7 2294.7 4142.4 7919.8 0.3 22% $1,742
Indonesia 863.4 567.4 921.3 2352.1 0.6 6% $141
Malaysia 104.6 172.3 173.5 450.5 0.3 21% $95
Philippines 248.4 156.1 225.6 630.1 0.5 8% $50
Thailand 189.4 239.8 231.7 660.9 0.3 8% $53
Viet Nam 80.4 47.8 136.8 265.1 0.5 4% $11
Current Losses
Total Losses
Productivity Gains
Reduced Losses

What can be achieved in Current Health & Market Environment?
6 Country Anemia Prevalence reductions: 4-22%~ 50 million cases prevented~ additional 50 million protected from iron deficiencyReduced risks of maternal and perinatal deathCurrent and future economic productivity gains:
~ $350 million annually for 5 SE Asian countries~ $1.7 billion for PRC
6 Country NTD reductions: 8-30%> 25,000 fewer birth defect cases annuallyDeaths, life-long disability and health care cost
Synergistic with public health interventionsReaches 29-73% enabling health interventions to target.Sustainably implemented in the private market place with no opportunity costs to other health and nutrition programs

Conclusion: It’s So Cheap, It’s a Shame.
Fortifying 100% of ~ 9.7 million MT in Vietnam, Malaysia, Indonesia, Philippines and Thailand is feasible.
Total Cost at $1.50/MT = $14.5 million/yr
Asian Animal Feed Additives Market earned revenues of $284.3 million in 2005 and expect to reach $474.8 million by 2012 (Frost & Sullivan).
Human nutrition investment ~ 6% of 2005 animal feed market!