we bring life to power
TRANSCRIPT

We bring
Life To Power
Earnings Presentation I Q1FY21
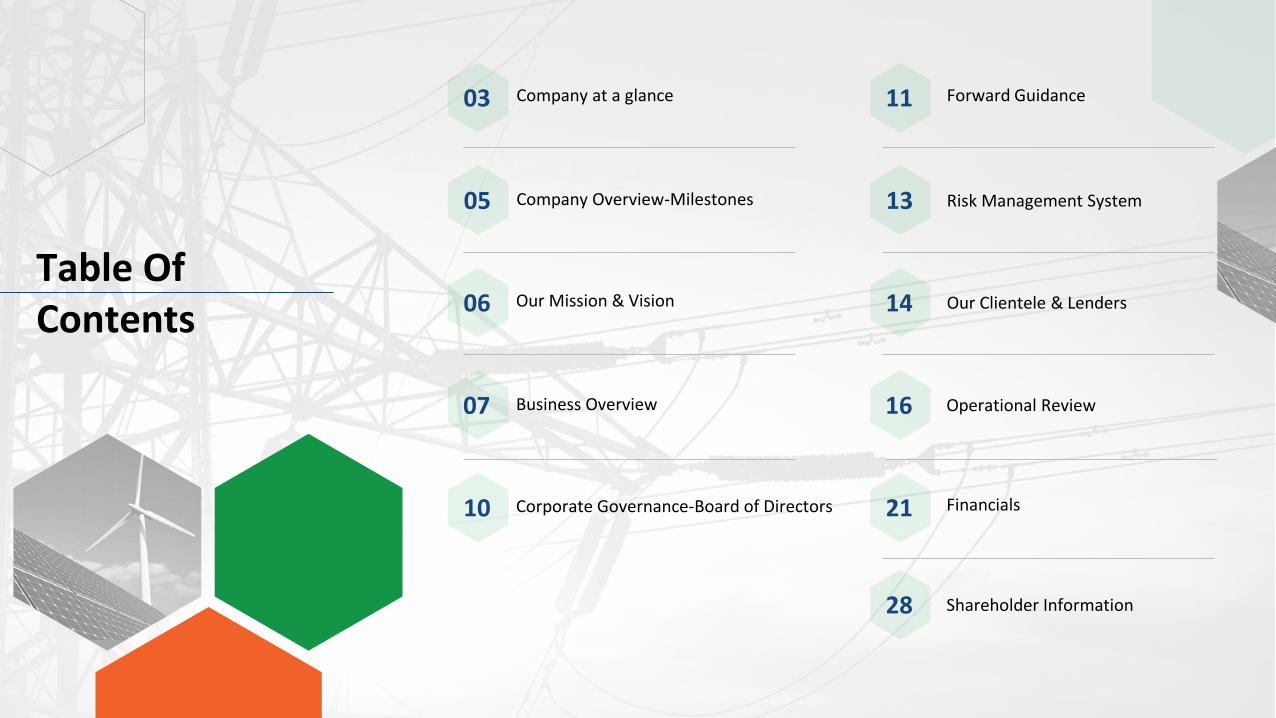
Table Of Contents
Company at a glance03
Company Overview-Milestones05
Our Mission & Vision06
Business Overview07
Corporate Governance-Board of Directors10
Forward Guidance
Risk Management System
Our Clientele & Lenders
Operational Review
Financials
Shareholder Information
11
13
14
16
21
28

Earnings Presentation NextPrevious 3
Company at a glance
Company Name PTC India Financial Services Limited (‘PFS’)
Industry Financial Industry / NBFC – Infrastructure Finance Company
Activity Investment and Financing to Power and other Infra Projects
Registered office 7th Floor, Telephone Exchange Building, 8 Bhikaji Cama Place, New Delhi 110066
Type of Organization Public Limited Company (Listed on BSE & NSE)
Date of Incorporation September 08, 2006
Promoter/Parent CompanyPTC India Limited(formerly known as “Power Trading Corporation of India”
CIN L65999DL2006PLC153373
Authorized Capital Rs. 2,000 crore
Paid up Capital Rs. 642.28 crore
Website www.ptcfinancial.com
Facilities CRISIL ICRA CARE
NCD / Bonds CRISIL A+ / Stable ICRA A+ /Stable CARE A+ /Stable
Long Term Loan CRISIL A+ / Stable ICRA A+ /Stable CARE A+ /Stable
Short Term Loan - ICRA A1+ CARE A1+
Commercial Paper CRISIL A1+ ICRA A1+ -
What rating agencies say
CRISIL has provided AA+ (CE) rating for PFS proposed SBI PCE backed NCD of Rs.580 crore and reaffirmed the rating in June 2020.

Earnings Presentation NextPrevious 4
PTC India Ltd (Promoter-Parent Company)
Promoter & Group Companies
o PTC India Ltd (formerly known as Power Trading Corporation of India Limited) is the main promoter and parent company which owns 64.99% in PTC India Financial Services Limited.
PTC India Financial Services Ltd (Subsidiary)
PTC Energy (Subsidiary)
64.99% 100%
Earnings Presentation NextPrevious 5
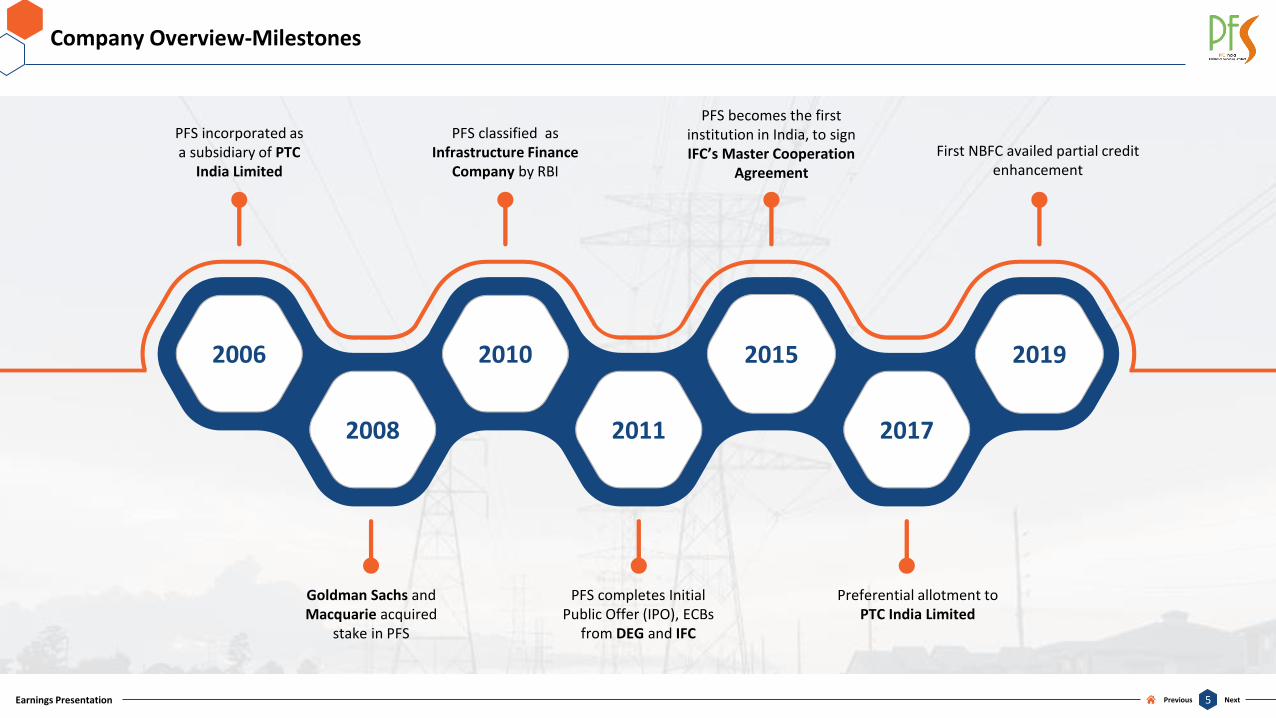
Company Overview-Milestones
2006
2008 2011
2010 2015
2017
2019
PFS incorporated as a subsidiary of PTC
India Limited
PFS classified as Infrastructure Finance
Company by RBI
PFS becomes the first institution in India, to sign IFC’s Master Cooperation
Agreement
PFS completes Initial Public Offer (IPO), ECBs
from DEG and IFC
Goldman Sachs and Macquarie acquired
stake in PFS
Preferential allotment to PTC India Limited
First NBFC availed partial credit enhancement
Earnings Presentation NextPrevious 6
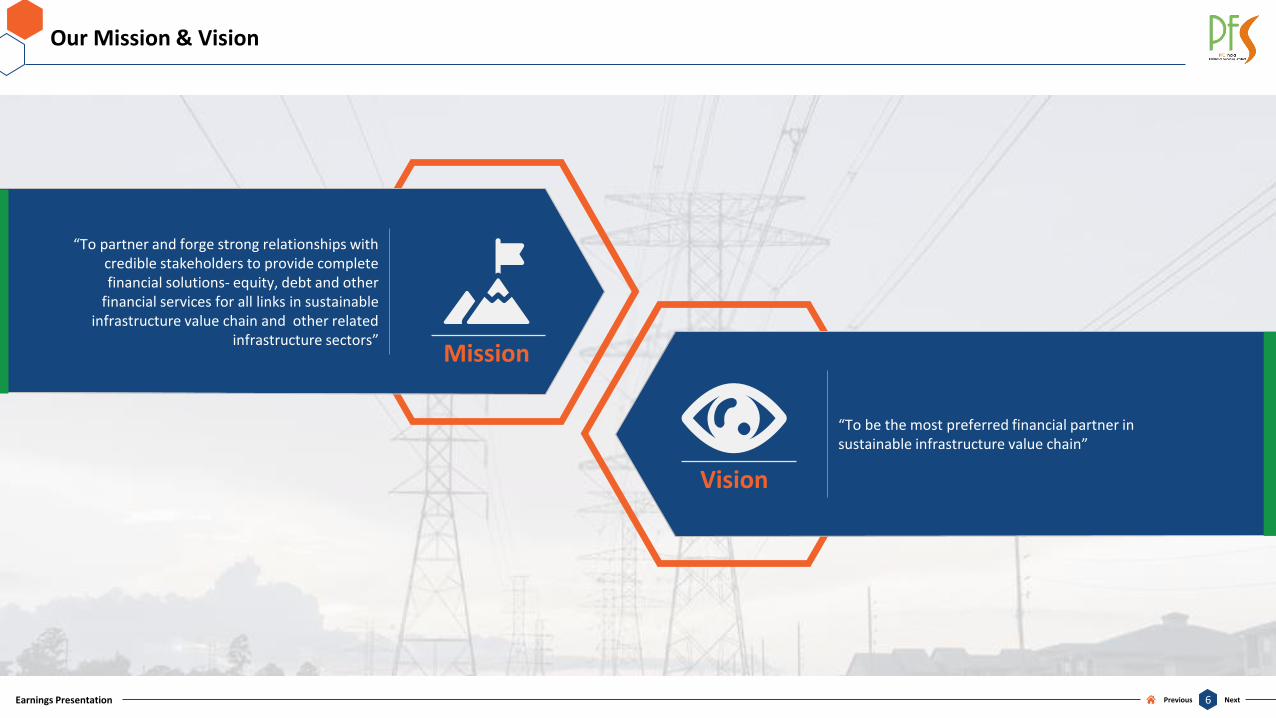
Our Mission & Vision
Mission
Vision
“To partner and forge strong relationships with credible stakeholders to provide complete financial solutions- equity, debt and other
financial services for all links in sustainable infrastructure value chain and other related
infrastructure sectors”
“To be the most preferred financial partner in sustainable infrastructure value chain”

Earnings Presentation NextPrevious 7
Business Overview
o PFS is positioned to cater the financialrequirement of the companies of sustainableinfrastructure value chain and other relatedinfrastructure in the form of debt, equity orany other credit arrangement as a one stopshop. PFS offers structured finance, hybridinstruments, advisory services and otherrelevant supports to its clients to mitigaterisks and effectively implement the projectand generate higher returns.
o PFS has successfully funded around 153projects from Renewable and Infra sectorssince its inception in FY 2007. It is highlyvalued by the project developers and isconsidered as a preferred financial partner

Earnings Presentation NextPrevious 8
Products & Services
Debt Financing
PFS provides debt finance in the form of Long Term Loan, Short Term Loan as well as Bridge Financing to the projects in the entire energy value chain i.e. from power generation projects to transmission and distribution projects, fuel sources and to the related infrastructure. There are various factors considered for the debt assistance to any particular project/borrowing company viz. market conditions, regulatory requirements, risk and reward from the projects etc.
Advisory Services
PFS provides advisory services to the various infrastructure, renewable energy, energy efficiency projects and other projects for helping in efficient installation of these projects. The Advisory
services are focused in the areas of finance and in the areas which lie at the intersection of finance and the energy sector.
Fee Based Services
PFS team assists companies in structuring and raising debt and mezzanine capital tailored to their needs. Leveraging on its long term relationships
with Banks and Financial Institutions and its experience in executing structured and vanilla debt transactions, PFS handholds companies in
structuring and raising capital, which is optimal in terms of cost and structure. With an in house core team of professionals with sectoral as
well cross-functional knowledge, PFS helps its clients to become competitive, effective and successful.
PFS offers various investment and financing products/solutions to Infrastructure and Power projects, the details are illustrated in the graphic below:

Earnings Presentation NextPrevious 9
Key Functions of the Company
• Treasury andResource Mobilization
• Asset Liability Management
• Interest RateMechanism
• Underwriting and Syndication
• Business Developmentand Credit
• Advisory Services
• Credit Appraisal and Monitoring
• Risk Management
• Early WarningSystem
The details of the key functions of the company are given below:

Earnings Presentation NextPrevious 10
Corporate Governance - Board of Directors
Shri Santosh B. Nayar, Independent DirectorHe has rich working experience of around 40 years in project finance and banking, includinginternational & investment banking, and life insurance industry. He was the Chairman of IndiaInfrastructure Finance Company Limited (IIFCL) , a wholly-owned Government of India Enterprisewith an asset size of USD 6.5 Bn.
Shri Rakesh Kacker, Nominee DirectorHe is a nominee director of PTC India Limited on the Board of the company and has earlierworked as Secretary to the Government of India and hold various posts at senior level in theGovernment. He has rich experience of India Power sector.
Shri Thomas Mathew T, Independent DirectorHe served as Managing Director and Interim Chairman of Life Insurance Corporationof India. He has also served as Managing Director and CEO of Reinsurance Group ofAmerica (RGA) for India Bangladesh and Sri Lanka. And also served on the board ofleading companies like Tata Power, Voltas, Mahindra & Mahindra, Corporation Bank,IFCI Limited, MDI, Gurgaon, National Insurance Academy, Pune, Metropolitan StockExchange of India and L&T Capital Markets. Currently he is on board of Larsen &Turbo Limited, L&T Finance Holdings, L&T Infra Debt Fund. L&T InfrastructureFinance Limited, Canara HSBC OBC Life Insurance Company Limited, LIC(International) Bahrain, L&T Capital Markets, Dubai.
Dr. Pawan Singh, MD & CEOHe is former Civil Officer and served as Director (Finance) of Delhi Power CompanyLtd, Delhi Transco Ltd, Genco etc.. He was involved with power reforms in Delhi andserved in various infrastructure sector organizations like Power grid, Indian Railways,Tata Steel and Ex. Director Finance for around 6.5 years of PFS. He has been on boardof various companies/ institution including IIFCL (AMC),. presently also on Board ofPTC Energy, MDI, Chairperson of Audit Committee
Shri Naveen Kumar, Whole Time DirectorHe has worked in power sector majors including BHEL, NTPC and PFC and has overallexperience of about 39 years covering various areas including infrastructure projectsformulation, technical and financial appraisal, monitoring and financing / consortiumlending of power projects. He also possesses rich experience in area of erection,commissioning, O&M of power projects and setting up of UMPPs.
Shri Deepak Amitabh, ChairmanHe is an former Indian Revenue Services (IRS) Officer. He also serves as Chairman andManaging Director of PTC India Limited. He has more than 35 years of experience inthe field of auditing, financing and revenue mobilization.
DR AJIT KUMAR , Nominee Director He is Nominee Director of PTC India Ltd. on the Board of the Company. He has joined PTC IndiaLimited as Director (Commercial & Operations) on 2nd April, 2015. Prior to joining PTC, heworked in NTPC for 35 years.
Rajiv Malhotra, Nominee DirectorHe is Nominee Director of PTC India Ltd. on the Board of the Company.. He is Executive Director& Group CRO, PTC India Ltd. His previous assignments include COO, Athena Energy Ventures andwas part of the team that successfully completed PTC’s IPO in 2004. .
Shri Kamlesh Shivji Vikamsey, Independent DirectorHe is chartered accountant and a Senior Partner of Khimji Kunverji & Co, Chartered Accountants
since 1982. He has more than thirty five years of experience in Accounting and Finance, Taxation,Corporate and Advisory services. He is Chairperson of the External Audit Committee (EAC) ofInternational Monetary Fund (IMF), Washington D.C., United States of America; DeputyChairperson of the Audit Advisory Committee of United Nations Children’s Fund (UNICEF), NewYork, United States of America; and Member of the Independent Management AdvisoryCommittee (IMAC) of International Telecommunication Union (ITU), Geneva, Switzerland.
Mrs. Praveen Tripathi , Independent DirectorShe is from IA&AS of 1973 Batch (retired) and has worked at various senior positionsin Govt. of India. She has served as member - Competition Appellate Tribunal,Member - Airport Economic Regulatory Authority Appellate Tribunal and as DeputyComptroller & Auditor General of India

Earnings Presentation NextPrevious 11
Forward Guidance
Maintain a diversified portfolio & liability mix
Leverage deep knowledge of Sector to continuously stay ahead of
curve. Third party PPA, capture decentralization generation
Offer structured financing solutions
Continue to develop strategic partnerships locally and globally
apart from IFC, FMO, DEG, OeEB, Goldman Sachs and Macquarie.
Leverage expertise and strength in Renewable
Sector through new product innovation
Advisory Services

Earnings Presentation NextPrevious 12
Management Outlook
The Company has emphasised on moving from consolidation to growth and expansion byenhancing its product offerings and focusing on quality portfolio. Our returns over the lastfew quarters underline our resolve to improve liquidity, improve value for the stakeholders,focus on achieving sustainable growth and contribute towards a better environment byrelying on renewable energy. These measures are aligned towards our vision of becoming asustainable infrastructure finance organisation.Our lenders, both domestic and international, have been very supportive due to which theCompany’s credit standing has enhanced drastically. To ensure the financial stability of theCompany, we are now lending in the more resilient sectors like transmission, road HAM andmuch more. This will help in highlighting our robust business model which is safeguardedfrom the economic headwinds.

Earnings Presentation NextPrevious 13
Risk Management System
• Implementation of Internal Credit Grading mechanism which captures sector specific risk related parameters during the entire loan-life cycle• (i.e. pre-construction and post construction).• Implementation of Early Warning System which has been integrated with internal credit grading mechanism to identify and closely monitor early
warning signals to prevent slippages of performing loan accounts into NPA.• Formulation of Corrective Action Plan for Loan accounts identified under EWS framework, and subsequently reviewing/monitoring on quarterly
basis.• Annual review of the entire portfolio through internal credit grading mechanism, wherein review of the security package, compliance of financial
covenants is ascertained and assessed
• Implemented the mechanism of Risk Based Pricing which has been integrated with internal credit grading mechanism.
Credit Risk Management
Market Risk Management

Earnings Presentation NextPrevious 14
Our Marquee Clients

Earnings Presentation NextPrevious 15
Our Key Lenders (International and Domestic)
Established relationship with Leading Development Financial Institutions (DFIs) and Banks in form of treasury of around Rs. 12,000 crore(around $ 1,700 million)
Earnings Presentation NextPrevious 16
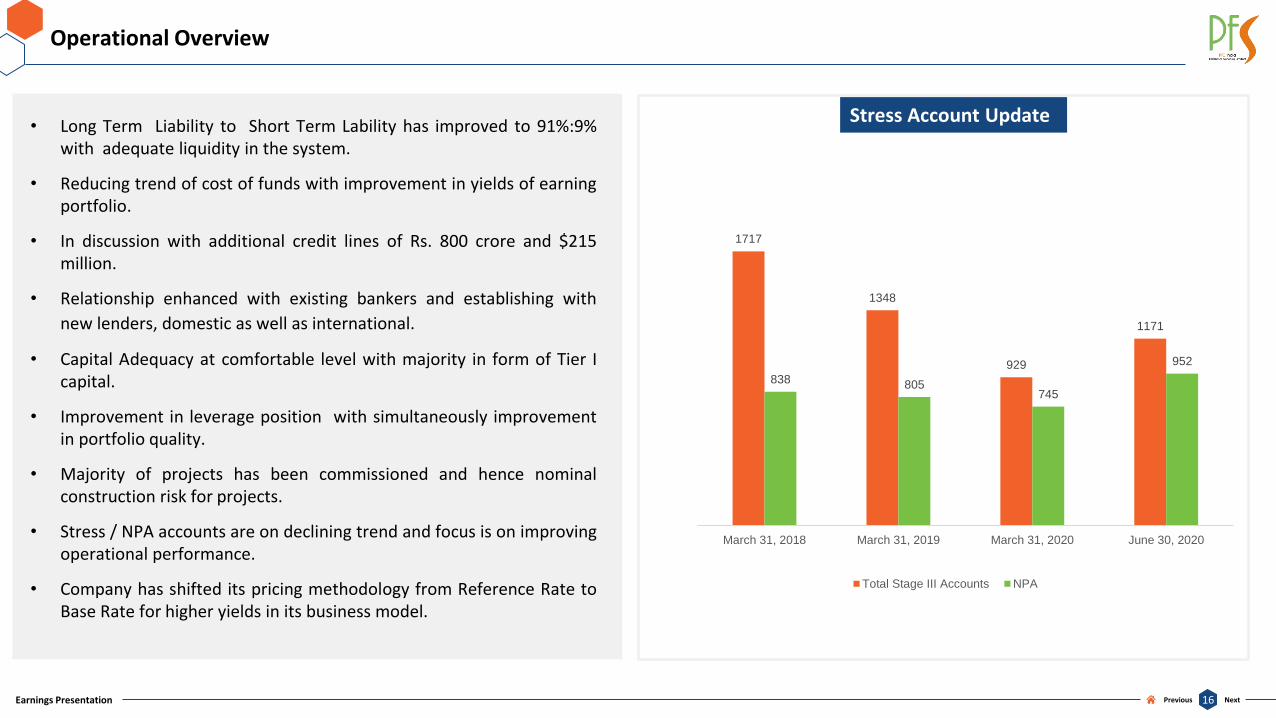
Operational Overview
• Long Term Liability to Short Term Lability has improved to 91%:9%with adequate liquidity in the system.
• Reducing trend of cost of funds with improvement in yields of earningportfolio.
• In discussion with additional credit lines of Rs. 800 crore and $215million.
• Relationship enhanced with existing bankers and establishing with
new lenders, domestic as well as international.
• Capital Adequacy at comfortable level with majority in form of Tier Icapital.
• Improvement in leverage position with simultaneously improvementin portfolio quality.
• Majority of projects has been commissioned and hence nominalconstruction risk for projects.
• Stress / NPA accounts are on declining trend and focus is on improvingoperational performance.
• Company has shifted its pricing methodology from Reference Rate toBase Rate for higher yields in its business model.
Stress Account Update
1717
1348
929
1171
838 805745
952
March 31, 2018 March 31, 2019 March 31, 2020 June 30, 2020
Total Stage III Accounts NPA

Earnings Presentation NextPrevious 17
Operational Performance – Debt Outstanding
2148 2147 2142 21371793 1788 1783
1456 1207 1217
75117900 7909 8044
78367493
6625
59015472 5437
296 298 300 324 232 236 241 234 207 207
2861 3016 3014 2885
34603588
41814409
41194248
Q4FY2018 Q1FY2019 Q2FY2019 Q3FY2019 Q4FY2019 Q1FY2020 Q2FY2020 Q3FY2020 Q4FY2020 Q1FY2021
Rs
in C
rore
Thermal Renewable Hydro Others
Total 12,816 13,361 13,366 13,390 13,321 13,105 12,830 12,000 11,005 11,109

Earnings Presentation NextPrevious 18
Portfolio Shift – Credit Portfolio %
17 16 16 1613 14 14 12 11 11
59 59 59 60
59 5752
49 50 49
2 2 2 2
2 2
2
2 2 2
22 23 23 2226 27
3337 37 38
Q4FY2018 Q1FY2019 Q2FY2019 Q3FY2019 Q4FY2019 Q1FY2020 Q2FY2020 Q3FY2020 Q4FY2020 Q1FY2021
Thermal Renewable Hydro Others

Earnings Presentation NextPrevious 19
Comfortable Cash Flows
Additional comforts above cash flow indicated in chart below :
• Undrawn credit lines of around Rs 1,600 crore.• High Quality Liquid Assets (HQLA) of Rs 265 crore in form of bank fixed deposits• LOI of $115 million.• Fresh Credit lines of around Rs 800 crore and $100 million under consideration with various lenders.
Rs. In Crore
717614
1976
2872
436604
1976
3027
1M-3M 3M-6M 6M-1Y 3Y-5Y
Total Inflows Total Outflows

Earnings Presentation NextPrevious 20
Exploration towards further business
Large pipe line of clean energy and sustainable infrastructure
projects to support growth
Debt equity ratio has been improved to 4.34
Capital adequacy is comfortable at 23.75 %
Stress / NPA accounts of Rs.685 crore has been
resolved in previous year and further resolution is expected in current year

Financials

Earnings Presentation NextPrevious 22
Results Overview (Rs. In crore)
Qtr ended 30th June, 2020
Qtr ended 31st March, 2020
Shift QoQ %Particulars (Rs. Crores)
Qtr ended 30th June, 2019
Shift YoY %
290.37 316.61 (8) Interest Income 344.90 (16)
298.11 332.88 (10) Total Income 352.01 (15)
206.04 224.74 (8) Interest and financial charges 256.07 (20)
40.57 73.78 (45) Provision and contingencies 62.70 (35)
8.90 19.95 (55) Other operating expenses 9.81 (9)
255.51 318.47 (20) Total expenses 328.58 (22)
42.06 14.41 196 Profit before tax 23.43 82
16.03 7.36 118 Tax expense (including deferred tax) 7.79 106
26.57 7.05 277 Profit after tax 15.64 70

Earnings Presentation NextPrevious 23
Key Indicators
Qtr ended 30th June, 2020
Qtr ended 31st March, 2020
Qtr ended 30th June, 2019
ParticularsYear ended
31st Mar 2020Year ended
31st Mar 2019
- 884 717 Loan Sanctioned (Rs. Crs) 3,041 5,124
100 511 457 Loan Disbursed (Rs. Crs) 2,590 4,085
11,561 11,394 13,711 Outstanding Credit 11,394 14,237
11,109 11,005 13,105 Loan Assets (Rs. Crs) 11,005 13,321
452 389 606 Non fund based (Rs. Crs) 389 916
84.33 91.87 90.0 Net Interest Income (Rs. Crs) 373.90 339.70
11.56 11.67 11.50 Yield on Earning Loan (%) 11.73 11.13
8.76 8.98 9.13 Cost of borrowed funds (%) 9.12 8.61
2.80 2.68 2.37 Interest Spread (%) 2.61 2.52
3.36 3.38 2.99 Net Interest Margin (%) 3.31 2.99
0.41 0.11 0.24 Earnings Per Share (Rs.) 1.71 2.87
9.50 14.58 9.82 Cost to Income Ratio (%) 10.69 10.30
23.75 23.61 20.83 Capital Adequacy Ratio (%) 23.61 21.55
4.34 4.43 5.15 Debt Equity Ratio (%) 4.43 5.28
4.99 1.34 3.01 Return on Networth (%) 5.34 9.19
0.91 0.24 0.48 Return on Assets (%) 0.94 1.40

Earnings Presentation NextPrevious 24
Net Interest Income ( Rs. In crore)
90.5691.40
87.40
71.51
89.83
100.62
91.72 91.87
84.33
1Q 2019 2Q 2019 3Q 2019 4Q 2019 1Q 2020 2Q 2020 3Q 2020 4Q 2020 1Q2021

Earnings Presentation NextPrevious 25
NIMs driven with optimal mix of funds
11.5011.93 11.86 11.67 11.56
9.13 9.09 9.208.98
8.76
2.993.52 3.38 3.38 3.36
2.37 2.84 2.66 2.69 2.80
Q1FY20 Q2FY20 Q3FY20 Q4FY20 Q1FY21
Yield Cost of Funds Spread NIM

Earnings Presentation NextPrevious 26
Provisioning on Stage III Loan Account as on 30th June, 2020
Loan Account (Rs. crore) Gross Loan Provision Net Exposure Impairment Reserve
Athena Chhattisgarh Power Limited 189.52 101.83 87.69 11.84
Dirang Energy Private Limited 74.25 54.14 20.11 1.87
Himagiri Hydro Energy Pvt Ltd 5.00 1.50 3.50 -
ICOMM Tele Ltd 2.65 0.03 2.62 0.76
Kohinoor Power Pvt Limited 50.00 47.3 2.7 1.1
Konaseema Gas Power Limited 100.00 75.35 24.65 24.65
KSK Mineral Resources Private Limited 44.39 18.40 25.99 -
NSL Nagapatnam Power & Infratech Private Limited 125.00 37.50 87.50 -
Meenakshi Energy Private Limited 150.00 30.0 120.0 -
NRSS XXXVI Transmission Limited 206.92 31.04 175.88 -
Varam Bio-energy Pvt Ltd 4.29 4.29 - -
IL&FS Tamil Nadu Power Company Limited 218.97 58.11 160.86 13.78
Total of Stage III accounts 1170.99 459.49 711.5 54.00

Earnings Presentation NextPrevious 27
Corporate Social Responsibility
Training of Street Food Vendors Mobile Health Clinics in operation during lockdown to provide health care to the
underprivileged areas
Our project on CRM (Crop Residue Management) to reduce stubble burning in
farms and donation of a Seeder Machine

Earnings Presentation NextPrevious 28
Shareholder Information
Stock Information (As on 04th August, 2020)
Market Cap 1,127.21 Cr
Stock Price 17.60
52 Week (High/Low) 18.45/6.78
NSE/BSE Symbol PFS/533344
No of shares outstanding 64.22 Cr
Average Daily Volume (3 months) 15,08,068
Top 5 Shareholders (As on 30th June, 2020) % of holding
PTC India Limited 64.99
Life Insurance Corporation of India 2.13
Dimensional Emerging Core Equity Portfolio 0.34
Dimensional Emerging Markets Value Fund 0.27
The Emerging Markets Small Cap Series 0.23
65%
29%
3%
2% 1%
PTC India Ltd
Individual & Others
Bank/FI/Insurancecompanies
Bodies Corporate/MutualFunds
Foreign Portfolio Investors
Source : Thomson Reuters
Stock Chart as on 04th August, 2020 Shareholding Pattern as at 30th June, 2020
Rounded off to nearest multiple

Thank YouPTC India Financial Services Ltd7th Floor Telephone Exchange Building,8 Bhikaji Cama Place,New Delhi 110066 INDIA
Tel: +91 11 26737300/ 26737400Fax: +91 11 26737373/ 26737374Email: [email protected]: L65999DL2006PLC153373