waste and climate change - international solid waste ... and climate change . iswa white paper . ......
TRANSCRIPT
Waste and Climate Change ISWA WHITE PAPER
17014 ISWA White Paper.indd 2 26/11/09 20:44:25
Preface 3
Re-evaluating waste: ISWA key messages 4
ISWA Commitments 6
Introduction 7
Technologies 8
Material recovery 14
Organic recovery 16
Energy recovery 18
Clean Development Mechanism 20
Policy and regulation 26
Greenhouse gas accounting 34
References 38
2
List of Contents
17014 ISWA White Paper.indd 3 26/11/09 20:44:27
The climate change phenomenon, its causes and consequences, is now generally accepted and recognised by the international scientific community, governments, the private sector, NGOs and the general population.
It requires a robust response. Solutions must be found that will mitigate emissions of greenhouse gases and help to adapt to its unavoidable consequences. The complexity of the issue requires the acceptance of a common responsibility from both the public and private sector.
As the only international association promoting sustainable development in the waste management sector, ISWA is well placed to acknowledge our own responsibility and to act accordingly.
We are now very proud to present the Waste & Climate ISWA White Paper, setting forth the technologies and mechanisms which can transform the waste sector into a net global reducer of GHG emissions, and making the necessary commitments to assist this change.
ISWA’s aim is to facilitate global improvements in waste management strategies. Our membership structure and secretariat offer an established
resource for the dissemination of knowledge and experience. We will support new research and education programmes and assess experiences from different countries on policy, strategy and accounting, to provide a global foundation for progress.
Our commitments will see us working in close cooperation with other international institutes and organisations to promote far-reaching and fundamental reduction targets, which recognise the untapped potential for waste related GHG emissions reductions.
I would like to extend our special acknowledgement and thanks to the members of the Task Force for having made possible the publication of this White Paper, as well as all those people who have participated in this process with presentations, opinions and comments.
Atilio A. Savino President, ISWA 3rd December 2009
3Preface
17014 ISWA White Paper.indd 4 26/11/09 20:44:28
4
Re-evaluating waste: ISWA key messages
1. The waste industry occupies a unique position as a potential reducer of greenhouse gas (GHG) emissions. As industries and countries worldwide struggle to address their carbon footprint, waste sector activities represent an opportunity for carbon reduction which has yet to be fully exploited.
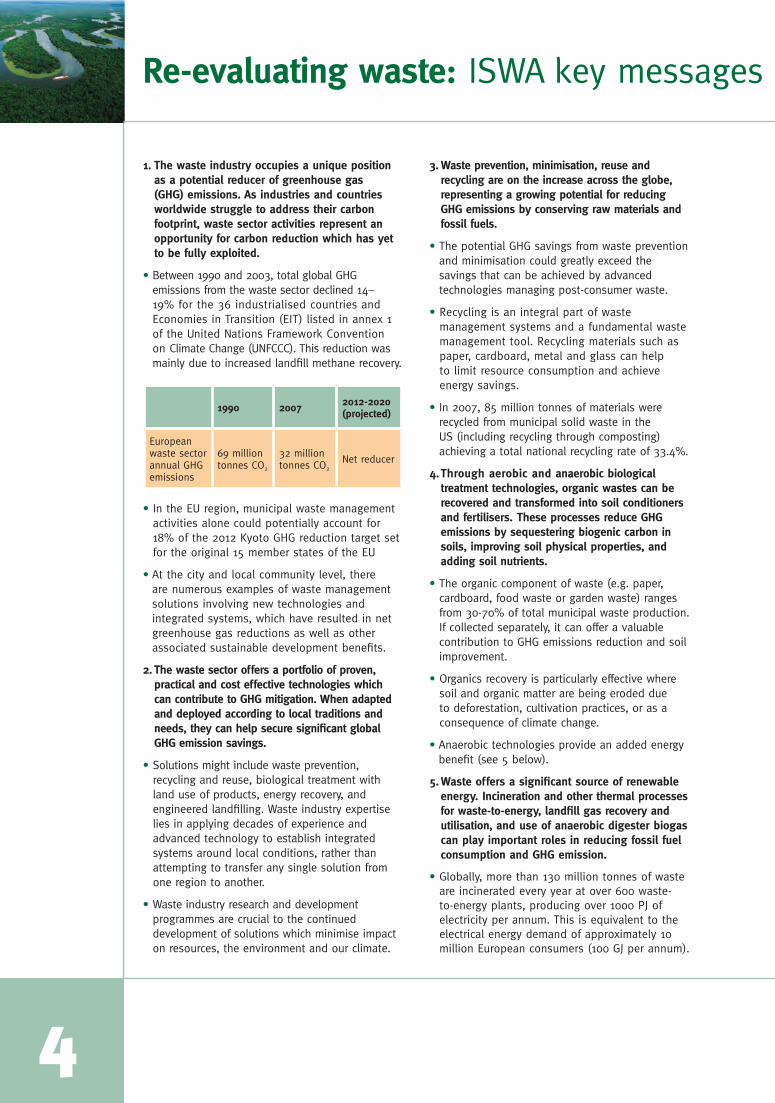
• Between 1990 and 2003, total global GHG emissions from the waste sector declined 14–19% for the 36 industrialised countries and Economies in Transition (EIT) listed in annex 1 of the United Nations Framework Convention on Climate Change (UNFCCC). This reduction was mainly due to increased landfill methane recovery.
• In the EU region, municipal waste management activities alone could potentially account for 18% of the 2012 Kyoto GHG reduction target set for the original 15 member states of the EU
• At the city and local community level, there are numerous examples of waste management solutions involving new technologies and integrated systems, which have resulted in net greenhouse gas reductions as well as other associated sustainable development benefits.
2. The waste sector offers a portfolio of proven, practical and cost effective technologies which can contribute to GHG mitigation. When adapted and deployed according to local traditions and needs, they can help secure significant global GHG emission savings.
• Solutions might include waste prevention, recycling and reuse, biological treatment with land use of products, energy recovery, and engineered landfilling. Waste industry expertise lies in applying decades of experience and advanced technology to establish integrated systems around local conditions, rather than attempting to transfer any single solution from one region to another.
• Waste industry research and development programmes are crucial to the continued development of solutions which minimise impact on resources, the environment and our climate.
3. Waste prevention, minimisation, reuse and recycling are on the increase across the globe, representing a growing potential for reducing GHG emissions by conserving raw materials and fossil fuels.
• The potential GHG savings from waste prevention and minimisation could greatly exceed the savings that can be achieved by advanced technologies managing post-consumer waste.
• Recycling is an integral part of waste management systems and a fundamental waste management tool. Recycling materials such as paper, cardboard, metal and glass can help to limit resource consumption and achieve energy savings.
• In 2007, 85 million tonnes of materials were recycled from municipal solid waste in the US (including recycling through composting) achieving a total national recycling rate of 33.4%.
4. Through aerobic and anaerobic biological treatment technologies, organic wastes can be recovered and transformed into soil conditioners and fertilisers. These processes reduce GHG emissions by sequestering biogenic carbon in soils, improving soil physical properties, and adding soil nutrients.
• The organic component of waste (e.g. paper, cardboard, food waste or garden waste) ranges from 30-70% of total municipal waste production. If collected separately, it can offer a valuable contribution to GHG emissions reduction and soil improvement.
• Organics recovery is particularly effective where soil and organic matter are being eroded due to deforestation, cultivation practices, or as a consequence of climate change.
• Anaerobic technologies provide an added energy benefit (see 5 below).
5. Waste offers a significant source of renewable energy. Incineration and other thermal processes for waste-to-energy, landfill gas recovery and utilisation, and use of anaerobic digester biogas can play important roles in reducing fossil fuel consumption and GHG emission.
• Globally, more than 130 million tonnes of waste are incinerated every year at over 600 waste-to-energy plants, producing over 1000 PJ of electricity per annum. This is equivalent to the electrical energy demand of approximately 10 million European consumers (100 GJ per annum).
1990 2007 2012-2020 (projected)
European waste sector annual GHG emissions
69 million tonnes CO2
32 million tonnes CO2
Net reducer
17014 ISWA White Paper.indd 5 26/11/09 20:44:29
5Re-evaluating waste: ISWA key messages
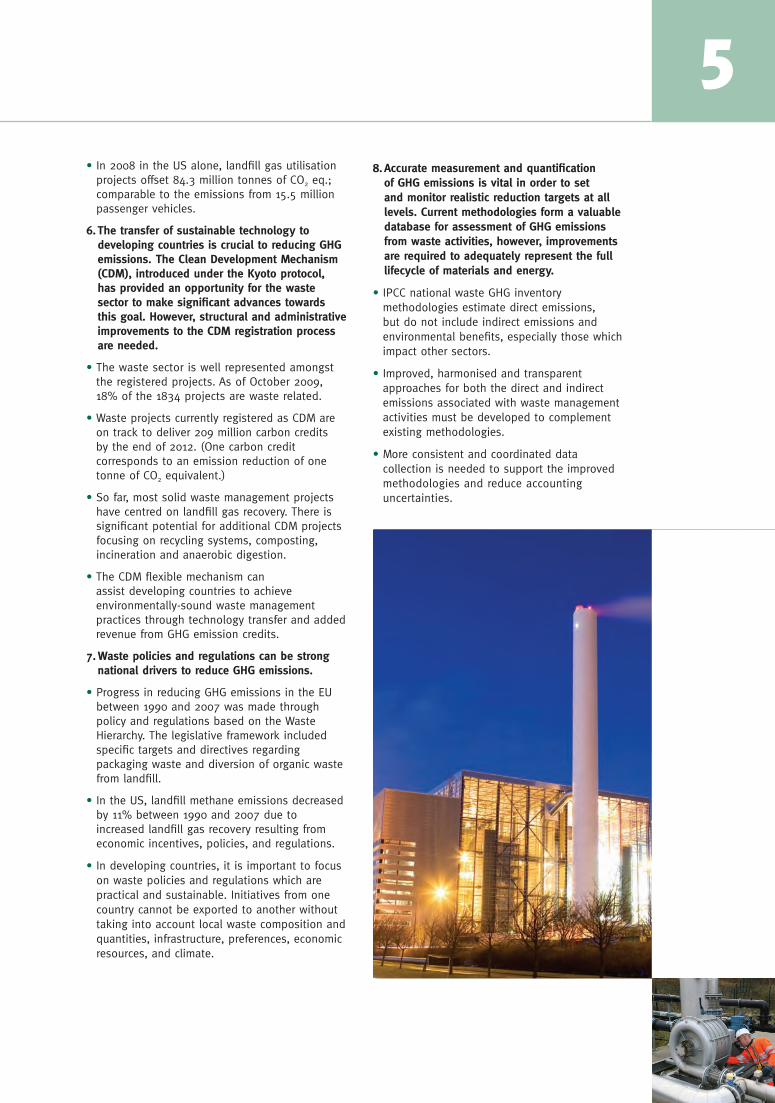
• In 2008 in the US alone, landfill gas utilisation projects offset 84.3 million tonnes of CO2 eq.; comparable to the emissions from 15.5 million passenger vehicles.
6. The transfer of sustainable technology to developing countries is crucial to reducing GHG emissions. The Clean Development Mechanism (CDM), introduced under the Kyoto protocol, has provided an opportunity for the waste sector to make significant advances towards this goal. However, structural and administrative improvements to the CDM registration process are needed.
• The waste sector is well represented amongst the registered projects. As of October 2009, 18% of the 1834 projects are waste related.
• Waste projects currently registered as CDM are on track to deliver 209 million carbon credits by the end of 2012. (One carbon credit corresponds to an emission reduction of one tonne of CO2 equivalent.)
• So far, most solid waste management projects have centred on landfill gas recovery. There is significant potential for additional CDM projects focusing on recycling systems, composting, incineration and anaerobic digestion.
• The CDM flexible mechanism can assist developing countries to achieve environmentally-sound waste management practices through technology transfer and added revenue from GHG emission credits.
7. Waste policies and regulations can be strong national drivers to reduce GHG emissions.
• Progress in reducing GHG emissions in the EU between 1990 and 2007 was made through policy and regulations based on the Waste Hierarchy. The legislative framework included specific targets and directives regarding packaging waste and diversion of organic waste from landfill.
• In the US, landfill methane emissions decreased by 11% between 1990 and 2007 due to increased landfill gas recovery resulting from economic incentives, policies, and regulations.
• In developing countries, it is important to focus on waste policies and regulations which are practical and sustainable. Initiatives from one country cannot be exported to another without taking into account local waste composition and quantities, infrastructure, preferences, economic resources, and climate.
8. Accurate measurement and quantification of GHG emissions is vital in order to set and monitor realistic reduction targets at all levels. Current methodologies form a valuable database for assessment of GHG emissions from waste activities, however, improvements are required to adequately represent the full lifecycle of materials and energy.
• IPCC national waste GHG inventory methodologies estimate direct emissions, but do not include indirect emissions and environmental benefits, especially those which impact other sectors.
• Improved, harmonised and transparent approaches for both the direct and indirect emissions associated with waste management activities must be developed to complement existing methodologies.
• More consistent and coordinated data collection is needed to support the improved methodologies and reduce accounting uncertainties.
17014 ISWA White Paper.indd 6 26/11/09 20:44:30

6
ISWA Commitments
1. Networking for capacity building, disseminating knowledge and experience at country, institution or individual levels. ISWA will undertake cooperation with complementary organisations dealing with sustainable material and energy management to support these activities.
2. Initiating and supporting research and education on GHG related issues. ISWA will work in partnership with established providers such as research institutes, universities, corporations and administrations in countries with proven infrastructures, to transfer tangible knowledge and expertise to less developed regions.
3. Selecting cities to participate in case studies and targeted action to mitigate GHG emissions through waste management systems, and disseminating the results of their experience to other comparable cities. ISWA will bring its membership structure, secretariat and staff together to facilitate the success of this endeavour.
4. Assessing experience from different countries and regions on policies, strategies and regulations. With solid data to draw upon, ISWA will develop a sound basis for recommendations that would accomplish optimum waste related GHG emission reductions, both locally and globally. This work might include formulation, implementation, enforcement and compliance tools as well as transparent and accurate accounting methodologies.
5. Participating actively in global events and negotiations regarding Waste and Climate Change before 2012 and beyond. ISWA will work in close cooperation with other international institutes and organisations to promote a more global and ambitious commitment to GHG reduction targets, focusing on realising the potential for waste related GHG emissions reductions.
The International Solid Waste Association (ISWA) is committed to global GHG emission reduction through a number of targeted actions:
The waste industry puts forward an integrated solutions approach: the choice of a particular technology is a function of a number of variables such as costs, waste quantity and characteristics, regulations, and policy considerations.
17014 ISWA White Paper.indd 7 26/11/09 20:44:35

7Climate change is a major international concern for modern society. Since the pre-industrial era, atmospheric concentrations of carbon dioxide (CO2 ) have increased by 35% and methane (CH4) concentrations have more than doubled. There is scientific consensus that the observed increase in global average temperatures since the mid 20th century is due to the increase in concentrations of such greenhouse gases (GHG) produced by human activity, primarily the combustion of fossil fuels such as coal, oil and natural gas.
Climate change has already had a measurable impact on many natural and human systems. The effects are projected to increase in severity as the global average temperature rises. Although the evidence indicates that the time for global action is limited, it is generally believed that there is still time to avoid the most damaging impacts of climate change, if the global community takes strong action now.
No single policy initiative or technology will achieve the GHG emission reductions required to achieve climate stabilisation. Rather, it will require a portfolio of mitigation solutions. The waste sector must be part of this portfolio, as it can deliver significant GHG savings.
The global direct GHG emissions resulting from waste management activities are around 1.3Gt CO2 eq. or approximately 3 – 5% of total anthropogenic emissions in 2005 (IPCC 2007). However, there is now credible evidence that, taking into account associated avoided emissions, the waste sector can completely change this picture.
On regional and city scales, the waste sector has the opportunity to change from a net emitter into a net reducer of GHG emissions. Through careful selection and use of existing waste management systems and technologies, many regions and cities can work to achieve an internationally significant reduction of GHG emissions.
Over the past several decades, there have been significant advances in the practices and technologies employed to collect, treat, recycle and recover waste. This progress has been aimed at improving public health conditions in local communities and cities and minimising the environmental impacts associated with managing waste.
As a result there are now a wide range of mature and environmentally effective waste management technologies in use which can also provide positive mitigation of GHG emissions. The selection of appropriate waste management options must be based on local conditions.
The choice is most frequently in the hands of local decision makers; however, consideration of the GHG impact of the available options is increasingly forming part of the selection process. Cities and local communities are including waste management solutions in their climate action plans. It’s crucial that policy makers at national and international levels recognise these initiatives and promote the waste sector’s mitigation potential, encouraging local solutions which help to address this global problem.
As waste management practices have evolved and awareness of the scarcity of natural resources has grown, there has been a paradigm shift from a waste management to a resource management philosophy. Through material and energy recovery, waste is increasingly considered as a resource to be exploited. These activities have an important potential for GHG emissions reduction. As shown in the figure opposite, waste can become an integrated part of the overall material flow through the economy.
In the following White Paper we will address issues which are vital to the success of GHG mitigation through better waste management. The following sections deal with technology, material recovery, organic recovery, energy recovery, the clean development mechanism, policy and regulation, and GHG accounting methodologies. Issues such as human health, environmental protection other than GHG emissions, and cost are not examined here; the point is that benefits related to these subjects are maintained even when waste management systems are focused on effective GHG reduction strategies.
Climate change should be viewed as an opportunity and not a risk for the waste management industry. The challenge of a new low-carbon economy is an effective innovation driver for waste management activities. While there are already many proven technologies available which can make a significant contribution, the current push towards GHG reduction solutions can only result in more efficient waste management systems. By combining new and existing technical solutions, backed by industry experience, ISWA and the waste industry can define a new framework for targets and objectives advancing future waste management policy and practice.
Introduction
17014 ISWA White Paper.indd 8 26/11/09 20:44:39
8
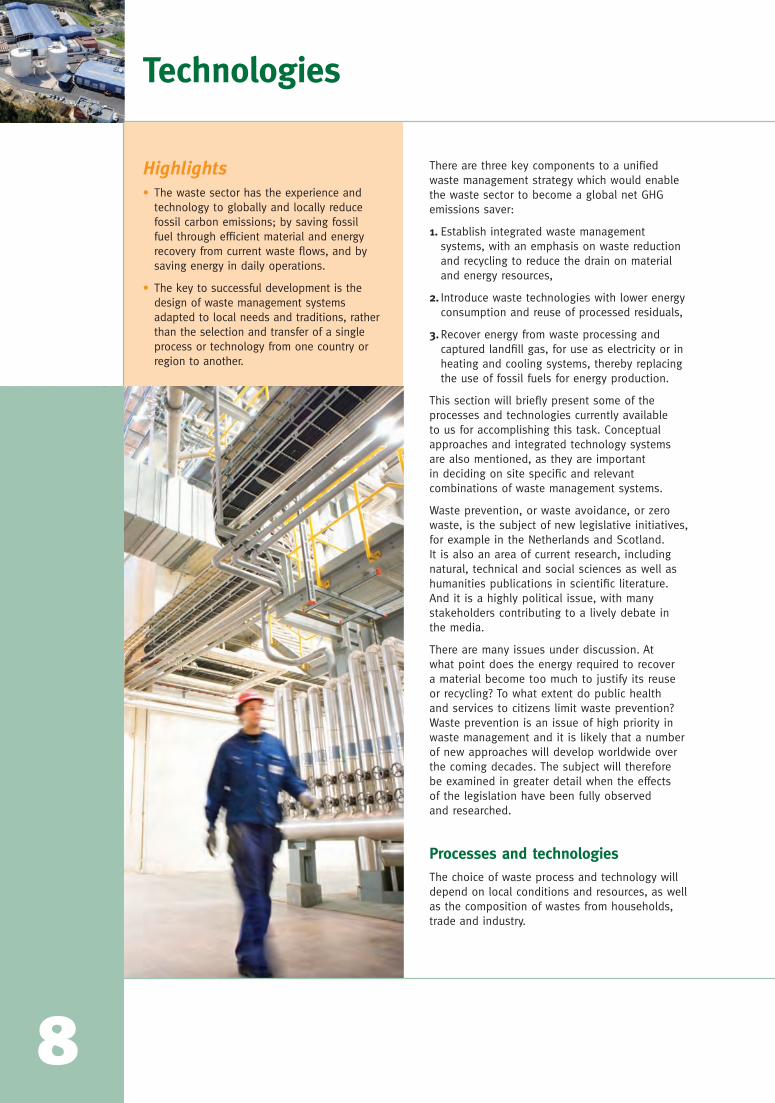
Highlights• The waste sector has the experience and
technology to globally and locally reduce fossil carbon emissions; by saving fossil fuel through efficient material and energy recovery from current waste flows, and by saving energy in daily operations.
• The key to successful development is the design of waste management systems adapted to local needs and traditions, rather than the selection and transfer of a single process or technology from one country or region to another.
There are three key components to a unified waste management strategy which would enable the waste sector to become a global net GHG emissions saver:
1. Establish integrated waste management systems, with an emphasis on waste reduction and recycling to reduce the drain on material and energy resources,
2. Introduce waste technologies with lower energy consumption and reuse of processed residuals,
3. Recover energy from waste processing and captured landfill gas, for use as electricity or in heating and cooling systems, thereby replacing the use of fossil fuels for energy production.
This section will briefly present some of the processes and technologies currently available to us for accomplishing this task. Conceptual approaches and integrated technology systems are also mentioned, as they are important in deciding on site specific and relevant combinations of waste management systems.
Waste prevention, or waste avoidance, or zero waste, is the subject of new legislative initiatives, for example in the Netherlands and Scotland. It is also an area of current research, including natural, technical and social sciences as well as humanities publications in scientific literature. And it is a highly political issue, with many stakeholders contributing to a lively debate in the media.
There are many issues under discussion. At what point does the energy required to recover a material become too much to justify its reuse or recycling? To what extent do public health and services to citizens limit waste prevention? Waste prevention is an issue of high priority in waste management and it is likely that a number of new approaches will develop worldwide over the coming decades. The subject will therefore be examined in greater detail when the effects of the legislation have been fully observed and researched.
Processes and technologiesThe choice of waste process and technology will depend on local conditions and resources, as well as the composition of wastes from households, trade and industry.
Technologies
17014 ISWA White Paper.indd 9 26/11/09 20:44:41
9The potential for GHG emission reduction will vary accordingly. For instance, although developing countries produce waste containing a lower organic content per capita, the percentage of organic material is higher; this would impact on technology selection.
For all the processes and technologies briefly described in the following, WM&R (2009 a, b) provide much more detail on processes and technologies as well as specific numbers on emissions of GHG.
Collection and Transportation
Waste collection necessarily involves the use of vehicles and consumption of fuel. There are wide variations in both fuel types and consumption levels; hence the amount of fuel used for each collected tonne of waste can vary according to the collection system used.
GHG emission sources
• CO2 from fossil fuel and electricity consumption
Actions to reduce or avoid GHG emissions:
• Rationalisation of collection operations and improvement of fuel efficiency
• Use of alternative fuels such as biodiesel, bioethanol or biogas
• Development of alternative means of transport such as rail or water
• Minimising transport distances
• Implementation of driver training programmes.
Recycling
There are a wide range of technologies available for solid waste recycling, based on the relevant materials; metals, paper, plastic, glass or wood. Recycling saves GHG emissions by reducing the amount of waste which must be disposed of and by providing a substitute for the use of raw materials in product manufacturing. Many industries use recycled materials to avoid the GHG emissions associated with extraction, transportation to the production site, and energy use involved in producing new products from virgin materials.
Material separation for recycling may take place at source (e.g. in households) or after collection in centralised facilities designed according to material recovery priorities.
In both cases, the quality of both the product and the volume of recovery are important factors to be considered in estimating GHG reduction.
Any assessment of a recycling operation must account for material loss in the process (technical substitution), the market acceptance of the recycled product (market substitution) and the energy required to recycle compared with manufacture of new products from raw materials.
GHG emission sources:
• CO2 from fossil fuel consumption for transport and recycling activities and electricity consumption.
Action to reduce or avoid GHG emissions:
• Increasing the material recovery rate.
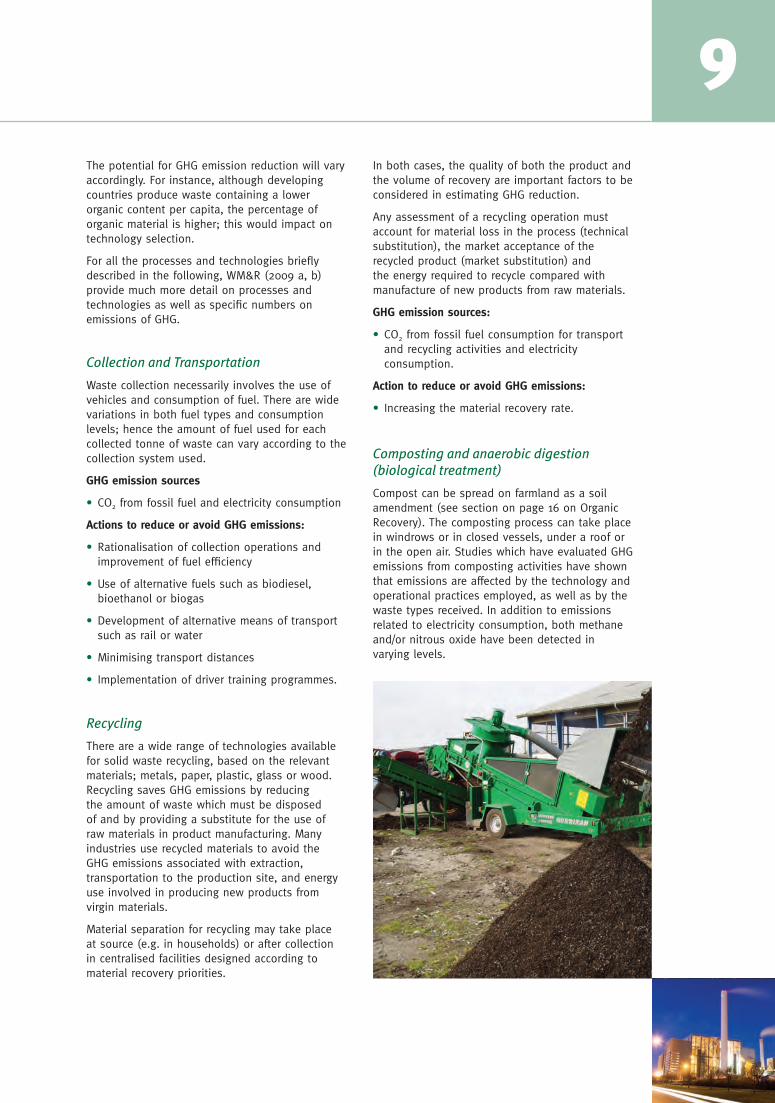
Composting and anaerobic digestion (biological treatment)
Compost can be spread on farmland as a soil amendment (see section on page 16 on Organic Recovery). The composting process can take place in windrows or in closed vessels, under a roof or in the open air. Studies which have evaluated GHG emissions from composting activities have shown that emissions are affected by the technology and operational practices employed, as well as by the waste types received. In addition to emissions related to electricity consumption, both methane and/or nitrous oxide have been detected in varying levels.
17014 ISWA White Paper.indd 10 26/11/09 20:44:44
10
Composting systems have proved useful in both developing and industrialised nations. In developing countries, where technological investment in waste management is low, and the waste has a high organic content (sometimes exceeding 50%) and with a high moisture content, composting is frequently a more practical solution than advanced technologies such as incineration. However, where biological waste is separated in developed countries, composting may have an even more prominent role; in the Netherlands 97% of source separated bio-waste is treated in composting facilities (WWS 2009).
Anaerobic digestion (AD) is a biological treatment where organic (usually food) waste is digested by naturally occurring bacteria in a closed bioreactor, in the absence of oxygen. The process produces biogas (methane and carbon dioxide) which is captured to produce electric energy and heat and used to enhance digester processing.
The by-product, a digestate or residual organic waste, can be used in the agricultural industry, often after composting.
AD requires better pre-sorting and accepts fewer types of organic waste than composting. The process can extract between 50 – 70% of the energy contained in organic matter and the biogas may be used for electricity production with an efficiency rate of 35% of the energy content of the biogas. The emissions, including leaks, from biogas combustion such as methane and nitrous oxide must be taken into account when evaluating system efficiencies and GHG emissions.
GHG emission sources:
• CO2 from fossil fuel combustion and electricity consumption
• CH4 and N2O emissions from processes.
Actions to reduce or avoid GHG emissions:
• Increase compost production and use low emitting treatment technologies
• Improve process efficiency and convert methane from AD to energy while minimising fugitive emissions.
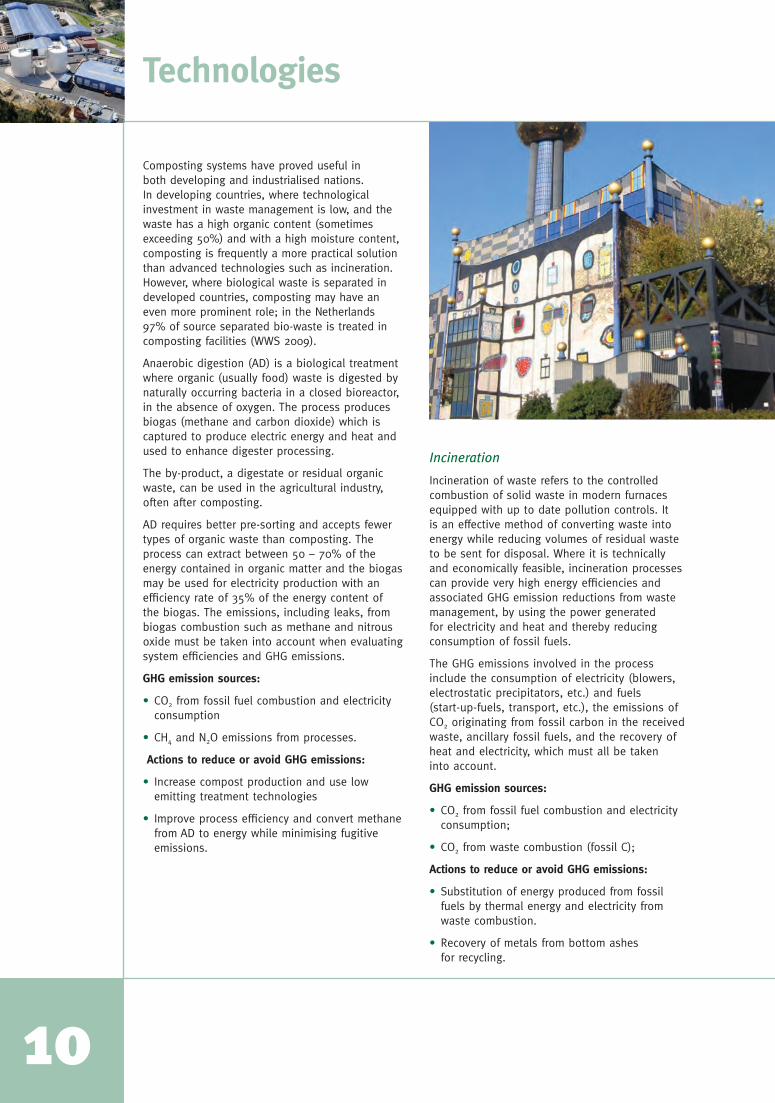
Incineration
Incineration of waste refers to the controlled combustion of solid waste in modern furnaces equipped with up to date pollution controls. It is an effective method of converting waste into energy while reducing volumes of residual waste to be sent for disposal. Where it is technically and economically feasible, incineration processes can provide very high energy efficiencies and associated GHG emission reductions from waste management, by using the power generated for electricity and heat and thereby reducing consumption of fossil fuels.
The GHG emissions involved in the process include the consumption of electricity (blowers, electrostatic precipitators, etc.) and fuels (start-up-fuels, transport, etc.), the emissions of CO2 originating from fossil carbon in the received waste, ancillary fossil fuels, and the recovery of heat and electricity, which must all be taken into account.
GHG emission sources:
• CO2 from fossil fuel combustion and electricity consumption;
• CO2 from waste combustion (fossil C);
Actions to reduce or avoid GHG emissions:
• Substitution of energy produced from fossil fuels by thermal energy and electricity from waste combustion.
• Recovery of metals from bottom ashes for recycling.
Technologies
17014 ISWA White Paper.indd 11 26/11/09 20:44:46
11Landfilling
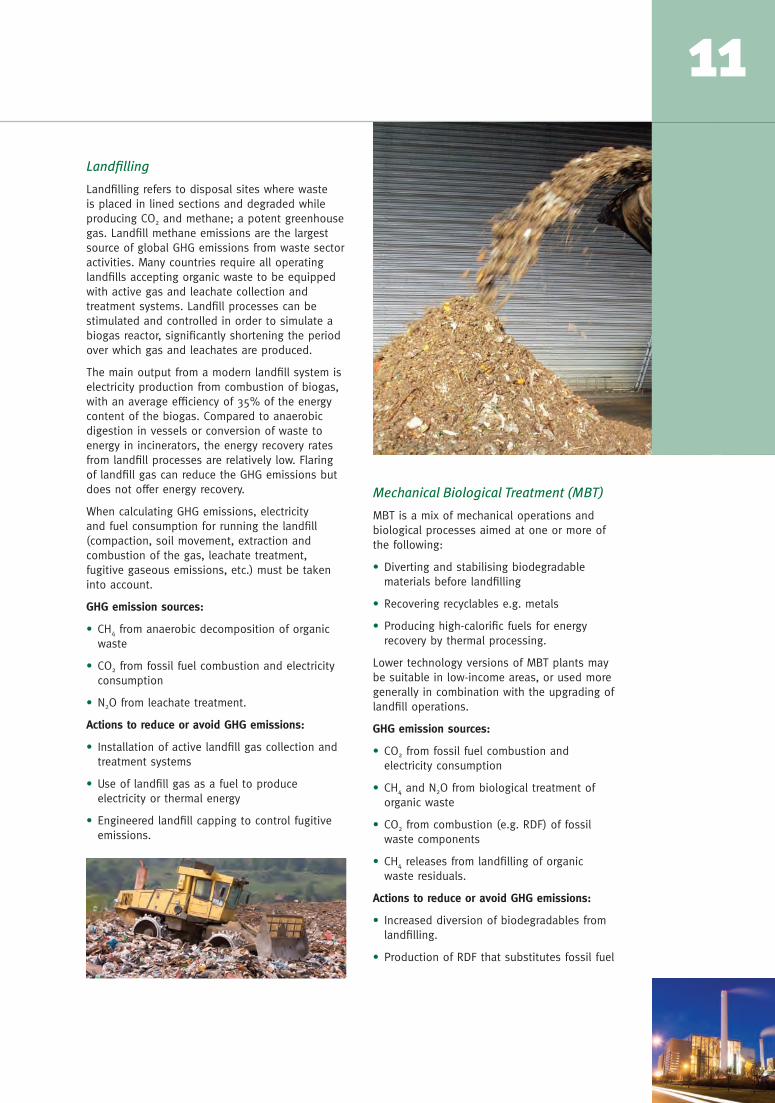
Landfilling refers to disposal sites where waste is placed in lined sections and degraded while producing CO2 and methane; a potent greenhouse gas. Landfill methane emissions are the largest source of global GHG emissions from waste sector activities. Many countries require all operating landfills accepting organic waste to be equipped with active gas and leachate collection and treatment systems. Landfill processes can be stimulated and controlled in order to simulate a biogas reactor, significantly shortening the period over which gas and leachates are produced.
The main output from a modern landfill system is electricity production from combustion of biogas, with an average efficiency of 35% of the energy content of the biogas. Compared to anaerobic digestion in vessels or conversion of waste to energy in incinerators, the energy recovery rates from landfill processes are relatively low. Flaring of landfill gas can reduce the GHG emissions but does not offer energy recovery.
When calculating GHG emissions, electricity and fuel consumption for running the landfill (compaction, soil movement, extraction and combustion of the gas, leachate treatment, fugitive gaseous emissions, etc.) must be taken into account.
GHG emission sources:
• CH4 from anaerobic decomposition of organic waste
• CO2 from fossil fuel combustion and electricity consumption
• N2O from leachate treatment.
Actions to reduce or avoid GHG emissions:
• Installation of active landfill gas collection and treatment systems
• Use of landfill gas as a fuel to produce electricity or thermal energy
• Engineered landfill capping to control fugitive emissions.
Mechanical Biological Treatment (MBT)
MBT is a mix of mechanical operations and biological processes aimed at one or more of the following:
• Diverting and stabilising biodegradable materials before landfilling
• Recovering recyclables e.g. metals
• Producing high-calorific fuels for energy recovery by thermal processing.
Lower technology versions of MBT plants may be suitable in low-income areas, or used more generally in combination with the upgrading of landfill operations.
GHG emission sources:
• CO2 from fossil fuel combustion and electricity consumption
• CH4 and N2O from biological treatment of organic waste
• CO2 from combustion (e.g. RDF) of fossil waste components
• CH4 releases from landfilling of organic waste residuals.
Actions to reduce or avoid GHG emissions:
• Increased diversion of biodegradables from landfilling.
• Production of RDF that substitutes fossil fuel
17014 ISWA White Paper.indd 12 26/11/09 20:44:51
Technologies
12
Other processes and technologies
Other advanced processes and technologies such as autoclaving or pyrolysis and gasification are currently used by the waste management sector. However, their commercial applications and therefore their potential for reducing GHG emissions have yet to be proven.
Conceptual frameworks
In defining the challenge of waste management in relation to sustainable development, a conceptual framework which takes into account resources, environmental effects and socio-economic issues is essential to decision-making for both legislators and industry.
Such a system has been defined and is now in use in a number of countries including Europe and the United States. The waste hierarchy is a valuable conceptual and political prioritisation tool which can assist in developing waste management strategies aimed at limiting resource consumption and protecting the environment.
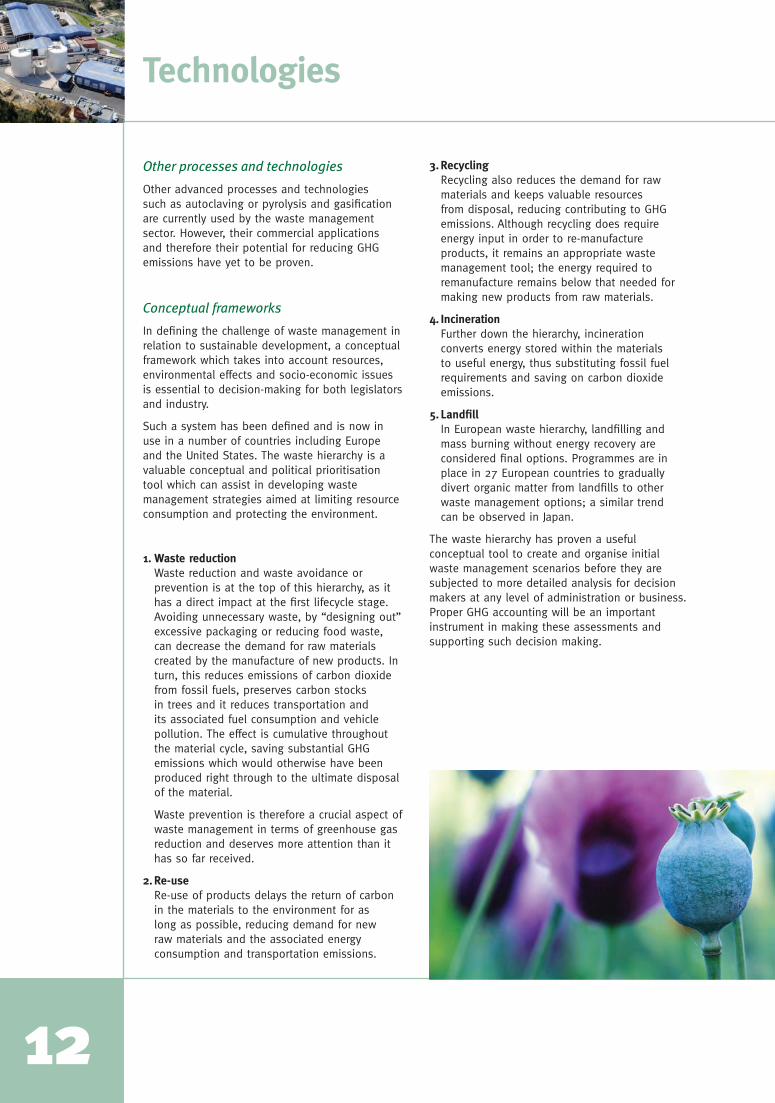
1. Waste reduction Waste reduction and waste avoidance or prevention is at the top of this hierarchy, as it has a direct impact at the first lifecycle stage. Avoiding unnecessary waste, by “designing out” excessive packaging or reducing food waste, can decrease the demand for raw materials created by the manufacture of new products. In turn, this reduces emissions of carbon dioxide from fossil fuels, preserves carbon stocks in trees and it reduces transportation and its associated fuel consumption and vehicle pollution. The effect is cumulative throughout the material cycle, saving substantial GHG emissions which would otherwise have been produced right through to the ultimate disposal of the material.
Waste prevention is therefore a crucial aspect of waste management in terms of greenhouse gas reduction and deserves more attention than it has so far received.
2. Re-use Re-use of products delays the return of carbon in the materials to the environment for as long as possible, reducing demand for new raw materials and the associated energy consumption and transportation emissions.
3. Recycling Recycling also reduces the demand for raw materials and keeps valuable resources from disposal, reducing contributing to GHG emissions. Although recycling does require energy input in order to re-manufacture products, it remains an appropriate waste management tool; the energy required to remanufacture remains below that needed for making new products from raw materials.
4. Incineration Further down the hierarchy, incineration converts energy stored within the materials to useful energy, thus substituting fossil fuel requirements and saving on carbon dioxide emissions.
5. Landfill In European waste hierarchy, landfilling and mass burning without energy recovery are considered final options. Programmes are in place in 27 European countries to gradually divert organic matter from landfills to other waste management options; a similar trend can be observed in Japan.
The waste hierarchy has proven a useful conceptual tool to create and organise initial waste management scenarios before they are subjected to more detailed analysis for decision makers at any level of administration or business. Proper GHG accounting will be an important instrument in making these assessments and supporting such decision making.
17014 ISWA White Paper.indd 13 26/11/09 20:44:55
13GHG emissions and waste management systems
Assessment of GHG emission reduction potential must be approached on a system scale, not only at the process and technology levels. Political and technological infrastructure as well as the volume and composition of the waste produced, must be taken into account when proposing realistic targets for GHG emissions reductions. For planning and decision making purposes it is possible to model a number of alternative system scenarios and establish a ranking based on potential GHG emission savings.
Christensen et al in WM&R (2009) examined some 40 generic waste management scenarios using various recycling schemes and up-to-date treatment technologies of the residuals after recycling. These showed that rational waste management scenarios can lead to substantial savings of CO2-eq emissions per tonne of municipal waste.
Scenarios where residual waste is landfilled showed savings (fossil CO2 not emitted) in the range of 0 – 400kg CO2-eq tonne-1 municipal waste. Scenarios with incineration of residual waste showed savings in the range 200 – 700kg CO2-eq per tonne of municipal waste. And scenarios where residual waste went to an MBT facility showed savings in the range 250 – 700kg CO2-eq per tonne of municipal waste.
These estimations are sensitive to assumptions made regarding waste composition; crediting the energy produced in the waste management system; alternative use of wood not harvested due to paper recycling and the amount of biogenic carbon still bound 100 years after it had been landfilled. These factors control the overall GHG savings results and may affect each one by as much as 200kg CO2-eq per tonne of municipal waste.
Recommendations• The potential for waste related GHG emission
reduction should be exploited globally in order to ensure that waste management becomes a net GHG emission reducer.
• Cities, regions and countries should systematically assess present emissions from waste management and develop schemes to become net GHG emissions reducers.
• The waste industry should improve the transfer of knowledge, skills and technology from developed to developing countries.
• The waste sector should continue making use of proven technology and experience as well as facilitating research and development programmes to seek even more climate friendly solutions.
ISWA commitments• The above recommendations define major
tasks to be completed in order to realise the waste sector’s potential for reduced GHG emissions worldwide. ISWA commits to assisting in the implementation of these tasks through education and training, including an international information exchange on waste and climate, based on shared knowledge and experience between established and new member countries.
• Monitoring progress and using the information thus collated means continuously learning from experience. This is likely to become the cornerstone for the success of this endeavour. ISWA working groups and dedicated taskforces can be instrumental in achieving the objectives of such a programme.
17014 ISWA White Paper.indd 14 26/11/09 20:44:58

Material Kg recyclables per 1000 kg MSW
Kg recovered per 1000 kg MSW
Kg CO2-eq. saved per 1000 kg Material
Kg CO2-eq. saved per 1000 kg MSW
Paper 200 140 2,500-600 350-85
Aluminium 10 6 10,000 60
Steel 25 15 2,000 30
Glass 50 30 500 15
Plastic 80 50 1,000-0 50-0
Total 365 241 505-190
Material recovery
14
Highlights• Recycling of materials such as paper,
cardboard, metals, glass and plastic is a major waste management activity if corporations or local authorities wish to limit resource consumption and accomplish energy savings.
• The potential GHG savings from waste prevention and minimisation could greatly exceed the savings that can be achieved by advanced technologies to manage post-consumer waste.
• Recycling is an integral part of waste management systems and a fundamental waste management tool. Recycling materials such as paper, cardboard, metal, glass can help to limit resource consumption and achieve energy savings.
Recycling is an indispensable waste management activity. Companies, local authorities and the waste industry can achieve substantial energy savings and conserve natural resources at the same time by recycling paper, cardboard, metals, glass and plastic. Recycling can offer substantial GHG emissions savings; it is placed high in the waste hierarchies used in many parts of the world and forms an integral part of most waste management schemes.
As demonstrated in several articles in WM&R (2009 a&b) the potential for saving GHG emissions is particularly high when recovering materials from the waste stream in modern societies. Table 4.1 offers some insight into the potential, using as a basis 1 tonne of municipal solid waste or MSW (post consumer waste typically from urban areas and including some light trade waste).
The typical materials in MSW which can be recycled are listed in column one. These appear in most countries where waste is municipally collected, even though the volumes of the different materials will vary. In column two, the total weight of recyclables per tonne of MSW and the relative distribution between the different materials are listed. All numbers should be considered approximate and they appear here to enable a practical estimate for the GHG emissions savings achievable through materials recycling programmes in typical industrialised nations.
While the amounts in column two are in fact present in MSW, in practical terms they are not fully available to recycling programmes. Neither household participation nor centralised sorting systems operate at 100%. Households may choose not to participate, or neglect instructions for sorting their waste. Efficiencies could be low in producing clean final materials from mechanical sorting systems, particularly if the waste to be sorted is mixed and may be soiled or otherwise contaminated; any of these factors can affect the recovery rate.
The figures in column three are typical of a northern European city community, but they could vary significantly depending on the reliability of information supplied and motivation campaigns implemented by the collection agency.
Provided materials are delivered clean to recycling businesses, the GHG emissions savings per unit weight of the material are listed in column four. For paper, the range is wide and the high end number is based on the assumption that paper recycling avoids the use of virgin wood for paper production. This wood could in turn be used as a bio-fuel for energy production and thus substitute fossil fuel. For plastic there is also a wide range, since significant GHG emissions savings only become practical if high quality plastic grades (well sorted and clean) are recycled.
Table 4.1 Recyclables as present in typical Northern European MSW, and approximate CO2- eq saved when recycling the listed materials as opposed to use of virgin raw materials for production of the same amount of recycled material. Energy saving is by substituting energy from coal fired power plants.
17014 ISWA White Paper.indd 15 26/11/09 20:45:01
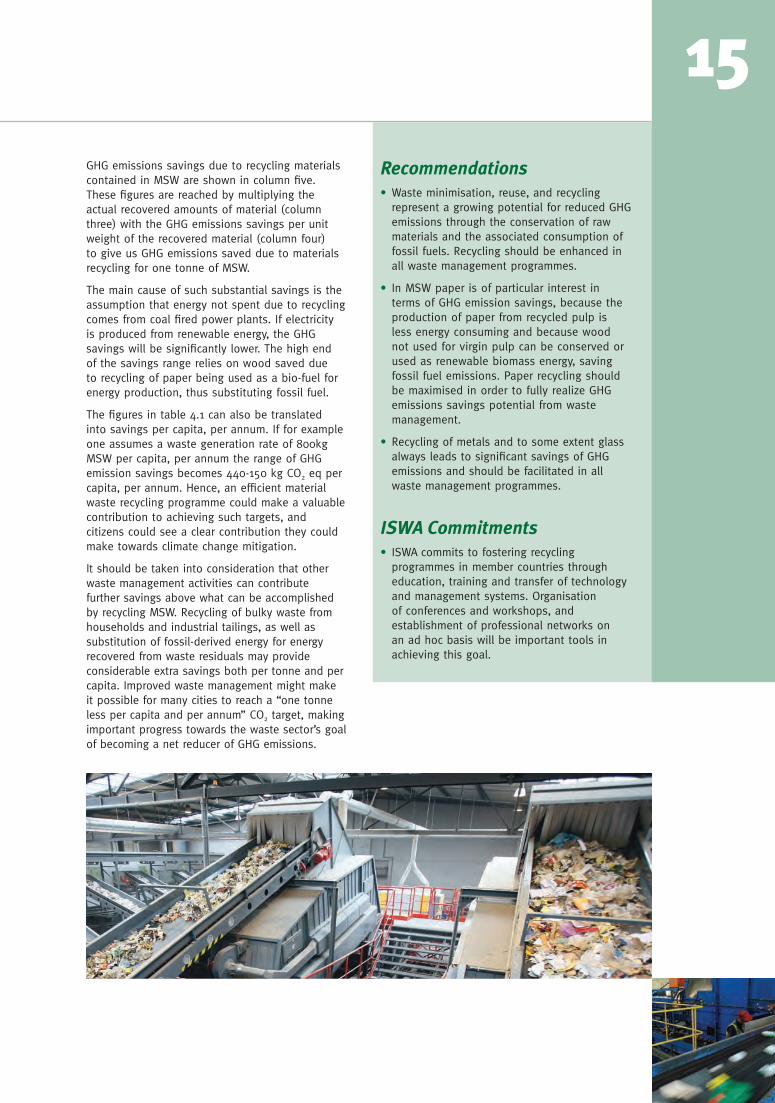
15GHG emissions savings due to recycling materials contained in MSW are shown in column five. These figures are reached by multiplying the actual recovered amounts of material (column three) with the GHG emissions savings per unit weight of the recovered material (column four) to give us GHG emissions saved due to materials recycling for one tonne of MSW.
The main cause of such substantial savings is the assumption that energy not spent due to recycling comes from coal fired power plants. If electricity is produced from renewable energy, the GHG savings will be significantly lower. The high end of the savings range relies on wood saved due to recycling of paper being used as a bio-fuel for energy production, thus substituting fossil fuel.
The figures in table 4.1 can also be translated into savings per capita, per annum. If for example one assumes a waste generation rate of 800kg MSW per capita, per annum the range of GHG emission savings becomes 440-150 kg CO2 eq per capita, per annum. Hence, an efficient material waste recycling programme could make a valuable contribution to achieving such targets, and citizens could see a clear contribution they could make towards climate change mitigation.
It should be taken into consideration that other waste management activities can contribute further savings above what can be accomplished by recycling MSW. Recycling of bulky waste from households and industrial tailings, as well as substitution of fossil-derived energy for energy recovered from waste residuals may provide considerable extra savings both per tonne and per capita. Improved waste management might make it possible for many cities to reach a “one tonne less per capita and per annum” CO2 target, making important progress towards the waste sector’s goal of becoming a net reducer of GHG emissions.
Recommendations• Waste minimisation, reuse, and recycling
represent a growing potential for reduced GHG emissions through the conservation of raw materials and the associated consumption of fossil fuels. Recycling should be enhanced in all waste management programmes.
• In MSW paper is of particular interest in terms of GHG emission savings, because the production of paper from recycled pulp is less energy consuming and because wood not used for virgin pulp can be conserved or used as renewable biomass energy, saving fossil fuel emissions. Paper recycling should be maximised in order to fully realize GHG emissions savings potential from waste management.
• Recycling of metals and to some extent glass always leads to significant savings of GHG emissions and should be facilitated in all waste management programmes.
ISWA Commitments• ISWA commits to fostering recycling
programmes in member countries through education, training and transfer of technology and management systems. Organisation of conferences and workshops, and establishment of professional networks on an ad hoc basis will be important tools in achieving this goal.
17014 ISWA White Paper.indd 16 26/11/09 20:45:09

Organic recovery
16
Highlights• Biological treatment, in particular composting,
is a relatively simple, durable and inexpensive alternative for stabilising and reducing biodegradable waste.
• The use of biologically treated biodegradable waste as a soil amendment can contribute to avoided GHG emissions, by about 60 kg CO2 eq. per tonne of biodegradable waste.
• A potential for reduced pesticide use and improved soil characteristics, e.g. in terms of water holding capacity and easier workability.
Approximately 30 – 70% of municipal solid waste (MSW) is comprised of organic waste such as food waste, bio-waste and garden waste. Given a clean input of biomass, either through source separation or treatment such as anaerobic digestion or composting, organic waste can be processed into a soil amendment for use in agriculture, green spaces and land reclamation. Food industry wastes and clean wastewater sludge can be added to the organic fraction of municipal wastes and used for organic recovery. As covered in the Technology section, biological treatment such as anaerobic digestion and composting are processes which precede the application to land for soil amendment and some fertilisation.
The use of biologically treated products (often compost) as soil amendment can contribute to GHG emissions reductions by:
• Binding carbon in the soil (sequestration)
• Reducing production or importation of mineral fertilisers
• Substituting peat in the production of growth media.
The GHG benefits of organic recovery depend on the composition of the treated waste, the region’s climate, the cultivation and the soil type. A recent study delivered the following results (Prognos, 2008):
• Sequestration: saving of 52 kg CO2 per tonne of collected and composted biodegradable waste
• Peat and fertiliser displacement: saving of 8 kg CO2 per tonne of collected and composted biodegradable waste
• Total: 60 kg CO2 equivalent avoided per tonne of waste composted
After an extensive literature review and lifecycle assessment modelling, Boldrin et al. (2009) estimated that the GHG contribution of composting varies between significant savings (–900 kg CO2-equivalents tonne–1 wet waste (ww)) and a net load (300 kg CO2-equivalents tonne–1 ww), depending on the type of technology employed, the type of waste, the substituted material and the level of technology optimisation.
17014 ISWA White Paper.indd 17 26/11/09 20:45:14
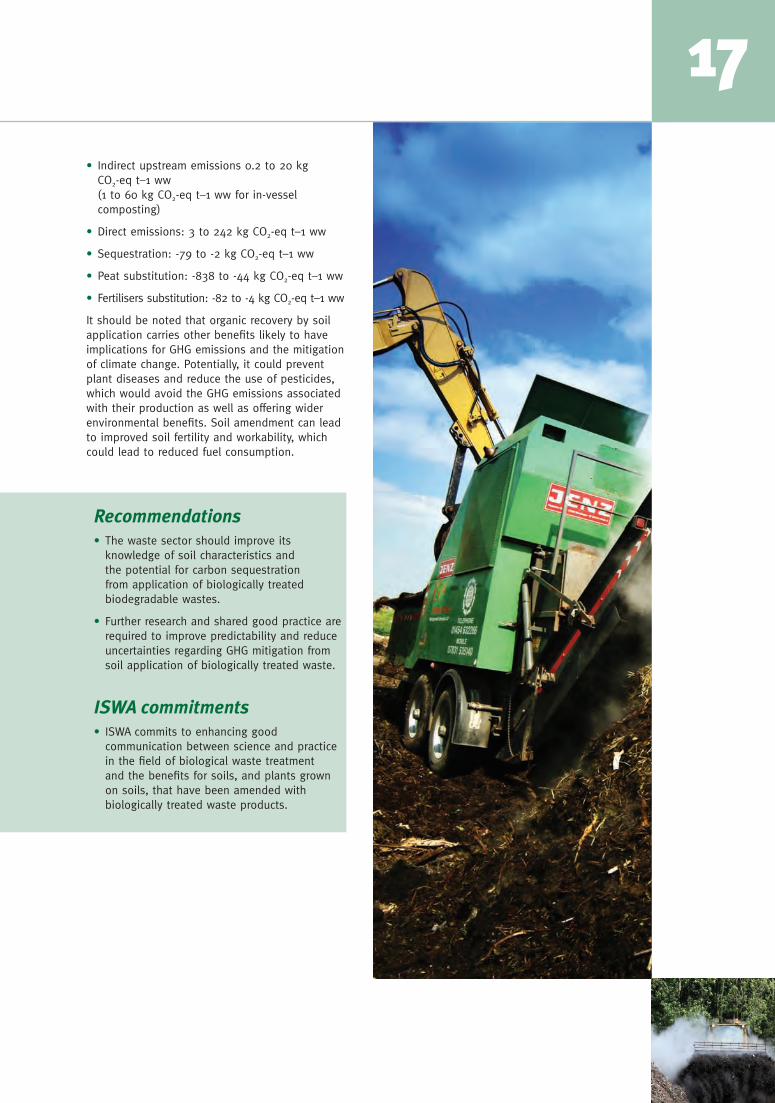
17• Indirect upstream emissions 0.2 to 20 kg
CO2-eq t–1 ww (1 to 60 kg CO2-eq t–1 ww for in-vessel composting)
• Direct emissions: 3 to 242 kg CO2-eq t–1 ww
• Sequestration: -79 to -2 kg CO2-eq t–1 ww
• Peat substitution: -838 to -44 kg CO2-eq t–1 ww
• Fertilisers substitution: -82 to -4 kg CO2-eq t–1 ww
It should be noted that organic recovery by soil application carries other benefits likely to have implications for GHG emissions and the mitigation of climate change. Potentially, it could prevent plant diseases and reduce the use of pesticides, which would avoid the GHG emissions associated with their production as well as offering wider environmental benefits. Soil amendment can lead to improved soil fertility and workability, which could lead to reduced fuel consumption.
Recommendations• The waste sector should improve its
knowledge of soil characteristics and the potential for carbon sequestration from application of biologically treated biodegradable wastes.
• Further research and shared good practice are required to improve predictability and reduce uncertainties regarding GHG mitigation from soil application of biologically treated waste.
ISWA commitments• ISWA commits to enhancing good
communication between science and practice in the field of biological waste treatment and the benefits for soils, and plants grown on soils, that have been amended with biologically treated waste products.
17014 ISWA White Paper.indd 18 26/11/09 20:45:17

Energy recovery
18
Highlights• Existing technologies for energy recovery
from waste are mature, cost-effective, and environmentally acceptable.
• Thermal processes, landfill gas utilisation, and use of digester biogas provide important local renewable energy benefits to offset fossil fuels.
• Recycling, reuse, and waste minimisation provide important indirect energy benefits which reduce the use of virgin materials, increase energy efficiency, and avoid fossil fuel use.
Waste is a significant renewable energy resource whose energy value can be exploited through thermal processes such as incineration and industrial co-combustion, utilisation of landfill gas and use of anaerobic digester biogas. In 2006 post consumer waste provided more than 1400 PJ worldwide, which would be sufficient to supply electricity to some 140 million average European consumers (100 GJ per annum).
Waste enjoys an economic advantage over many biomass resources because it is regularly collected at public expense, via an established infrastructure, by an industry experienced with transporting, handling, and processing diverse solid waste streams. Modern waste-to-energy and landfill gas recovery technologies are mature, protective of human health and the environment and have been successfully applied in many countries.
Commercial scale landfill gas recovery and utilisation directly reduce the largest single source of GHG emissions from waste, approximately 50% of the 2004 – 05 waste sector emissions under IPCC national inventory reporting (Bogner et al. 2007). Many sites now use horizontal collectors installed concurrently with landfilling so that gas extraction can begin before sites reach final grade.
In 2005, total energy consumption worldwide was 500,000 Petajoules, and only 10% was derived from renewable resources (EIA 2006). New policies, measures and economic incentives, if established now, could substantially increase the role of waste sources in the global energy mix to offset more fossil fuel use. Indeed, figures suggest that by 2030 global waste derived energy could supply the average energy consumption for 130 million European consumers (EU27) (web ref, 1).
The heating value of mixed municipal waste ranges from 6 to 14 MJ kg-1 (Khan and Abu-Ghararath, 1991; EIPPC Bureau, 2006; Bogner et al., 2007). Thermal processes are most effective at the upper end of this range where high values approach low-grade coals (lignite). Using a conservative value of 900 Mt yr-1 for total global post-consumer/municipal waste generation in 2002 and assuming an average heating value of 9 GJ t-1 for mixed waste (Dornburg and Faaij, 2006) and converting to energy equivalents, global waste in 2002 contained about 8,000 PJ of available energy, which could increase to 13,000 PJ in 2030 using waste projections in Monni et al. (2006).
Figure 1. Global energy (Petajoules. PJ) from waste 1990-2006 (IEA, 2009). Biogas includes landfill gas and anaerobic digester biogas. Based on national data reported to IEA from OECD and non-OECD countries. Note: incomplete data from non-OECD countries; thus these are minimum values.
Waste-to-energy and industrial co-combustion
Globally, more than 130 million tonnes of waste are incinerated every year at over 600 waste-to-energy plants (Themelis, 2003; IEA, 2009), which is equivalent to over 1000PJ of electricity per annum (assuming 9 GJ t-1). The total energy content of waste is most efficiently exploited using thermal processes (Fig. 2). During combustion, energy is directly derived from both biomass (paper products, wood, natural textiles and food) and from fossil carbon sources (plastics, or synthetic textiles).
In some cases recovered paper and other waste materials are reformulated into a refuse-derived fuel (RDF) which can be co-combusted with other fuels. In countries which have a long, successful history of waste incineration for district heating and electrical generation, direct waste-to-energy processes can make a considerable contribution to the national energy mix. In Denmark, waste incineration provides 4.2% of total current energy consumption, including
MSW incinerator in Vienna, Austria: an
urban work of art
01985 1985
200
400
600
800
1000
1200
1400
1600
1985 1985 1985 1985
Total
Biogas
Municipalwaste
Industrial waste
17014 ISWA White Paper.indd 19 26/11/09 20:45:18
194.5% electrical production and 20% of the heat for district heating (web ref, 1).
While thermal processes with advanced emission controls are proven technology, they are more costly than controlled landfill with gas recovery. However, as energy prices rise, waste-to-energy may become more economically viable. Because landfills produce methane for decades, thermal processes, composting and other strategies that reduce landfilled waste are complementary mitigation measures to landfill gas recovery in the short- to medium-term.
Biogas from waste: landfill gas and anaerobic digester biogas
Landfill and digester gas contain approximately equal amounts of methane and carbon dioxide, with a heating value of 16–22 MJ Nm-3, depending directly on the methane content (Figures 3 and 4). Both technologies are used worldwide for process heating and on-site electrical generation. Landfill gas may also be upgraded to a substitute natural gas or compressed natural gas (CNG) by removal of carbon dioxide and trace components; this is more economically attractive when natural gas prices are high and stable.
In 2008 landfill gas utilisation projects in the US alone offset 84.3 Mt CO2 eq, which is equivalent to the emissions from 15.5 million passenger vehicles (web ref. 2). Therefore, although more recent global data compilations are not available, it is likely that the current global total exceeds 200 Mt CO2-eq yr-1, including a number of Clean Development Mechanism (CDM) projects in developing countries. As of July, 2009, the CDM Executive Board had issued 6.4 MtCO2-eq of Certified Emission Reductions (CER) for landfill gas CDM projects (web ref. 3). For further information see CDM page 20.
Trends and the Role of Recycling & Waste Minimisation
Thanks to landfill gas recovery and complementary measures including increased recycling, decreased landfilling and the use of alternative waste management technologies, landfill CH4 emissions from developed countries have been largely stabilised. However, landfill CH4 emissions from developing countries are increasing, as more controlled (anaerobic) land-filling practices are implemented. These emissions
could be reduced by accelerating the introduction of engineered gas recovery and by encouraging alternative waste management strategies.
In addition to the direct use of energy from waste, recycling, re-use and waste minimisation represent an important and increasing potential for indirect reduction of GHG emissions through the conservation of raw materials, improved energy efficiency, and fossil fuel avoidance.
Incentives: increasing the use of waste as a renewable energy resource
Waste-to-energy should continue to be included among government and private sector incentives and targets as a cost-effective way to increase the role of renewables within the mix of local energy systems. Many countries have implemented financial incentives such as feed in tariffs, renewable energy certificates, tax credits or subsidies to encourage electricity generation from renewable sources. In addition, “green energy” mandates, regulations, carbon taxes and other instruments can increase the use of waste and landfill gas/biogas for both electricity generation and direct fuel use in commercial and industrial applications as well as district heating and cooling.
Recommendations• The use of technologies to recover energy
and materials from waste should be further exploited, including direct use (incineration; landfill gas recovery and utilisation and use of digester gas) and indirect avoidance of fossil fuels and virgin materials (recycling, re-use, waste minimisation).
• Additional policies and measures should be encouraged to increase the role of waste sources in the global energy mix, including renewable energy mandates, taxes, and economic incentives.
ISWA commitments• ISWA supports public and private incentives and
mandates to increase the use of energy-to-waste.
• ISWA commits to promoting waste as a renewable energy source to government authorities, agencies and other stakeholders through facilitation, outreach and education and training activities.
01985 1985
200
400
600
800
1000
1200
1400
1600
1985 1985 1985 1985
Total
Biogas
Municipalwaste
Industrial waste
17014 ISWA White Paper.indd 20 26/11/09 20:52:49
Clean Development Mechanism
20
Highlights• The Clean Development Mechanism (CDM) has
been successfully implemented with over 1800 projects registered, and many more in the pipeline. The waste sector is well represented, accounting for 18% of the registered projects.
• Waste projects currently registered as CDM are on track to deliver 209 million carbon credits by the end of 2012. (One carbon credit corresponds to an emission reduction of one tonne of CO2 equivalent.)
• The revenues from the sale of emissions credits can contribute to the advancement of environmentally sound waste management practices.
• Although significant progress has been made on the CDM since its inception, improvements in the approval process could lead to a much greater number and a better geographical distribution of implemented emission reduction projects.
• There is unrealised CDM potential within the waste sector, in terms of technology solutions as well as host country coverage.
The Clean Development Mechanism is one of the project-based flexible mechanisms established under the Kyoto Protocol to attract investment in GHG reduction projects that would not otherwise be funded in the near-term. CDM enables countries (or entities within countries) that have agreed to GHG emission reductions under the Protocol to invest in emission reduction projects in developing countries and to use the associated emission reduction credits towards achieving their own targets as a supplement to their domestic GHG reduction actions.
A significant percentage of the waste generated in developing countries ends up in uncontrolled landfills or illegal dumpsites. This situation presents obvious environmental and health concerns. By implementing proven waste management technologies, developing countries can improve the public health and environment, while also achieving reduced GHG emissions. Unfortunately, despite the major benefits that can be realised from improvements in the waste management infrastructure in developing countries, financial and institutional barriers often inhibit their implementation.
The CDM can be applied to solid waste management activities and can help to overcome some of the development barriers. The revenues from the sale of emissions credits can contribute to the advancement of environmentally sound waste management practices.
The waste sector is now well represented amongst the registered CDM projects. As of October 2009, 18% of the 1834 registered CDM projects are waste sector projects (UNFCCC website – CDM section). These include solid waste project activities, (landfill gas recovery, composting, and incineration) as well as methane avoidance technologies (composting, anaerobic and aerobic treatment) for waste water, agricultural and forestry waste. 138 of the 407 registered waste projects are municipal solid waste projects, herein after referred to as “solid waste” projects (CD4CDM CDM Pipeline – November 2009).
The United Nations has set up a governing body to oversee the CDM (the CDM Executive Board (CDM EB)). This body has established the procedure for project approvals and issuing credits. In order to submit a project for registration, a project design document (PDD) must be prepared in accordance with a reference baseline and monitoring methodology that has been approved by the CDM EB.
To date, the CDM EB has approved 7 large-scale and 6 small-scale methodologies which apply to solid waste activities, including landfill gas (LFG) capture and flaring, LFG recovery, composting, waste to energy, anaerobic digestion and refuse derived fuels (CD4CDM CDM Pipeline – November 2009).
Technology diversification
Nearly 90% of the registered solid waste projects are related to landfill gas flaring and recovery. Thanks to strong emission reduction potential, particularly with regard to the potent GHG methane, coupled with relatively low abatement costs, these projects have attracted attention from a broad range of project developers in comparison with other technologies.
By contrast, only a limited number of large scale projects have been registered involving advanced MSW treatment technologies such as large scale composting, gasification, anaerobic digestion or refuse derived fuel (RDF) processing and thermal treatment without incineration. Some of the reasons for this are:
17014 ISWA White Paper.indd 21 26/11/09 20:45:23
Clean Development Mechanism 21• As most of these projects concern new
installations, they require significant planning and stakeholder approval;
• Advanced technologies are necessarily more complex and require higher capital and operating costs than landfilling and small-scale composting;
• There is a lack of management capable of handling these technologies within these communities;
• The selected technology must be adapted to the local waste characteristics;
• It is essential to have established markets for by-products (compost, recovered material and energy).
In addition, all of these causes are compounded by uncertainty on the future of carbon finance beyond the first compliance period of the Kyoto Protocol (the end of 2012).
Geographical distribution
In common with other industrial sectors, CDM projects in the waste management sector are so far unevenly distributed and have generally not yet benefited the Least Developed Countries (LDCs).
Solid waste CDM projects in the pipeline are distributed mostly between Asia/Pacific and Latin America; respectively 44% and 42% of the total (October 2009). In Asia, the highest number of projects is in China with India following in second position. In Latin America, Brazil and Mexico represent the majority share. Other regions are poorly represented. For example, Africa and the Middle East account for just 7% and 5% of the total number of projects, respectively (CD4CDM CDM Pipeline – October 2009).
This subject of geographic distribution of CDM is receiving much attention from the CDM EB and a number of international stakeholders. Efforts must continue to achieve a better distribution of projects and to improve access to CDM within these host countries.
Concerns with the approval process
Although significant progress has been made on the CDM since its inception, there is still room for improvement in the current system. A number of issues have been raised with regard to the CDM approval process and delays in obtaining registration or credits.
Some of the key barriers limiting efficiency and causing delays in the CDM approval process are:
• Lack of available Designated Operational Entities (DOEs) resource for the validations and verifications, due to the significant number of projects being initiated;
• Constantly evolving rules and guidance, giving rise to diverging interpretations of methodology requirements amongst the project participants, the DOEs and the CDM EB;
• The application time for evolving methodologies and guidance is not always compatible with the timeline for advancing through the different approval steps;
• Increasing CDM EB scrutiny of projects following their submission for registration or credit issue. The CDM EB has requested a significant number of reviews of projects which have been validated or verified;
• Limited access for the Project Participants to communicate directly with the CDM EB on decisions, requests for review, or clarifications. It is necessary to wait for official comments from the CDM EB and often their exact concerns are unclear from the provided text of reviews or decisions.
The CDM EB has been working on a number of initiatives intended to improve process efficiency while maintaining its integrity. The review of possible improvements is in progress and should be presented in the COP15 meeting in Copenhagen in December 2009.
17014 ISWA White Paper.indd 22 26/11/09 20:45:24
22
In order to progress in alignment with the CDM EB’s initiatives towards technology diversification, broader geographical distribution and streamlining of the approval process, ISWA proposes the following measures:
1. The post-2012 compliance period should be greater than the current period of 5 years to allow greater certainty for financial investments in the emission reduction projects.
An increased compliance period (10 years) would provide clarity for project developers and would allow for the development of CDM projects based on more capital intensive, advanced technologies. This would lead to a diversification of the waste sector’s project portfolio.
2. New CDM methodologies should be developed to cover a broader range of waste project types.
Although there are a number of approved waste methodologies available today, they do not address the full range of possible GHG emission reduction or avoidance benefits that waste management activities can bring. Currently there are no approved methodologies covering materials recovery activities, which could offer significant resource savings and subsequent GHG reduction.
For example, recycling avoids the emissions caused by the use of virgin materials, and composting offers a substitute for chemical fertilisers and peat-based soil conditioners as well as binding carbon in soil. Efforts should be made to develop sound methodologies to quantify the associated avoided emissions using an integrated value chain (upstream/downstream) approach rather than a purely geographical (site-based) approach.
It is essential that new methodologies addressing material recovery take into account the informal recycling activities operating in many developing countries. As far as possible, existing structures should be integrated into the project activity in a sensible way which leads to improved environmental, social and sanitary conditions.
3. The establishment of standardised baseline and additionality benchmarks by host countries could facilitate the development of waste sector projects
In most of the countries that are candidates for CDM projects, and especially in LDCs, current waste management practices are often well below what is proposed under the waste-related project
activity. In addition, the environmental regulations requiring these waste technologies are absent or are not fully enforced.
In these cases, and for certain project types, the CDM EB should consider a “top down” or standardised approach to determining additionality. This would simplify the process, which can be very complex, mainly due to the fact that not all of the necessary information is available in the early stages of the project development.
If each host country defines the current status of their national waste management practice and regulations, this benchmark could serve as a baseline scenario for project developers. Any project activity implementing practices superior to that standard in terms of emissions reductions and sustainable development would be eligible for CDM consideration from an environmental additionality standpoint. This system of nationally established and reviewable benchmarks would enable a reform of procedures without reducing the credibility or effectiveness of the mechanism.
4. Modification of some items of the rules associated with the Programmatic CDM could lead to increased development of waste related projects, especially in LDCs.
In June 2007, the CDM EB launched the Programmatic CDM which allows project developers to register an unlimited number of project activities under a single Programme of Activities (PoA). The PoA is a coordinated action by a private or public entity to implement a policy or measure leading to GHG emission reductions, which would not have occurred without the programme. The PoA can be applied to an unlimited number of emission reduction project activities that are dispersed over a geographic area.
One of the objectives of the programmatic CDM was to attract developing countries that are currently under-represented in the existing project pipeline. In many of these countries the mitigation potential will come from small scale technologies and projects. By grouping smaller activities under a PoA, the transaction costs required for the design, validation, registration, monitoring and verification associated with the classic CDM project can be distributed and reduced.
The PoA can be applied to waste projects. A policy or initiative to improve waste management practices could be established on a national, regional or local level. The PoA could include
Clean Development Mechanism
17014 ISWA White Paper.indd 23 26/11/09 20:45:28
23activities such as landfill gas recovery, composting facilities or small scale anaerobic digesters.
Although there is much support for this concept, as many stakeholders have pointed out, in its current form, it is not easy to implement. To date, only two PoA have been registered. Two waste-related PoA, dealing with composting projects in Uganda, are currently in the validation stage (CD4CDM CDM Pipeline – October 2009).
The CDM EB has been working towards clarification and additional guidance on PoAs. Despite these efforts, some clauses are still extremely onerous, especially the clause assigning a heavy liability to Designated Operational Entities (DOEs) for errors associated with the improper inclusion of programme activities into a PoA.
The PoA rules should be modified to reduce the risk to project developers and DOEs. Further amendments that would help to simplify the PoA and facilitate its application to large and small-scale waste management projects should be encouraged.
The PoA concept has the potential to advance waste sector projects and increase the implementation of CDM projects in LDCs. With further improvements, the process could operate on a larger scale, while still maintaining the integrity of the CDM.
5. The project approval process should be streamlined in order to reduce project delays, costs and approval risks.
To overcome these concerns and make the critical approval steps more fluid, ISWA supports a post-2012 framework that takes the following suggestions on board:
• The number of accredited DOEs must be increased to adequately cover existing and future projects.
• The frequency of methodology revisions could be reduced and / or the applicability period of the pre-existing methodology extended.
• The CDM EB must place greater reliance on the DOEs during the validation and verification of projects. This can be accomplished with increased audits of approved DOEs by the CDM EB Audit Body. Conducting complete project reviews at the CDM EB and Secretariat level is not sustainable if the project flow is to be optimised.
• The number of requests for review could certainly be reduced through better upfront dialogue between the CDM EB, the project developers, and the DOEs. The efficiency of the approval process could be further improved by increased access for project developers to the CDM EB on project issues and evolution of the rules.
• As is the case in most regulatory systems, an appeals process should be made available for project developers to challenge decisions taken by the CDM EB.
ISWA supports the structural and administrative modifications recently recommended by the CDM EB and Secretariat to improve efficiency and project flow.
Joint Implementation (JI)
The second project-based flexible mechanism is the Joint Implementation (JI) process. The JI allows countries (or entities in countries) that have also agreed to emission reduction under the Kyoto Protocol to invest in projects in another country with emission reduction commitments.
The potential for emissions savings through JI projects should not be underestimated, although it has so far had a much lower profile in terms of public exposure, number of projects developed and number of emissions reduction units issued.
Many countries have been slow to establish the procedures necessary to participate in the mechanism. However, despite the slow take-up to date, JI could have a critical role to play in driving emission reduction activities in the waste sector in countries with emission caps under the United Nations Framework Convention on Climate Change (UNFCCC).
ISWA welcomes further improvement and reform of this mechanism in the post 2012 international climate change framework.
As of November 2009, amongst the 73 registered JI projects, 19 are solid waste related. Most are based in Eastern Europe (Czech Republic: 8, Poland: 5, Hungary: 3; Ukraine: 1). The remaining two are located in New Zealand. These projects are either landfill flaring or landfill power projects (CD4CDM JI Pipeline – November 2009).
17014 ISWA White Paper.indd 24 26/11/09 20:45:29
24
Conclusions
The Kyoto project mechanisms are an effective means to transfer waste management technologies into developing countries and economies in transition. They also provide a range of environmental, social and economic benefits associated with improved waste management practices: GHG emissions reduction; prevention of water and soil contamination; conservation of natural resources and renewable energy benefits, as well as improved public health and job creation.
ISWA supports efforts to sustain the momentum that the CDM has created in several key emitting countries and to build upon this base over the next commitment period. ISWA also believes it is possible to draw upon the lessons learned from CDM activities so far in order to improve existing mechanisms so that they be extended to more countries and waste management technologies in the future.
Recommendations• CDM methodologies should be developed
for currently unrepresented waste project activities such as recycling and composting.
• The additionality demonstration required for CDM projects could be simplified through standardised sector benchmarks, defined by the host countries.
• Continued efforts should be made to permit the PoA to operate on a larger scale while maintaining the necessary integrity of the CDM.
• There are a number of recommendations which could streamline CDM approval processes detailed in the section above; increasing the number of trained DOEs, reducing bureaucracy and improving communication between project developers and CMD EB.
ISWA commitments• ISWA, working alongside other associations
and stakeholders, will contribute to the on-going debate on how to improve the CDM in a post-2012 system.
• ISWA will provide support and tools to its members concerning the development of waste related emission reduction projects.
• ISWA will collaborate with other associations and agencies on capacity building to raise awareness of the potential for CDM waste projects and their associated sustainable development benefits.
Clean Development Mechanism
17014 ISWA White Paper.indd 25 26/11/09 20:45:35
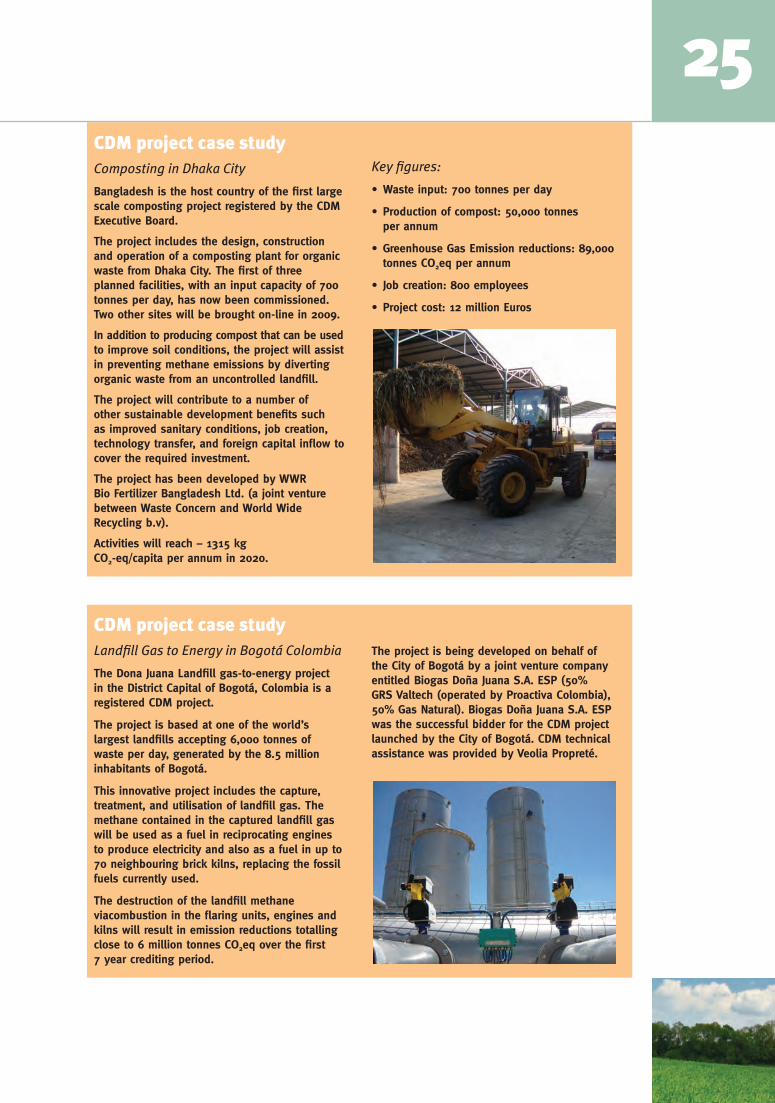
25CDM project case studyComposting in Dhaka City
Bangladesh is the host country of the first large scale composting project registered by the CDM Executive Board.
The project includes the design, construction and operation of a composting plant for organic waste from Dhaka City. The first of three planned facilities, with an input capacity of 700 tonnes per day, has now been commissioned. Two other sites will be brought on-line in 2009.
In addition to producing compost that can be used to improve soil conditions, the project will assist in preventing methane emissions by diverting organic waste from an uncontrolled landfill.
The project will contribute to a number of other sustainable development benefits such as improved sanitary conditions, job creation, technology transfer, and foreign capital inflow to cover the required investment.
The project has been developed by WWR Bio Fertilizer Bangladesh Ltd. (a joint venture between Waste Concern and World Wide Recycling b.v).
Activities will reach – 1315 kg CO2-eq/capita per annum in 2020.
Key figures:
• Waste input: 700 tonnes per day
• Production of compost: 50,000 tonnes per annum
• Greenhouse Gas Emission reductions: 89,000 tonnes CO2eq per annum
• Job creation: 800 employees
• Project cost: 12 million Euros
CDM project case studyLandfill Gas to Energy in Bogotá Colombia
The Dona Juana Landfill gas-to-energy project in the District Capital of Bogotá, Colombia is a registered CDM project.
The project is based at one of the world’s largest landfills accepting 6,000 tonnes of waste per day, generated by the 8.5 million inhabitants of Bogotá.
This innovative project includes the capture, treatment, and utilisation of landfill gas. The methane contained in the captured landfill gas will be used as a fuel in reciprocating engines to produce electricity and also as a fuel in up to 70 neighbouring brick kilns, replacing the fossil fuels currently used.
The destruction of the landfill methane viacombustion in the flaring units, engines and kilns will result in emission reductions totalling close to 6 million tonnes CO2eq over the first 7 year crediting period.
The project is being developed on behalf of the City of Bogotá by a joint venture company entitled Biogas Doña Juana S.A. ESP (50% GRS Valtech (operated by Proactiva Colombia), 50% Gas Natural). Biogas Doña Juana S.A. ESP was the successful bidder for the CDM project launched by the City of Bogotá. CDM technical assistance was provided by Veolia Propreté.
17014 ISWA White Paper.indd 26 26/11/09 20:45:38
26
Highlights• Waste policies and regulations containing
precise long-term and intermediate targets for better handling of waste are important drivers for the reduction of GHG emissions.
• Where implemented, such waste management policies and regulations can create significant GHG emission reductions.
• Each country and city has a unique starting point in terms of waste composition, waste technologies and infrastructure, climate conditions, and economic means to enact adequate policy and regulation frameworks.
When waste policies and regulations began to be introduced around the world circa 100 years ago, they were initially aimed at securing hygienic urban living and later at protecting the soil, water and air from pollution.
This approach has undergone a paradigm shift over the last 10 to 20 years, as waste has increasingly come to be regarded as a secondary material and an energy source. A new raft of legislative instruments has greatly influenced the part waste management now plays in reducing GHG emissions by promoting and directing cleaner, more efficient waste systems; as shown in Table 1.
Policy and regulation
Actions related to Examples of policy and regulation instruments
Waste generation and collection Producer responsibility “Full cost” collection tariffs Separate collection schemes for specific waste types
Material recycling sector Strategies and precise targets for recycling of specific waste streamsProducer responsibilityLandfill taxTax exemptions for recyclable materialsGreen Public Procurement to stimulate demand for recycled products
Incineration and anaerobic digestion sector
Co-ordination with energy planningSubsidies for constructionLandfill ban of biodegradable wasteSecure sufficient waste to the plantsTax exemptions for energy generatedEmissions limitations
Landfill sector Strategies for phasing out old landfillsLandfill ban on biodegradable waste or untreated wasteHigh technical standards in general and especially for performance to reduce GHG emissions by capture and utilisation of the energyLandfill tax
However, despite a growing understanding that waste management is an important sector to be included when considering reduced GHG emissions, preparation of comprehensive and consistent policies is still in the emerging phase. This can be demonstrated by a few examples from different regions and development.
A European example
Policies and regulations
The EU has introduced comprehensive policies and regulations regarding waste management. The experiences from this region are interesting because the development has been documented over several decades and over an entire continent, including countries with different socio-economic and infrastructural backgrounds.
Until 1990, EU waste policies focused on limiting the amount of waste going to landfills and prioritising recycling of waste, but only in general terms and without binding obligations. The binding parts were only administrative; such as requiring member states to make waste management plans and requiring producers as well as collection and treatment operators to obtain operation permits and maintain records of waste quantities (EU, 1975).
Binding targets were introduced after 1990 for recycling and recovery as well as for the reduction of biodegradable municipal waste sent to landfills.
Table 1: Examples of waste policy and regulation for the reduction of GHG emissions
17014 ISWA White Paper.indd 27 26/11/09 20:45:39
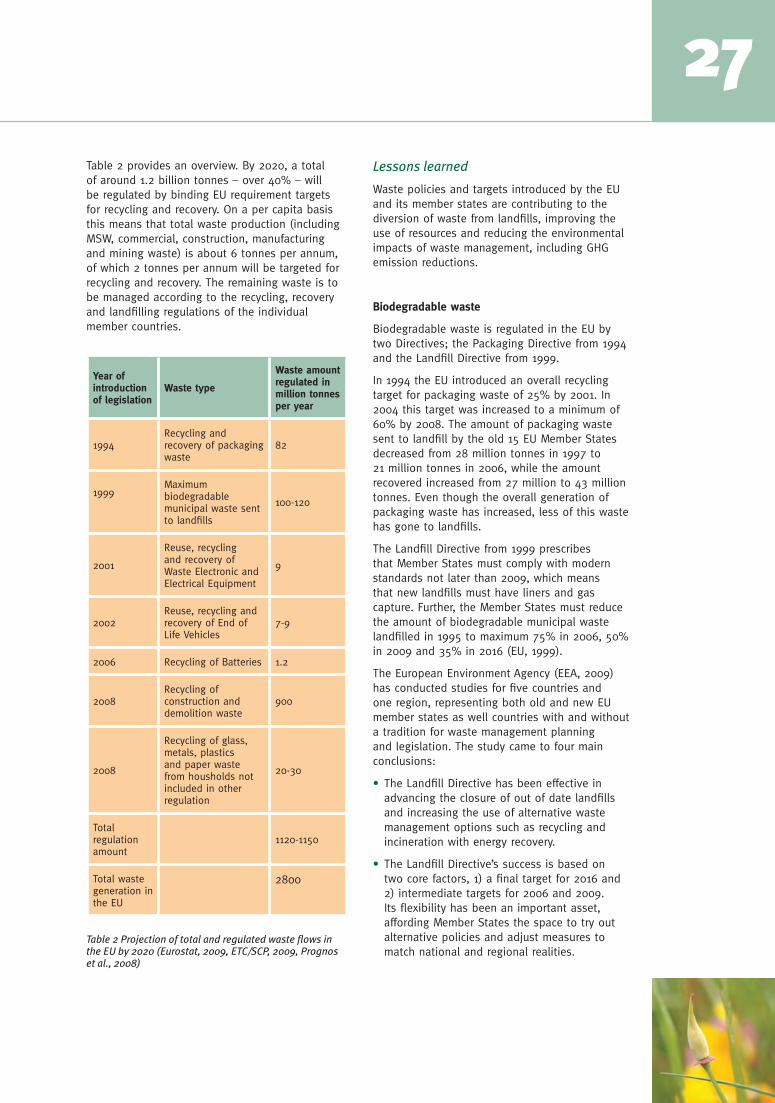
27Table 2 provides an overview. By 2020, a total of around 1.2 billion tonnes – over 40% – will be regulated by binding EU requirement targets for recycling and recovery. On a per capita basis this means that total waste production (including MSW, commercial, construction, manufacturing and mining waste) is about 6 tonnes per annum, of which 2 tonnes per annum will be targeted for recycling and recovery. The remaining waste is to be managed according to the recycling, recovery and landfilling regulations of the individual member countries.
Year of introduction of legislation
Waste type
Waste amount regulated in million tonnes per year
1994Recycling and recovery of packaging waste
82
1999Maximum biodegradable municipal waste sent to landfills
100-120
2001
Reuse, recycling and recovery of Waste Electronic and Electrical Equipment
9
2002Reuse, recycling and recovery of End of Life Vehicles
7-9
2006 Recycling of Batteries 1.2
2008Recycling of construction and demolition waste
900
2008
Recycling of glass, metals, plastics and paper waste from housholds not included in other regulation
20-30
Total regulation amount
1120-1150
Total waste generation in the EU
2800
Table 2 Projection of total and regulated waste flows in the EU by 2020 (Eurostat, 2009, ETC/SCP, 2009, Prognos et al., 2008)
Lessons learned
Waste policies and targets introduced by the EU and its member states are contributing to the diversion of waste from landfills, improving the use of resources and reducing the environmental impacts of waste management, including GHG emission reductions.
Biodegradable waste
Biodegradable waste is regulated in the EU by two Directives; the Packaging Directive from 1994 and the Landfill Directive from 1999.
In 1994 the EU introduced an overall recycling target for packaging waste of 25% by 2001. In 2004 this target was increased to a minimum of 60% by 2008. The amount of packaging waste sent to landfill by the old 15 EU Member States decreased from 28 million tonnes in 1997 to 21 million tonnes in 2006, while the amount recovered increased from 27 million to 43 million tonnes. Even though the overall generation of packaging waste has increased, less of this waste has gone to landfills.
The Landfill Directive from 1999 prescribes that Member States must comply with modern standards not later than 2009, which means that new landfills must have liners and gas capture. Further, the Member States must reduce the amount of biodegradable municipal waste landfilled in 1995 to maximum 75% in 2006, 50% in 2009 and 35% in 2016 (EU, 1999).
The European Environment Agency (EEA, 2009) has conducted studies for five countries and one region, representing both old and new EU member states as well countries with and without a tradition for waste management planning and legislation. The study came to four main conclusions:
• The Landfill Directive has been effective in advancing the closure of out of date landfills and increasing the use of alternative waste management options such as recycling and incineration with energy recovery.
• The Landfill Directive’s success is based on two core factors, 1) a final target for 2016 and 2) intermediate targets for 2006 and 2009. Its flexibility has been an important asset, affording Member States the space to try out alternative policies and adjust measures to match national and regional realities.
17014 ISWA White Paper.indd 28 26/11/09 20:45:42
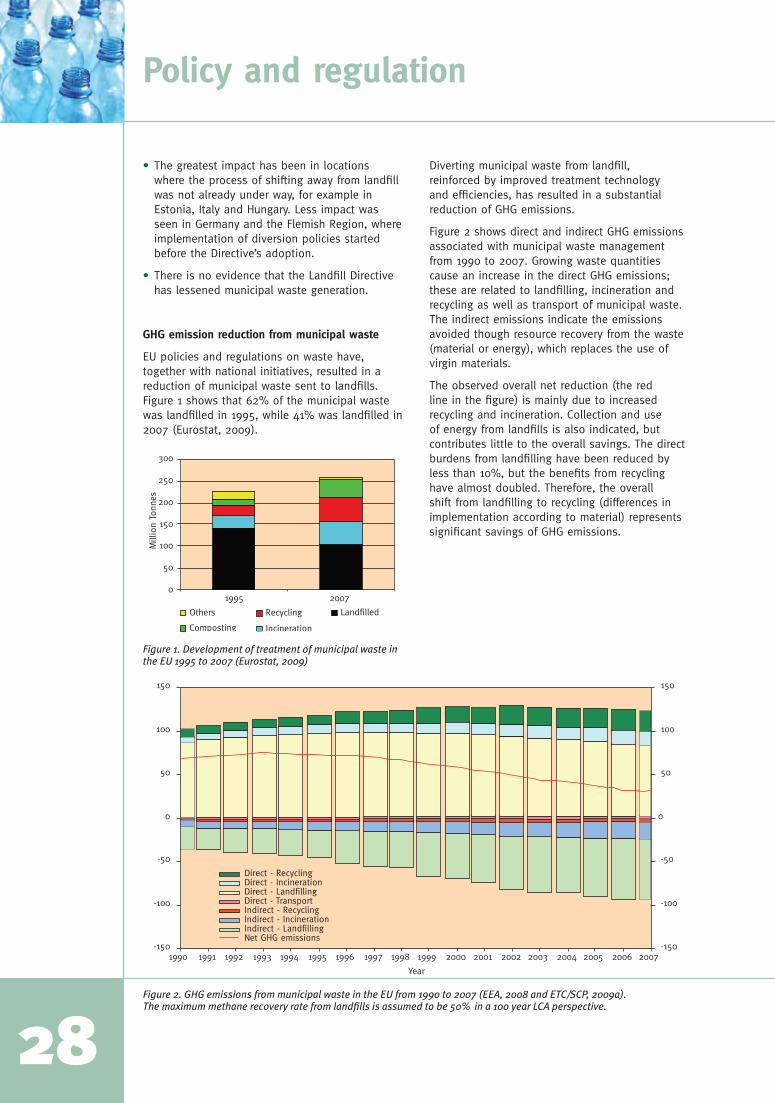
28
• The greatest impact has been in locations where the process of shifting away from landfill was not already under way, for example in Estonia, Italy and Hungary. Less impact was seen in Germany and the Flemish Region, where implementation of diversion policies started before the Directive’s adoption.
• There is no evidence that the Landfill Directive has lessened municipal waste generation.
GHG emission reduction from municipal waste
EU policies and regulations on waste have, together with national initiatives, resulted in a reduction of municipal waste sent to landfills. Figure 1 shows that 62% of the municipal waste was landfilled in 1995, while 41% was landfilled in 2007 (Eurostat, 2009).
Figure 1. Development of treatment of municipal waste in the EU 1995 to 2007 (Eurostat, 2009)
Figure 2. GHG emissions from municipal waste in the EU from 1990 to 2007 (EEA, 2008 and ETC/SCP, 2009a). The maximum methane recovery rate from landfills is assumed to be 50% in a 100 year LCA perspective.
Policy and regulation
150
100
50
0 0
-50
-100
-15019911990
150
100
50
-50
-100
-150
Year
1992 1993 1994 1995 1996 1997 1998 1999 2000 2001 2002 2003 2004 2005 2006 2007
Direct - RecyclingDirect - IncinerationDirect - LandfillingDirect - TransportIndirect - RecyclingIndirect - IncinerationIndirect - LandfillingNet GHG emissions
300
Others
250
200
150
100
50
01995 2007
Composting
Recycling
Incineration
Mill
ion
Tonn
es
Landfilled
Diverting municipal waste from landfill, reinforced by improved treatment technology and efficiencies, has resulted in a substantial reduction of GHG emissions.
Figure 2 shows direct and indirect GHG emissions associated with municipal waste management from 1990 to 2007. Growing waste quantities cause an increase in the direct GHG emissions; these are related to landfilling, incineration and recycling as well as transport of municipal waste. The indirect emissions indicate the emissions avoided though resource recovery from the waste (material or energy), which replaces the use of virgin materials.
The observed overall net reduction (the red line in the figure) is mainly due to increased recycling and incineration. Collection and use of energy from landfills is also indicated, but contributes little to the overall savings. The direct burdens from landfilling have been reduced by less than 10%, but the benefits from recycling have almost doubled. Therefore, the overall shift from landfilling to recycling (differences in implementation according to material) represents significant savings of GHG emissions.
17014 ISWA White Paper.indd 29 26/11/09 20:45:45
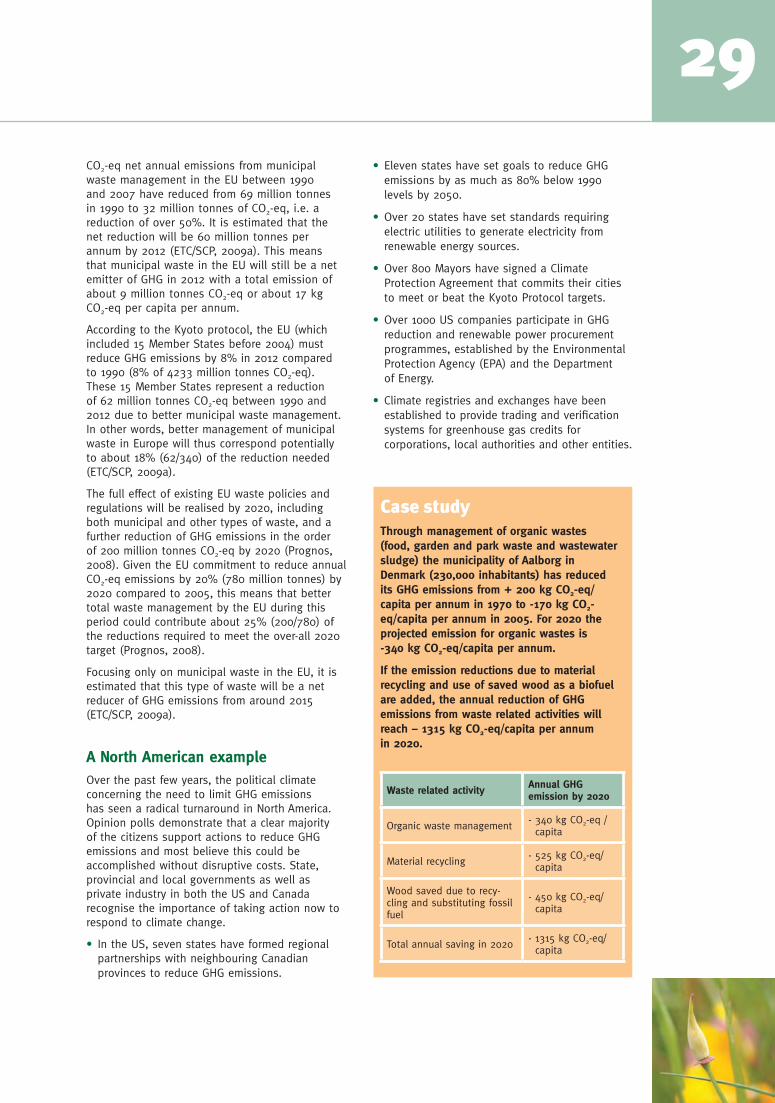
29CO2-eq net annual emissions from municipal waste management in the EU between 1990 and 2007 have reduced from 69 million tonnes in 1990 to 32 million tonnes of CO2-eq, i.e. a reduction of over 50%. It is estimated that the net reduction will be 60 million tonnes per annum by 2012 (ETC/SCP, 2009a). This means that municipal waste in the EU will still be a net emitter of GHG in 2012 with a total emission of about 9 million tonnes CO2-eq or about 17 kg CO2-eq per capita per annum.
According to the Kyoto protocol, the EU (which included 15 Member States before 2004) must reduce GHG emissions by 8% in 2012 compared to 1990 (8% of 4233 million tonnes CO2-eq). These 15 Member States represent a reduction of 62 million tonnes CO2-eq between 1990 and 2012 due to better municipal waste management. In other words, better management of municipal waste in Europe will thus correspond potentially to about 18% (62/340) of the reduction needed (ETC/SCP, 2009a).
The full effect of existing EU waste policies and regulations will be realised by 2020, including both municipal and other types of waste, and a further reduction of GHG emissions in the order of 200 million tonnes CO2-eq by 2020 (Prognos, 2008). Given the EU commitment to reduce annual CO2-eq emissions by 20% (780 million tonnes) by 2020 compared to 2005, this means that better total waste management by the EU during this period could contribute about 25% (200/780) of the reductions required to meet the over-all 2020 target (Prognos, 2008).
Focusing only on municipal waste in the EU, it is estimated that this type of waste will be a net reducer of GHG emissions from around 2015 (ETC/SCP, 2009a).
A North American exampleOver the past few years, the political climate concerning the need to limit GHG emissions has seen a radical turnaround in North America. Opinion polls demonstrate that a clear majority of the citizens support actions to reduce GHG emissions and most believe this could be accomplished without disruptive costs. State, provincial and local governments as well as private industry in both the US and Canada recognise the importance of taking action now to respond to climate change.
• In the US, seven states have formed regional partnerships with neighbouring Canadian provinces to reduce GHG emissions.
• Eleven states have set goals to reduce GHG emissions by as much as 80% below 1990 levels by 2050.
• Over 20 states have set standards requiring electric utilities to generate electricity from renewable energy sources.
• Over 800 Mayors have signed a Climate Protection Agreement that commits their cities to meet or beat the Kyoto Protocol targets.
• Over 1000 US companies participate in GHG reduction and renewable power procurement programmes, established by the Environmental Protection Agency (EPA) and the Department of Energy.
• Climate registries and exchanges have been established to provide trading and verification systems for greenhouse gas credits for corporations, local authorities and other entities.
Case studyThrough management of organic wastes (food, garden and park waste and wastewater sludge) the municipality of Aalborg in Denmark (230,000 inhabitants) has reduced its GHG emissions from + 200 kg CO2-eq/capita per annum in 1970 to -170 kg CO2-eq/capita per annum in 2005. For 2020 the projected emission for organic wastes is -340 kg CO2-eq/capita per annum.
If the emission reductions due to material recycling and use of saved wood as a biofuel are added, the annual reduction of GHG emissions from waste related activities will reach – 1315 kg CO2-eq/capita per annum in 2020.
Waste related activity Annual GHG emission by 2020
Organic waste management - 340 kg CO2-eq /capita
Material recycling - 525 kg CO2-eq/capita
Wood saved due to recy-cling and substituting fossil fuel
- 450 kg CO2-eq/capita
Total annual saving in 2020 - 1315 kg CO2-eq/capita
17014 ISWA White Paper.indd 30 26/11/09 20:45:48

1230
• In May, the U.S. House of Representatives passed the American Clean Energy and Security Act. This bill contains a “cap and trade” programme to reduce carbon emissions. Emissions from major US sources would be capped at 17% below 2005 levels by 2020 and at 80% below 2005 levels by 2050. The bill would also establish a renewable portfolio standard that would require electric utilities to meet 20% of their electricity demand through renewable energy sources and energy efficiency by 2020.
Energy derived from landfill gas would qualify as a source under the renewable portfolio standard, but would not be included under the carbon emissions cap. Some landfill methane destruction projects would be tradable emission offsets.
The renewable portfolio standard also includes waste-to-energy as an eligible renewable source and these facilities would not be regulated under the cap, thanks to a provision in the bill which specifically excludes operations which derive 95% or more of their energy from municipal solid waste.
These developments will have significant implications for solid waste management programs across North America and will create new opportunities for improved solid waste management practices to become part of the solution, through waste reduction, energy-efficient recycling, sustainable composting and recovery of renewable energy from solid waste.
Policy and regulation
New Federal policy initiatives in the US
In addition to these substantial efforts by private industries and state, provincial and local administrations, the level of activity by the Federal government has increased dramatically in the US following the inauguration of the new US President in 2009, supported by a Democratic majority in both Houses of Congress.
In a very short period of time the new administration and reconstituted Congress have issued some very far reaching and significant legislative proposals to redirect US policy regarding climate change and energy. The pace of regulatory activity in this area is unprecedented.
• In February, the U.S. President signed into law the American Recovery and Reinvestment Act of 2009, a $789 billion stimulus bill, which extended tax credits for electricity produced from renewable sources including landfill gas and waste-to-energy and allocated several billion dollars for energy efficiency and conservation grants for activities such as recycling.
• In October, the US EPA issued a final regulation requiring mandatory reporting of GHG emissions from sources including landfills and waste-to-energy facilities. The rule requires facilities that emit over 25,000 tonnes CO2-eq per annum to monitor their emissions and submit annual reports to the EPA from 2010. Approximately 85-90% of total national US GHG emissions, from approximately 13,000 facilities, will be covered by this rule.
17014 ISWA White Paper.indd 31 26/11/09 20:45:52
1331Strategies for GHG emission reduction through improved solid waste management
There are a number of opportunities for reduction of GHG emissions: through recovery and utilisation of landfill methane as a renewable fuel; recovery of energy from solid waste and waste reduction and through recycling and composting, see U.S. EPA (2006) and Skinner (2007 and 2009). All across North America solid waste managers are working to apply advanced waste management practices to offset global warming trends.
• Recovery and Use of Landfill Gas as a Renewable Fuel Currently, there are over 425 operational landfill gas-to-energy projects in the US which create 1,180 megawatts (MW) of electricity and produce 235 million metric standard cubic feet per day (MMSCFD) of renewable fuel. However, there are many more landfills in North America that have the potential to capture and utilise landfill gas.
The EPA has identified 570 candidate landfills that have the potential for landfill gas-to-energy projects, representing 1,370 MW of energy or 695 MMSCFD of fuel. Thus, the capture and utilisation of LFG could achieve very significant national reductions in GHG emissions.
• Waste-to-Energy and Conversion Technologies Currently, there are 89 waste-to-energy facilities in the United States that dispose of 90,000 tons of solid waste a day, and produce 2,700 MW of electricity (enough electricity to supply 2.3 million homes) IWSA (2007). Waste-to-energy has a long history of being a reliable energy source in North America; existing facilities are expanding capacities and several new facilities are being planned. There is significant interest in conversion technologies such as hydrolysis, anaerobic digestion, gasification and plasma arc which can convert solid wastes into industrial biochemicals and fuels, although most of these technologies have not yet progressed beyond the pilot stage.
• Waste Reduction, Recycling and Composting Waste reduction avoids GHG emissions associated with the production and use of a product and with subsequent waste management. Although it is very difficult to measure, the US EPA has estimated that 55 million tonnes of municipal solid waste were avoided through waste reduction activities (US EPA 2005).
For most materials waste reduction has lower GHG emissions than other waste management options, US EPA (2006.). Since the use of recycled materials is generally more energy efficient than the use of virgin materials, recycling of aluminum, steel, glass and other materials can reduce GHG emissions resulting from energy use.
Recycling of paper and composting of organic wastes such as garden waste and food waste can avoid landfill methane and have positive benefits from a GHG emissions perspective. In 2007, 85 million tonnes of materials were recycled from municipal solid waste in the US (including recycling through composting) achieving a total national recycling rate of 33.4%, (US EPA 2007).
Conclusions
Experience in North America has clearly demonstrated that leadership at the national level is essential to establish a legislative and regulatory framework which can control GHG emissions and drive solid waste management systems towards more sustainable, integrated solutions. Within that framework, solid waste managers can then select the appropriate services based on their environmental, economic and public priorities. A broad range of waste management options also allows market forces to play their part in reducing GHG emissions and increasing renewable energy use efficiently.
Policy makers in North America are putting in place the regulatory structure, and throughout the region the waste management sector is working to apply advanced practices to offset global warming trends.
17014 ISWA White Paper.indd 32 26/11/09 20:45:59
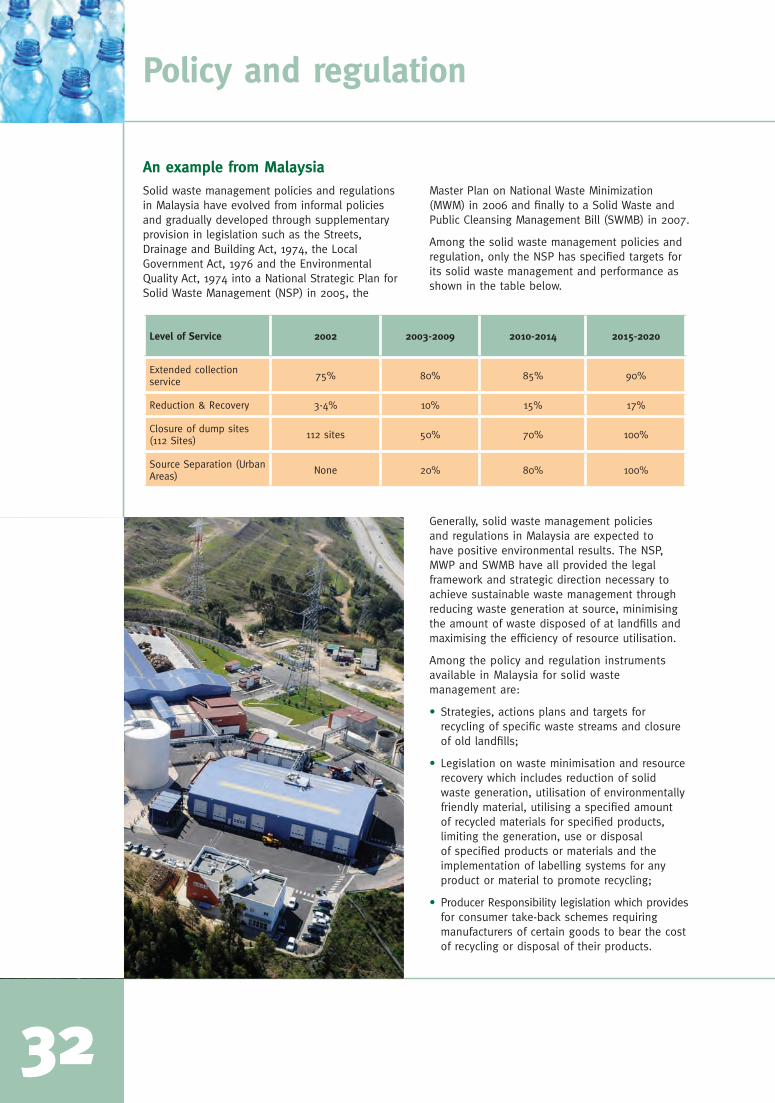
1232
An example from MalaysiaSolid waste management policies and regulations in Malaysia have evolved from informal policies and gradually developed through supplementary provision in legislation such as the Streets, Drainage and Building Act, 1974, the Local Government Act, 1976 and the Environmental Quality Act, 1974 into a National Strategic Plan for Solid Waste Management (NSP) in 2005, the
Master Plan on National Waste Minimization (MWM) in 2006 and finally to a Solid Waste and Public Cleansing Management Bill (SWMB) in 2007.
Among the solid waste management policies and regulation, only the NSP has specified targets for its solid waste management and performance as shown in the table below.
Policy and regulation
Generally, solid waste management policies and regulations in Malaysia are expected to have positive environmental results. The NSP, MWP and SWMB have all provided the legal framework and strategic direction necessary to achieve sustainable waste management through reducing waste generation at source, minimising the amount of waste disposed of at landfills and maximising the efficiency of resource utilisation.
Among the policy and regulation instruments available in Malaysia for solid waste management are:
• Strategies, actions plans and targets for recycling of specific waste streams and closure of old landfills;
• Legislation on waste minimisation and resource recovery which includes reduction of solid waste generation, utilisation of environmentally friendly material, utilising a specified amount of recycled materials for specified products, limiting the generation, use or disposal of specified products or materials and the implementation of labelling systems for any product or material to promote recycling;
• Producer Responsibility legislation which provides for consumer take-back schemes requiring manufacturers of certain goods to bear the cost of recycling or disposal of their products.
Level of Service 2002 2003-2009 2010-2014 2015-2020
Extended collection service 75% 80% 85% 90%
Reduction & Recovery 3-4% 10% 15% 17%
Closure of dump sites (112 Sites) 112 sites 50% 70% 100%
Source Separation (Urban Areas) None 20% 80% 100%
17014 ISWA White Paper.indd 33 26/11/09 20:46:02
The NSP includes a target of 17% waste reduction and recovery by 2020, which equates to around 2 million tonnes of solid waste each year. It also aims to close all existing dumps by 2020, which is expected to have a positive effect by controlling leachate discharge and methane emissions. A few years ago, there were 290 landfills in Malaysia of which only three were sanitary. By 2006, 114 were closed and 176 were operating. In 2009 it has been decided to rehabilitate 16 of these and introduce the capture of landfill gas.
Both the MWM and the SWMB promote waste reduction and resource recovery through a series of action plans, programmes and guidelines; on source separation, waste minimisation and safe closure of landfills.
However, solid waste management policies have only been formally adopted in Malaysia during the past 2 – 5 years (2005 – 2007) and therefore have yet to mature and produce the targeted outcomes. Currently, solid waste recycling rates are estimated to be about 5%; less than half the targeted recycling rate of 10% in 2009. This suggests that policies and regulations require time and specific targets to achieve results.
Impacts of polices and regulations on climate change
None of the legislation implemented in Malaysia specifies a direct requirement for GHG emission reduction. The main goal of the waste management sector in Malaysia is to establish the basic aspects of solid waste management as opposed to tackling climate change.
Malaysia’s solid waste management policy and regulation instruments can be considered relatively comprehensive and contain many of the elements found in other countries. Given time to mature and formulate and achieve specific targets, its waste policy is expected to have a positive impact on solid waste management and indirectly on climate change by providing the legal framework, strategic direction and implementation mechanism for sustainable waste management systems. In conclusion, GHG mitigation and climate change is so far not targeted directly in Malaysian waste management policy and regulation.
Recommendations• Governments at all levels should take note
of the fact that policies and regulations coupled with fixed targets are important drivers in achieving waste management goals, in terms of GHG mitigation as well as other environmental benefits.
• It is useful to analyse experiences from countries and regions such as Europe and the US in order to understand what it takes to implement new policies and regulations. The time necessary seems so far to be counted in a few decades rather than a few years.
ISWA commitments• ISWA, together with other international
institutions and in cooperation with national or regional centres of excellence, commits to offering workshops, courses and training on various aspects of developing and implementing waste related policies and regulations.
• ISWA will, taking into account existing national waste policies and regulations, facilitate the transfer of experience and knowledge between regions by encouraging national, corporate and individual members of ISWA to network and learn from each other, for example through existing Working Groups or new ad hoc Task Forces.
33
17014 ISWA White Paper.indd 34 26/11/09 20:46:08
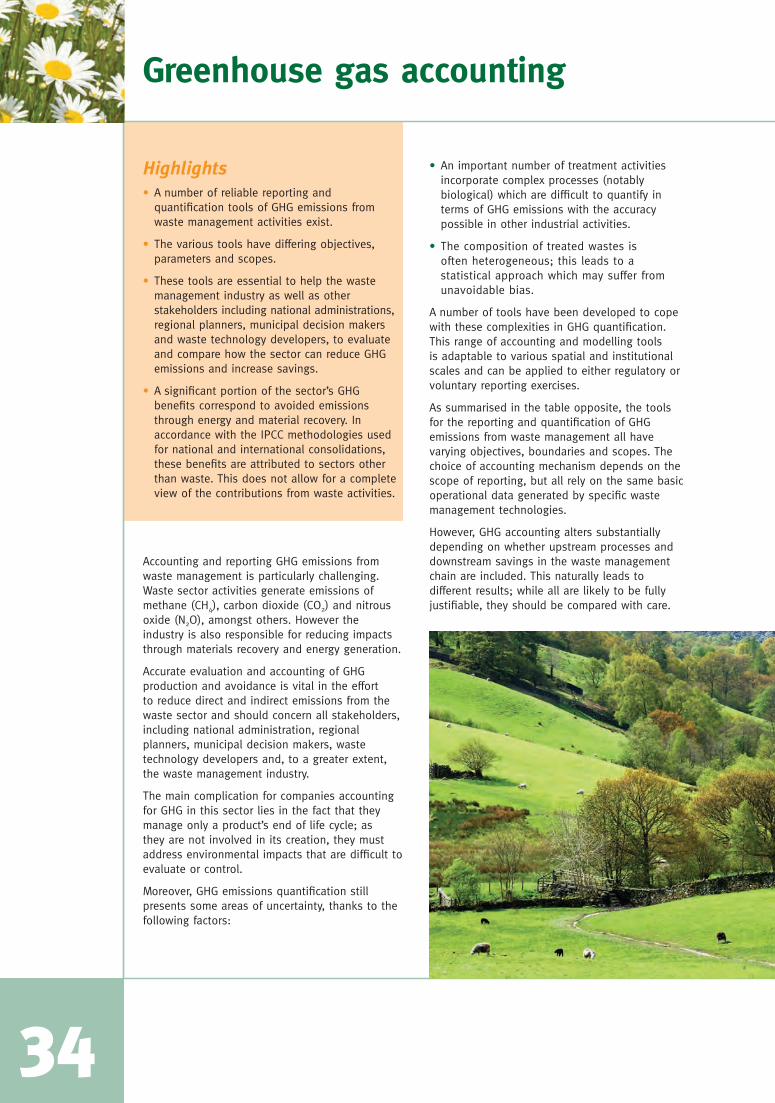
12
Highlights• A number of reliable reporting and
quantification tools of GHG emissions from waste management activities exist.
• The various tools have differing objectives, parameters and scopes.
• These tools are essential to help the waste management industry as well as other stakeholders including national administrations, regional planners, municipal decision makers and waste technology developers, to evaluate and compare how the sector can reduce GHG emissions and increase savings.
• A significant portion of the sector’s GHG benefits correspond to avoided emissions through energy and material recovery. In accordance with the IPCC methodologies used for national and international consolidations, these benefits are attributed to sectors other than waste. This does not allow for a complete view of the contributions from waste activities.
Accounting and reporting GHG emissions from waste management is particularly challenging. Waste sector activities generate emissions of methane (CH4), carbon dioxide (CO2) and nitrous oxide (N2O), amongst others. However the industry is also responsible for reducing impacts through materials recovery and energy generation.
Accurate evaluation and accounting of GHG production and avoidance is vital in the effort to reduce direct and indirect emissions from the waste sector and should concern all stakeholders, including national administration, regional planners, municipal decision makers, waste technology developers and, to a greater extent, the waste management industry.
The main complication for companies accounting for GHG in this sector lies in the fact that they manage only a product’s end of life cycle; as they are not involved in its creation, they must address environmental impacts that are difficult to evaluate or control.
Moreover, GHG emissions quantification still presents some areas of uncertainty, thanks to the following factors:
• An important number of treatment activities incorporate complex processes (notably biological) which are difficult to quantify in terms of GHG emissions with the accuracy possible in other industrial activities.
• The composition of treated wastes is often heterogeneous; this leads to a statistical approach which may suffer from unavoidable bias.
A number of tools have been developed to cope with these complexities in GHG quantification. This range of accounting and modelling tools is adaptable to various spatial and institutional scales and can be applied to either regulatory or voluntary reporting exercises.
As summarised in the table opposite, the tools for the reporting and quantification of GHG emissions from waste management all have varying objectives, boundaries and scopes. The choice of accounting mechanism depends on the scope of reporting, but all rely on the same basic operational data generated by specific waste management technologies.
However, GHG accounting alters substantially depending on whether upstream processes and downstream savings in the waste management chain are included. This naturally leads to different results; while all are likely to be fully justifiable, they should be compared with care.
34
Greenhouse gas accounting
17014 ISWA White Paper.indd 35 26/11/09 20:46:14
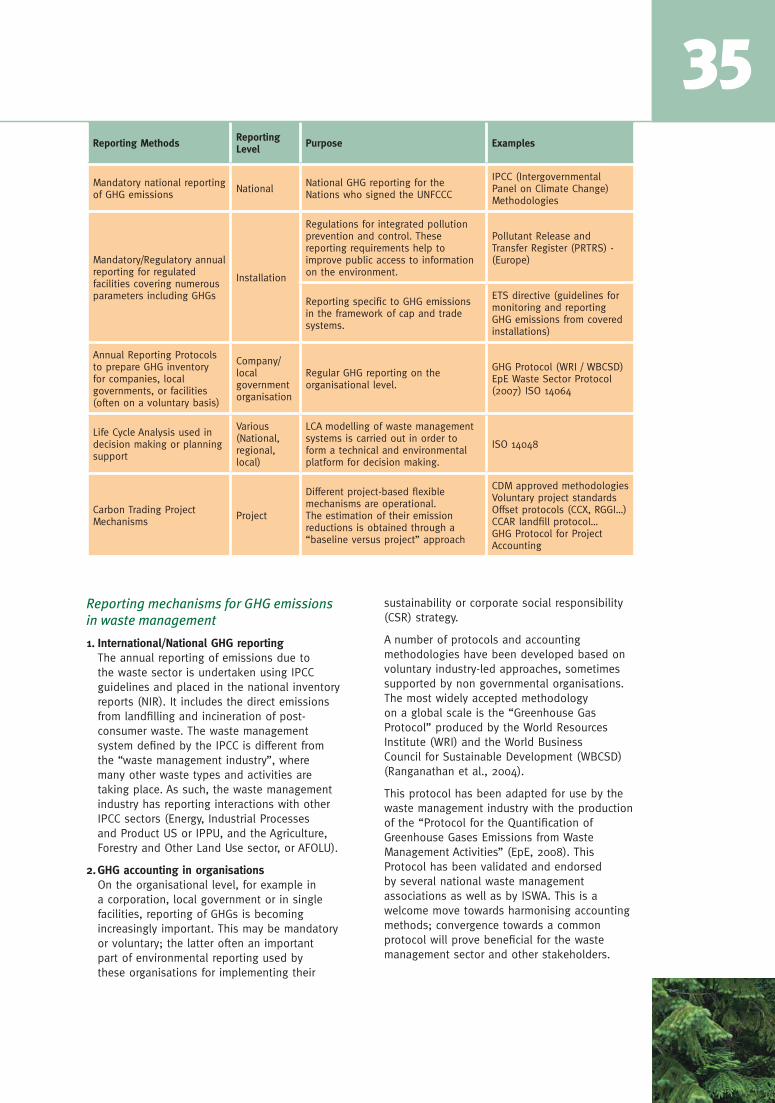
Reporting Methods Reporting Level Purpose Examples
Mandatory national reporting of GHG emissions National National GHG reporting for the
Nations who signed the UNFCCC
IPCC (Intergovernmental Panel on Climate Change) Methodologies
Mandatory/Regulatory annual reporting for regulated facilities covering numerous parameters including GHGs
Installation
Regulations for integrated pollution prevention and control. These reporting requirements help to improve public access to information on the environment.
Pollutant Release and Transfer Register (PRTRS) - (Europe)
Reporting specific to GHG emissions in the framework of cap and trade systems.
ETS directive (guidelines for monitoring and reporting GHG emissions from covered installations)
Annual Reporting Protocols to prepare GHG inventory for companies, local governments, or facilities (often on a voluntary basis)
Company/local government organisation
Regular GHG reporting on the organisational level.
GHG Protocol (WRI / WBCSD) EpE Waste Sector Protocol (2007) ISO 14064
Life Cycle Analysis used in decision making or planning support
Various (National, regional, local)
LCA modelling of waste management systems is carried out in order to form a technical and environmental platform for decision making.
ISO 14048
Carbon Trading Project Mechanisms Project
Different project-based flexible mechanisms are operational. The estimation of their emission reductions is obtained through a “baseline versus project” approach
CDM approved methodologies Voluntary project standards Offset protocols (CCX, RGGI…) CCAR landfill protocol… GHG Protocol for Project Accounting
13
Reporting mechanisms for GHG emissions in waste management
1. International/National GHG reporting The annual reporting of emissions due to the waste sector is undertaken using IPCC guidelines and placed in the national inventory reports (NIR). It includes the direct emissions from landfilling and incineration of post-consumer waste. The waste management system defined by the IPCC is different from the “waste management industry”, where many other waste types and activities are taking place. As such, the waste management industry has reporting interactions with other IPCC sectors (Energy, Industrial Processes and Product US or IPPU, and the Agriculture, Forestry and Other Land Use sector, or AFOLU).
2. GHG accounting in organisations On the organisational level, for example in a corporation, local government or in single facilities, reporting of GHGs is becoming increasingly important. This may be mandatory or voluntary; the latter often an important part of environmental reporting used by these organisations for implementing their
sustainability or corporate social responsibility (CSR) strategy.
A number of protocols and accounting methodologies have been developed based on voluntary industry-led approaches, sometimes supported by non governmental organisations. The most widely accepted methodology on a global scale is the “Greenhouse Gas Protocol” produced by the World Resources Institute (WRI) and the World Business Council for Sustainable Development (WBCSD) (Ranganathan et al., 2004).
This protocol has been adapted for use by the waste management industry with the production of the “Protocol for the Quantification of Greenhouse Gases Emissions from Waste Management Activities” (EpE, 2008). This Protocol has been validated and endorsed by several national waste management associations as well as by ISWA. This is a welcome move towards harmonising accounting methods; convergence towards a common protocol will prove beneficial for the waste management sector and other stakeholders.
35
17014 ISWA White Paper.indd 36 26/11/09 20:46:17
12
It allows for a consistent approach to calculating and reporting impacts and actions to reduce GHG emissions, it allows comparisons of reported information throughout the sector and it permits businesses to manage GHG risks and identify reduction opportunities.
Standardisation procedures have also been developed to provide support to organisations wishing to report their GHG emissions, within the ISO 14064 series (ISO, 2006a). The standard, however, only provides a methodology for GHG reporting but does not provide any calculation or accounting methods.
3. Life cycle assessment Life cycle assessment (LCA) has been applied to waste management systems for a number of years, in order to form a technical and environmental platform for decision making on subjects such as:
• Introduction of new policies at a national level,
• Choice of systems and technology at the municipality level,
• Improvement of specific technologies at the plant level.
LCA allows for a global environmental assessment by examining more than ten different impacts. This methodology integrates the environmental aspects and impacts of direct and indirect emissions and offsets (whether they occur upstream or downstream of the waste management system).
4. Trading schemes and offset project methodologies GHG emission trading schemes have now been established across the world. Initially, most were based on voluntary mechanisms, with the exception of the European Emission Trading Scheme (Directive 2003/87/EC); the world’s largest compliance Cap and Trade system.
As described in the CDM section page 20, project-based flexible mechanisms regulated under the Kyoto Protocol, namely the Clean Development Mechanism (CDM) and the Joint Implementation (JI) are already operational. The estimation of emission reductions that will be gained through their implementation relies on a “baseline versus project” approach. The emissions that would have occurred in the baseline scenario, i.e. without project, are compared to the emissions that will occur in the project scenario. Specific quantification
guidelines are established for each CDM/JI project type. In addition, voluntary trading markets (as opposed to regulatory, such as the EU-ETS) have emerged (e.g. Chicago Climate Exchange (CCX) and Australia’s Greenhouse FriendlyTM Initiative). The schemes feature differences in reporting and compliance, making harmonisation between them challenging.
Key issues in GHG accounting for the waste management sector
A recurring concern for those tasked with GHG accounting for the waste sector, is the fact that boundaries set by IPCC methodologies do not allow for a complete view of waste activities. Instead, the IPCC waste sector identifies direct emission, but takes no account of the potential indirect environmental benefits associated with downstream waste management, which are reported under other IPCC sectors.
An interesting example is the reporting of GHG emissions from waste incineration. If post-consumer waste is incinerated without energy recovery, GHG emissions are reported under the IPCC waste sector. However, for waste incinerated with energy recovery, generated emissions are accounted under the IPCC energy sector.
Another illuminating example is the case of recycling: the waste management system consumes energy in order to collect and sort glass for recycling, but the savings the operation generates are reported in the glass industry, because the production of glass from cullet is less energy intensive than using virgin materials.
And yet, in view of the political agenda on the mitigation of climate change, it is important to map current GHG contributions, emissions as well as savings, from waste management, and to set reasonable goals for future contributions by the waste management industry. An additional method should be developed that would allow capture of the complete scope of waste activities, properly recognising the sector’s important GHG reduction and avoidance potential.
Key factors in GHG accounting for waste management include waste type and composition, the time period covered, the GHGs accounted for and their assigned GWP and the boundaries with other sectors; particularly the energy sector. Other parameters, such as the quality of standardised emissions factors, which are often used when
36
Greenhouse gas accounting
17014 ISWA White Paper.indd 37 26/11/09 20:46:18
specific data is lacking, should also be reported in detail. Efforts should be made to increase the reliability and the completeness of data on international and national levels.
It is in the interest of the waste management industry that the technical basis for GHG accounting is transparent and correct in order to retain confidence in the results. This is particularly important because GHG issues are major factors in many decisions at national as well as local level.
There have been significant advances in accounting methods for waste activities in recent years. However, efforts must be redoubled in order to reduce the uncertainty of emission estimation methods at various levels and to harmonise methods. Areas requiring continued research include:
• Landfilling
– Landfill gas (LFG) production (first order decay) modelling
– Oxidation rates through soil cover
– LFG capture rates
– Carbon sequestration in landfills
– Direct measurement methods to quantify fugitive emissions
• Composting
– N2O, CH4 emissions
– Carbon binding in soil
– Avoided emissions for replacing fertiliser and peat soil conditioners
• Incineration
– Methods to determine biogenic waste content
– N2O emissions from combustion processes
– Avoided emission factors from bottom ash and metals recycling
• Recycling
– Avoided emission factors by material type
– Geographic / boundary issues for material flow and recovery
Recommendations• ISWA recommends that the sector continues
its efforts to harmonise the accounting methodologies, protocols, and associated emission factors used to quantify and report GHG emissions.
• In support of this aim, ISWA has endorsed the protocol entitled, “Protocol for the Quantification of Greenhouse Gases Emissions from Waste Management Activities” (EpE, 2008) as a common tool for annual GHG reporting.
• Although the IPCC guidelines are not likely to change in the near future, ISWA recommends that an additional method is developed that would allow the capture of the complete scope of waste activities, giving better recognition of the sector’s important GHG reduction and avoidance potential.
ISWA commitments • ISWA commits to supporting harmonisation of
GHG accounting approaches, methodologies and protocols applied to waste activities.
• ISWA will communicate and provide a forum for exchange on the subject of GHG accounting in the sector amongst its network of members, partners and experts.
37
17014 ISWA White Paper.indd 38 26/11/09 20:46:22
12
• ACESA (2009), American Clean Energy and Security Act of 2009. http://energycommerce.house.gov/Press_111/20090609/hr2454_committeereport.pdf
• ARRA (2009), American Recovery and Reinvestment Act of 2009. http://en.wikipedia.org/wiki/American_Recovery_and_Reinvestment_Act_of_2009
• Bogner, J., Pipatti, R., Hashimoto, S., Diaz, C., Mareckova, K., Diaz, L., Kjeldsen, P., Monni, S. & Faaij, A. (2008) Mitigation of global greenhouse gas emissions from waste: conclusions and strategies from the Intergovernmental Panel on Climate Change (IPCC) Fourth Assessment Report. Working Group III (Mitigation). Waste Management & Research, 26.
• CD4CDM: Capacity Developement for the Clean Development Mechanism - CDM and JI pipelines: http://cdmpipeline.org/
• Boldrin, A., Andersen, J.K., Møller, J., Favoino, E. and Christensen, T. H. (2009) Composting and compost utilization: Accounting of greenhouse gases and global warming contributions. Waste Management & Research, 27, 871-884.
• Christensen, T. H., Simion, F., Tonini, D. and Møller, J. (2009b) Global warming factors modeled for 40 generic municipal waste management scenarios. Waste Management & Research, 27, 871-884
• Dornburg, V. and Faaij, A., (2006) Optimising waste treatment systems. Part B: Analyses and scenarios for The Netherlands. Resources Conservation & Recycling, 48, pp. 227-248.
• EEA (2008) Better management of municipal waste will reduce greenhouse gas emissions. European Environment Agency, Briefing 1/2008, Copenhagen, Denmark
• EEA (2009) Diverting waste from landfill - effectiveness of waste management policies in the European Union, European Environment Agency
• IEA (2006) World Consumption of Primary Energy by Energy Type and Selected Country Groups. Energy Information Administration. U.S. Dept. of Energy, July 2006.
• EIPPC Bureau (2006) Reference document on the best available techniques for waste incineration (BREF), integrated pollution prevention and control. European IPPC, Seville, Spain, 602 pp. http://eippcb.jrc.es
• EpE (2008) Protocol for the Quantification of Greenhouse Gases Emissions from Waste Management Activities. Version 3. Entreprises pour l’Environnemnent, Nanterre, France.
• ETC/SCP (2009) EU as Recycling Society- Present recycling levels of municipal waste and construction and demolition waste in the EU, Working paper 2/2009. European Topic Centre on Sustainable Consumption and Production, Copenhagen, Denmark.
• ETC/SCP (2009a) The CO2 emissions are based on the green house gas model and data for municipal waste developed by the European Topic Centre on Consumption and Production, cf. a forthcoming Working Paper, which will be released in the end of 2009: Sustainable Projections of municipal waste management and greenhouse gases. Topic Center: Højbro Plads 4, DK 1200 Copenhagen K, Denmark, http://scp.eionet.europa.eu
• EU (1975) Council Directive 75/442/EC on waste
• EU (1999) Council Directive 1993/31/EC of 26. April on the landfill of waste
• Eurostat (2009) Eurostat’s Environmental Data Centre on Waste-Member States reporting according to the Packaging, ELV and WEEE Directives.
• Favoino, E. & Hogg, D. (2008) The potential role of compost in reducing greenhouse gases. Waste Management & Research, 26.
• IEA (2009) IEA Statistics, http://www.iea.org/Textbase/stats/index.asp.
• IPPC (2007, I) Climate Change 2007 – The Physical Science Basis, Contribution of Working Group I to the Forth Assessment Report of the Intergovernmental Panel on Climate Change, Cambridge University Press
• IPCC (2007, III) Bogner, J., M. Abdelrafie Ahmed, C. Diaz, A. Faaij, Q. Gao, S. Hashimoto, K. Mareckova, R. Pipatti, T. Zhang, 2007, Chapter 10. Waste Management, in Climate Change 2007: Mitigation. Contribution of Working Group III to the Fourth Assessment Report of the Intergovernmental Panel on Climate Change [B. Metz, O.R. Davidson, P.R. Bosch, R. Dave, L.A. Meyer, eds., Cambridge University Press, Cambridge, UK and New York, NY USA].
• ISO (2006a) ISO 14064: 2006. Greenhouse gases -- Part 1: Specification with guidance at the organization level for quantification and reporting of greenhouse gas emissions and removals.
• ISO (2006b) ISO 14040: 2006. Environmental management – Life cycle assessment – Principles and framework.
• IWSA (2007). Integrated Waste Services Association, Washington DC. http://www.wte.org.
• Khan, M.Z.A. and Abu-Ghararath, A.H. (1991) New approach for estimating energy content of municipal solid waste. Journal of Environmental Engineering, 117, 376-380.
• Monni, S., Pipatti, R., Lehtilä, A., Savolainen, I. and Syri, S. (2006) Global climate change mitigation scenarios for solid waste management. Espoo, Technical Research Centre of Finland, VTT Publications, 603 pp.
• Prognos (2008) Resource savings and CO2 reduction potential in waste management in Europe and the possible contribution to the CO2 reduction target in 2020. PROGNOS and IFEU, October 2008
• Skinner, J.H. (2007): The Changing Political Climate in North America, Energy Warming and Waste. Proceedings of the International Solid Waste Association World Congress, September 24-26, 2007, Amsterdam, Netherlands,
• Skinner, J.H. (2009): New Directions for Greenhouse Gas Controls, Renewable Energy and Solid Waste Management in North America. Proceedings of the International Solid Waste Association World Congress, October 12-14, 2009. Lisbon, Portugal.
• Themelis, N. (2003) An overview of the global waste-to-energy industry. Waste Management World, 2003-2004 Review Issue July-August 2003, pp. 40-47.
• UNFCCC http://unfccc.int/2860.php.
• UNFCCC CDM section: http://cdm.unfccc.int/index.html
• U.S. EPA (2006a). Municipal Solid Waste in the US, 2005 Facts and Figures. Office of Solid Waste (5306P) EPA530-R-06-011 United States Environmental Protection Agency, Washington, DC. U. S. A. October 18, 2006.
38
References
17014 ISWA White Paper.indd 39 26/11/09 20:46:23
1339
ACESA American Clean Energy and Security ActAD Anaerobic digestionAFOLU Agriculture, Forestry and Other Land UseARRA American Recovery and Reinvestment ActC CarbonCCAR California Climate Action RegistryCCX Chicago Climate ExchangeCDM Clean development mechanismCDM EB Clean development mechanism executive
boardCER Certified Emission ReductionsCH4 MethaneCNG Compressed natural gasCO2 Carbon dioxideCO2-eq CO2 equivalent, based on the GWP
reference from the IPCCCOP15 15th Conference of the parties CSR Corporate social responsibilityDOE Designated operational entitiesEASEWASTE Environmental Assessment of Solid Waste
Systems and TechnologiesEEA European Environment AgencyEIPPC European integrated pollution prevention
controlEpE Entreprises pour l’EnvironnementETC/SCP The European Topic Centre on Sustainable
Consumption and ProductionETS Emission Trading SystemEU European UnionGHG: Greenhouse gasIEA International Energy AgencyIPCC Intergovernmental Panel on Climate
ChangeIPPC Integrated Pollution Prevention Control
IPPU Industrial Processes and ProductISO International Organization for
StandardizationISWA International Solid Waste AssociationJI Joint ImplementationLCA Life cycle assessmentLDC Least developed countriesLFG Landfill gasMBT Mechanical Biological TreatmentMSW Municipal solid wasteMWM National Waste MinimizationN2O Nitrous OxideNGO: Non Governmental OrganisationsNIR National inventory reportsNSP National Strategic PlanPAS 2050 Publicly Available Specification 2050PDD Project design documentPoA Programme of ActivitiesPRTRS Pollutant Release and Transfer RegisterRDF Refuse derived fuelRGGI Regional Greenhouse Gas InitiativeSWMB Solid Waste and Public Cleansing
Management BillU.S. EPA U.S. Environmental Protection AgencyUNFCCC United Nations Framework Convention on
Climate ChangeWARM WAste Reduction ModelWBCSD World Business Council for Sustainable
DevelopmentWM&R Waste Management and Research JournalWRATE Waste and Resources Assessment Tool for
the EnvironmentWRI World Resources InstituteWWS World waste surve
Acronyms
• U.S. EPA (2006b). Solid Waste Management and Greenhouse Gases, a Life-cycle Assessment of Emissions and Sinks. 3rd Edition United States Environmental Protection Agency, Washington, DC. U. S. A.
• U.S. EPA (2008). Municipal Solid Waste in the US, 2007 Facts and Figures. Office of Solid Waste (5306P) EPA530-R-08-010 United States Environmental Protection Agency, Washington, DC. November 2008.
• U.S. EPA (2009). Mandatory Greenhouse Gas Reporting Rule. www.epa.gov/climatechange/emissions/ghgrulemaking.html.
• WM&R (2009 a) Fundamentals in GHG accounting: concepts and mechanisms, Waste Management & Research, volume 27, issue 8, all pages
• WM&R (2009 b) Applied GHG accounting: methodologies and cases, Waste Management & Research, volume 27, issue 9, all pages
• WWS (2009) From Waste to Resource – World Waste survey. An abstract of “2006 World Waste Survey”, Elisabeth Lacoste & Philippe Chalmin, Brookings Inst Pr, ISBN10 2717853588
• Web ref. 1: www.ens.dk/da-DK/Info/TalOgKort/Statistik_og_noegletal/Noegletal/Internationale_noegletal/Documents/nøgletal%20-%20internationale%20-%202007.xls - global waste derived energy projections
• Web ref. 2: www.epa.gov/lmop/accomplish.html
• Web ref 3: cdm.unfccc.int/Issuance/cers_iss.html
ISWA Task Force on Waste and Climate• Gary Crawford, Veolia, Paris, France
• Christian Fischer, European Topic Centre on Sustainable Consumption and Production, Copenhagen, Denmark
• Jens Aage Hansen, Aalborg University, Denmark
• Antonis Mavropoulos, EPEM, Athens, Greece
Workshops and meetings during 2008 and 2009 with active participation from practice and academia form the background for this White Paper. Special thanks to PhD students and faculty at the Technical University of Denmark, in particular Thomas H. Christensen and Emmanuel Gentil, and to Simon Aumonier, UK and Jean Bogner, USA. They all offered professional input, inspiration and opinion. Special input to the White Paper was provided by John Skinner, USA and P. Agamuthu from Malaysia. ISWA working groups have contributed at meetings and in reviewing the White Paper.
17014 ISWA White Paper.indd 40 26/11/09 20:46:25
ISWA General Secretariat 123 Mariahilfer Strasse, 3rd floor 1060 Vienna Austria
Tel: +43 (159) 999 8038 E-mail: [email protected] www.iswa.org
Copyright: ISWA, Vienna, Austria
Technical editing: Carrie Tomlinson, Weave Communications Ltd
Design and artwork: IAS b2b Marketing
Printing: AKA Print, Aarhus, Denmark
17014 ISWA White Paper.indd 1 26/11/09 20:44:16